Philosophy
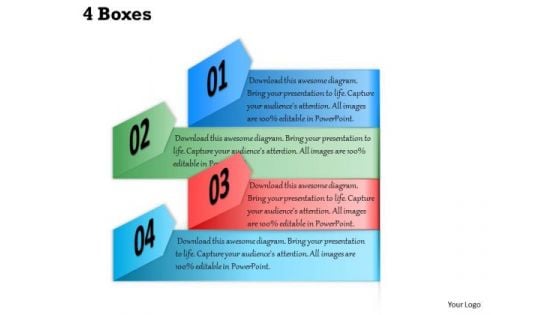
4 Boxes PowerPoint Presentation Template
Get The Domestics Right With Our 4 boxes PowerPoint Presentation Template Powerpoint Templates. Create The Base For Thoughts To Grow. Do Away With Dogmatic Approaches. Establish The Value Of Reason With Our Sales Plan Powerpoint Templates.
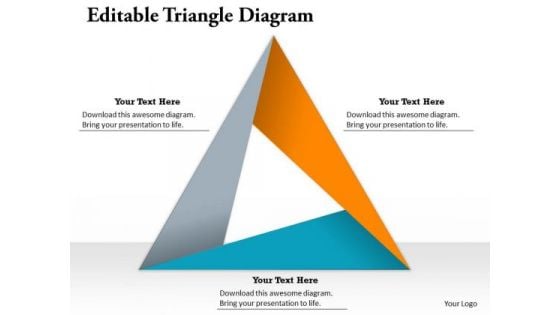
Editable Triangle Diagram PowerPoint Presentation Template
Double Your Chances With Our Editable Triangle Diagram PowerPoint Presentation Template Powerpoint Templates. The Value Of Your Thoughts Will Increase Two-Fold. Charm The Audience With Your Thoughts. Add Our Consulting Firms Powerpoint Templates And They Will Be Dotty For You.
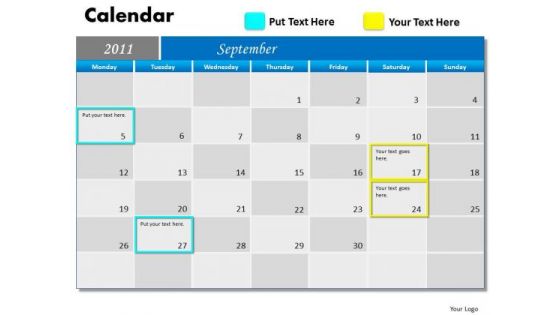
Strategy Diagram Blue Calendar 2011 Mba Models And Frameworks
Get The Domestics Right With Our Strategy_Diagram_Blue_Calendar_2011_MBA_Models_And_Frameworks Powerpoint Templates. Create The Base For Thoughts To Grow. Do Away With Dogmatic Approaches. Establish The Value Of Reason With Our Strategy_Diagram_Blue_Calendar_2011_MBA_Models_And_Frameworks Powerpoint Templates.
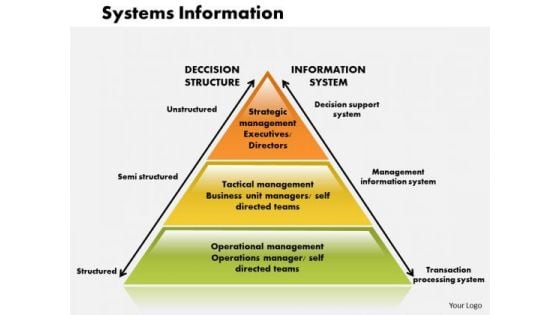
Business Diagram Systems Information PowerPoint Ppt Presentation
Get The Domestics Right With Our Business Diagram Systems Information PowerPoint PPT Presentation Powerpoint Templates. Create The Base For Thoughts To Grow. Do Away With Dogmatic Approaches. Establish The Value Of Reason With Our Business Powerpoint Templates.
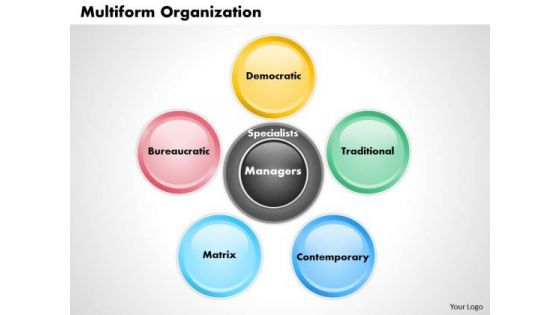
Business Diagram Multiform Organization PowerPoint Ppt Presentation
Get The Domestics Right With Our Business Diagram Multiform Organization PowerPoint PPT Presentation Powerpoint Templates. Create The Base For Thoughts To Grow. Do Away With Dogmatic Approaches. Establish The Value Of Reason With Our Business Powerpoint Templates.
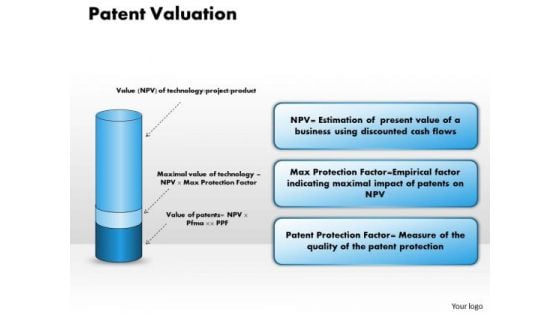
Business Diagram Patent Valuation PowerPoint Ppt Presentation
Double Your Chances With Our Business Diagram Patent Valuation PowerPoint PPT Presentation PowerPoint Templates. The Value Of Your Thoughts Will Increase Two-Fold. Charm The Audience With Your Thoughts. Add Our Business PowerPoint Templates And They Will Be Dotty For You.
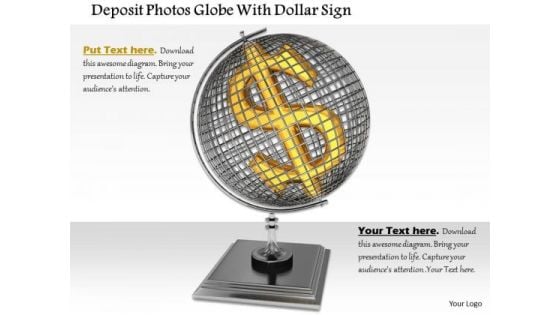
Stock Photo Dollar Symbol In Globe Over Stand PowerPoint Slide
This conceptual image is designed with 3d globe with dollar symbol. Use this professionally designed image to display value of dollar currency in world. Express your thoughts with this unique image.
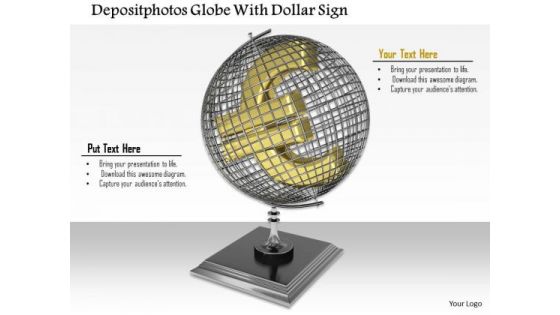
Stock Photo Euro Symbol With Globe On White Background PowerPoint Slide
This conceptual image is designed with 3d globe with euro symbol. Use this professionally designed image to display euro currency value in world. Express your thoughts with this unique image.
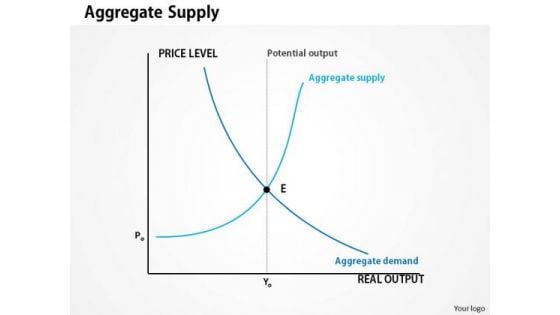
Business Framework Aggregate Supply PowerPoint Presentation
This diagram displays graph of aggregate supply. Aggregate supply is the total value of the goods and services produced. Use this diagram to present information in the visual manner.
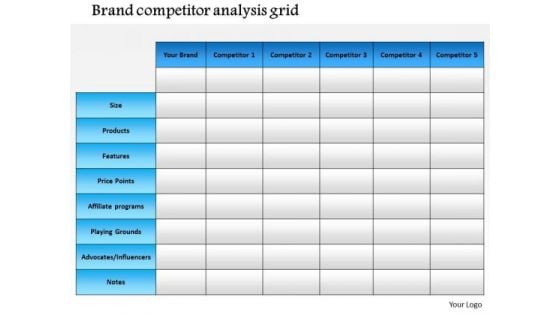
Business Framework Brand Competitor Analysis Grid PowerPoint Presentation
This power point diagram slide has been crafted with graphic of grid. This grid is designed for brand competition analysis. Use this slide for your brand value representation in any business presentations.
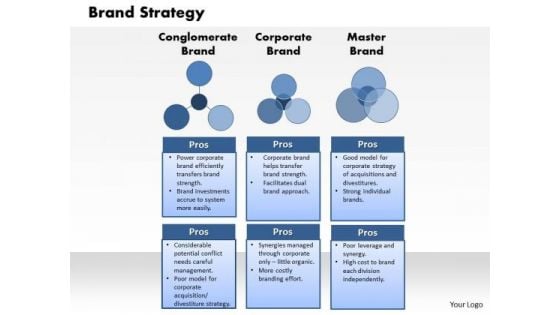
Business Framework Brand Strategy PowerPoint Presentation
This power point diagram has been crafted with graphic of Venn diagram and three value tables for brand strategy. Use this graphic slide for brand related topics in any business presentations.

Business Framework Connecting Technical Capabilities Through Open Source
This image slide displays connecting technical capabilities through open source graphic. Use this image to express views on capabilities of technology, science, social values and business in your presentation. This image slide will enhance the quality of your presentations.
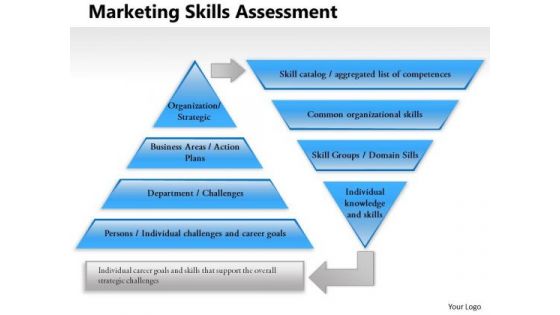
Business Framework Marketing Skills Assessment PowerPoint Presentation
Explain the value of marketing assessment techniques in any marketing process with this business framework PPT. this PPT contains the graphic of two triangles with opposite directions. Use this PPT for marketing presentations and get good remarks.
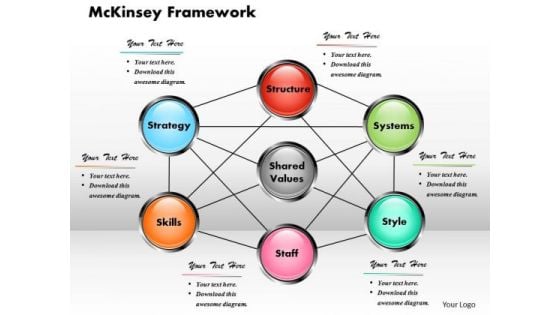
Business Framework Mckinsey Framework Template PowerPoint Presentation
Explain the importance of McKinsey Framework in any marketing presentation with this business framework PowerPoint Template. This PPT contains the 7-s framework for marketing. Download this value based 7-S McKinsey Framework and build best presentation for your viewers
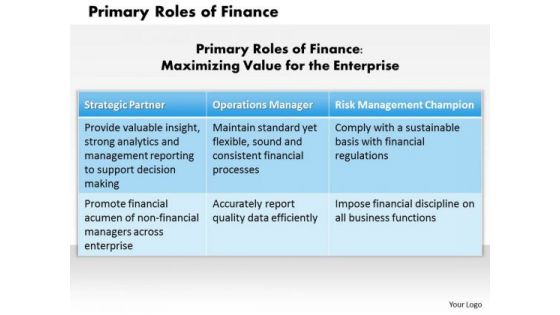
Business Framework Primary Roles Of Finance PowerPoint Presentation
This image slide displays primary roles of finance business framework. Use this image slide in business and marketing presentations to express views on strategies to maximize value of enterprise. Create professional presentations using this image slide.
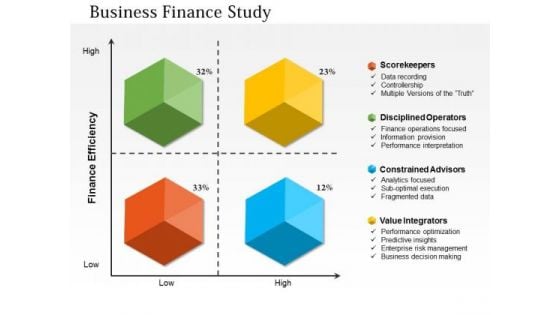
Business Diagram Business Finance Study PowerPoint Ppt Presentation
Our above slide displays business finance study diagram. It contains x-y graph of finance efficiency further divided into four sections. This diagram reflects finance efficiency depends on storekeepers, disciplined operators, constrained advisors and value integrators.
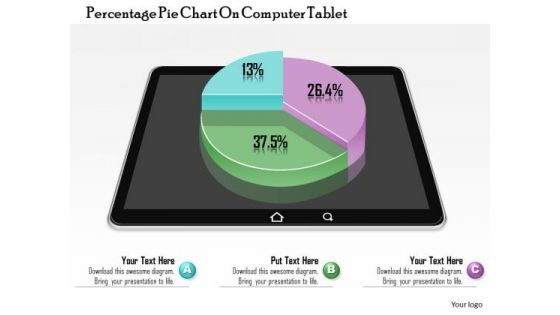
Business Diagram Percentage Pie Chart On Computer Tablet Presentation Slide Template
This business diagram power point template has been designed with graphic of pie chart. This pie chart contains the various percentage values for business result analysis. Use this pie chart for your business result display related presentations.
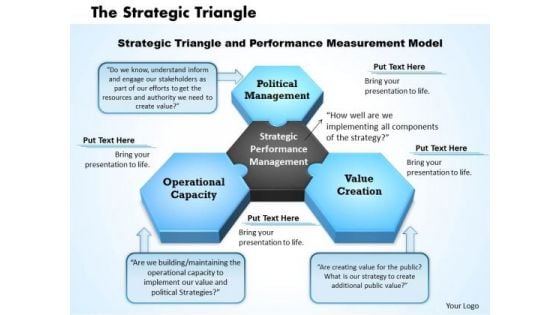
Business Framework The Strategic Triangle PowerPoint Presentation
This business framework PPT diagram has been crafted with graphic of triangle made with text boxes. This PPT contains the concept of strategic planning for operational capacity. Display value creation for performance in any presentation with this exclusive diagram template.
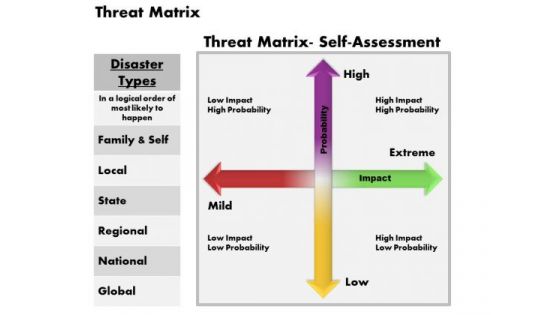
Business Framework Threat Matrix PowerPoint Presentation
A four dimensional matrix has been used to design this power point diagram template. This PPT diagram contains the threat matrix. Display multiple values in your business presentation by using this PPT.
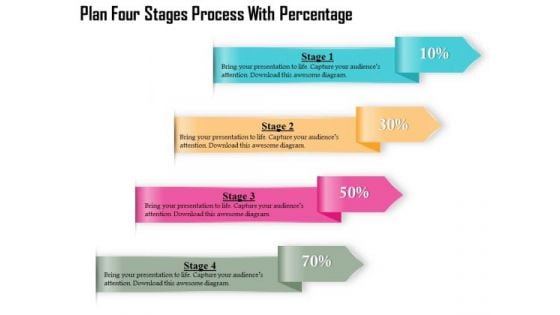
Business Diagram Four Stages Process With Percentage Presentation Template
Four multicolored tags in vertical order has been used to decorate this business diagram. This diagram contains the concept of financial data display with percent values. This diagram can be used for management and finance related presentations.

Business Diagram Three Stages Process Percentage Presentation Template
Three multicolored tags in vertical order has been used to decorate this business diagram. This diagram contains the concept of financial data display with percent values. This diagram can be used for management and finance related presentations.
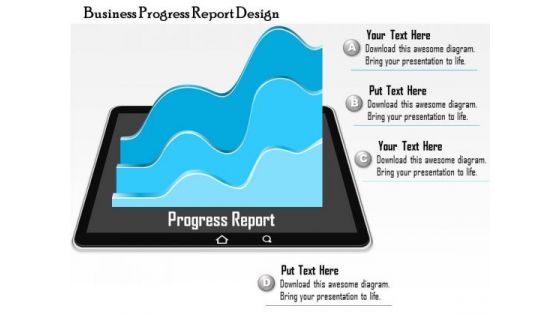
Business Diagram Business Progress Report Design Presentation Template
Come forth with the plans you have so carefully laid out. Use this business consulting diagram to inject values into your group and see them bond to achieve success. Excite your audience with the brilliance of your thoughts

Stock Photo Globe On Dollars And Key PowerPoint Slide
This amazing image has been designed with globe on dollar bills with silver key. This conceptual image slide may be used to display value of dollar around the world. Accelerate the impact of your ideas using this image.
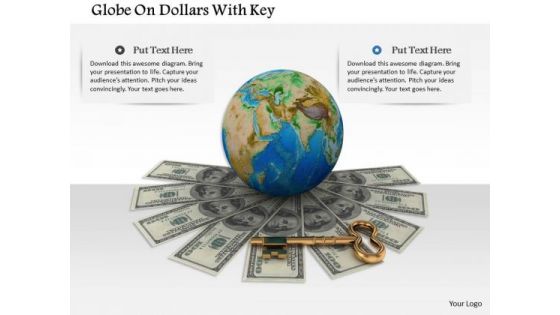
Stock Photo Globe On Dollars With Key PowerPoint Slide
This professional image slide has been designed with globe on dollar bills with golden key. This conceptual image may be used to display value of dollar around the world. Accelerate the impact of your ideas using this image.
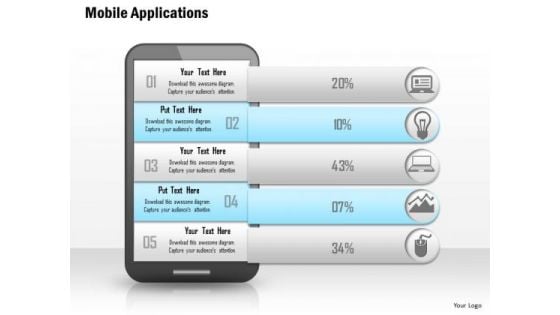
Business Diagram Mobile Applications Vector Illustration Concept Presentation Template
As mobile have become an indispensible part of our daily lives. This amazing mobile application icons will also add great value to your ideas and presentations in the fields of telecommunications, travelling, banks and financial institutions, e-Learning etc.
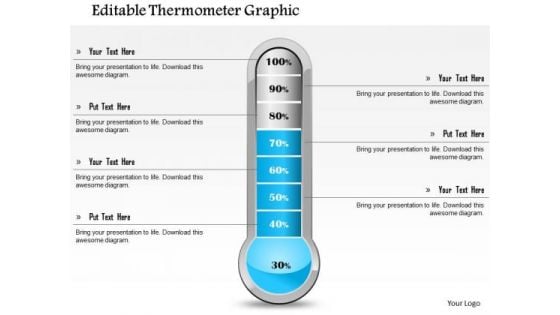
Business Framework Editable Thermometer Graphic PowerPoint Presentation
This Power Point template slide has been crafted with graphic of meter. This meter contains the max and min value. Use this PPt for your technical presentation and display your technical specifications in a graphical way.
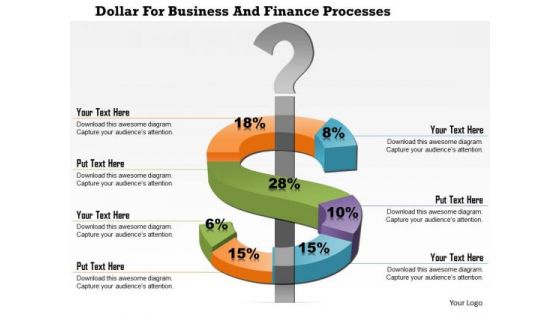
Business Diagram Dollar For Business And Finance Processes Presentation Template
This business diagram displays dollar symbol around a question mark. This diagram depicts change in dollar currency value. Use this slide to make financial and business reports and presentations.
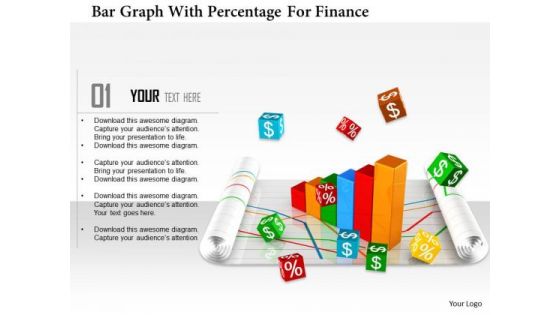
Stock Photo Bar Graph With Percentage For Finance PowerPoint Slide
This Power Point template has been designed with graphic of bar graph and percentage value. This image slide contains the concept of finance and accounting. Use this editable diagram for your business and finance related presentations.

Stock Photo Hundred Percentage Inside Lock Safety PowerPoint Slide
Concept of financial safety has been displayed in this image slide with suitable graphics. This slide has been designed with graphic of hundred percentage value and lock. Use this professional slide to make build innovative presentation on safety related topics.
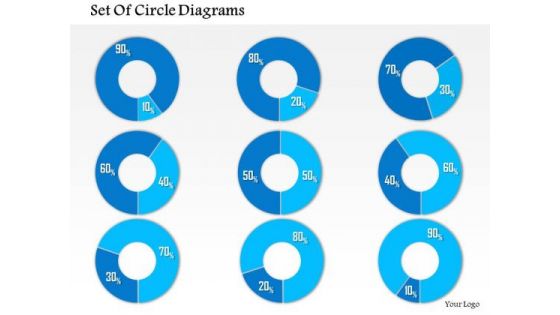
Business Framework 10 Percent To 90 Percent PowerPoint Presentation
This business diagram has been designed with graphic of multiple pie graphs. This diagram slide contains the concept of result analysis with percentage values. Use this diagram to present and compare data in an impressive manner
Business Diagram Human Icons With Bubbles And Different Icons Inside PowerPoint Slide
This diagram displays graph with percentage value growth. This business slide is suitable to present and compare business data. Use this diagram to build professional presentations for your viewers.
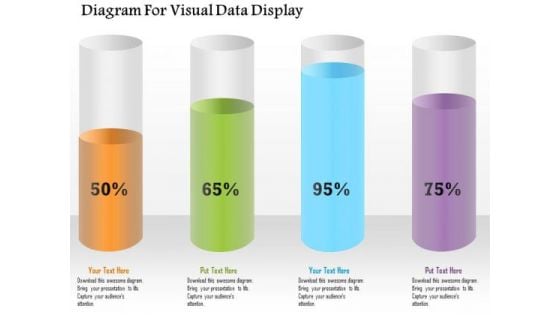
Business Diagram Diagram For Visual Data Display Presentation Template
Four colored cylindrical bars with percentage values are used to design this power point template. This diagram slide helps to display financial data analysis. Use this diagram for your business and finance related presentations.
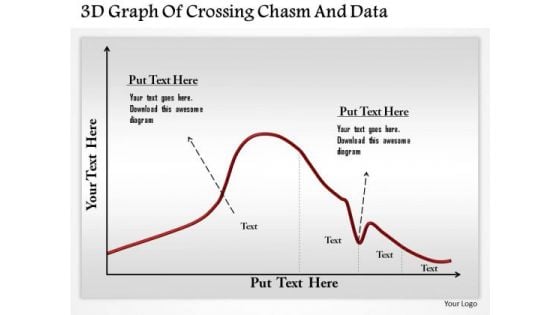
Business Diagram 3d Graph Of Crossing Chasm And Data Presentation Template
This business diagram has been designed with graphic of 3d graph. This slide contains the concept of chasm and data calculation. Use this slide to display chasm crossing condition. This business diagram adds value to your ideas.
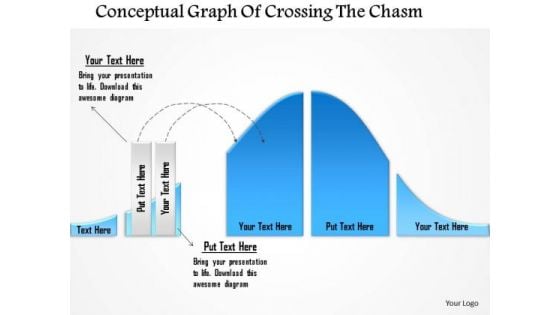
Business Diagram Conceptual Graph Of Crossing The Chasm Presentation Template
This business diagram has been designed with graphic of 3d graph. This slide contains the concept of chasm and data calculation. Use this slide to display chasm crossing condition. This business diagram adds value to your ideas.
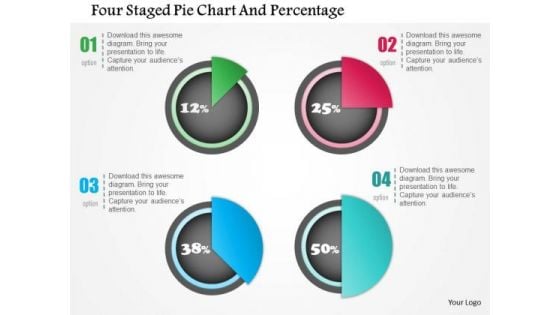
Business Diagram Four Staged Pie Chart And Percentage Presentation Template
Four staged pie chart and percentage values has been used to design this power point template. This PPT contains the concept of financial result analysis. Use this PPT for business and marketing related presentations.
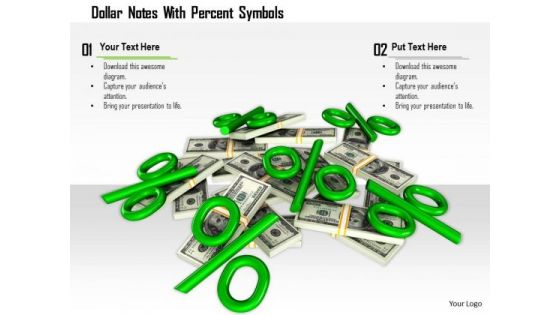
Stock Photo Dollar Notes With Percent Symbols PowerPoint Slide
Our above image displays graphics of percent symbol on dollars. This image slide is designed to depict money value. This image will help to express your views in your presentations.
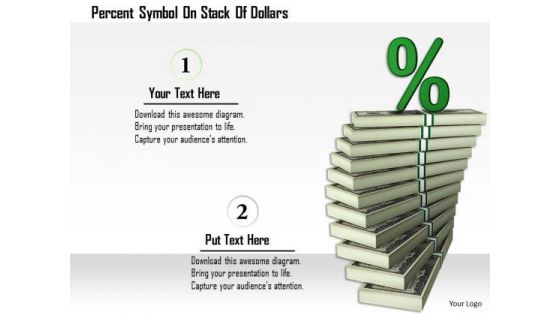
Stock Photo Percent Symbol On Stack Of Dollars PowerPoint Slide
Our above image displays graphics of percent symbol on dollars. This image slide is designed to depict money value. This image will help to express your views in your presentations.
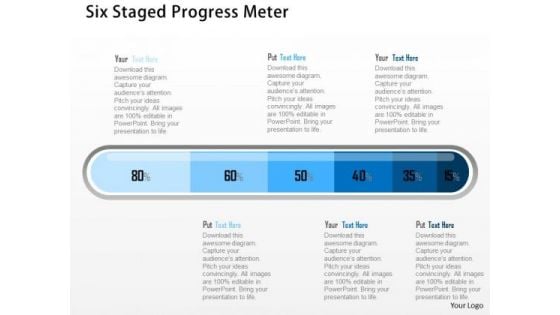
Business Diagram Six Staged Progress Meter Presentation Template
Our above business slide displays graphics of progress meter. This slide can be used as value chain example. This diagram provides an effective way of displaying information you can edit text, color, shade and style as per you need.
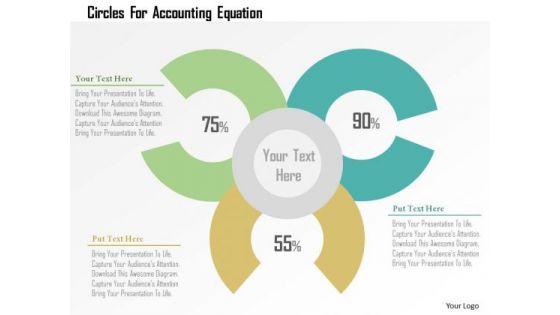
Business Diagram Circles For Accounting Equation PowerPoint Templates
Graphic of Venn diagram with percentage value has been used to design this business diagram. These circles may also be used to depict accounting equations. Use this diagram to illustrate your thoughts and experiences to your staff.
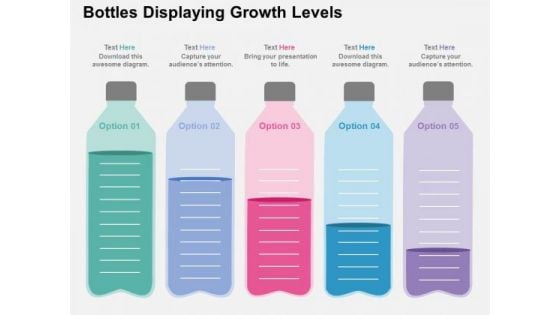
Bottles Displaying Growth Levels PowerPoint Template
The above template displays a diagram of bottles. This diagram has been professionally designed to emphasize on concept of value stream mapping. Grab centre stage with this slide. Capture the attention of your audience.
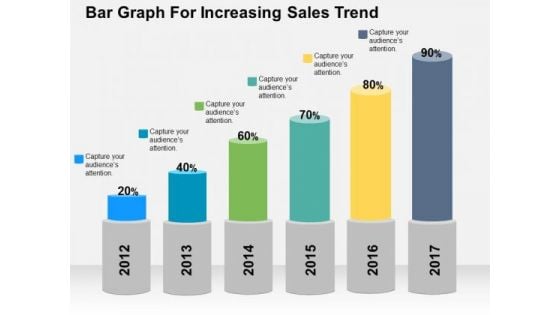
Bar Graph For Increasing Sales Trend PowerPoint Template
Deliver amazing presentations with our above template showing bar graph with percentage values. You may download this slide to depict increase in sales trends. Capture the attention of your audience using this diagram.
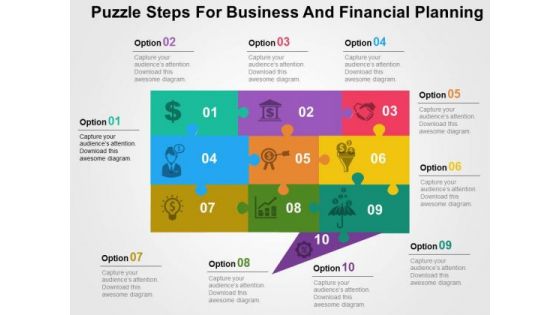
Puzzle Steps For Business And Financial Planning PowerPoint Templates
This creative slide has been designed with graphics of puzzle steps. Use this unique slide in presentations related to business and financial planning. This template adds value to your idea.
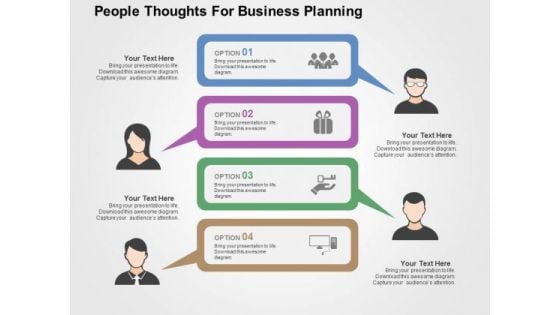
People Thoughts For Business Planning PowerPoint Templates
This creative slide has been designed with graphics of team icons. Use this unique slide in presentations related to business and financial planning. This template adds value to your idea.

Business Team Standing In Rings PowerPoint Templates
This slide contains graphics of business team standing in rings. This slide helps to portray concepts like team planning and business strategies. This PowerPoint template adds value to your presentation
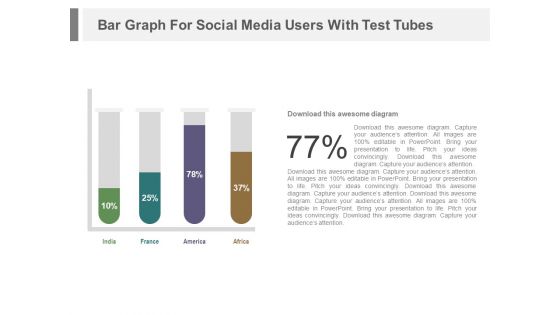
Test Tubes With Financial Data In Percentage Ratio Powerpoint Slides
Five Mountain Chart With Icons For Financial Analysis Powerpoint Slides
Our above PPT slide contains five mountains with icons and financial values. This PowerPoint template helps to exhibit financial analysis for business growth. Use this diagram to impart more clarity to subject and to create more sound impact on viewers.
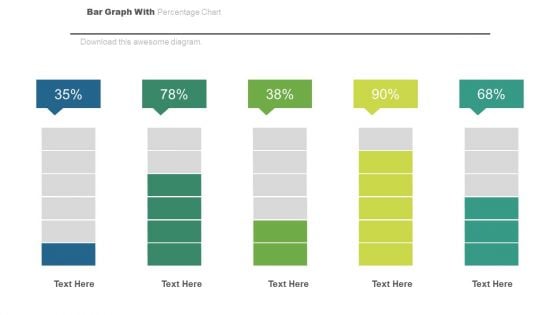
Bar Graph For Statistical Analysis Powerpoint Slides
This PowerPoint template has been designed with bar chart and percentage values. You may download this PPT slide to depict statistical analysis. Add this slide to your presentation and impress your superiors.
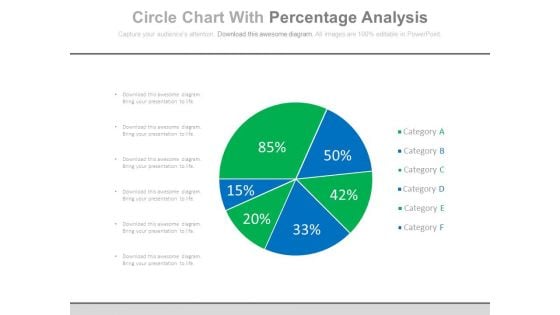
Percentage Chart For Good Marketing Strategy Powerpoint Slides
This PowerPoint template has been designed with pie chart and percentage values. The PowerPoint template has a high quality design. You can download this PowerPoint slide to make good marketing strategy and business plans.
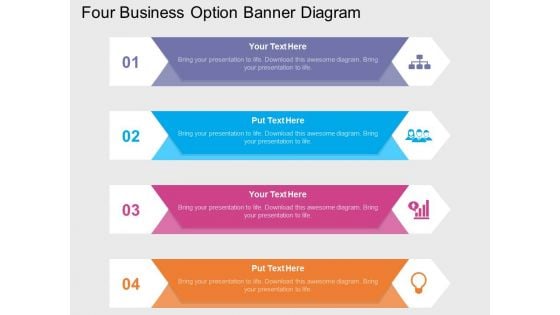
Four Business Option Banner Diagram Powerpoint Template
This business slide contains four option banners with business icons. This PPT diagram is suitable to present concept of profit growth value analysis. Visual effect of this diagram provides more clarity to the subject.
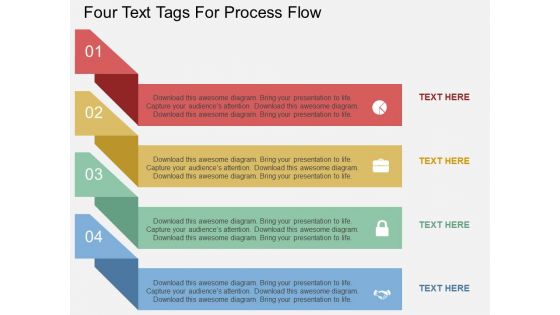
Four Text Tags For Process Flow Powerpoint Template
This PPT slide contains four text tags with business icons. This PPT diagram is suitable to present concept of profit growth value analysis. Enlighten others on the process with this innovative PowerPoint template.
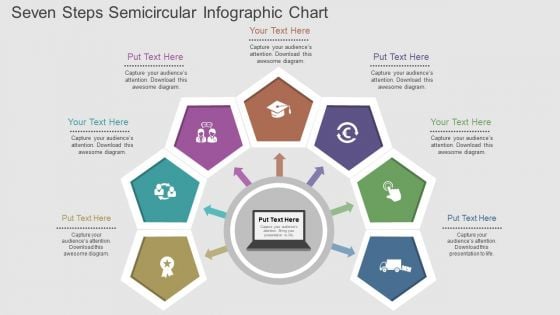
Seven Steps Semicircular Infographic Chart Powerpoint Template
This business slide contains four option banners with business icons. This PPT diagram is suitable to present concept of profit growth value analysis. Visual effect of this diagram provides more clarity to the subject.
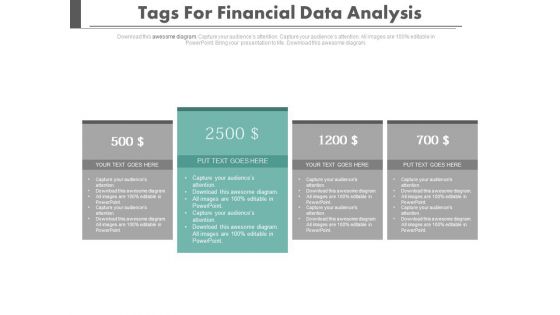
Four Tags For Financial Review And Analysis Powerpoint Slides
This PowerPoint template has been designed with four tags and financial values. This PowerPoint template helps to exhibit financial review and analysis. Use this diagram slide to build an exclusive presentation.
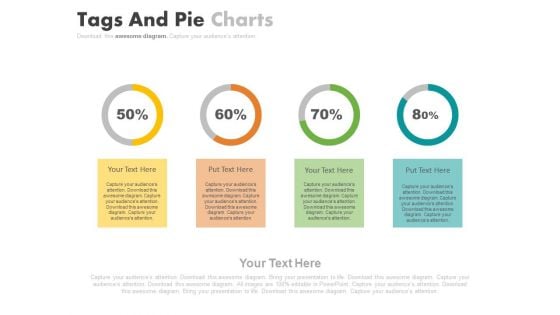
Four Steps For Financial Data Analysis Powerpoint Slides
This PowerPoint contains four circles with percentage values. Download this diagram slide to display financial data analysis. This template is editable, You can edit text, color, shade and style of this diagram as per you need.
Four Overlapping Steps With Icons Powerpoint Template
This PPT slide contains four overlapping steps with business icons. This PPT diagram is suitable to present concept of profit growth value analysis. Enlighten others on the process with this innovative PowerPoint template.
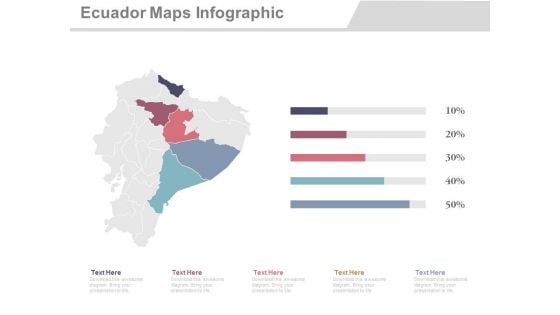
Ecuador Map With States Economic Analysis Powerpoint Slides
This PowerPoint template displays graphics of Ecuador map with different locations and percentage values. This Map template can be used in business presentations to depict economic analysis. This slide can also be used by school students for educational projects.
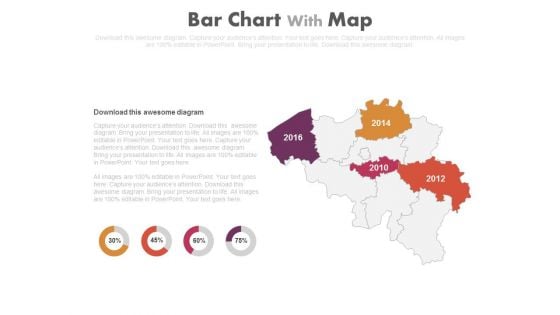
Map With Years And Percentage Charts Powerpoint Slides
This PowerPoint template displays map with years and percentage values. Our professionally designed map diagram is as an effective tool to display economic progress survey of particular areas. Above slide provide ideal backdrop to make business presentations.
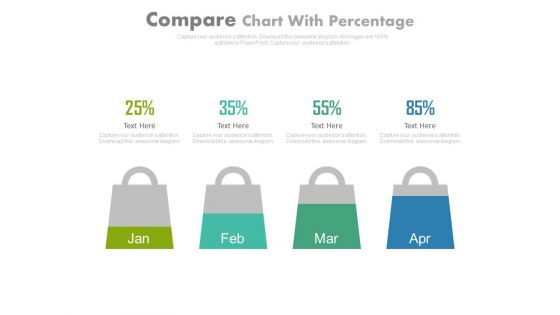
Four Months Sales Statistics Chart Powerpoint Slides
This PowerPoint template has been designed with four shopping bags with percentage values. Download this PPT slide to display four months sales statistics. Add this slide to your presentation and impress your superiors.
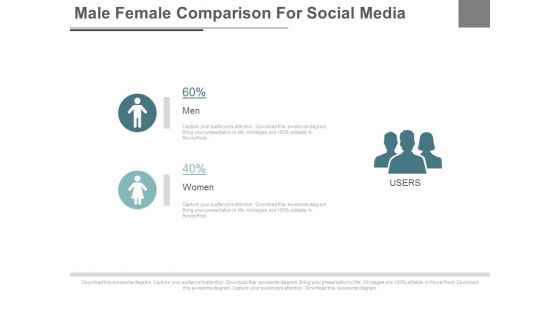
Male Female Social Media Users Powerpoint Slides
This PPT slide displays graphics of male female icons with percentage values. Use this PPT design to display male female ratios of social media users. This PowerPoint template can be customized as per requirements of business presentation.
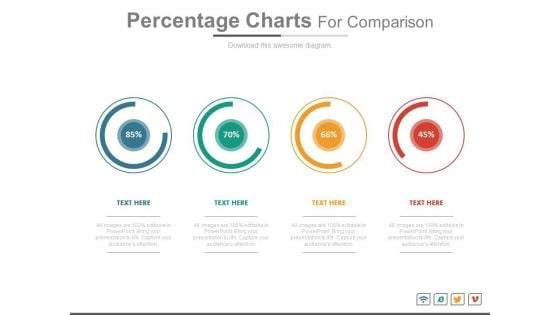
Percentage Charts For Statistical Comparison Powerpoint Slides
This PowerPoint template has been chart of percentage values. You may download this diagram for statistical comparison and analysis. Add this PPT slide to your presentation and impress your superiors.
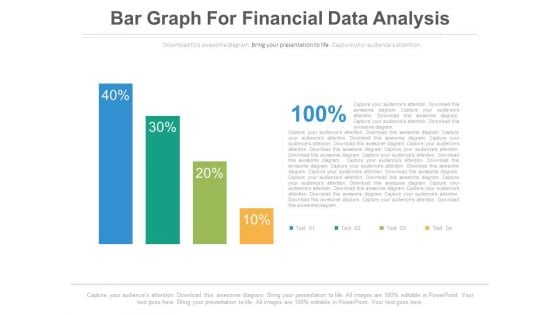
Bar Graph For Profit Growth Analysis Powerpoint Slides
This PowerPoint template has been designed with bar graph with percentage values. This diagram is useful to exhibit profit growth analysis. This diagram slide can be used to make impressive presentations.


 Continue with Email

 Home
Home


