Plan Icon
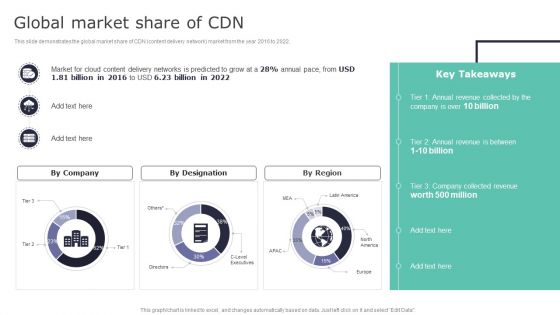
Deploying Content Distribution Network System Global Market Share Of CDN Introduction PDF
This slide demonstrates the global market share of CDN content delivery network market from the year 2016 to 2022. Crafting an eye-catching presentation has never been more straightforward. Let your presentation shine with this tasteful yet straightforward Deploying Content Distribution Network System Global Market Share Of CDN Introduction PDF template. It offers a minimalistic and classy look that is great for making a statement. The colors have been employed intelligently to add a bit of playfulness while still remaining professional. Construct the ideal Deploying Content Distribution Network System Global Market Share Of CDN Introduction PDF that effortlessly grabs the attention of your audience Begin now and be certain to wow your customers
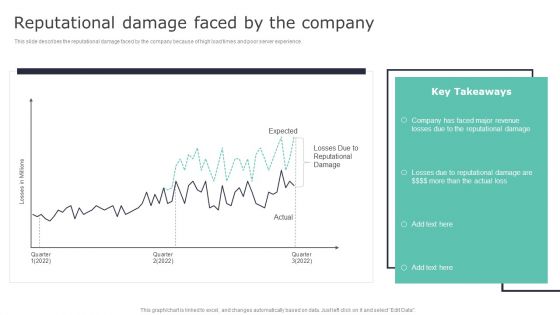
Deploying Content Distribution Network System Reputational Damage Faced By Introduction PDF
This slide describes the reputational damage faced by the company because of high load times and poor server experience. Take your projects to the next level with our ultimate collection of Deploying Content Distribution Network System Reputational Damage Faced By Introduction PDF. Slidegeeks has designed a range of layouts that are perfect for representing task or activity duration, keeping track of all your deadlines at a glance. Tailor these designs to your exact needs and give them a truly corporate look with your own brand colors theyll make your projects stand out from the rest
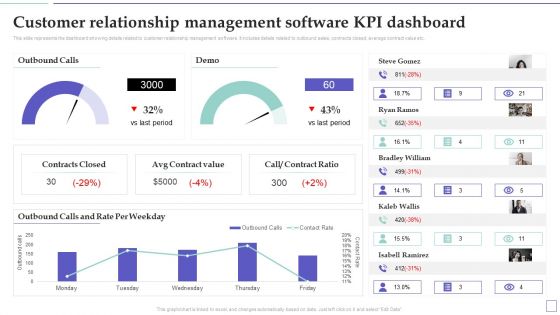
System Deployment Project Customer Relationship Management Software Kpi Dashboard Rules PDF
This slide represents the dashboard showing details related to customer relationship management software. It includes details related to outbound sales, contracts closed, average contract value etc. Present like a pro with System Deployment Project Customer Relationship Management Software Kpi Dashboard Rules PDF Create beautiful presentations together with your team, using our easy-to-use presentation slides. Share your ideas in real-time and make changes on the fly by downloading our templates. So whether youre in the office, on the go, or in a remote location, you can stay in sync with your team and present your ideas with confidence. With Slidegeeks presentation got a whole lot easier. Grab these presentations today.
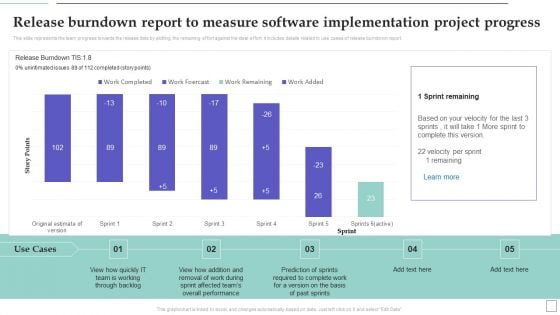
System Deployment Project Release Burndown Report To Measure Software Implementation Template PDF
This slide represents the team progress towards the release date by plotting the remaining effort against the ideal effort. It includes details related to use cases of release burndown report. This modern and well-arranged System Deployment Project Release Burndown Report To Measure Software Implementation Template PDF provides lots of creative possibilities. It is very simple to customize and edit with the Powerpoint Software. Just drag and drop your pictures into the shapes. All facets of this template can be edited with Powerpoint, no extra software is necessary. Add your own material, put your images in the places assigned for them, adjust the colors, and then you can show your slides to the world, with an animated slide included.
System Deployment Project Software Implementation Project Progress Tracking Dashboard Structure PDF
This slide represents the dashboard to track the progress of software implementation project. It includes details related to health, tasks, project, time, cost and workload of software implementation project. Take your projects to the next level with our ultimate collection of System Deployment Project Software Implementation Project Progress Tracking Dashboard Structure PDF. Slidegeeks has designed a range of layouts that are perfect for representing task or activity duration, keeping track of all your deadlines at a glance. Tailor these designs to your exact needs and give them a truly corporate look with your own brand colors theyll make your projects stand out from the rest
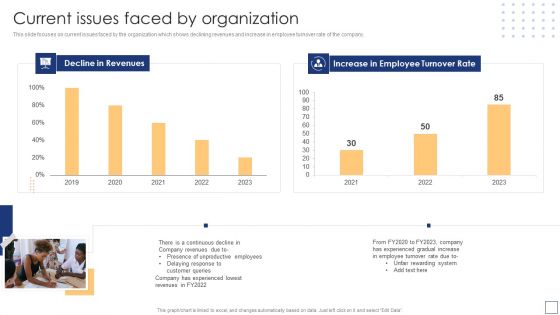
Business Process Redesigning Current Issues Faced By Organization Inspiration PDF
This slide focuses on current issues faced by the organization which shows declining revenues and increase in employee turnover rate of the company. Slidegeeks is one of the best resources for PowerPoint templates. You can download easily and regulate Business Process Redesigning Current Issues Faced By Organization Inspiration PDF for your personal presentations from our wonderful collection. A few clicks is all it takes to discover and get the most relevant and appropriate templates. Use our Templates to add a unique zing and appeal to your presentation and meetings. All the slides are easy to edit and you can use them even for advertisement purposes.
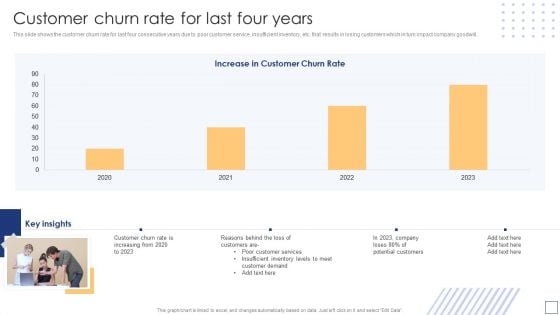
Business Process Redesigning Customer Churn Rate For Last Four Years Download PDF
This slide shows the customer churn rate for last four consecutive years due to poor customer service, insufficient inventory, etc. that results in losing customers which in turn impact company goodwill. Want to ace your presentation in front of a live audience Our Business Process Redesigning Customer Churn Rate For Last Four Years Download PDF can help you do that by engaging all the users towards you. Slidegeeks experts have put their efforts and expertise into creating these impeccable powerpoint presentations so that you can communicate your ideas clearly. Moreover, all the templates are customizable, and easy-to-edit and downloadable. Use these for both personal and commercial use.
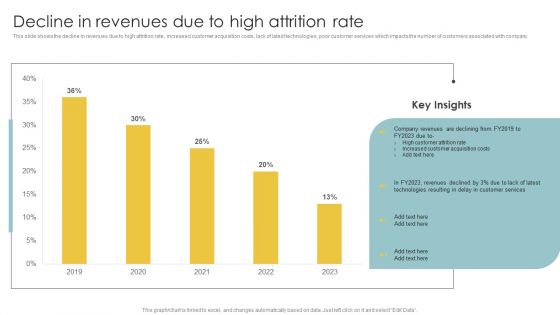
Implementing CRM To Optimize Decline In Revenues Due To High Attrition Rate Sample PDF
This slide shows the decline in revenues due to high attrition rate, increased customer acquisition costs, lack of latest technologies, poor customer services which impacts the number of customers associated with company. Want to ace your presentation in front of a live audience Our Implementing CRM To Optimize Decline In Revenues Due To High Attrition Rate Sample PDF can help you do that by engaging all the users towards you. Slidegeeks experts have put their efforts and expertise into creating these impeccable powerpoint presentations so that you can communicate your ideas clearly. Moreover, all the templates are customizable, and easy-to-edit and downloadable. Use these for both personal and commercial use.
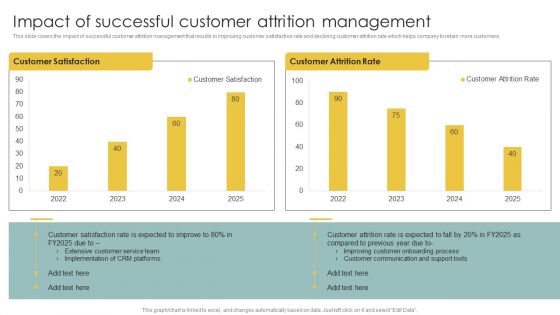
Implementing CRM To Optimize Impact Of Successful Customer Attrition Management Rules PDF
This slide covers the impact of successful customer attrition management that results in improving customer satisfaction rate and declining customer attrition rate which helps company to retain more customers. Slidegeeks is here to make your presentations a breeze with Implementing CRM To Optimize Impact Of Successful Customer Attrition Management Rules PDF With our easy-to-use and customizable templates, you can focus on delivering your ideas rather than worrying about formatting. With a variety of designs to choose from, youre sure to find one that suits your needs. And with animations and unique photos, illustrations, and fonts, you can make your presentation pop. So whether youre giving a sales pitch or presenting to the board, make sure to check out Slidegeeks first
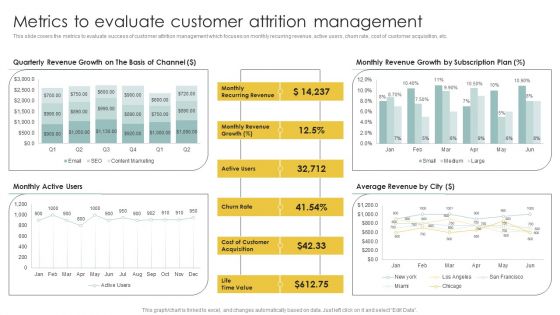
Implementing CRM To Optimize Metrics To Evaluate Customer Attrition Management Formats PDF
This slide covers the metrics to evaluate success of customer attrition management which focuses on monthly recurring revenue, active users, churn rate, cost of customer acquisition, etc. Do you have an important presentation coming up Are you looking for something that will make your presentation stand out from the rest Look no further than Implementing CRM To Optimize Metrics To Evaluate Customer Attrition Management Formats PDF. With our professional designs, you can trust that your presentation will pop and make delivering it a smooth process. And with Slidegeeks, you can trust that your presentation will be unique and memorable. So why wait Grab Implementing CRM To Optimize Metrics To Evaluate Customer Attrition Management Formats PDF today and make your presentation stand out from the rest
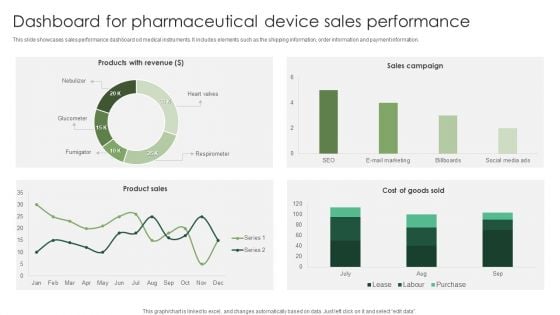
Dashboard For Pharmaceutical Device Sales Performance Graphics PDF
This slide showcases sales performance dashboard od medical instruments. It includes elements such as the shipping information, order information and payment information. Showcasing this set of slides titled Dashboard For Pharmaceutical Device Sales Performance Graphics PDF. The topics addressed in these templates are Pharmaceutical Device, Sales Performance. All the content presented in this PPT design is completely editable. Download it and make adjustments in color, background, font etc. as per your unique business setting.
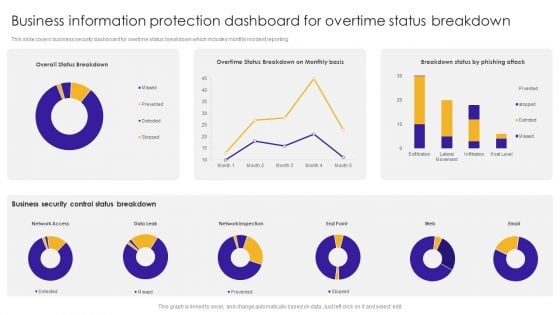
Business Information Protection Dashboard For Overtime Status Breakdown Introduction PDF
This slide covers business security dashboard for overtime status breakdown which includes monthly incident reporting.Pitch your topic with ease and precision using this Business Information Protection Dashboard For Overtime Status Breakdown Introduction PDF. This layout presents information on Business Security, Control Status Breakdown, Network Inspection. It is also available for immediate download and adjustment. So, changes can be made in the color, design, graphics or any other component to create a unique layout.
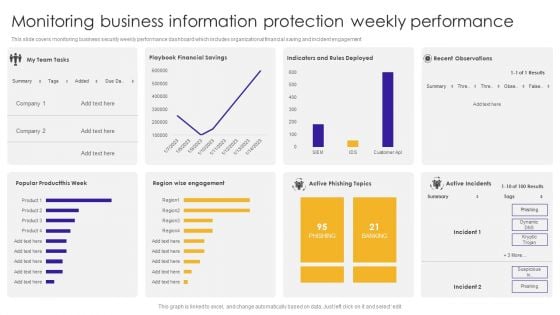
Monitoring Business Information Protection Weekly Performance Summary PDF
This slide covers monitoring business security weekly performance dashboard which includes organizational financial saving and incident engagement. Pitch your topic with ease and precision using this Monitoring Business Information Protection Weekly Performance Summary PDF. This layout presents information on Active Phishing, Active Incidents, Recent Observations. It is also available for immediate download and adjustment. So, changes can be made in the color, design, graphics or any other component to create a unique layout.
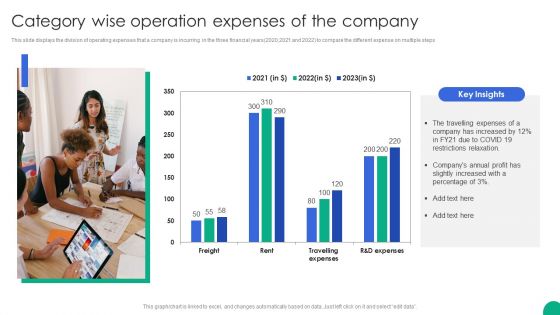
Category Wise Operation Expenses Of The Company Topics PDF
This slide displays the division of operating expenses that a company is incurring in the three financial years 2020,2021 and 2022 to compare the different expense on multiple steps.Pitch your topic with ease and precision using this Category Wise Operation Expenses Of The Company Topics PDF. This layout presents information on Travelling Expenses, Increased Restrictions, Relaxation. It is also available for immediate download and adjustment. So, changes can be made in the color, design, graphics or any other component to create a unique layout.
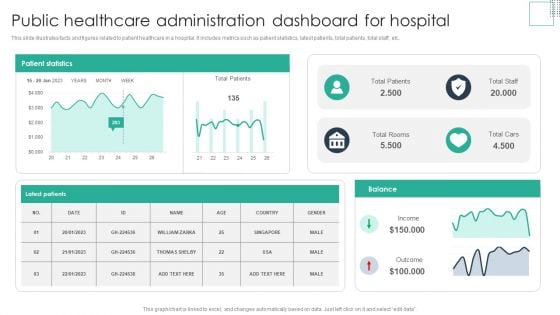
Public Healthcare Administration Dashboard For Hospital Guidelines PDF
This slide illustrates facts and figures related to patient healthcare in a hospital. It includes metrics such as patient statistics, latest patients, total patients, total staff, etc.Pitch your topic with ease and precision using this Public Healthcare Administration Dashboard For Hospital Guidelines PDF. This layout presents information on Total Patients, Total Rooms, Patient Statistics. It is also available for immediate download and adjustment. So, changes can be made in the color, design, graphics or any other component to create a unique layout.
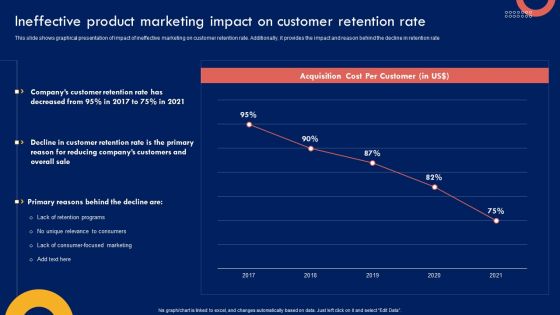
Ineffective Product Marketing Impact On Customer Product Marketing Leadership Ideas PDF
This slide shows graphical presentation of impact of ineffective marketing on customer retention rate. Additionally, it provides the impact and reason behind the decline in retention rate. Create an editable Ineffective Product Marketing Impact On Customer Product Marketing Leadership Ideas PDF that communicates your idea and engages your audience. Whether youre presenting a business or an educational presentation, pre-designed presentation templates help save time. Ineffective Product Marketing Impact On Customer Product Marketing Leadership Ideas PDF is highly customizable and very easy to edit, covering many different styles from creative to business presentations. Slidegeeks has creative team members who have crafted amazing templates. So, go and get them without any delay.
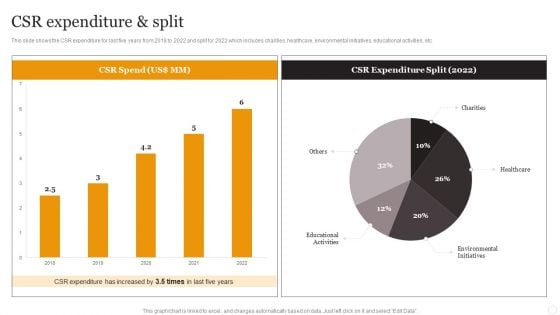
Website Designing Solutions Company Profile CSR Expenditure And Split Introduction PDF
This slide shows the CSR expenditure for last five years from 2018 to 2022 and split for 2022 which includes charities, healthcare, environmental initiatives, educational activities, etc. Find highly impressive Website Designing Solutions Company Profile CSR Expenditure And Split Introduction PDF on Slidegeeks to deliver a meaningful presentation. You can save an ample amount of time using these presentation templates. No need to worry to prepare everything from scratch because Slidegeeks experts have already done a huge research and work for you. You need to download Website Designing Solutions Company Profile CSR Expenditure And Split Introduction PDF for your upcoming presentation. All the presentation templates are 100 percent editable and you can change the color and personalize the content accordingly. Download now
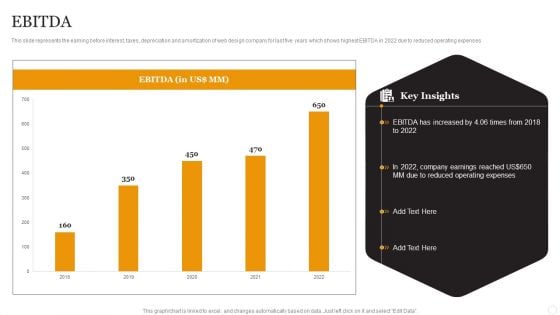
Website Designing Solutions Company Profile EBITDA Structure PDF
This slide represents the earning before interest, taxes, depreciation and amortization of web design company for last five years which shows highest EBITDA in 2022 due to reduced operating expenses. If your project calls for a presentation, then Slidegeeks is your go-to partner because we have professionally designed, easy-to-edit templates that are perfect for any presentation. After downloading, you can easily edit Website Designing Solutions Company Profile EBITDA Structure PDF and make the changes accordingly. You can rearrange slides or fill them with different images. Check out all the handy templates
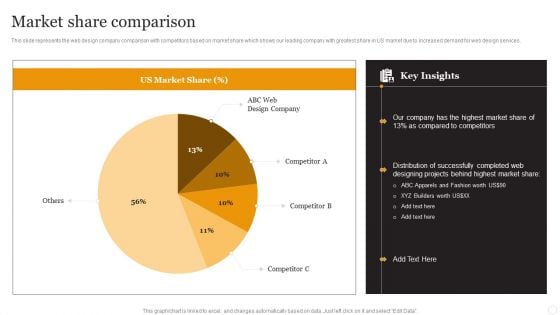
Website Designing Solutions Company Profile Market Share Comparison Summary PDF
This slide represents the web design company comparison with competitors based on market share which shows our leading company with greatest share in US market due to increased demand for web design services. This Website Designing Solutions Company Profile Market Share Comparison Summary PDF is perfect for any presentation, be it in front of clients or colleagues. It is a versatile and stylish solution for organizing your meetings. The Website Designing Solutions Company Profile Market Share Comparison Summary PDF features a modern design for your presentation meetings. The adjustable and customizable slides provide unlimited possibilities for acing up your presentation. Slidegeeks has done all the homework before launching the product for you. So, dont wait, grab the presentation templates today
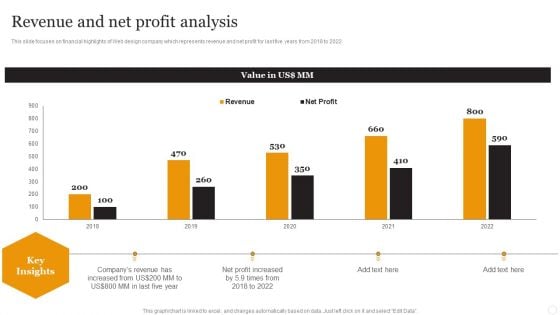
Website Designing Solutions Company Profile Revenue And Net Profit Analysis Background PDF
This slide focuses on financial highlights of Web design company which represents revenue and net profit for last five years from 2018 to 2022. Here you can discover an assortment of the finest PowerPoint and Google Slides templates. With these templates, you can create presentations for a variety of purposes while simultaneously providing your audience with an eye-catching visual experience. Download Website Designing Solutions Company Profile Revenue And Net Profit Analysis Background PDF to deliver an impeccable presentation. These templates will make your job of preparing presentations much quicker, yet still, maintain a high level of quality. Slidegeeks has experienced researchers who prepare these templates and write high-quality content for you. Later on, you can personalize the content by editing the Website Designing Solutions Company Profile Revenue And Net Profit Analysis Background PDF.
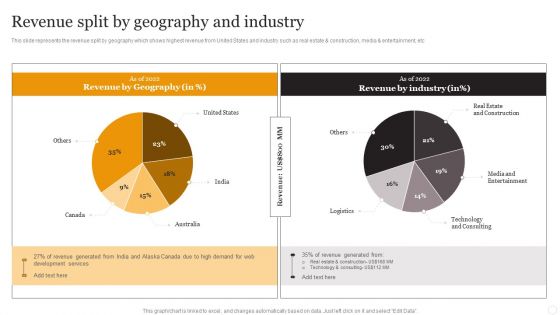
Website Designing Solutions Company Profile Revenue Split By Geography And Industry Clipart PDF
This slide represents the revenue split by geography which shows highest revenue from United States and industry such as real estate and construction, media and entertainment, etc. This Website Designing Solutions Company Profile Revenue Split By Geography And Industry Clipart PDF from Slidegeeks makes it easy to present information on your topic with precision. It provides customization options, so you can make changes to the colors, design, graphics, or any other component to create a unique layout. It is also available for immediate download, so you can begin using it right away. Slidegeeks has done good research to ensure that you have everything you need to make your presentation stand out. Make a name out there for a brilliant performance.
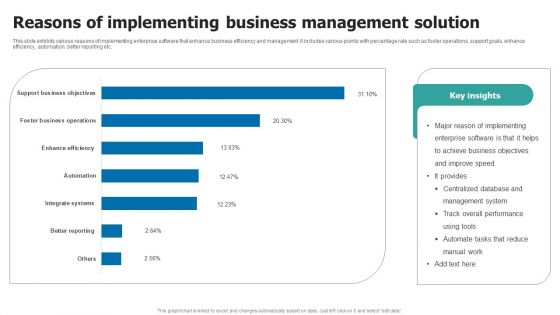
Reasons Of Implementing Business Management Solution Inspiration PDF
This slide exhibits various reasons of implementing enterprise software that enhance business efficiency and management. It includes various points with percentage rate such as foster operations, support goals, enhance efficiency, automation, better reporting etc. Showcasing this set of slides titled Reasons Of Implementing Business Management Solution Inspiration PDF. The topics addressed in these templates are Reasons Of Implementing, Business Management Solution. All the content presented in this PPT design is completely editable. Download it and make adjustments in color, background, font etc. as per your unique business setting.
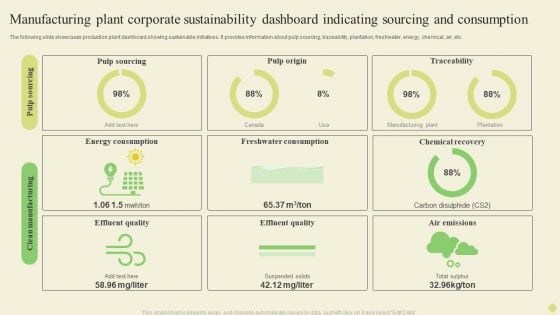
Manufacturing Plant Corporate Sustainability Dashboard Indicating Sourcing And Consumption Infographics PDF
The following slide showcases business sustainability dashboard highlighting multiple sources of technology. It provides information about renewable energy, plant age, solar, wind, biomass, regionality, etc.Pitch your topic with ease and precision using this Manufacturing Plant Corporate Sustainability Dashboard Indicating Sourcing And Consumption Infographics PDF. This layout presents information on Energy Consumption, Freshwater Consumption, Chemical Recovery. It is also available for immediate download and adjustment. So, changes can be made in the color, design, graphics or any other component to create a unique layout.
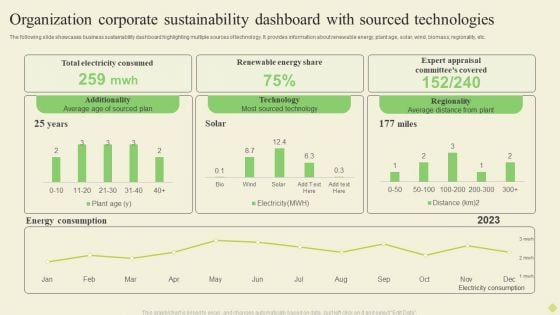
Organization Corporate Sustainability Dashboard With Sourced Technologies Pictures PDF
The following slide showcases green business model for multiple activities. It provides information about growth, return on capital, risk management, innovation, operational risks, etc.Showcasing this set of slides titled Organization Corporate Sustainability Dashboard With Sourced Technologies Pictures PDF. The topics addressed in these templates are Electricity Consumed, Renewable Energy, Committees Covered. All the content presented in this PPT design is completely editable. Download it and make adjustments in color, background, font etc. as per your unique business setting.
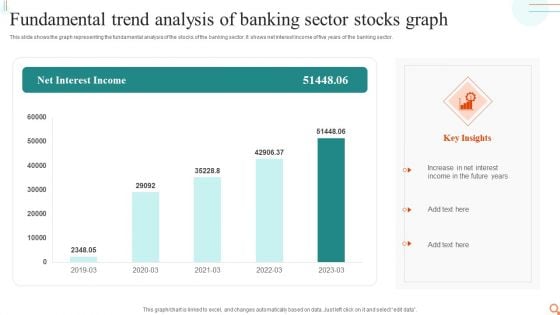
Fundamental Trend Analysis Of Banking Sector Stocks Graph Mockup PDF
This slide shows the graph representing the fundamental analysis of the stocks of the banking sector. It shows net interest income of five years of the banking sector.Pitch your topic with ease and precision using this Fundamental Trend Analysis Of Banking Sector Stocks Graph Mockup PDF. This layout presents information on Increase Interest, Income Future, Interest Income. It is also available for immediate download and adjustment. So, changes can be made in the color, design, graphics or any other component to create a unique layout.
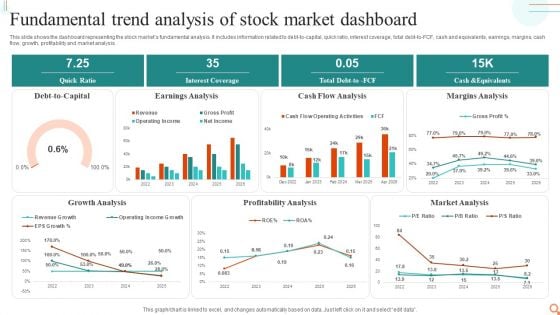
Fundamental Trend Analysis Of Stock Market Dashboard Professional PDF
This slide shows the dashboard representing the stock markets fundamental analysis. It includes information related to debt-to-capital, quick ratio, interest coverage, total debt-to-FCF, cash and equivalents, earnings, margins, cash flow, growth, profitability and market analysis.Showcasing this set of slides titled Fundamental Trend Analysis Of Stock Market Dashboard Professional PDF. The topics addressed in these templates are Earnings Analysis, Cash Flow Analysis, Margins Analysis. All the content presented in this PPT design is completely editable. Download it and make adjustments in color, background, font etc. as per your unique business setting.
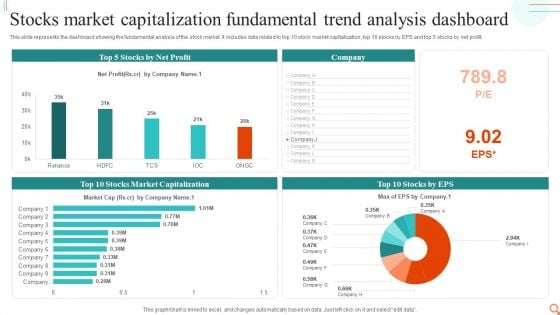
Stocks Market Capitalization Fundamental Trend Analysis Dashboard Designs PDF
This slide represents the dashboard showing the fundamental analysis of the stock market. It includes data related to top 10 stock market capitalization, top 10 stocks by EPS and top 5 stocks by net profit.Showcasing this set of slides titled Stocks Market Capitalization Fundamental Trend Analysis Dashboard Designs PDF. The topics addressed in these templates are Market Capitalization, Net Profit. All the content presented in this PPT design is completely editable. Download it and make adjustments in color, background, font etc. as per your unique business setting.
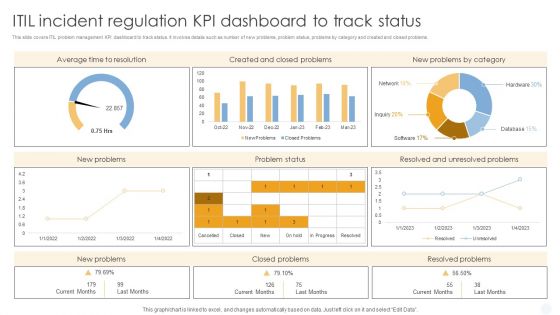
ITIL Incident Regulation Kpi Dashboard To Track Status Mockup PDF
This slide covers ITIL problem management KPI dashboard to track status. It involves details such as number of new problems, problem status, problems by category and created and closed problems.Showcasing this set of slides titled ITIL Incident Regulation Kpi Dashboard To Track Status Mockup PDF. The topics addressed in these templates are Average Time Resolution, Created Problems, Problems Category. All the content presented in this PPT design is completely editable. Download it and make adjustments in color, background, font etc. as per your unique business setting.

ITIL Incident Regulation Kpi Dashboard Background PDF
This slide covers ITIL problem management KPI dashboard to track status of problems. It involves KPI such as total number of incidents, problems, requests, average time to solve incidents.Pitch your topic with ease and precision using this ITIL Incident Regulation Kpi Dashboard Background PDF. This layout presents information on Active Problems, Average Incidents, Opened Problems. It is also available for immediate download and adjustment. So, changes can be made in the color, design, graphics or any other component to create a unique layout.
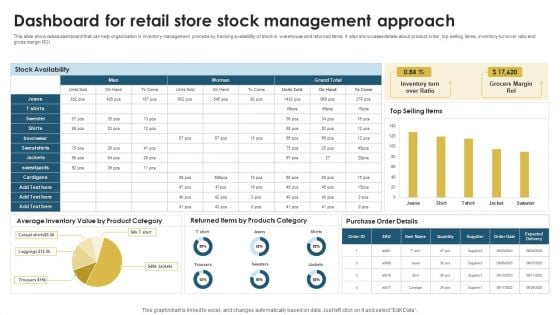
Dashboard For Retail Store Stock Management Approach Portrait PDF
This slide showcases dashboard that can help organization in inventory management process by tracking availability of stock in warehouse and returned items. It also showcases details about product order, top selling items, inventory turnover ratio and gross margin ROI. Showcasing this set of slides titled Dashboard For Retail Store Stock Management Approach Portrait PDF. The topics addressed in these templates are Average Inventory, Product Category, Inventory Turn. All the content presented in this PPT design is completely editable. Download it and make adjustments in color, background, font etc. as per your unique business setting.
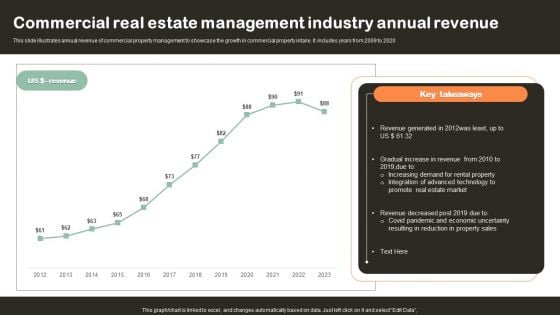
Commercial Real Estate Management Industry Annual Revenue Download PDF
This slide illustrates annual revenue of commercial property management to showcase the growth in commercial property intake. It includes years from 2009 to 2020. Showcasing this set of slides titled Commercial Real Estate Management Industry Annual Revenue Download PDF. The topics addressed in these templates are Increasing Demand, Real Estate Market, Technology. All the content presented in this PPT design is completely editable. Download it and make adjustments in color, background, font etc. as per your unique business setting.
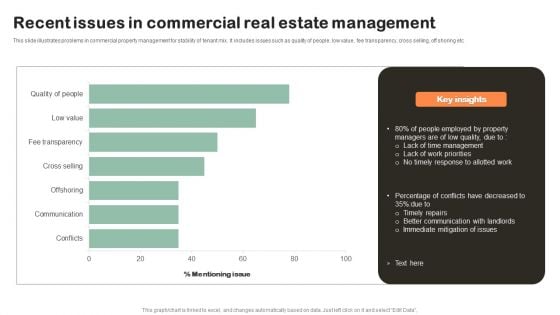
Recent Issues In Commercial Real Estate Management Ideas PDF
This slide illustrates problems in commercial property management for stability of tenant mix. It includes issues such as quality of people, low value, fee transparency, cross selling, off shoring etc. Pitch your topic with ease and precision using this Recent Issues In Commercial Real Estate Management Ideas PDF. This layout presents information on Management, Low Quality, Communication. It is also available for immediate download and adjustment. So, changes can be made in the color, design, graphics or any other component to create a unique layout.
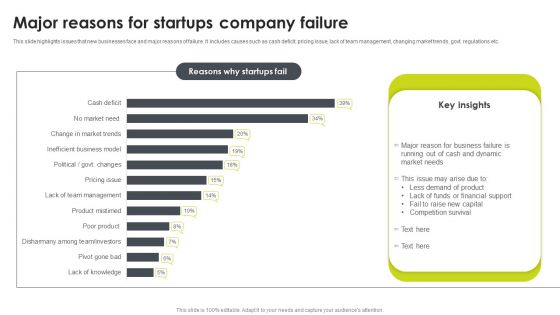
Major Reasons For Startups Company Failure Portrait PDF
This slide highlights issues that new businesses face and major reasons of failure. It includes causes such as cash deficit, pricing issue, lack of team management, changing market trends, govt. regulations etc. Showcasing this set of slides titled Major Reasons For Startups Company Failure Portrait PDF. The topics addressed in these templates are Market, Dynamic, Business Failure. All the content presented in this PPT design is completely editable. Download it and make adjustments in color, background, font etc. as per your unique business setting.
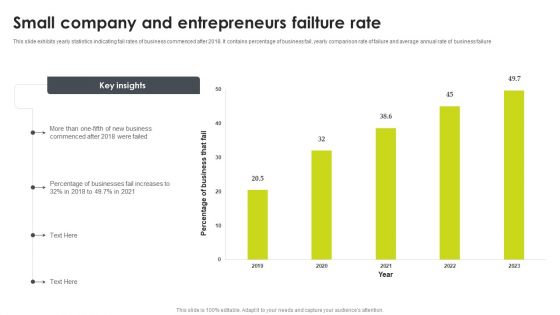
Small Company And Entrepreneurs Failture Rate Summary PDF
This slide exhibits yearly statistics indicating fail rates of business commenced after 2018. It contains percentage of business fail, yearly comparison rate of failure and average annual rate of business failure. Pitch your topic with ease and precision using this Small Company And Entrepreneurs Failture Rate Summary PDF. This layout presents information on Entrepreneurs Failture Rate, Business. It is also available for immediate download and adjustment. So, changes can be made in the color, design, graphics or any other component to create a unique layout.
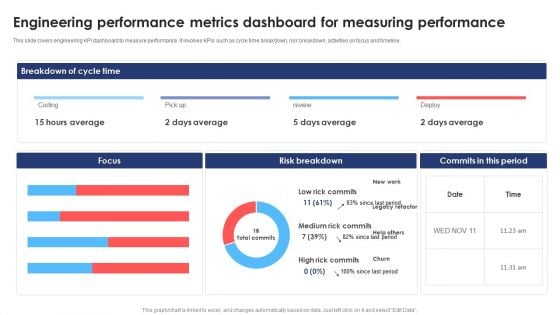
Engineering Performance Metrics Dashboard For Measuring Performance Download PDF
This slide covers engineering KPI dashboard to measure performance. It involves KPIs such as cycle time breakdown, risk breakdown, activities on focus and timeline. Pitch your topic with ease and precision using this Engineering Performance Metrics Dashboard For Measuring Performance Download PDF. This layout presents information on Average, Risk Breakdown, Measuring Performance. It is also available for immediate download and adjustment. So, changes can be made in the color, design, graphics or any other component to create a unique layout.

Engineering Performance Metrics Dashboard To Track Pull Requests Background PDF
This slide covers engineering KPI dashboard to track pull request. It involves KPIs such as open time of average pull requests, average comment received, revision rounds, frequency of posting pull requests. Pitch your topic with ease and precision using this Engineering Performance Metrics Dashboard To Track Pull Requests Background PDF. This layout presents information on Dashboard Track Pull Requests, Engineering Performance Metrics. It is also available for immediate download and adjustment. So, changes can be made in the color, design, graphics or any other component to create a unique layout.
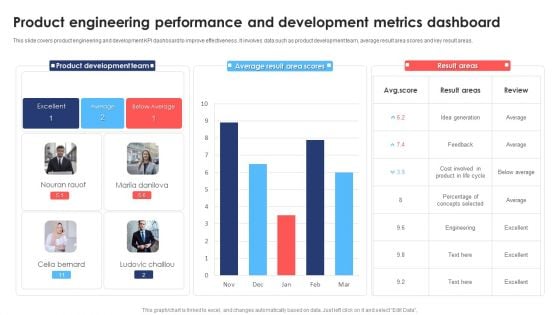
Product Engineering Performance And Development Metrics Dashboard Topics PDF
This slide covers product engineering and development KPI dashboard to improve effectiveness. It involves data such as product development team, average result area scores and key result areas. Showcasing this set of slides titled Product Engineering Performance And Development Metrics Dashboard Topics PDF. The topics addressed in these templates are Product Development Team, Average, Cost. All the content presented in this PPT design is completely editable. Download it and make adjustments in color, background, font etc. as per your unique business setting.
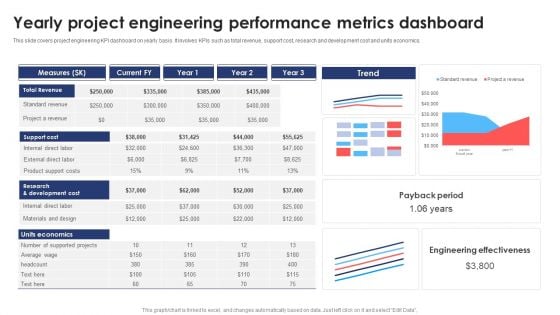
Yearly Project Engineering Performance Metrics Dashboard Information PDF
This slide covers project engineering KPI dashboard on yearly basis. It involves KPIs such as total revenue, support cost, research and development cost and units economics. Pitch your topic with ease and precision using this Yearly Project Engineering Performance Metrics Dashboard Information PDF. This layout presents information on Support Cost, Revenue, Measures. It is also available for immediate download and adjustment. So, changes can be made in the color, design, graphics or any other component to create a unique layout.
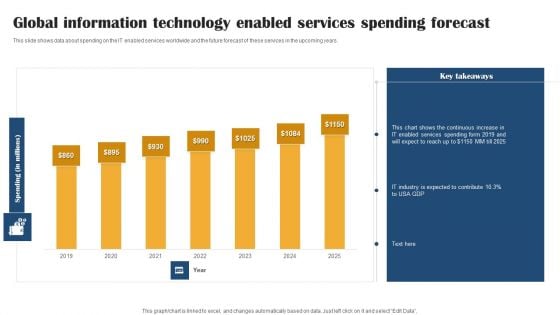
Global Information Technology Enabled Services Spending Forecast Clipart PDF
This slide shows data about spending on the IT enabled services worldwide and the future forecast of these services in the upcoming years. Showcasing this set of slides titled Global Information Technology Enabled Services Spending Forecast Clipart PDF. The topics addressed in these templates are Services, IT Industry, Key Takeaways. All the content presented in this PPT design is completely editable. Download it and make adjustments in color, background, font etc. as per your unique business setting.
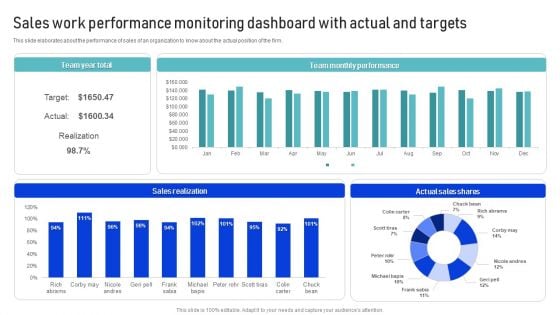
Sales Work Performance Monitoring Dashboard With Actual And Targets Introduction PDF
This slide elaborates about the performance of sales of an organization to know about the actual position of the firm. Showcasing this set of slides titled Sales Work Performance Monitoring Dashboard With Actual And Targets Introduction PDF. The topics addressed in these templates are Sales Realization, Team Monthly, Performance. All the content presented in this PPT design is completely editable. Download it and make adjustments in color, background, font etc. as per your unique business setting.
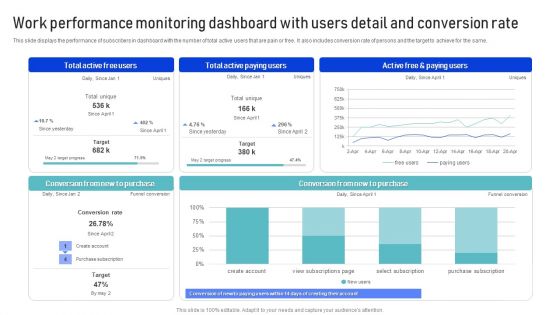
Work Performance Monitoring Dashboard With Users Detail And Conversion Rate Template PDF
This slide displays the performance of subscribers in dashboard with the number of total active users that are pain or free. It also includes conversion rate of persons and the target to achieve for the same. Showcasing this set of slides titled Work Performance Monitoring Dashboard With Users Detail And Conversion Rate Template PDF. The topics addressed in these templates are Purchase, Conversion Rate, Target. All the content presented in this PPT design is completely editable. Download it and make adjustments in color, background, font etc. as per your unique business setting.
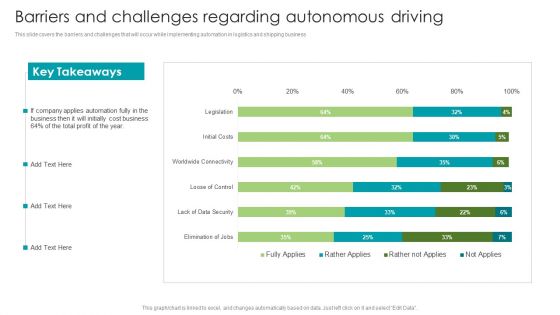
Robotic Process Automation Barriers And Challenges Regarding Autonomous Driving Structure PDF
This slide covers the barriers and challenges that will occur while implementing automation in logistics and shipping business. Find highly impressive Robotic Process Automation Barriers And Challenges Regarding Autonomous Driving Structure PDF on Slidegeeks to deliver a meaningful presentation. You can save an ample amount of time using these presentation templates. No need to worry to prepare everything from scratch because Slidegeeks experts have already done a huge research and work for you. You need to download Robotic Process Automation Barriers And Challenges Regarding Autonomous Driving Structure PDF for your upcoming presentation. All the presentation templates are 100 percent editable and you can change the color and personalize the content accordingly. Download now
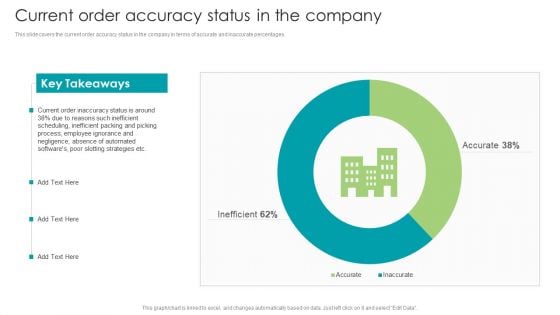
Robotic Process Automation Current Order Accuracy Status In The Company Slides PDF
This slide covers the current order accuracy status in the company in terms of accurate and inaccurate percentages. Are you in need of a template that can accommodate all of your creative concepts This one is crafted professionally and can be altered to fit any style. Use it with Google Slides or PowerPoint. Include striking photographs, symbols, depictions, and other visuals. Fill, move around, or remove text boxes as desired. Test out color palettes and font mixtures. Edit and save your work, or work with colleagues. Download Robotic Process Automation Current Order Accuracy Status In The Company Slides PDF and observe how to make your presentation outstanding. Give an impeccable presentation to your group and make your presentation unforgettable.
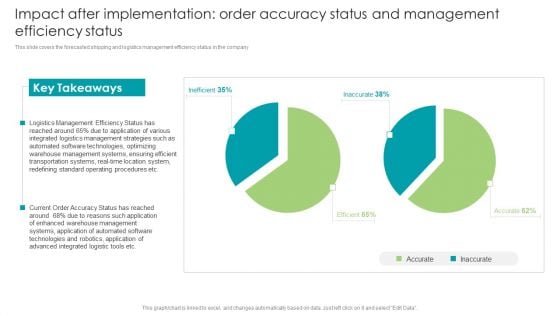
Robotic Process Automation Impact After Implementation Order Accuracy Status Brochure PDF
This slide covers the forecasted shipping and logistics management efficiency status in the company. Do you have to make sure that everyone on your team knows about any specific topic I yes, then you should give Robotic Process Automation Impact After Implementation Order Accuracy Status Brochure PDF a try. Our experts have put a lot of knowledge and effort into creating this impeccable Robotic Process Automation Impact After Implementation Order Accuracy Status Brochure PDF. You can use this template for your upcoming presentations, as the slides are perfect to represent even the tiniest detail. You can download these templates from the Slidegeeks website and these are easy to edit. So grab these today
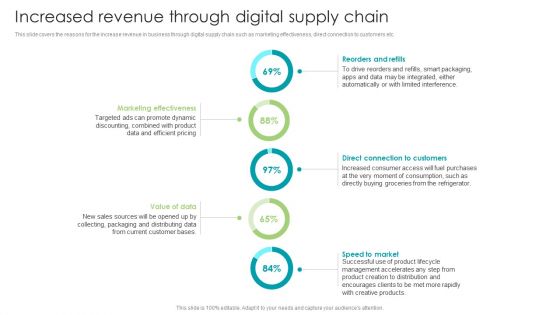
Robotic Process Automation Increased Revenue Through Digital Supply Chain Topics PDF
This slide covers the reasons for the increase revenue in business through digital supply chain such as marketing effectiveness, direct connection to customers etc. Present like a pro with Robotic Process Automation Increased Revenue Through Digital Supply Chain Topics PDF Create beautiful presentations together with your team, using our easy-to-use presentation slides. Share your ideas in real-time and make changes on the fly by downloading our templates. So whether youre in the office, on the go, or in a remote location, you can stay in sync with your team and present your ideas with confidence. With Slidegeeks presentation got a whole lot easier. Grab these presentations today.
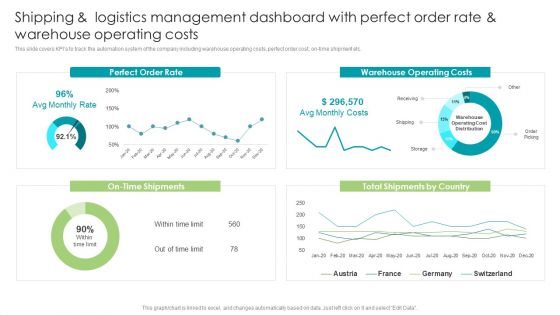
Robotic Process Automation Shipping And Logistics Management Dashboard With Perfect Brochure PDF
This slide covers KPIs to track the automation system of the company including warehouse operating costs, perfect order cost, on-time shipment etc. Find highly impressive Robotic Process Automation Shipping And Logistics Management Dashboard With Perfect Brochure PDF on Slidegeeks to deliver a meaningful presentation. You can save an ample amount of time using these presentation templates. No need to worry to prepare everything from scratch because Slidegeeks experts have already done a huge research and work for you. You need to download Robotic Process Automation Shipping And Logistics Management Dashboard With Perfect Brochure PDF for your upcoming presentation. All the presentation templates are 100 percent editable and you can change the color and personalize the content accordingly. Download now
Robotic Process Automation Shipping And Logistics Tracking Dashboard With Shipments Clipart PDF
This slide covers Key performance indicators to track the automation system of the company. This dashboard includes Logistics Efficiency Status, delivery time accuracy etc. If your project calls for a presentation, then Slidegeeks is your go-to partner because we have professionally designed, easy-to-edit templates that are perfect for any presentation. After downloading, you can easily edit Robotic Process Automation Shipping And Logistics Tracking Dashboard With Shipments Clipart PDF and make the changes accordingly. You can rearrange slides or fill them with different images. Check out all the handy templates
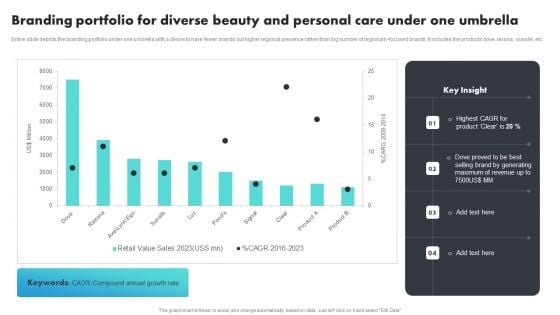
Branding Portfolio For Diverse Beauty And Personal Care Under One Umbrella Ideas PDF
Entire slide depicts the branding portfolio under one umbrella with a desire to have fewer brands but higher regional presence rather than big number of regionally focused brands. It includes the products dove, rexona, sunslik, etc. Showcasing this set of slides titled Branding Portfolio For Diverse Beauty And Personal Care Under One Umbrella Ideas PDF. The topics addressed in these templates are Branding Portfolio For Diverse, Beauty And Personal Care, Under One Umbrella. All the content presented in this PPT design is completely editable. Download it and make adjustments in color, background, font etc. as per your unique business setting.
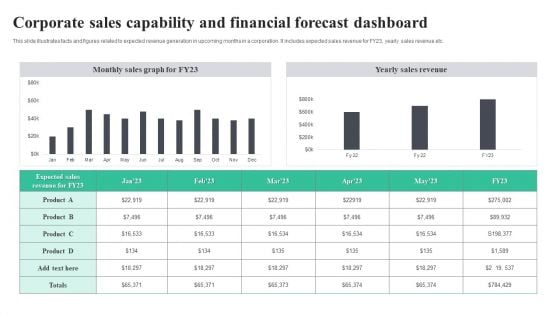
Corporate Sales Capability And Financial Forecast Dashboard Download PDF
This slide illustrates facts and figures related to expected revenue generation in upcoming months in a corporation. It includes expected sales revenue for FY23, yearly sales revenue etc. Showcasing this set of slides titled Corporate Sales Capability And Financial Forecast Dashboard Download PDF. The topics addressed in these templates are Corporate Sales, Capability And Financial, Forecast Dashboard. All the content presented in this PPT design is completely editable. Download it and make adjustments in color, background, font etc. as per your unique business setting
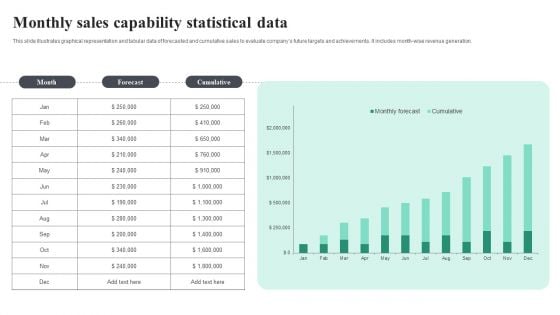
Monthly Sales Capability Statistical Data Background PDF
This slide illustrates graphical representation and tabular data of forecasted and cumulative sales to evaluate companys future targets and achievements. It includes month wise revenue generation. Pitch your topic with ease and precision using this Monthly Sales Capability Statistical Data Background PDF. This layout presents information on Monthly Sales, Capability Statistical Data. It is also available for immediate download and adjustment. So, changes can be made in the color, design, graphics or any other component to create a unique layout.
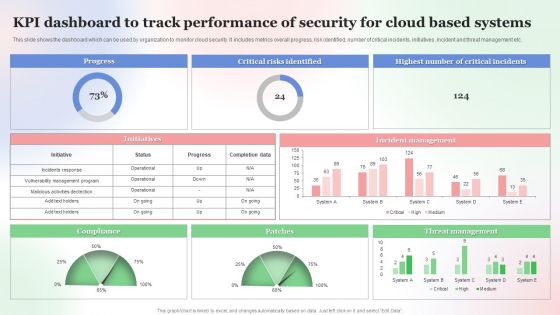
KPI Dashboard To Track Performance Of Security For Cloud Based Systems Clipart PDF
This slide shows the dashboard which can be used by organization to monitor cloud security. It includes metrics overall progress, risk identified, number of critical incidents, initiatives, incident and threat management etc. Showcasing this set of slides titled KPI Dashboard To Track Performance Of Security For Cloud Based Systems Clipart PDF. The topics addressed in these templates are Kpi Dashboard To Track, Performance Of Security, Cloud Based Systems . All the content presented in this PPT design is completely editable. Download it and make adjustments in color, background, font etc. as per your unique business setting.

Quarterly Comparison Of Security For Cloud Based Systems Threats Infographics PDF
This slide shows the various types of cloud security threats occurred during four quarters. It includes phishing, malware, IoT and password attacks. Pitch your topic with ease and precision using this Quarterly Comparison Of Security For Cloud Based Systems Threats Infographics PDF. This layout presents information on Quarterly Comparison Of Security, Cloud Based Systems Threats. It is also available for immediate download and adjustment. So, changes can be made in the color, design, graphics or any other component to create a unique layout.
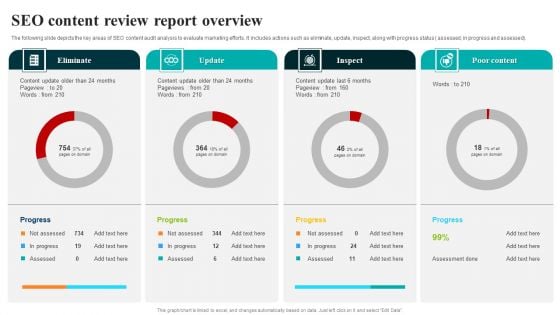
SEO Content Review Report Overview Formats PDF
The following slide depicts the key areas of SEO content audit analysis to evaluate marketing efforts. It includes actions such as eliminate, update, inspect, along with progress status assessed, in progress and assessed. Showcasing this set of slides titled SEO Content Review Report Overview Formats PDF. The topics addressed in these templates are Content Review, Report Overview. All the content presented in this PPT design is completely editable. Download it and make adjustments in color, background, font etc. as per your unique business setting.
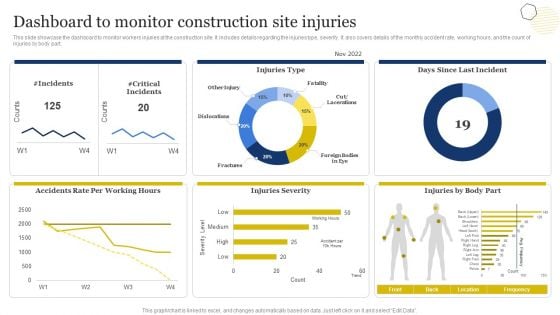
Improvement Of Safety Performance At Construction Site Dashboard To Monitor Construction Mockup PDF
This slide showcase the dashboard to monitor workers injuries at the construction site. It includes details regarding the injuries type, severity. It also covers details of the monthly accident rate, working hours, and the count of injuries by body part. Do you have an important presentation coming up Are you looking for something that will make your presentation stand out from the rest Look no further than Improvement Of Safety Performance At Construction Site Dashboard To Monitor Construction Mockup PDF. With our professional designs, you can trust that your presentation will pop and make delivering it a smooth process. And with Slidegeeks, you can trust that your presentation will be unique and memorable. So why wait Grab Improvement Of Safety Performance At Construction Site Dashboard To Monitor Construction Mockup PDF today and make your presentation stand out from the rest
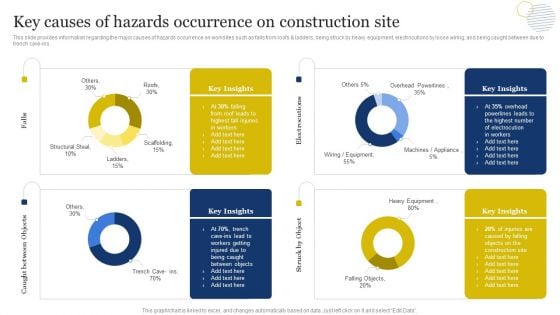
Improvement Of Safety Performance At Construction Site Key Causes Of Hazards Occurrence On Professional PDF
This slide provides information regarding the major causes of hazards occurrence on worksites such as falls from roofs and ladders, being struck by heavy equipment, electrocutions by loose wiring, and being caught between due to trench cave-ins. Are you in need of a template that can accommodate all of your creative concepts This one is crafted professionally and can be altered to fit any style. Use it with Google Slides or PowerPoint. Include striking photographs, symbols, depictions, and other visuals. Fill, move around, or remove text boxes as desired. Test out color palettes and font mixtures. Edit and save your work, or work with colleagues. Download Improvement Of Safety Performance At Construction Site Key Causes Of Hazards Occurrence On Professional PDF and observe how to make your presentation outstanding. Give an impeccable presentation to your group and make your presentation unforgettable.
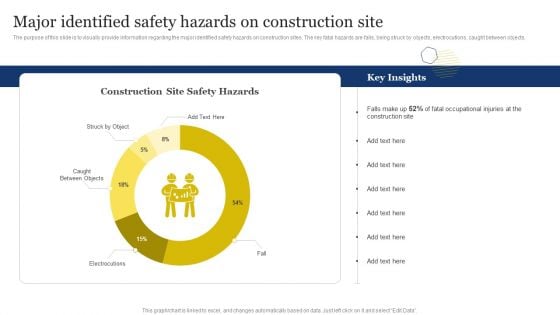
Improvement Of Safety Performance At Construction Site Major Identified Safety Hazards Topics PDF
The purpose of this slide is to visually provide information regarding the major identified safety hazards on construction sites. The key fatal hazards are falls, being struck by objects, electrocutions, caught between objects. Formulating a presentation can take up a lot of effort and time, so the content and message should always be the primary focus. The visuals of the PowerPoint can enhance the presenters message, so our Improvement Of Safety Performance At Construction Site Major Identified Safety Hazards Topics PDF was created to help save time. Instead of worrying about the design, the presenter can concentrate on the message while our designers work on creating the ideal templates for whatever situation is needed. Slidegeeks has experts for everything from amazing designs to valuable content, we have put everything into Improvement Of Safety Performance At Construction Site Major Identified Safety Hazards Topics PDF

Improvement Of Safety Performance At Construction Site Workers Injuries Incurred At Infographics PDF
This slide highlights the dashboard to showcase the workers injuries incurred at construction site. It includes details regarding the safety incident classification based on type and severity, injury types, number of workers injured, and injury costs. Boost your pitch with our creative Improvement Of Safety Performance At Construction Site Workers Injuries Incurred At Infographics PDF. Deliver an awe-inspiring pitch that will mesmerize everyone. Using these presentation templates you will surely catch everyones attention. You can browse the ppts collection on our website. We have researchers who are experts at creating the right content for the templates. So you dont have to invest time in any additional work. Just grab the template now and use them.

Pre Launch Activities Marketing Campaign To Enhance Lead Generation Rules PDF
This slide signifies the pre launch activities marketing platform to increase lead generation rate. It covers information about social media, email, search engine, printed media and influencer marketing. Showcasing this set of slides titled Pre Launch Activities Marketing Campaign To Enhance Lead Generation Rules PDF. The topics addressed in these templates are Marketing Campaign, Enhance Lead Generation. All the content presented in this PPT design is completely editable. Download it and make adjustments in color, background, font etc. as per your unique business setting.

Pre Launch Activities Marketing Platform For Effective Lead Generation Structure PDF
This slide signifies the key statistics for pre launch activities marketing platform to enhance lead generation rate. It covers information about direct mail, trade show, email marketing, telemarketing, blogs and social media. Showcasing this set of slides titled Pre Launch Activities Marketing Platform For Effective Lead Generation Structure PDF. The topics addressed in these templates are Direct Mail Campaign Leads, Compare To Estimated. All the content presented in this PPT design is completely editable. Download it and make adjustments in color, background, font etc. as per your unique business setting.
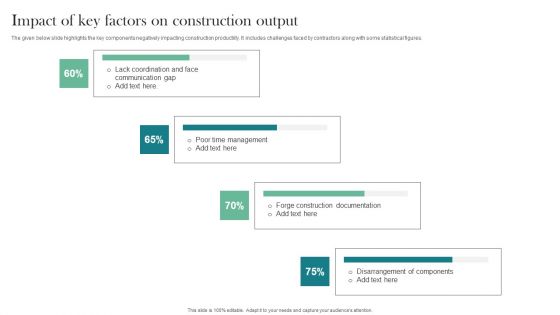
Impact Of Key Factors On Construction Output Download PDF
The given below slide highlights the key components negatively impacting construction productiity. It includes challenges faced by contractors along with some statistical figures. Showcasing this set of slides titled Impact Of Key Factors On Construction Output Download PDF. The topics addressed in these templates are Introduce Right Technology, Source Of Data, Integrate Team. All the content presented in this PPT design is completely editable. Download it and make adjustments in color, background, font etc. as per your unique business setting.
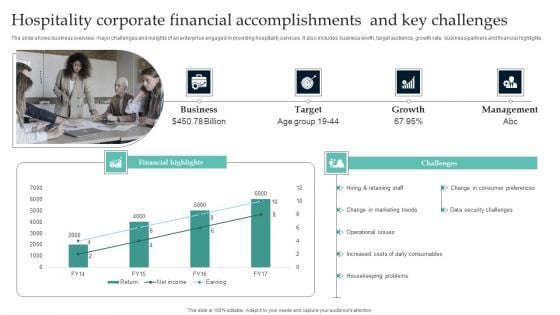
Hospitality Corporate Financial Accomplishments And Key Challenges Slides PDF
The slide shows business overview, major challenges and insights of an enterprise engaged in providing hospitality services. It also includes business worth, target audience, growth rate, business partners and financial highlights. Showcasing this set of slides titled Hospitality Corporate Financial Accomplishments And Key Challenges Slides PDF. The topics addressed in these templates are Business, Target, Growth. All the content presented in this PPT design is completely editable. Download it and make adjustments in color, background, font etc. as per your unique business setting.
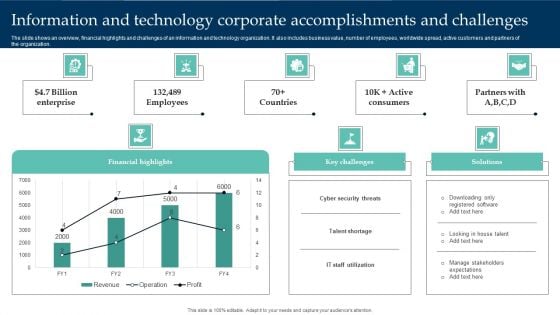
Information And Technology Corporate Accomplishments And Challenges Structure PDF
The slide shows an overview, financial highlights and challenges of an information and technology organization. It also includes business value, number of employees, worldwide spread, active customers and partners of the organization. Pitch your topic with ease and precision using this Information And Technology Corporate Accomplishments And Challenges Structure PDF. This layout presents information on Financial Highlights, Cyber Security Threats, Enterprise. It is also available for immediate download and adjustment. So, changes can be made in the color, design, graphics or any other component to create a unique layout.
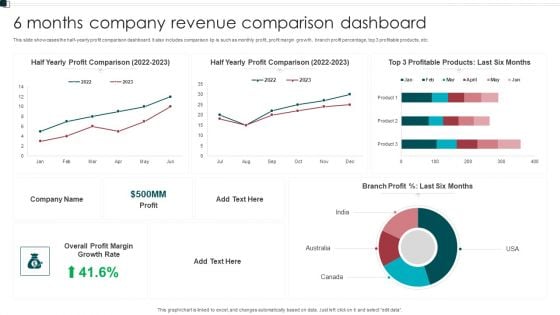
6 Months Company Revenue Comparison Dashboard Graphics PDF
This slide showcases the half yearly profit comparison dashboard. It also includes comparison kp is such as monthly profit, profit margin growth, branch profit percentage, top 3 profitable products, etc. Showcasing this set of slides titled 6 Months Company Revenue Comparison Dashboard Graphics PDF. The topics addressed in these templates are Growth Rate, Overall Profit Margin, Branch Profit. All the content presented in this PPT design is completely editable. Download it and make adjustments in color, background, font etc. as per your unique business setting.
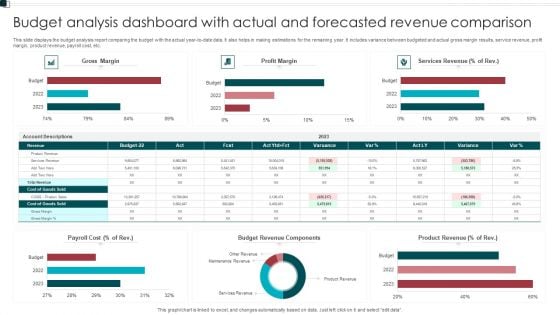
Budget Analysis Dashboard With Actual And Forecasted Revenue Comparison Structure PDF
This slide displays the budget analysis report comparing the budget with the actual year to date data. It also helps in making estimations for the remaining year. It includes variance between budgeted and actual gross margin results, service revenue, profit margin, product revenue, payroll cost, etc. Pitch your topic with ease and precision using this Budget Analysis Dashboard With Actual And Forecasted Revenue Comparison Structure PDF. This layout presents information on Payroll Cost, Budget Revenue Components, Product Revenue. It is also available for immediate download and adjustment. So, changes can be made in the color, design, graphics or any other component to create a unique layout.
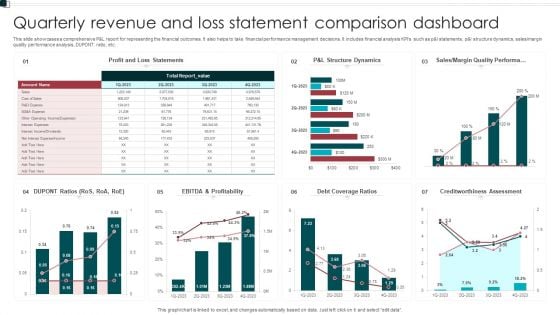
Quarterly Revenue And Loss Statement Comparison Dashboard Portrait PDF
This slide showcases a comprehensive P and L report for representing the financial outcomes. It also helps to take financial performance management decisions. It includes financial analysis KPIs such as p and l statements, p and l structure dynamics, sales or margin quality performance analysis, DUPONT ratio, etc. Showcasing this set of slides titled Quarterly Revenue And Loss Statement Comparison Dashboard Portrait PDF. The topics addressed in these templates are Profitability, Debt Coverage Ratios, Margin Quality Performa. All the content presented in this PPT design is completely editable. Download it and make adjustments in color, background, font etc. as per your unique business setting.
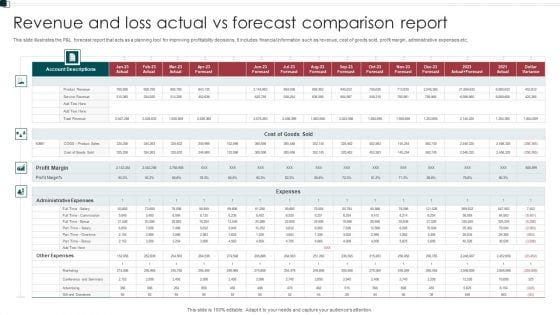
Revenue And Loss Actual Vs Forecast Comparison Report Demonstration PDF
Pitch your topic with ease and precision using this Revenue And Loss Actual Vs Forecast Comparison Report Demonstration PDF. This layout presents information on Profit Margin, Administrative Expenses, Cost Of Goods Sold. It is also available for immediate download and adjustment. So, changes can be made in the color, design, graphics or any other component to create a unique layout.
Robotic Process Automation Metrics Dashboard For Tracking Business Return On Investment Information PDF
This slide illustrates KPI Dashboard for measuring time and money saved after RPA deployment. It also include metrics for analysis such as productivity in robot hours, hours saved per process, money saved per process, etc. Pitch your topic with ease and precision using this Robotic Process Automation Metrics Dashboard For Tracking Business Return On Investment Information PDF. This layout presents information on Management, Goal, Productivity. It is also available for immediate download and adjustment. So, changes can be made in the color, design, graphics or any other component to create a unique layout.
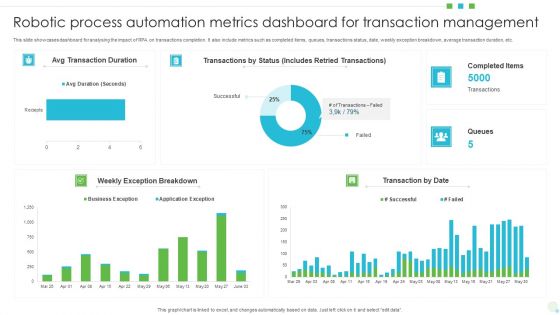
Robotic Process Automation Metrics Dashboard For Transaction Management Ideas PDF
This slide showcases dashboard for analysing the impact of RPA on transactions completion. It also include metrics such as completed items, queues, transactions status, date, weekly exception breakdown, average transaction duration, etc. Showcasing this set of slides titled Robotic Process Automation Metrics Dashboard For Transaction Management Ideas PDF. The topics addressed in these templates are Dashboard For Transaction Management, Robotic Process Automation Metrics. All the content presented in this PPT design is completely editable. Download it and make adjustments in color, background, font etc. as per your unique business setting.
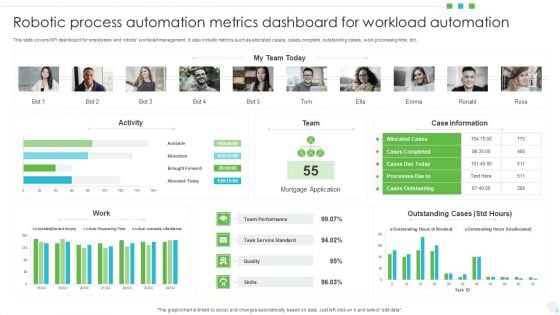
Robotic Process Automation Metrics Dashboard For Workload Automation Mockup PDF
This slide covers KPI dashboard for employees and robots workload management. It also include metrics such as allocated cases, cases complete, outstanding cases, work processing time, etc. Pitch your topic with ease and precision using this Robotic Process Automation Metrics Dashboard For Workload Automation Mockup PDF. This layout presents information on Mortgage Application, Team Performance, Case Information. It is also available for immediate download and adjustment. So, changes can be made in the color, design, graphics or any other component to create a unique layout.
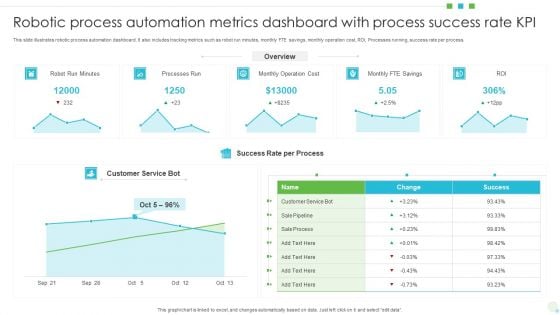
Robotic Process Automation Metrics Dashboard With Process Success Rate KPI Professional PDF
This slide illustrates robotic process automation dashboard. It also includes tracking metrics such as robot run minutes, monthly FTE savings, monthly operation cost, ROI, Processes running, success rate per process. Showcasing this set of slides titled Robotic Process Automation Metrics Dashboard With Process Success Rate KPI Professional PDF The topics addressed in these templates are Processes Run, Monthly Operation Cost, Customer Service Bot. All the content presented in this PPT design is completely editable. Download it and make adjustments in color, background, font etc. as per your unique business setting.
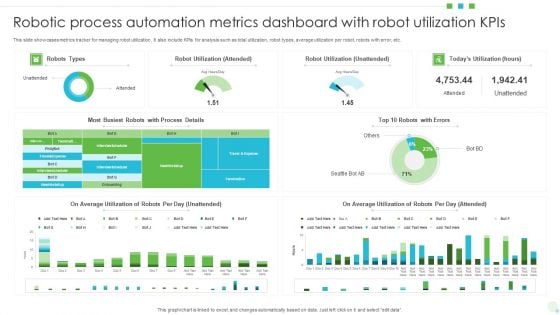
Robotic Process Automation Metrics Dashboard With Robot Utilization Kpis Background PDF
This slide showcases metrics tracker for managing robot utilization. It also include KPIs for analysis such as total utilization, robot types, average utilization per robot, robots with error, etc. Pitch your topic with ease and precision using this Robotic Process Automation Metrics Dashboard With Robot Utilization Kpis Background PDF. This layout presents information on Average Utilization, Robot Utilization, Automation Metrics Dashboard. It is also available for immediate download and adjustment. So, changes can be made in the color, design, graphics or any other component to create a unique layout.
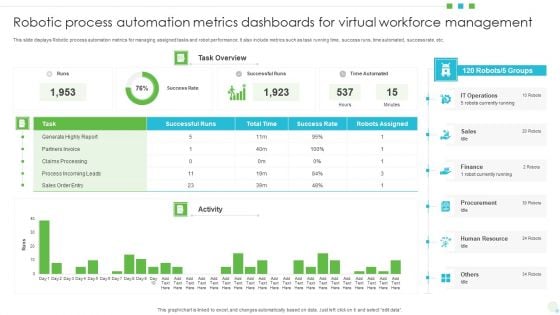
Robotic Process Automation Metrics Dashboards For Virtual Workforce Management Background PDF
This slide displays Robotic process automation metrics for managing assigned tasks and robot performance. It also include metrics such as task running time, success runs, time automated, success rate, etc. Showcasing this set of slides titled Robotic Process Automation Metrics Dashboards For Virtual Workforce Management Background PDF. The topics addressed in these templates are Finance, Sales, Human Resource. All the content presented in this PPT design is completely editable. Download it and make adjustments in color, background, font etc. as per your unique business setting.
Robotic Process Automation Metrics Tracker With Work Item Statistics Information PDF
This slide covers the RPA dashboard for analysing process data status. It also includes process details such as run success rate, inputs, processing, fail, output, robotic run minutes, total value generated, work items processed. Pitch your topic with ease and precision using this Robotic Process Automation Metrics Tracker With Work Item Statistics Information PDF. This layout presents information on Robotic Process Automation, Metrics Tracker, Work Item Statistics. It is also available for immediate download and adjustment. So, changes can be made in the color, design, graphics or any other component to create a unique layout.
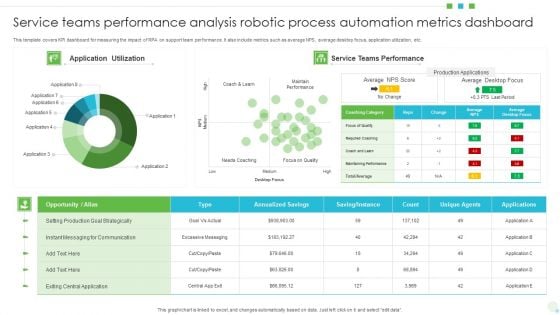
Service Teams Performance Analysis Robotic Process Automation Metrics Dashboard Brochure PDF
This template covers KPI dashboard for measuring the impact of RPA on support team performance. It also include metrics such as average NPS, average desktop focus, application utilization, etc. Showcasing this set of slides titled Service Teams Performance Analysis Robotic Process Automation Metrics Dashboard Brochure PDF. The topics addressed in these templates are Opportunity, Production Goal Strategically, Application Utilization. All the content presented in this PPT design is completely editable. Download it and make adjustments in color, background, font etc. as per your unique business setting.
Cloud Based Computing Analysis Cloud Performance Tracking Dashboard Structure PDF
This slide covers the key performance indicators for tracking performance of the cloud such as violations break down, sources, rules and severity. Get a simple yet stunning designed Cloud Based Computing Analysis Cloud Performance Tracking Dashboard Structure PDF. It is the best one to establish the tone in your meetings. It is an excellent way to make your presentations highly effective. So, download this PPT today from Slidegeeks and see the positive impacts. Our easy-to-edit Cloud Based Computing Analysis Cloud Performance Tracking Dashboard Structure PDF can be your go-to option for all upcoming conferences and meetings. So, what are you waiting for Grab this template today.
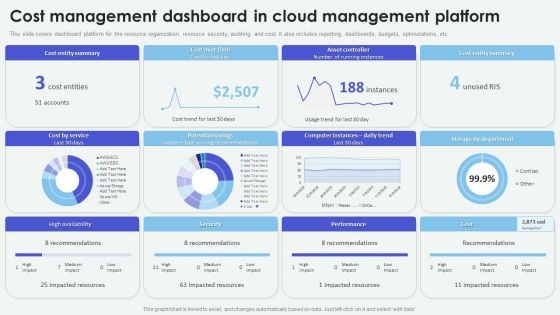
Cloud Based Computing Analysis Cost Management Dashboard In Cloud Management Formats PDF
Slidegeeks is here to make your presentations a breeze with Cloud Based Computing Analysis Cost Management Dashboard In Cloud Management Formats PDF With our easy-to-use and customizable templates, you can focus on delivering your ideas rather than worrying about formatting. With a variety of designs to choose from, youre sure to find one that suits your needs. And with animations and unique photos, illustrations, and fonts, you can make your presentation pop. So whether youre giving a sales pitch or presenting to the board, make sure to check out Slidegeeks first
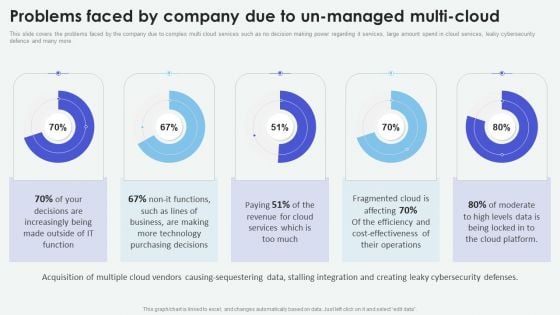
Cloud Based Computing Analysis Problems Faced By Company Due To Un Managed Guidelines PDF
This slide covers the problems faced by the company due to complex multi cloud services such as no decision making power regarding it services, large amount spend in cloud services, leaky cybersecurity defence and many more. The best PPT templates are a great way to save time, energy, and resources. Slidegeeks have 100 percent editable powerpoint slides making them incredibly versatile. With these quality presentation templates, you can create a captivating and memorable presentation by combining visually appealing slides and effectively communicating your message. Download Cloud Based Computing Analysis Problems Faced By Company Due To Un Managed Guidelines PDF from Slidegeeks and deliver a wonderful presentation.
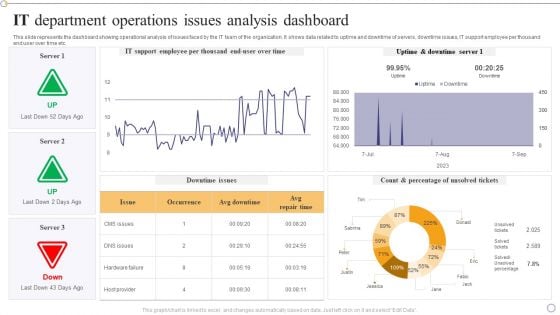
IT Department Operations Issues Analysis Dashboard Designs PDF
This slide represents the dashboard showing operational analysis of issues faced by the IT team of the organization. It shows data related to uptime and downtime of servers, downtime issues, IT support employee per thousand end user over time etc.Pitch your topic with ease and precision using this IT Department Operations Issues Analysis Dashboard Designs PDF. This layout presents information on Support Employee, Uptime Downtime, Percentage Unsolved. It is also available for immediate download and adjustment. So, changes can be made in the color, design, graphics or any other component to create a unique layout.
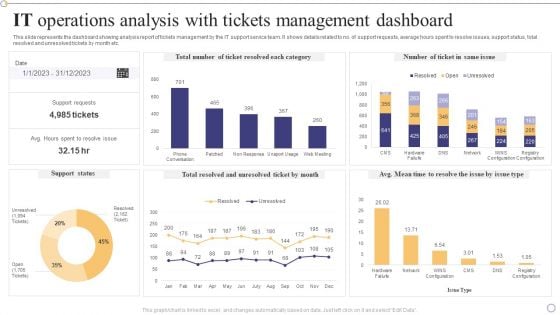
IT Operations Analysis With Tickets Management Dashboard Formats PDF
This slide represents the dashboard showing analysis report of tickets management by the IT support service team. It shows details related to no. of support requests, average hours spent to resolve issues, support status, total resolved and unresolved tickets by month etc.Showcasing this set of slides titled IT Operations Analysis With Tickets Management Dashboard Formats PDF. The topics addressed in these templates are Support Requests, Unresolved Ticket, Support Status. All the content presented in this PPT design is completely editable. Download it and make adjustments in color, background, font etc. as per your unique business setting.
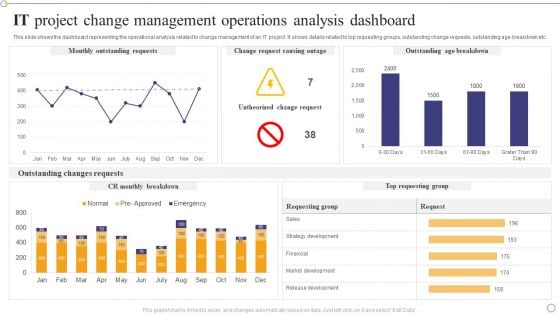
IT Project Change Management Operations Analysis Dashboard Infographics PDF
This slide shows the dashboard representing the operational analysis related to change management of an IT project. It shows details related to top requesting groups, outstanding change requests, outstanding age breakdown etc.Pitch your topic with ease and precision using this IT Project Change Management Operations Analysis Dashboard Infographics PDF. This layout presents information on Outstanding Requests, Outstanding Breakdown, Outstanding Changes. It is also available for immediate download and adjustment. So, changes can be made in the color, design, graphics or any other component to create a unique layout.
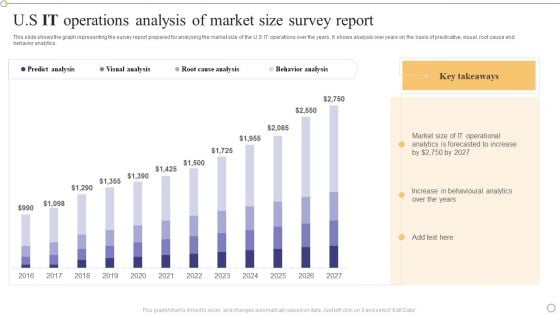
U S IT Operations Analysis Of Market Size Survey Report Guidelines PDF
This slide shows the graph representing the survey report prepared for analysing the market size of the U.S IT operations over the years. It shows analysis over years on the basis of predicative, visual, root cause and behavior analytics. Showcasing this set of slides titled U S IT Operations Analysis Of Market Size Survey Report Guidelines PDF. The topics addressed in these templates are Predict Analysis, Visual Analysis, Behavior Analysis. All the content presented in this PPT design is completely editable. Download it and make adjustments in color, background, font etc. as per your unique business setting.
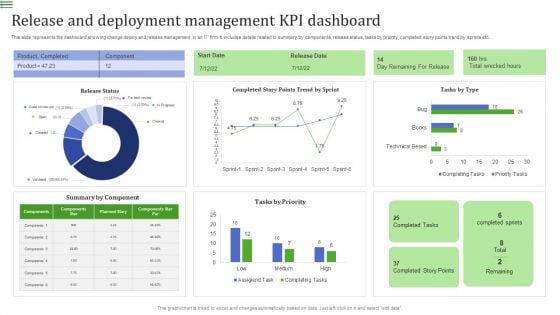
Release And Deployment Management KPI Dashboard Summary PDF
This slide represents the dashboard showing change deploy and release management in an IT firm. It includes details related to summary by components, release status, tasks by priority, completed story points trend by sprints etc.Showcasing this set of slides titled Release And Deployment Management KPI Dashboard Summary PDF. The topics addressed in these templates are Product Completed, Summary Component, Completed Story. All the content presented in this PPT design is completely editable. Download it and make adjustments in color, background, font etc. as per your unique business setting.

Monitoring Financial Transactions Software Market Highlights Topics PDF
This slide depicts highlights of transaction monitoring software market. It provides information about application market, sector wise market, continent, anti money laundering, manufacturing, scam detection, etc.Showcasing this set of slides titled Monitoring Financial Transactions Software Market Highlights Topics PDF. The topics addressed in these templates are Market Continent, Asia Pacific, Market Sector. All the content presented in this PPT design is completely editable. Download it and make adjustments in color, background, font etc. as per your unique business setting.

Digital Marketing Campaign Performance Monitoring Dashboard Pictures PDF
This slide represents the dashboard for measuring and monitoring the performance of digital marketing campaign. It includes information related to the advertisement cost, cost per conversion, no. of clicks, conversion rate, impressions, cost per click, click through rate and cost per thousand impressions of the project.Pitch your topic with ease and precision using this Digital Marketing Campaign Performance Monitoring Dashboard Pictures PDF. This layout presents information on Conversion Rate, Per Conversion, Cost Per Thousand. It is also available for immediate download and adjustment. So, changes can be made in the color, design, graphics or any other component to create a unique layout.

Manufactured Products Sales Performance Monitoring Dashboard Information PDF
This slide shows the dashboard the data related to the sales performance of the products manufactured by the organization in order to effectively measure and monitor the performance of the sales team. It shows details related to revenue generated and units sold etc.Pitch your topic with ease and precision using this Manufactured Products Sales Performance Monitoring Dashboard Information PDF. This layout presents information on Monthly Revenue, Manufactured Products, Sales Performance Monitoring. It is also available for immediate download and adjustment. So, changes can be made in the color, design, graphics or any other component to create a unique layout.
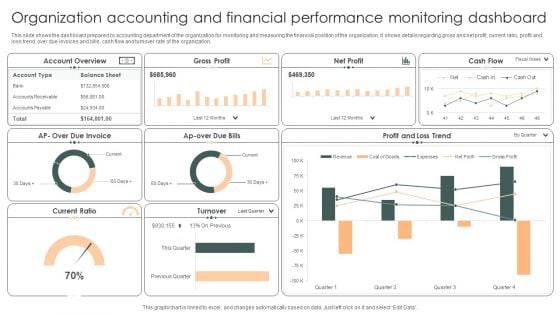
Organization Accounting And Financial Performance Monitoring Dashboard Pictures PDF
This slide shows the dashboard prepared by accounting department of the organization for monitoring and measuring the financial position of the organization. It shows details regarding gross and net profit, current ratio, profit and loss trend, over due invoices and bills, cash flow and turnover rate of the organization.Showcasing this set of slides titled Organization Accounting And Financial Performance Monitoring Dashboard Pictures PDF. The topics addressed in these templates are Account Overview, Due Invoice, Loss Trend. All the content presented in this PPT design is completely editable. Download it and make adjustments in color, background, font etc. as per your unique business setting.
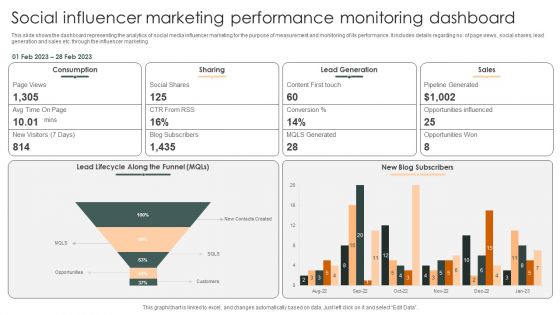
Social Influencer Marketing Performance Monitoring Dashboard Slides PDF
This slide shows the dashboard representing the analytics of social media influencer marketing for the purpose of measurement and monitoring of its performance. It includes details regarding no. of page views, social shares, lead generation and sales etc. through the influencer marketing.Pitch your topic with ease and precision using this Social Influencer Marketing Performance Monitoring Dashboard Slides PDF. This layout presents information on Lead Generation, Pipeline Generated, Opportunities Influenced. It is also available for immediate download and adjustment. So, changes can be made in the color, design, graphics or any other component to create a unique layout.

Website Elements To Enhance Purchasing Experience For Customers Summary PDF
The slide shows various website elements that develop a great purchasing experience for a customer. It includes features like clear product images, product reviews, product description, easy checkout process, easy search, simple navigation, payment options, product videos, etc. Showcasing this set of slides titled Website Elements To Enhance Purchasing Experience For Customers Summary PDF. The topics addressed in these templates are Website Elements To Enhance, Purchasing Experience For Customers. All the content presented in this PPT design is completely editable. Download it and make adjustments in color, background, font etc. as per your unique business setting.
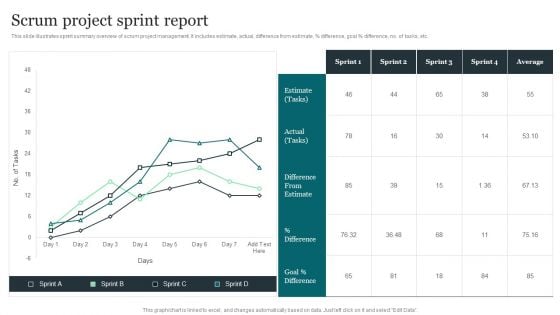
Scrum Project Sprint Report Guidelines PDF
This slide illustrates sprint summary overview of scrum project management. It includes estimate, actual, difference from estimate, percent difference, goal percent difference, no. of tasks, etc. Pitch your topic with ease and precision using this Scrum Project Sprint Report Guidelines PDF. This layout presents information on Scrum Project, Sprint Report. It is also available for immediate download and adjustment. So, changes can be made in the color, design, graphics or any other component to create a unique layout.
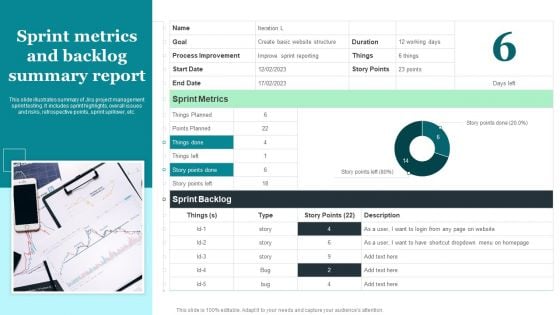
Sprint Metrics And Backlog Summary Report Brochure PDF
This slide illustrates summary of Jira project management sprint testing. It includes sprint highlights, overall issues and risks, retrospective points, sprint spillover, etc. Pitch your topic with ease and precision using this Sprint Metrics And Backlog Summary Report Brochure PDF. This layout presents information on Sprint Metrics And Backlog, Summary Report. It is also available for immediate download and adjustment. So, changes can be made in the color, design, graphics or any other component to create a unique layout.
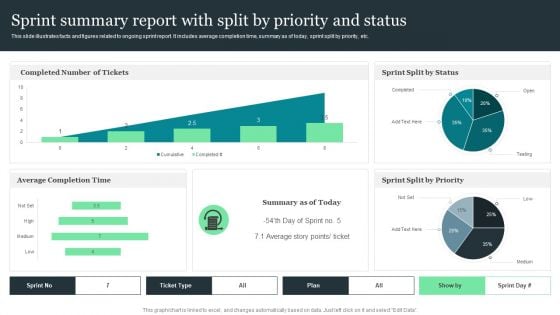
Sprint Summary Report With Split By Priority And Status Brochure PDF
This slide illustrates facts and figures related to ongoing sprint report. It includes average completion time, summary as of today, sprint split by priority, etc. Showcasing this set of slides titled Sprint Summary Report With Split By Priority And Status Brochure PDF. The topics addressed in these templates are Average Completion Time, Sprint Split By Priority, Sprint Split By Status. All the content presented in this PPT design is completely editable. Download it and make adjustments in color, background, font etc. as per your unique business setting.
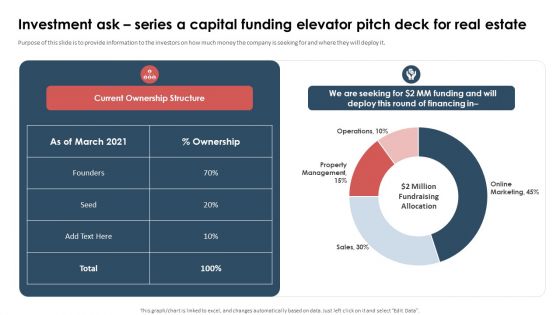
Investment Ask Series A Capital Funding Elevator Pitch Deck For Real Estate Slides PDF
Purpose of this slide is to provide information to the investors on how much money the company is seeking for and where they will deploy it. Presenting this PowerPoint presentation, titled Investment Ask Series A Capital Funding Elevator Pitch Deck For Real Estate Slides PDF, with topics curated by our researchers after extensive research. This editable presentation is available for immediate download and provides attractive features when used. Download now and captivate your audience. Presenting this Investment Ask Series A Capital Funding Elevator Pitch Deck For Real Estate Slides PDF. Our researchers have carefully researched and created these slides with all aspects taken into consideration. This is a completely customizable Investment Ask Series A Capital Funding Elevator Pitch Deck For Real Estate Slides PDF that is available for immediate downloading. Download now and make an impact on your audience. Highlight the attractive features available with our PPTs.
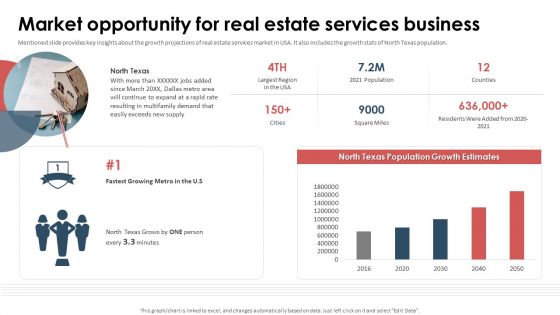
Series A Capital Funding Elevator Market Opportunity For Real Estate Services Business Formats PDF
Mentioned slide provides key insights about the growth projections of real estate services market in USA. It also includes the growth stats of North Texas population. Find a pre-designed and impeccable Series A Capital Funding Elevator Market Opportunity For Real Estate Services Business Formats PDF. The templates can ace your presentation without additional effort. You can download these easy-to-edit presentation templates to make your presentation stand out from others. So, what are you waiting for Download the template from Slidegeeks today and give a unique touch to your presentation.
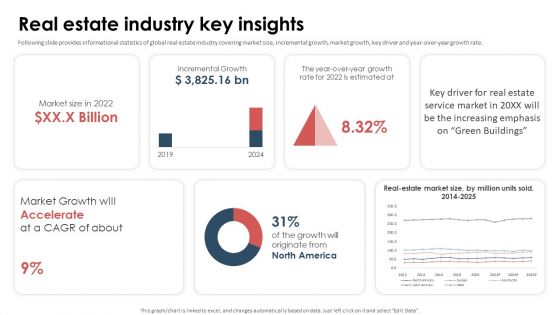
Series A Capital Funding Elevator Real Estate Industry Key Insights Ideas PDF
Following slide provides informational statistics of global real estate industry covering market size, incremental growth, market growth, key driver and year-over-year growth rate. Create an editable Series A Capital Funding Elevator Real Estate Industry Key Insights Ideas PDF that communicates your idea and engages your audience. Whether youre presenting a business or an educational presentation, pre-designed presentation templates help save time. Series A Capital Funding Elevator Real Estate Industry Key Insights Ideas PDF is highly customizable and very easy to edit, covering many different styles from creative to business presentations. Slidegeeks has creative team members who have crafted amazing templates. So, go and get them without any delay.
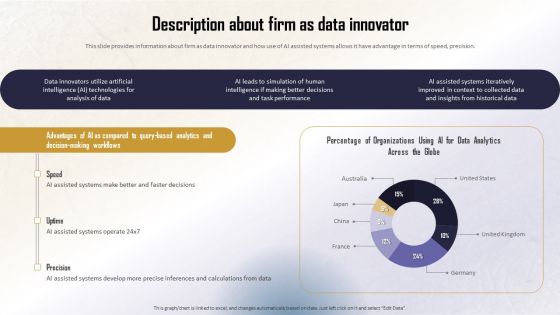
Identifying Direct And Indirect Description About Firm As Data Innovator Inspiration PDF
This slide provides information about firm as data innovator and how use of AI assisted systems allows it have advantage in terms of speed, precision. Slidegeeks is here to make your presentations a breeze with Identifying Direct And Indirect Description About Firm As Data Innovator Inspiration PDF With our easy-to-use and customizable templates, you can focus on delivering your ideas rather than worrying about formatting. With a variety of designs to choose from, youre sure to find one that suits your needs. And with animations and unique photos, illustrations, and fonts, you can make your presentation pop. So whether youre giving a sales pitch or presenting to the board, make sure to check out Slidegeeks first
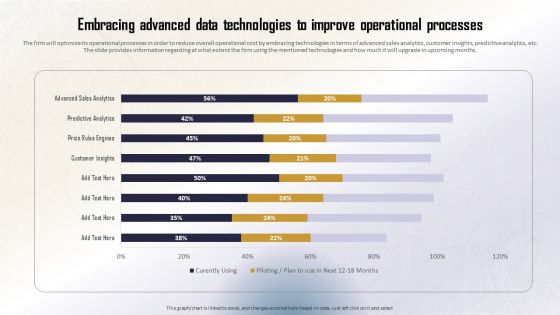
Identifying Direct And Indirect Embracing Advanced Data Technologies To Improve Guidelines PDF
The firm will optimize its operational processes in order to reduce overall operational cost by embracing technologies in terms of advanced sales analytics, customer insights, predictive analytics, etc. The slide provides information regarding at what extent the firm using the mentioned technologies and how much it will upgrade in upcoming months. Formulating a presentation can take up a lot of effort and time, so the content and message should always be the primary focus. The visuals of the PowerPoint can enhance the presenters message, so our Identifying Direct And Indirect Embracing Advanced Data Technologies To Improve Guidelines PDF was created to help save time. Instead of worrying about the design, the presenter can concentrate on the message while our designers work on creating the ideal templates for whatever situation is needed. Slidegeeks has experts for everything from amazing designs to valuable content, we have put everything into Identifying Direct And Indirect Embracing Advanced Data Technologies To Improve Guidelines PDF
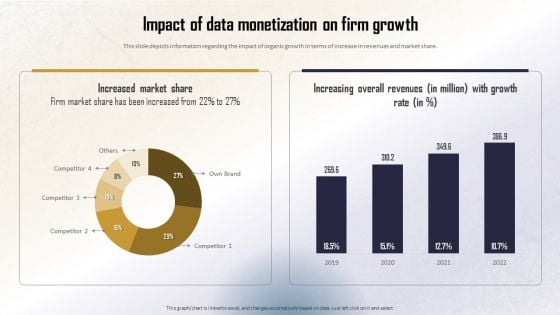
Identifying Direct And Indirect Impact Of Data Monetization On Firm Growth Inspiration PDF
This slide depicts information regarding the impact of organic growth in terms of increase in revenues and market share. This modern and well-arranged Identifying Direct And Indirect Impact Of Data Monetization On Firm Growth Inspiration PDF provides lots of creative possibilities. It is very simple to customize and edit with the Powerpoint Software. Just drag and drop your pictures into the shapes. All facets of this template can be edited with Powerpoint, no extra software is necessary. Add your own material, put your images in the places assigned for them, adjust the colors, and then you can show your slides to the world, with an animated slide included.
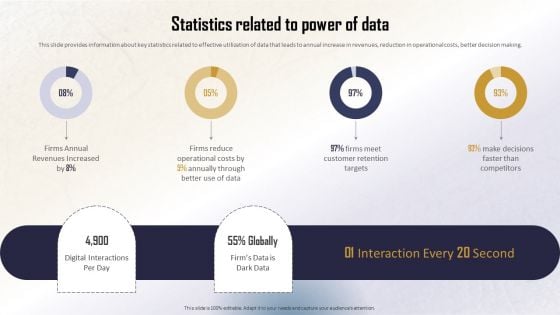
Identifying Direct And Indirect Statistics Related To Power Of Data Download PDF
This slide provides information about key statistics related to effective utilization of data that leads to annual increase in revenues, reduction in operational costs, better decision making. This Identifying Direct And Indirect Statistics Related To Power Of Data Download PDF from Slidegeeks makes it easy to present information on your topic with precision. It provides customization options, so you can make changes to the colors, design, graphics, or any other component to create a unique layout. It is also available for immediate download, so you can begin using it right away. Slidegeeks has done good research to ensure that you have everything you need to make your presentation stand out. Make a name out there for a brilliant performance.
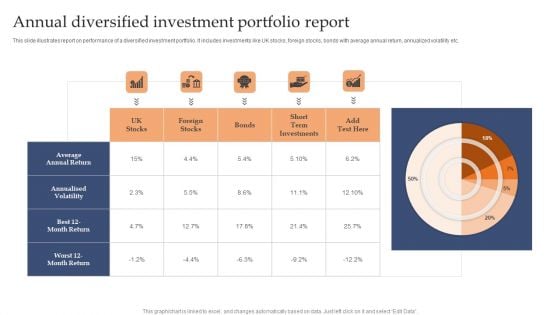
Annual Diversified Investment Portfolio Report Introduction PDF
This slide illustrates report on performance of a diversified investment portfolio. It includes investments like UK stocks, foreign stocks, bonds with average annual return, annualized volatility etc.Pitch your topic with ease and precision using this Annual Diversified Investment Portfolio Report Introduction PDF. This layout presents information on Foreign Stocks, Month Return, Term Investments. It is also available for immediate download and adjustment. So, changes can be made in the color, design, graphics or any other component to create a unique layout.
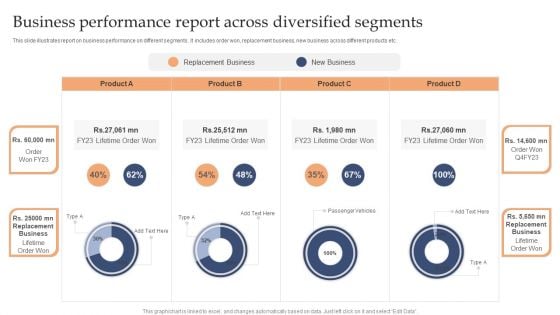
Business Performance Report Across Diversified Segments Microsoft PDF
This slide illustrates report on business performance on different segments . It includes order won, replacement business, new business across different products etc.Pitch your topic with ease and precision using this Business Performance Report Across Diversified Segments Microsoft PDF. This layout presents information on Replacement Business, New Business, Replacement Business. It is also available for immediate download and adjustment. So, changes can be made in the color, design, graphics or any other component to create a unique layout.
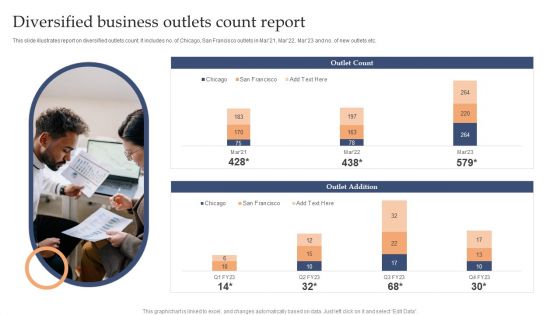
Diversified Business Outlets Count Report Background PDF
This slide illustrates report on diversified outlets count. It includes no. of Chicago, San Francisco outlets in Mar21, Mar22, Mar23 and no. of new outlets etc.Pitch your topic with ease and precision using this Diversified Business Outlets Count Report Background PDF. This layout presents information on Outlet Count, Outlet Addition, Chicago. It is also available for immediate download and adjustment. So, changes can be made in the color, design, graphics or any other component to create a unique layout.
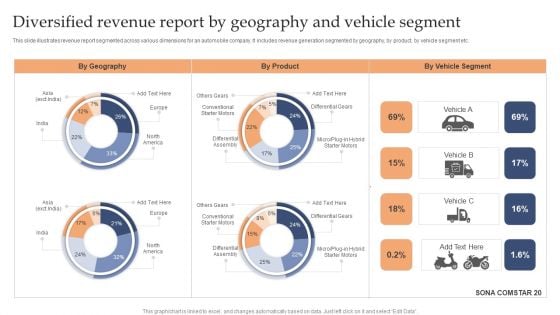
Diversified Revenue Report By Geography And Vehicle Segment Background PDF
This slide illustrates revenue report segmented across various dimensions for an automobile company. It includes revenue generation segmented by geography, by product, by vehicle segment etc.Showcasing this set of slides titled Diversified Revenue Report By Geography And Vehicle Segment Background PDF. The topics addressed in these templates are Vehicle Segment, Conventional Starter, Differential Assembly. All the content presented in this PPT design is completely editable. Download it and make adjustments in color, background, font etc. as per your unique business setting.
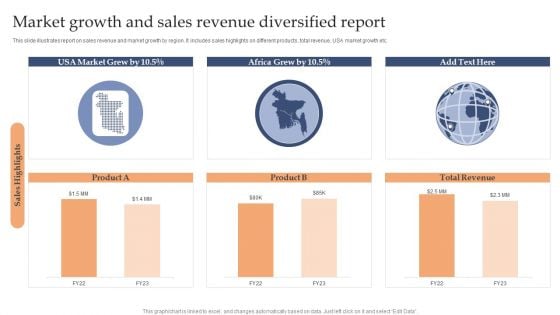
Market Growth And Sales Revenue Diversified Report Sample PDF
This slide illustrates report on sales revenue and market growth by region. It includes sales highlights on different products, total revenue, USA market growth etc.Pitch your topic with ease and precision using this Market Growth And Sales Revenue Diversified Report Sample PDF. This layout presents information on Market Grew, Africa Grew, Total Revenue. It is also available for immediate download and adjustment. So, changes can be made in the color, design, graphics or any other component to create a unique layout.
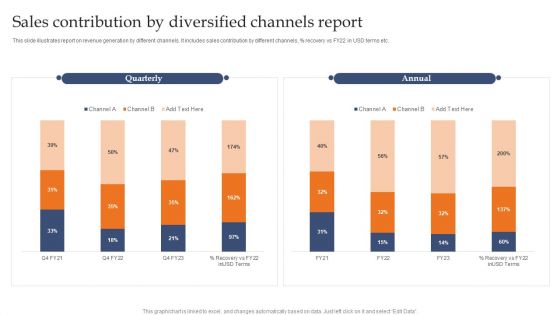
Sales Contribution By Diversified Channels Report Demonstration PDF
This slide illustrates report on revenue generation by different channels. It includes sales contribution by different channels, precent recovery vs FY22 in USD terms etc.Pitch your topic with ease and precision using this Sales Contribution By Diversified Channels Report Demonstration PDF. This layout presents information on Quarterly, Annual, Channel. It is also available for immediate download and adjustment. So, changes can be made in the color, design, graphics or any other component to create a unique layout.
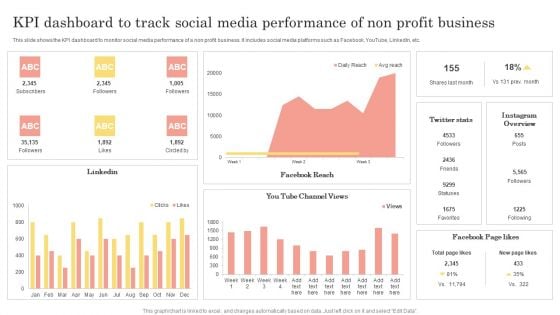
Kpi Dashboard To Track Social Media Performance Of Non Profit Business Portrait PDF
This slide shows the KPI dashboard to monitor social media performance of a non profit business. It includes social media platforms such as Facebook, YouTube, LinkedIn, etc. Showcasing this set of slides titled Kpi Dashboard To Track Social Media Performance Of Non Profit Business Portrait PDF. The topics addressed in these templates are Channel Views, Instagram Overview, Favorites. All the content presented in this PPT design is completely editable. Download it and make adjustments in color, background, font etc. as per your unique business setting.
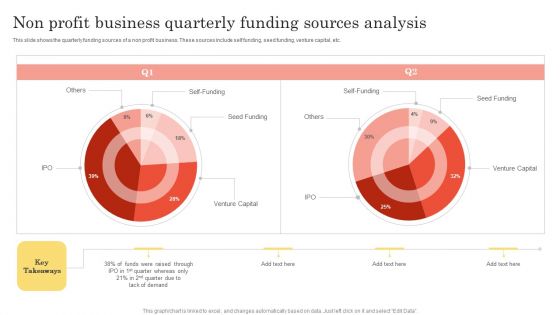
Non Profit Business Quarterly Funding Sources Analysis Infographics PDF
This slide shows the quarterly funding sources of a non profit business. These sources include self funding, seed funding, venture capital, etc. Pitch your topic with ease and precision using this Non Profit Business Quarterly Funding Sources Analysis Infographics PDF. This layout presents information on Venture Capital, Seed Funding, Quarter Whereas. It is also available for immediate download and adjustment. So, changes can be made in the color, design, graphics or any other component to create a unique layout.
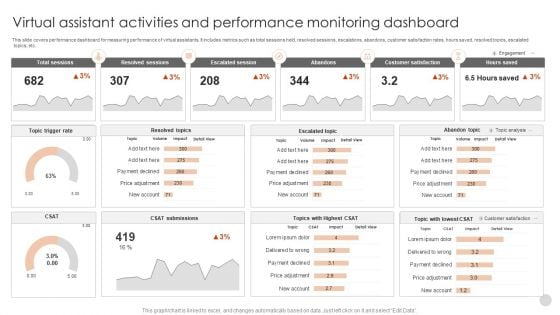
Virtual Assistant Activities And Performance Monitoring Dashboard Guidelines PDF
This slide covers performance dashboard for measuring performance of virtual assistants. It includes metrics such as total sessions held, resolved sessions, escalations, abandons, customer satisfaction rates, hours saved, resolved topics, escalated topics, etc.Pitch your topic with ease and precision using this Virtual Assistant Activities And Performance Monitoring Dashboard Guidelines PDF. This layout presents information on Total Sessions, Resolved Sessions, Escalated Session. It is also available for immediate download and adjustment. So, changes can be made in the color, design, graphics or any other component to create a unique layout.
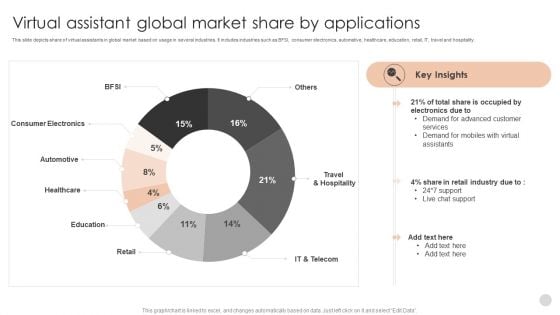
Virtual Assistant Global Market Share By Applications Infographics PDF
This slide depicts share of virtual assistants in global market based on usage in several industries. It includes industries such as BFSI, consumer electronics, automative, healthcare, education, retail, IT, travel and hospitality. Showcasing this set of slides titled Virtual Assistant Global Market Share By Applications Infographics PDF. The topics addressed in these templates are Consumer Electronics, Automotive, Demand Advanced. All the content presented in this PPT design is completely editable. Download it and make adjustments in color, background, font etc. as per your unique business setting.
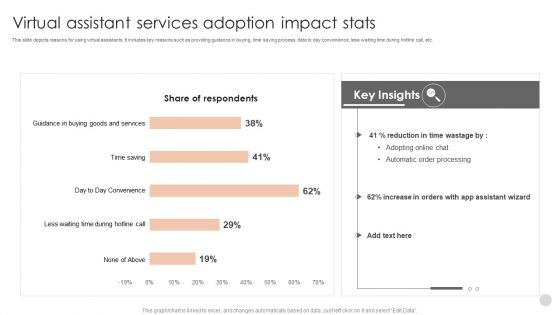
Virtual Assistant Services Adoption Impact Stats Structure PDF
This slide depicts reasons for using virtual assistants. It includes key reasons such as providing guidance in buying, time saving process, data to day convenience, less waiting time during hotline call, etc.Pitch your topic with ease and precision using this Virtual Assistant Services Adoption Impact Stats Structure PDF. This layout presents information on Automatic Order Processing, Assistant Wizard, Guidance Buying. It is also available for immediate download and adjustment. So, changes can be made in the color, design, graphics or any other component to create a unique layout.
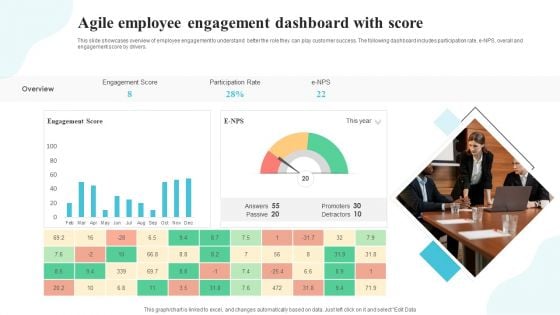
Agile Employee Engagement Dashboard With Score Introduction PDF
This slide showcases overview of employee engagement to understand better the role they can play customer success. The following dashboard includes participation rate, e-NPS, overall and engagement score by drivers. Showcasing this set of slides titled Agile Employee Engagement Dashboard With Score Introduction PDF. The topics addressed in these templates are Agile Employee Engagement, Dashboard With Score. All the content presented in this PPT design is completely editable. Download it and make adjustments in color, background, font etc. as per your unique business setting.
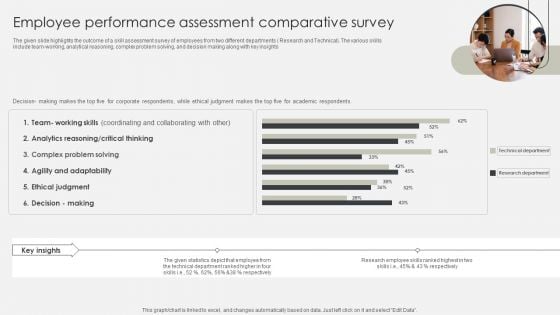
Employee Performance Assessment Comparative Survey Ideas PDF
The given slide highlights the outcome of a skill assessment survey of employees from two different departments Research and Technical. The various skills include team-working, analytical reasoning, complex problem solving, and decision making along with key insights. Pitch your topic with ease and precision using this Employee Performance Assessment Comparative Survey Ideas PDF. This layout presents information on Agility And Adaptability, Team, Research Department. It is also available for immediate download and adjustment. So, changes can be made in the color, design, graphics or any other component to create a unique layout.

Employee Performance Assessment Survey Conclusion Portrait PDF
This slide illustrates the statistical results of a survey conducted by an organization to assess an employee on the basis of their soft skills to make required improvements. The skills include communication, organization, teamwork, and so on. Showcasing this set of slides titled Employee Performance Assessment Survey Conclusion Portrait PDF. The topics addressed in these templates are Teamwork, Organization, Communication All the content presented in this PPT design is completely editable. Download it and make adjustments in color, background, font etc. as per your unique business setting.

Market Demand Equilibrium Gap In Electronic Graphics PDF
This slide showcase statistical data of demand and supply in electronic market with CAGR. It includes key insides that explain huge gap between demand and supply Showcasing this set of slides titled Market Demand Equilibrium Gap In Electronic Graphics PDF. The topics addressed in these templates are Demand, Domestic Supply Average, Production. All the content presented in this PPT design is completely editable. Download it and make adjustments in color, background, font etc. as per your unique business setting.
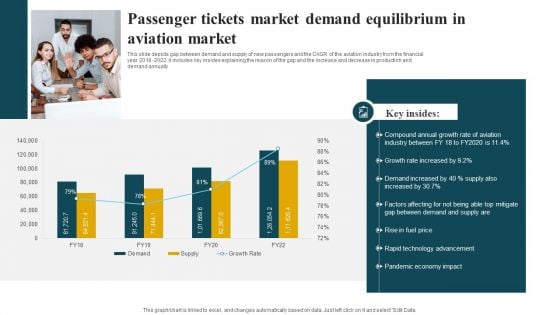
Passenger Tickets Market Demand Equilibrium In Aviation Market Guidelines PDF
This slide depicts gap between demand and supply of new passengers and the CAGR of the aviation industry from the financial year 2018 2022. it includes key insides explaining the reason of the gap and the increase and decrease in production and demand annually. Showcasing this set of slides titled Passenger Tickets Market Demand Equilibrium In Aviation Market Guidelines PDF. The topics addressed in these templates are Growth Rate, Industry, Demand. All the content presented in this PPT design is completely editable. Download it and make adjustments in color, background, font etc. as per your unique business setting.
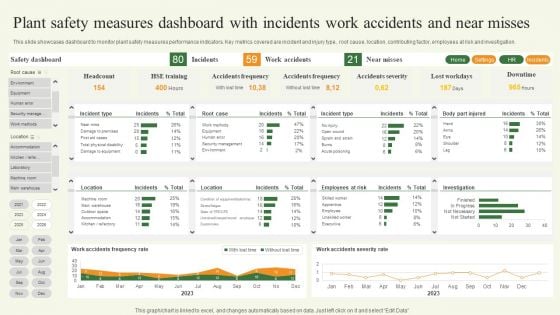
Plant Safety Measures Dashboard With Incidents Work Accidents And Near Misses Template PDF
This slide showcases dashboard to monitor plant safety measures performance indicators. Key metrics covered are incident and injury type, root cause, location, contributing factor, employees at risk and investigation. Pitch your topic with ease and precision using this Plant Safety Measures Dashboard With Incidents Work Accidents And Near Misses Template PDF. This layout presents information on Plant Safety Measures Dashboard, Incidents Work Accidents. It is also available for immediate download and adjustment. So, changes can be made in the color, design, graphics or any other component to create a unique layout.
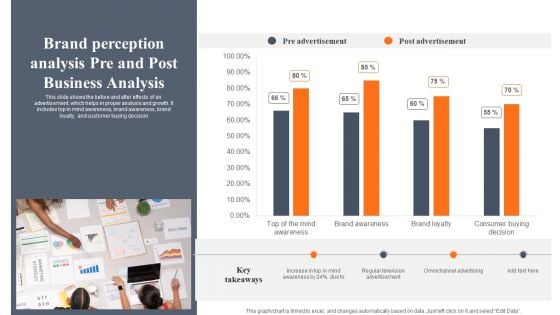
Brand Perception Analysis Pre And Post Business Analysis Designs PDF
This slide shows the before and after effects of an advertisement, which helps in proper analysis and growth. It includes top in mind awareness, brand awareness, brand loyalty, and customer buying decision. Pitch your topic with ease and precision using this Brand Perception Analysis Pre And Post Business Analysis Designs PDF. This layout presents information on Pre Advertisement, Post Advertisement, Awareness. It is also available for immediate download and adjustment. So, changes can be made in the color, design, graphics or any other component to create a unique layout.
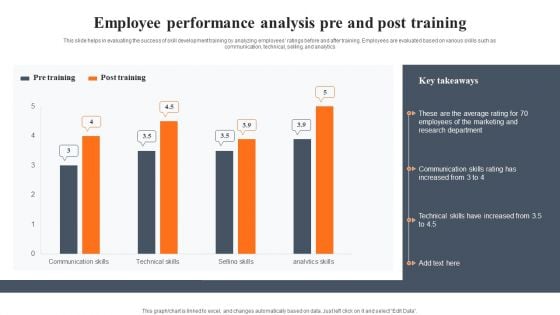
Employee Performance Analysis Pre And Post Training Information PDF
This slide helps in evaluating the success of skill development training by analyzing employees ratings before and after training. Employees are evaluated based on various skills such as communication, technical, selling, and analytics. Showcasing this set of slides titled Employee Performance Analysis Pre And Post Training Information PDF. The topics addressed in these templates are Average, Marketing, Employees. All the content presented in this PPT design is completely editable. Download it and make adjustments in color, background, font etc. as per your unique business setting.
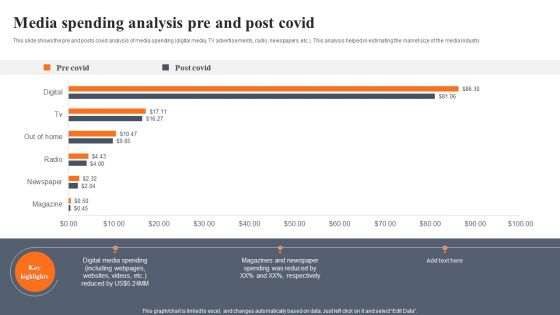
Media Spending Analysis Pre And Post Covid Elements PDF
This slide shows the pre and posts covid analysis of media spending digital media, TV advertisements, radio, newspapers, etc. This analysis helped in estimating the market size of the media industry. Pitch your topic with ease and precision using this Media Spending Analysis Pre And Post Covid Elements PDF. This layout presents information on Media Spending Analysis, Pre And Post Covid. It is also available for immediate download and adjustment. So, changes can be made in the color, design, graphics or any other component to create a unique layout.
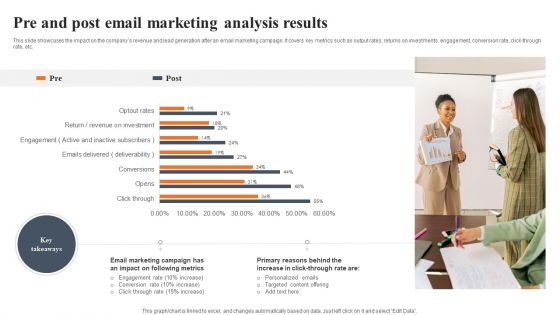
Pre And Post Email Marketing Analysis Results Slides PDF
This slide showcases the impact on the companys revenue and lead generation after an email marketing campaign. It covers key metrics such as output rates, returns on investments, engagement, conversion rate, click through rate, etc. Pitch your topic with ease and precision using this Pre And Post Email Marketing Analysis Results Slides PDF. This layout presents information on Email Marketing Campaign, Following Metrics, Targeted Content Offering. It is also available for immediate download and adjustment. So, changes can be made in the color, design, graphics or any other component to create a unique layout.
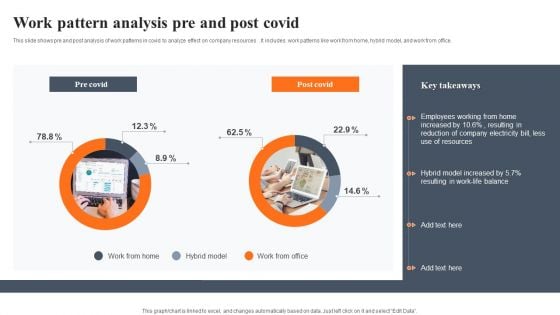
Work Pattern Analysis Pre And Post Covid Pictures PDF
This slide shows pre and post analysis of work patterns in covid to analyze effect on company resources . It includes work patterns like work from home, hybrid model, and work from office. Pitch your topic with ease and precision using this Work Pattern Analysis Pre And Post Covid Pictures PDF. This layout presents information on Work Pattern Analysis, Pre And Post Covid. It is also available for immediate download and adjustment. So, changes can be made in the color, design, graphics or any other component to create a unique layout.

 Home
Home