Plan Icon
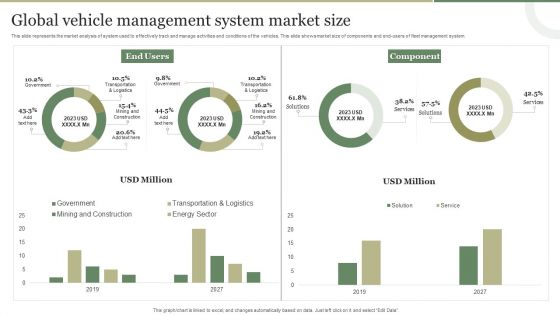
Global Vehicle Management System Market Size Guidelines PDF
This slide represents the market analysis of system used to effectively track and manage activities and conditions of the vehicles. This slide shows market size of components and end-users of fleet management system. Pitch your topic with ease and precision using this Global Vehicle Management System Market Size Guidelines PDF. This layout presents information on Global Vehicle, Management System, Market Size. It is also available for immediate download and adjustment. So, changes can be made in the color, design, graphics or any other component to create a unique layout.
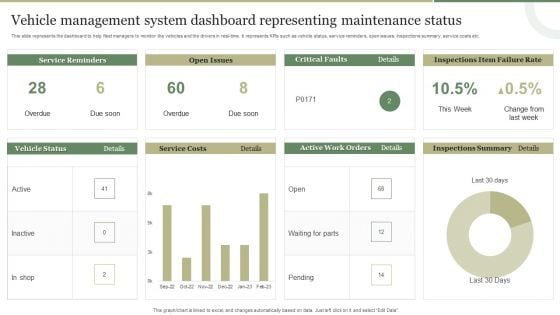
Vehicle Management System Dashboard Representing Maintenance Status Template PDF
This slide represents the dashboard representing the key metrics of the vehicle management system to monitor the vehicles and drivers in real-time. It includes key metrics such as service reminders, fuel costs, open issues, recent comments etc. Pitch your topic with ease and precision using this Vehicle Management System Dashboard Representing Maintenance Status Template PDF This layout presents information on Fuel Costs, Total Cost, Service Reminder, Recent Comments. It is also available for immediate download and adjustment. So, changes can be made in the color, design, graphics or any other component to create a unique layout.
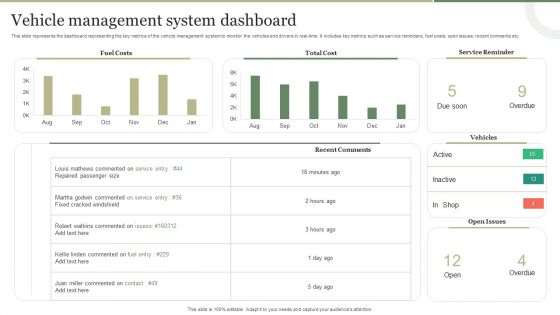
Vehicle Management System Dashboard Graphics PDF
This slide represents the dashboard to help fleet managers to monitor the vehicles and the drivers in real-time. It represents KPIs such as vehicle status, service reminders, open issues, inspections summary, service costs etc. Pitch your topic with ease and precision using this Vehicle Management System Dashboard Graphics PDF. This layout presents information on Vehicle Management System, Representing Maintenance Status. It is also available for immediate download and adjustment. So, changes can be made in the color, design, graphics or any other component to create a unique layout.
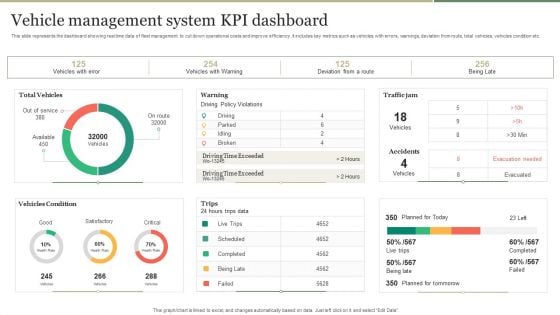
Vehicle Management System KPI Dashboard Introduction PDF
This slide represents the dashboard showing real time data of fleet management to cut down operational costs and improve efficiency. It includes key metrics such as vehicles with errors, warnings, deviation from route, total vehicles, vehicles condition etc. Pitch your topic with ease and precision using this Vehicle Management System KPI Dashboard Introduction PDF. This layout presents information on Vehicle Management System, KPI Dashboard. It is also available for immediate download and adjustment. So, changes can be made in the color, design, graphics or any other component to create a unique layout.
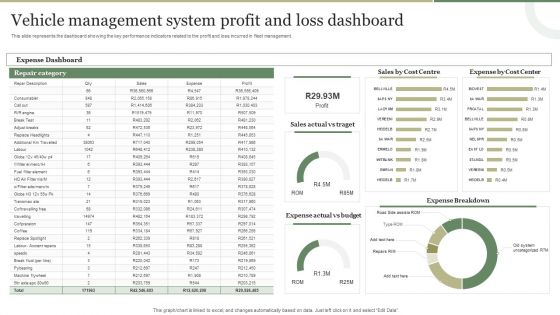
Vehicle Management System Profit And Loss Dashboard Brochure PDF
This slide represents the dashboard showing the key performance indicators related to the profit and loss incurred in fleet management. Showcasing this set of slides titled Vehicle Management System Profit And Loss Dashboard Brochure PDF. The topics addressed in these templates are Vehicle Management System, Profit And Loss Dashboard. All the content presented in this PPT design is completely editable. Download it and make adjustments in color, background, font etc. as per your unique business setting.
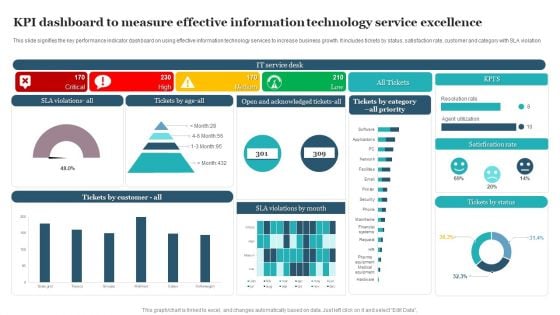
KPI Dashboard To Measure Effective Information Technology Service Excellence Information PDF
This slide signifies the key performance indicator dashboard on using effective information technology services to increase business growth. It includes tickets by status, satisfaction rate, customer and category with SLA violation. Showcasing this set of slides titled KPI Dashboard To Measure Effective Information Technology Service Excellence Information PDF. The topics addressed in these templates are Satisfication Rate, Tickets Status, Service Desk. All the content presented in this PPT design is completely editable. Download it and make adjustments in color, background, font etc. as per your unique business setting.
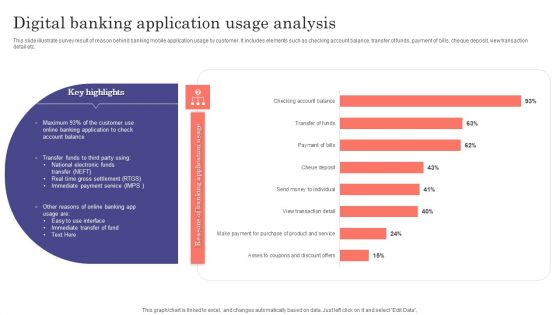
Digital Banking Application Usage Analysis Ppt Portfolio Layouts PDF
This slide illustrate survey result of reason behind banking mobile application usage by customer. It includes elements such as checking account balance, transfer of funds, payment of bills, cheque deposit, view transaction detail etc. Showcasing this set of slides titled Digital Banking Application Usage Analysis Ppt Portfolio Layouts PDF. The topics addressed in these templates are Key Highlights, Application To Check, Account Balance. All the content presented in this PPT design is completely editable. Download it and make adjustments in color, background, font etc. as per your unique business setting.
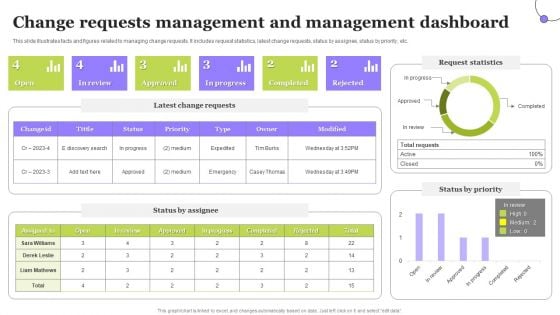
Change Requests Management And Management Dashboard Clipart PDF
This slide illustrates facts and figures related to managing change requests. It includes request statistics, latest change requests, status by assignee, status by priority, etc. Pitch your topic with ease and precision using this Change Requests Management And Management Dashboard Clipart PDF. This layout presents information on Status By Assignee, Status By Priority, Request Statistics. It is also available for immediate download and adjustment. So, changes can be made in the color, design, graphics or any other component to create a unique layout.
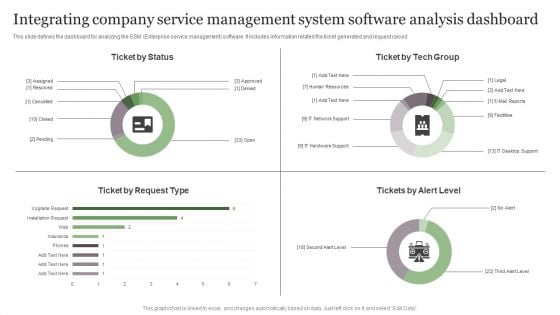
Integrating Company Service Management System Software Analysis Dashboard Microsoft PDF
This slide defines the dashboard for analyzing the enterprise service management performance. It includes information related the ticket, incidents, service request and tasks. Showcasing this set of slides titled Integrating Company Service Management System Software Analysis Dashboard Microsoft PDF. The topics addressed in these templates are Tickets Per Queue, Agreements Breached Per, Tickets Per Status. All the content presented in this PPT design is completely editable. Download it and make adjustments in color, background, font etc. as per your unique business setting.
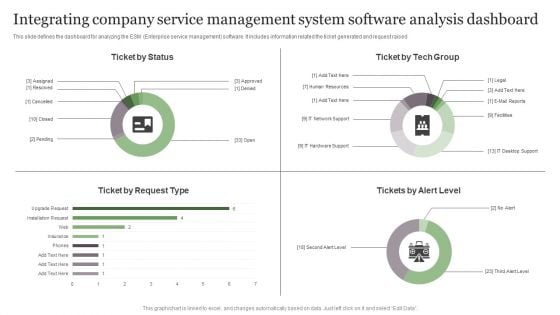
Integrating Company Service Management System Software Analysis Dashboard Graphics PDF
This slide defines the dashboard for analyzing the ESM Enterprise service management software. It includes information related the ticket generated and request raised. Showcasing this set of slides titled Integrating Company Service Management System Software Analysis Dashboard Graphics PDF. The topics addressed in these templates are Ticket By Status, Ticket Request Type, Ticket Tech Group. All the content presented in this PPT design is completely editable. Download it and make adjustments in color, background, font etc. as per your unique business setting.
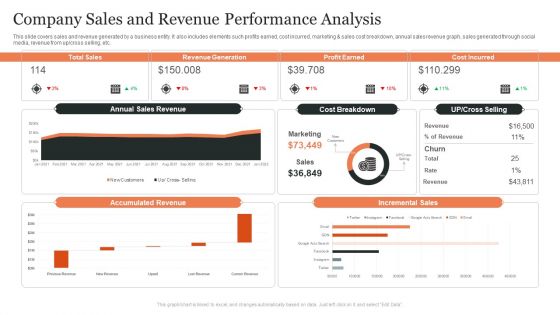
Company Sales And Revenue Performance Analysis Ppt Ideas Format PDF
This slide covers sales and revenue generated by a business entity. It also includes elements such profits earned, cost incurred, marketing and sales cost breakdown, annual sales revenue graph, sales generated through social media, revenue from up OR cross selling, etc. Pitch your topic with ease and precision using this Company Sales And Revenue Performance Analysis Ppt Ideas Format PDF. This layout presents information on Total Sales, Revenue Generation, Profit Earned, Cost Incurred. It is also available for immediate download and adjustment. So, changes can be made in the color, design, graphics or any other component to create a unique layout.
Employee Performance Analysis Tracking Scorecard Ppt Summary Influencers PDF
This slide covers overall performance score of employee appraised by reporting manager. It includes scores based on metrics such as departmental performance, downtime, efficiency, setup, utilization, quality failures as per goals, actual output etc. Showcasing this set of slides titled Employee Performance Analysis Tracking Scorecard Ppt Summary Influencers PDF. The topics addressed in these templates are Employee Performance Card, Actual Performance, Goal. All the content presented in this PPT design is completely editable. Download it and make adjustments in color, background, font etc. as per your unique business setting.
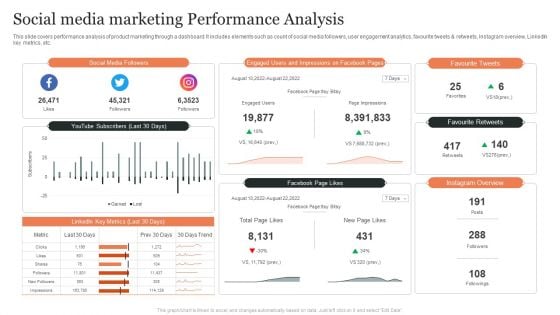
Social Media Marketing Performance Analysis Ppt Inspiration Smartart PDF
This slide covers performance analysis of product marketing through a dashboard. It includes elements such as count of social media followers, user engagement analytics, favourite tweets and retweets, Instagram overview, LinkedIn key metrics, etc. Showcasing this set of slides titled Social Media Marketing Performance Analysis Ppt Inspiration Smartart PDF. The topics addressed in these templates are Social Media Followers, Favourite Tweets, Favourite Retweets, Instagram Overview. All the content presented in this PPT design is completely editable. Download it and make adjustments in color, background, font etc. as per your unique business setting.
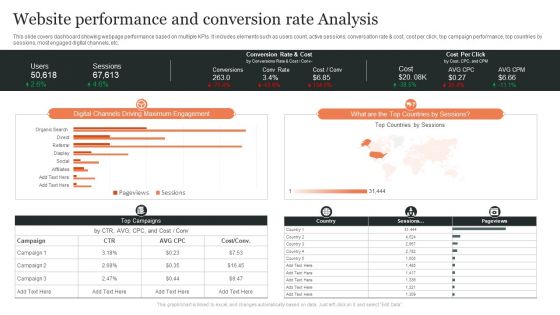
Website Performance And Conversion Rate Analysis Ppt Slides Inspiration PDF
This slide covers dashboard showing webpage performance based on multiple KPIs. It includes elements such as users count, active sessions, conversation rate and cost, cost per click, top campaign performance, top countries by sessions, most engaged digital channels, etc. Showcasing this set of slides titled Website Performance And Conversion Rate Analysis Ppt Slides Inspiration PDF. The topics addressed in these templates are Digital Channels, Driving Maximum, Engagement. All the content presented in this PPT design is completely editable. Download it and make adjustments in color, background, font etc. as per your unique business setting.
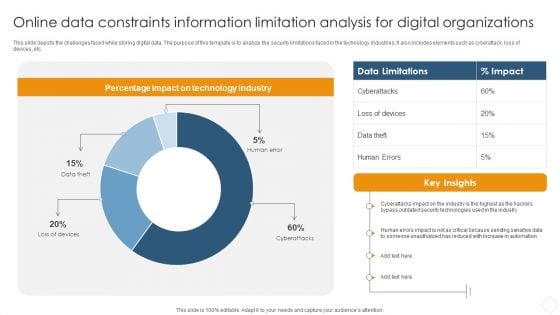
Online Data Constraints Information Limitation Analysis For Digital Organizations Information PDF
This slide depicts the challenges faced while storing digital data. The purpose of this template is to analyze the security limitations faced in the technology industries. It also includes elements such as cyberattack, loss of devices, etc.Pitch your topic with ease and precision using this Online Data Constraints Information Limitation Analysis For Digital Organizations Information PDF. This layout presents information on Percentage Impact, Technology Industry, Security Technologies. It is also available for immediate download and adjustment. So, changes can be made in the color, design, graphics or any other component to create a unique layout.
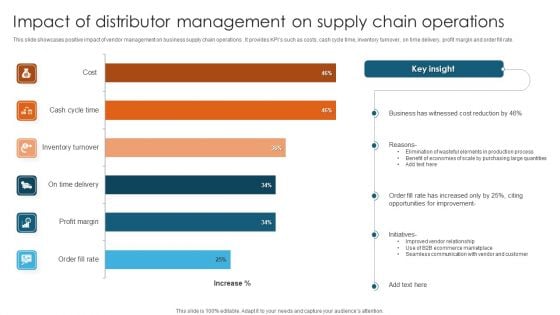
Impact Of Distributor Management On Supply Chain Operations Brochure PDF
This slide showcases positive impact of vendor management on business supply chain operations . It provides KPIs such as costs, cash cycle time, inventory turnover, on time delivery, profit margin and order fill rate.Showcasing this set of slides titled Impact Of Distributor Management On Supply Chain Operations Brochure PDF. The topics addressed in these templates are Business Witnessed, Elimination Wasteful, Opportunities Improvement. All the content presented in this PPT design is completely editable. Download it and make adjustments in color, background, font etc. as per your unique business setting.
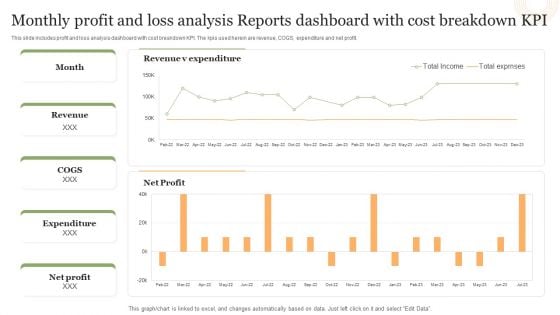
Monthly Profit And Loss Analysis Reports Dashboard With Cost Breakdown Kpi Structure PDF
This slide includes profit and loss analysis dashboard with cost breakdown KPI. The kpis used herein are revenue, COGS, expenditure and net profit.Pitch your topic with ease and precision using this Monthly Profit And Loss Analysis Reports Dashboard With Cost Breakdown Kpi Structure PDF. This layout presents information on Revenue Expenditure, Net Profit, Total Exprnses. It is also available for immediate download and adjustment. So, changes can be made in the color, design, graphics or any other component to create a unique layout.
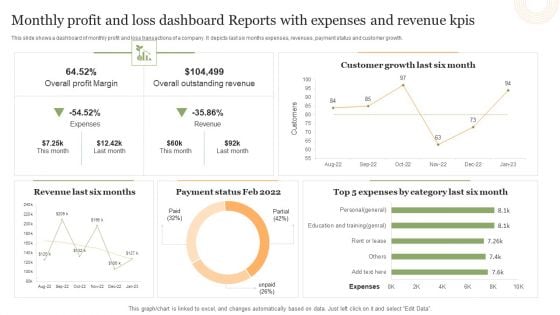
Monthly Profit And Loss Dashboard Reports With Expenses And Revenue Kpis Portrait PDF
This slide shows a dashboard of monthly profit and loss transactions of a company. It depicts last six months expenses, revenues, payment status and customer growth.Showcasing this set of slides titled Monthly Profit And Loss Dashboard Reports With Expenses And Revenue Kpis Portrait PDF. The topics addressed in these templates are Overall Profit Margin, Overall Outstanding Revenue, Customer Growth. All the content presented in this PPT design is completely editable. Download it and make adjustments in color, background, font etc. as per your unique business setting.

Monthly Profit And Loss Statement Reports Analysis Dashboard Brochure PDF
This slide shows a monthly profit and loss statement dashboard. The constituting elements herein are total net revenue, cost of goods sold and gross profit.Pitch your topic with ease and precision using this Monthly Profit And Loss Statement Reports Analysis Dashboard Brochure PDF. This layout presents information on Costs Good Sold, Earnings Before, Interest Expense. It is also available for immediate download and adjustment. So, changes can be made in the color, design, graphics or any other component to create a unique layout.
Multiple Projects Progress Tracking Report Management Dashboard With Duration Summary PDF
This slide shows the dashboard representing status of various projects which would be helpful in project management. It shows information related to project status, tasks status, milestones completed, upcoming milestones, critical tasks, projects names along with their start and end date, duration etc.Pitch your topic with ease and precision using this Multiple Projects Progress Tracking Report Management Dashboard With Duration Summary PDF. This layout presents information on Start Date, Finish Date, Percent Complete. It is also available for immediate download and adjustment. So, changes can be made in the color, design, graphics or any other component to create a unique layout.
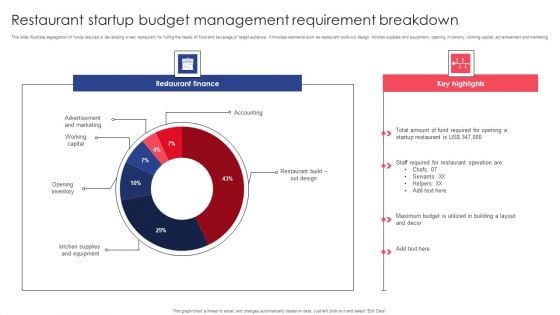
Restaurant Startup Budget Management Requirement Breakdown Graphics PDF
This slide illustrate segregation of funds required in developing a new restaurant for fulling the needs of food and beverage of target audience. It includes elements such as restaurant build-out design, kitchen supplies and equipment, opening inventory, working capital, advertisement and marketing. Showcasing this set of slides titled Restaurant Startup Budget Management Requirement Breakdown Graphics PDF. The topics addressed in these templates are Restaurant Finance, Staff Required, Kitchen Supplies. All the content presented in this PPT design is completely editable. Download it and make adjustments in color, background, font etc. as per your unique business setting.
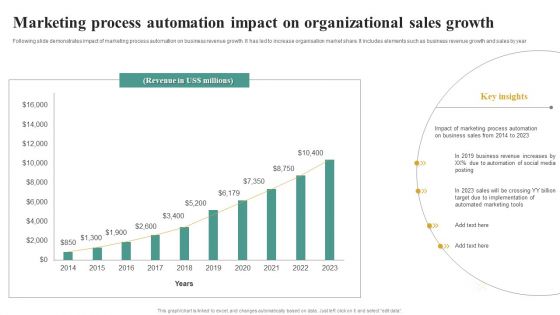
Marketing Process Automation Impact On Organizational Sales Growth Microsoft PDF
Following slide demonstrates impact of marketing process automation on business revenue growth. It has led to increase organisation market share. It includes elements such as business revenue growth and sales by year. Showcasing this set of slides titled Marketing Process Automation Impact On Organizational Sales Growth Microsoft PDF. The topics addressed in these templates are Marketing Process, Automation Impact, Organizational Sales Growth. All the content presented in this PPT design is completely editable. Download it and make adjustments in color, background, font etc. as per your unique business setting.

KPI Dashboard To Manage And Track Personnel Administration Summary PDF
This slide shows the dashboard which can be used to monitor performance of employees in an organization. It includes metrics such as headcount, average employee age, gender diversity ratio, absenteeism, etc. Showcasing this set of slides titled KPI Dashboard To Manage And Track Personnel Administration Summary PDF. The topics addressed in these templates are Employee Count Status, Employee Count Department, Employee Count Salary Range. All the content presented in this PPT design is completely editable. Download it and make adjustments in color, background, font etc. as per your unique business setting.
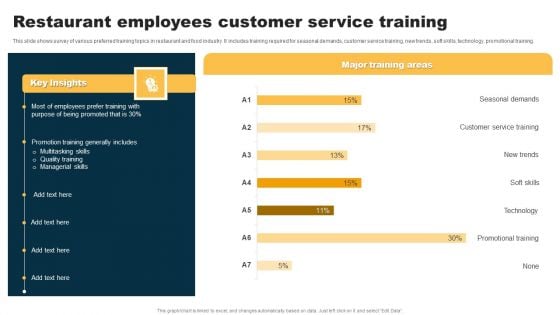
Restaurant Employees Customer Service Training Template PDF
This slide shows survey of various preferred training topics in restaurant and food industry. It includes training required for seasonal demands, customer service training, new trends, soft skills, technology, promotional training. Showcasing this set of slides titled Restaurant Employees Customer Service Training Template PDF. The topics addressed in these templates are Seasonal Demands, Customer Service Training, New Trends, Soft Skills, Technology, Promotional Training. All the content presented in this PPT design is completely editable. Download it and make adjustments in color, background, font etc. as per your unique business setting.
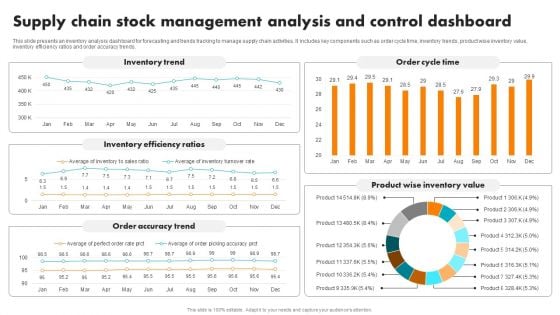
Supply Chain Stock Management Analysis And Control Dashboard Brochure PDF
This slide presents an inventory analysis dashboard for forecasting and trends tracking to manage supply chain activities. It includes key components such as order cycle time, inventory trends, product wise inventory value, inventory efficiency ratios and order accuracy trends. Pitch your topic with ease and precision using this Supply Chain Stock Management Analysis And Control Dashboard Brochure PDF. This layout presents information on Inventory Trend, Inventory Efficiency Ratios, Order Accuracy Trend, Order Cycle Time, Product Wise Inventory Value. It is also available for immediate download and adjustment. So, changes can be made in the color, design, graphics or any other component to create a unique layout.
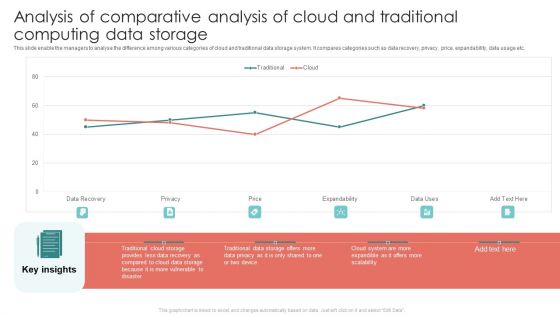
Analysis Of Comparative Analysis Of Cloud And Traditional Computing Data Storage Guidelines PDF
This slide enable the managers to analyse the difference among various categories of cloud and traditional data storage system. It compares categories such as data recovery, privacy, price, expandability, data usage etc. Showcasing this set of slides titled Analysis Of Comparative Analysis Of Cloud And Traditional Computing Data Storage Guidelines PDF. The topics addressed in these templates are Provides Less, Because Vulnerable, Expandability. All the content presented in this PPT design is completely editable. Download it and make adjustments in color, background, font etc. as per your unique business setting.

Comparative Analysis Of Traditional Vs Cloud Computing Comparative Sample PDF
This slide depicts the main difference between the two type of software testing that are traditional and cloud testing. It compare them on the basis of functionality, integration, cost of testing and time invested. Showcasing this set of slides titled Comparative Analysis Of Traditional Vs Cloud Computing Comparative Sample PDF. The topics addressed in these templates are Market Value, Center Decreased, Market Share Around. All the content presented in this PPT design is completely editable. Download it and make adjustments in color, background, font etc. as per your unique business setting.
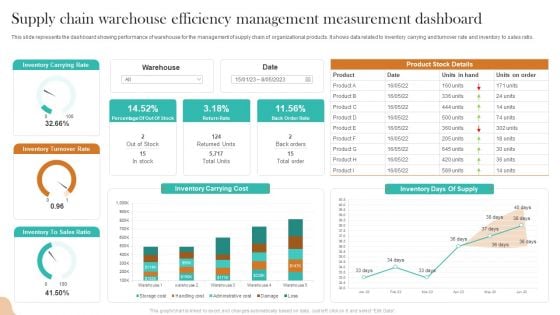
Supply Chain Warehouse Efficiency Management Measurement Dashboard Inspiration PDF
This slide represents the dashboard showing performance of warehouse for the management of supply chain of organizational products. It shows data related to inventory carrying and turnover rate and inventory to sales ratio. Pitch your topic with ease and precision using this Supply Chain Warehouse Efficiency Management Measurement Dashboard Inspiration PDF. This layout presents information on Inventory Carrying Rate, Inventory Turnover Rate, Inventory Carrying Cost. It is also available for immediate download and adjustment. So, changes can be made in the color, design, graphics or any other component to create a unique layout.
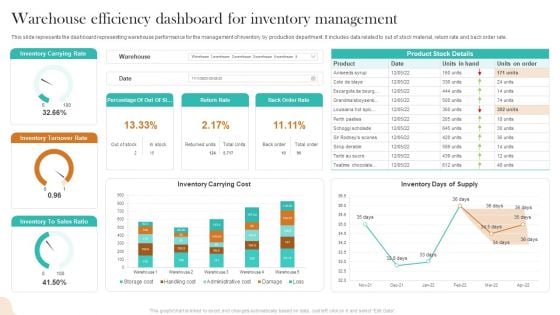
Warehouse Efficiency Dashboard For Inventory Management Infographics PDF
This slide represents the dashboard representing warehouse performance for the management of inventory by production department. It includes data related to out of stock material, return rate and back order rate. Showcasing this set of slides titled Warehouse Efficiency Dashboard For Inventory Management Infographics PDF. The topics addressed in these templates are Inventory Carrying Rate, Inventory Turnover Rate, Inventory Carrying Cost. All the content presented in this PPT design is completely editable. Download it and make adjustments in color, background, font etc. as per your unique business setting.
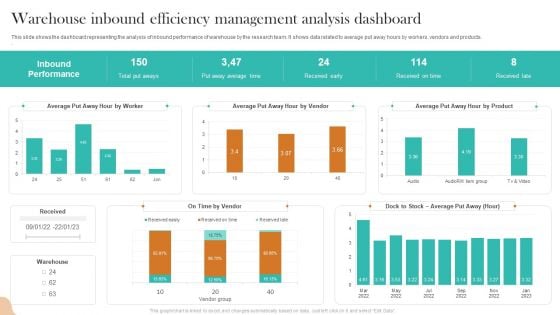
Warehouse Inbound Efficiency Management Analysis Dashboard Topics PDF
This slide shows the dashboard representing the analysis of inbound performance of warehouse by the research team. It shows data related to average put away hours by workers, vendors and products. Showcasing this set of slides titled Warehouse Inbound Efficiency Management Analysis Dashboard Topics PDF. The topics addressed in these templates are Inbound Performance, Total Put Aways, Received Early. All the content presented in this PPT design is completely editable. Download it and make adjustments in color, background, font etc. as per your unique business setting.
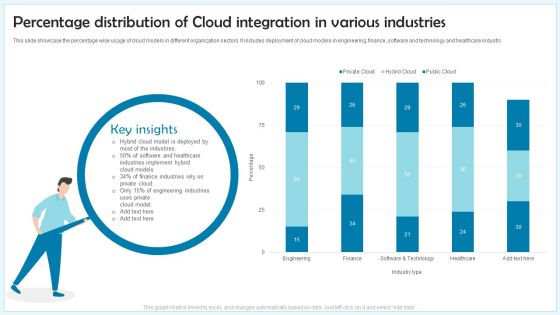
Percentage Distribution Of Cloud Integration In Various Industries Ppt Designs Download PDF
This slide showcase the percentage wise usage of cloud models in different organization sectors. It includes deployment of cloud models in engineering, finance, software and technology and healthcare industry. Showcasing this set of slides titled Percentage Distribution Of Cloud Integration In Various Industries Ppt Designs Download PDF. The topics addressed in these templates are Key Insights, Hybrid Cloud Model, Finance Industries. All the content presented in this PPT design is completely editable. Download it and make adjustments in color, background, font etc. as per your unique business setting.
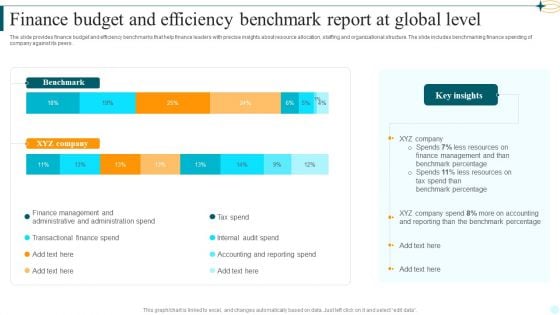
Finance Budget And Efficiency Benchmark Report At Global Level Template PDF
The slide provides finance budget and efficiency benchmarks that help finance leaders with precise insights about resource allocation, staffing and organizational structure. The slide includes benchmarking finance spending of company against its peers. Showcasing this set of slides titled Finance Budget And Efficiency Benchmark Report At Global Level Template PDF. The topics addressed in these templates are Benchmark, Key Insights, Benchmark Percentage. All the content presented in this PPT design is completely editable. Download it and make adjustments in color, background, font etc. as per your unique business setting.
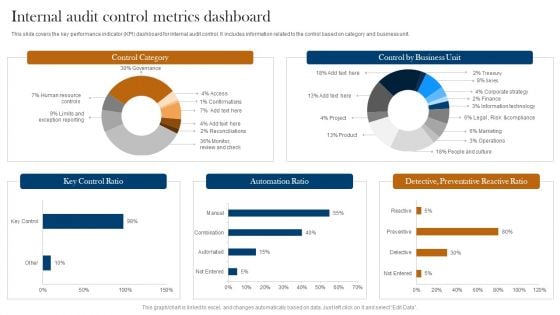
Internal Audit Control Metrics Dashboard Ppt Professional Design Templates PDF
This slide covers the key performance indicator KPI dashboard for internal audit control. It includes information related to the control based on category and business unit. Showcasing this set of slides titled Internal Audit Control Metrics Dashboard Ppt Professional Design Templates PDF. The topics addressed in these templates are Control Category, Key Control Ratio, Automation Ratio. All the content presented in this PPT design is completely editable. Download it and make adjustments in color, background, font etc. as per your unique business setting.
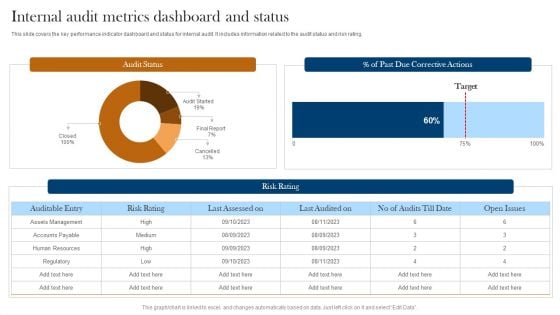
Internal Audit Metrics Dashboard And Status Ppt Layouts Graphic Images PDF
This slide covers the key performance indicator dashboard and status for internal audit. It includes information related to the audit status and risk rating. Pitch your topic with ease and precision using this Internal Audit Metrics Dashboard And Status Ppt Layouts Graphic Images PDF. This layout presents information on Audit Status, Risk Rating, Auditable Entry. It is also available for immediate download and adjustment. So, changes can be made in the color, design, graphics or any other component to create a unique layout.
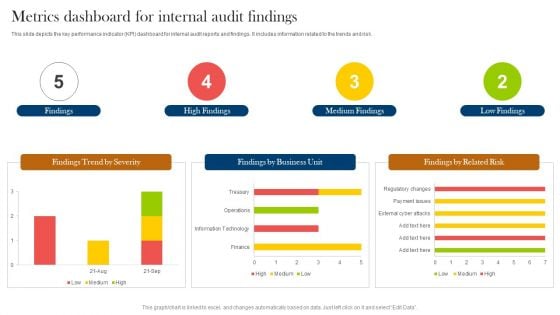
Metrics Dashboard For Internal Audit Findings Ppt Styles Gallery PDF
This slide depicts the key performance indicator KPI dashboard for internal audit reports and findings. It includes information related to the trends and risk. Pitch your topic with ease and precision using this Metrics Dashboard For Internal Audit Findings Ppt Styles Gallery PDF. This layout presents information on Findings, High Findings, Medium Findings, Low Findings. It is also available for immediate download and adjustment. So, changes can be made in the color, design, graphics or any other component to create a unique layout.
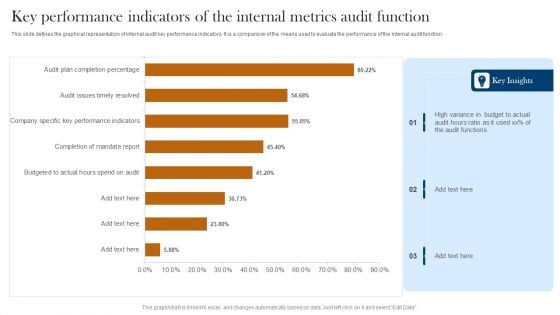
Key Performance Indicators Of The Internal Metrics Audit Function Infographics PDF
This slide defines the graphical representation of internal audit key performance indicators. It is a comparison of the means used to evaluate the performance of the internal audit function. Pitch your topic with ease and precision using this Key Performance Indicators Of The Internal Metrics Audit Function Infographics PDF. This layout presents information on High Variance, Budget To Actual, Audit Functions. It is also available for immediate download and adjustment. So, changes can be made in the color, design, graphics or any other component to create a unique layout.
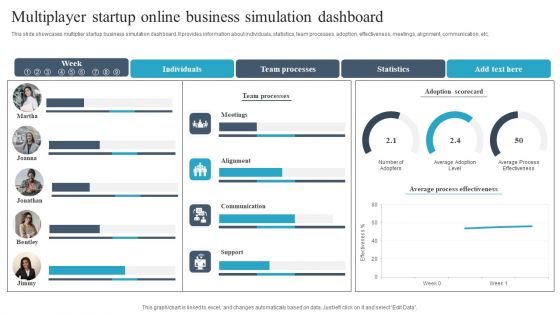
Multiplayer Startup Online Business Simulation Dashboard Demonstration PDF
This slide showcases multiplier startup business simulation dashboard. It provides information about individuals, statistics, team processes, adoption, effectiveness, meetings, alignment, communication, etc. Pitch your topic with ease and precision using this Multiplayer Startup Online Business Simulation Dashboard Demonstration PDF. This layout presents information on Individuals, Team Processes, Statistics. It is also available for immediate download and adjustment. So, changes can be made in the color, design, graphics or any other component to create a unique layout.
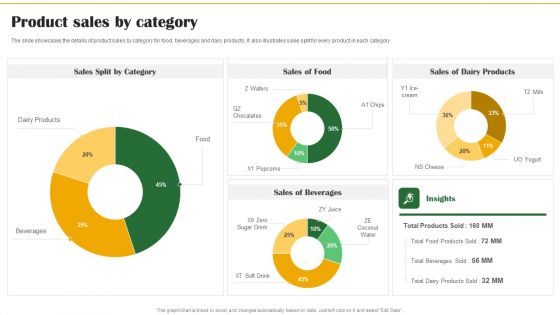
Food Organization Financial Trends Product Sales By Category Ppt Show Slideshow PDF
The slide showcases the details of product sales by category for food, beverages and dairy products. It also illustrates sales split for every product in each category. There are so many reasons you need a Food Organization Financial Trends Product Sales By Category Ppt Show Slideshow PDF. The first reason is you cant spend time making everything from scratch, Thus, Slidegeeks has made presentation templates for you too. You can easily download these templates from our website easily.
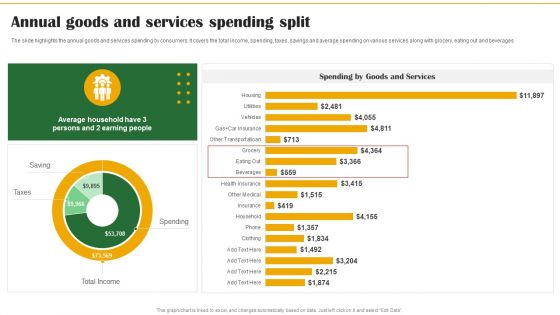
Food Organization Financial Trends Annual Goods And Services Spending Split Slides PDF
The slide highlights the annual goods and services spending by consumers. It covers the total income, spending, taxes, savings and average spending on various services along with grocery, eating out and beverages. Crafting an eye-catching presentation has never been more straightforward. Let your presentation shine with this tasteful yet straightforward Food Organization Financial Trends Annual Goods And Services Spending Split Slides PDF template. It offers a minimalistic and classy look that is great for making a statement. The colors have been employed intelligently to add a bit of playfulness while still remaining professional. Construct the ideal Food Organization Financial Trends Annual Goods And Services Spending Split Slides PDF that effortlessly grabs the attention of your audience Begin now and be certain to wow your customers.
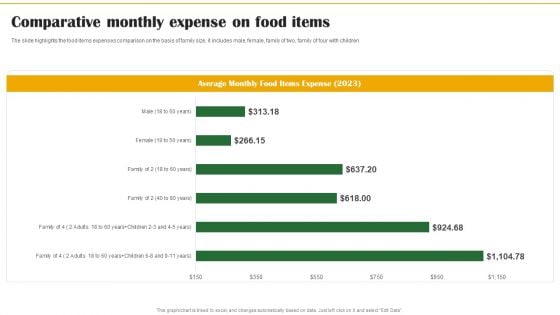
Food Organization Financial Trends Comparative Monthly Expense On Food Items Background PDF
The slide highlights the food items expenses comparison on the basis of family size, it includes male, female, family of two, family of four with children. Formulating a presentation can take up a lot of effort and time, so the content and message should always be the primary focus. The visuals of the PowerPoint can enhance the presenters message, so our Food Organization Financial Trends Comparative Monthly Expense On Food Items Background PDF was created to help save time. Instead of worrying about the design, the presenter can concentrate on the message while our designers work on creating the ideal templates for whatever situation is needed. Slidegeeks has experts for everything from amazing designs to valuable content, we have put everything into Food Organization Financial Trends Comparative Monthly Expense On Food Items Background PDF.
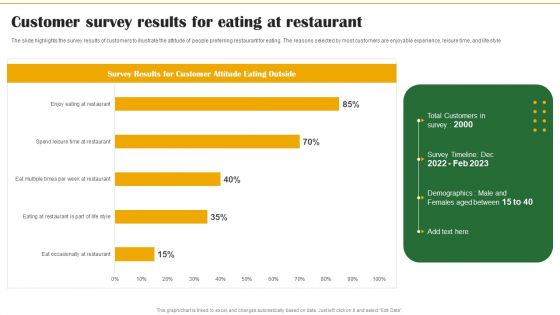
Food Organization Financial Trends Customer Survey Results For Eating At Restaurant Formats PDF
The slide highlights the survey results of customers to illustrate the attitude of people preferring restaurant for eating. The reasons selected by most customers are enjoyable experience, leisure time, and life style. Coming up with a presentation necessitates that the majority of the effort goes into the content and the message you intend to convey. The visuals of a PowerPoint presentation can only be effective if it supplements and supports the story that is being told. Keeping this in mind our experts created Food Organization Financial Trends Customer Survey Results For Eating At Restaurant Formats PDF to reduce the time that goes into designing the presentation. This way, you can concentrate on the message while our designers take care of providing you with the right template for the situation.
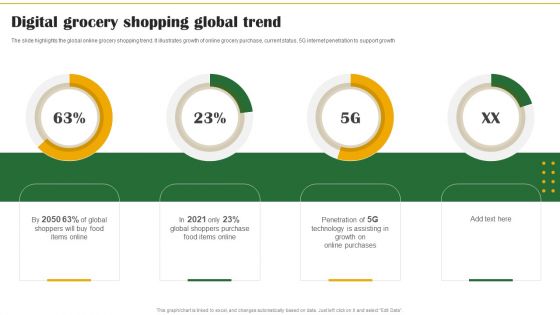
Food Organization Financial Trends Digital Grocery Shopping Global Trend Formats PDF
The slide highlights the global online grocery shopping trend. It illustrates growth of online grocery purchase, current status, 5G internet penetration to support growth. This modern and well-arranged Food Organization Financial Trends Digital Grocery Shopping Global Trend Formats PDF provides lots of creative possibilities. It is very simple to customize and edit with the Powerpoint Software. Just drag and drop your pictures into the shapes. All facets of this template can be edited with Powerpoint, no extra software is necessary. Add your own material, put your images in the places assigned for them, adjust the colors, and then you can show your slides to the world, with an animated slide included.
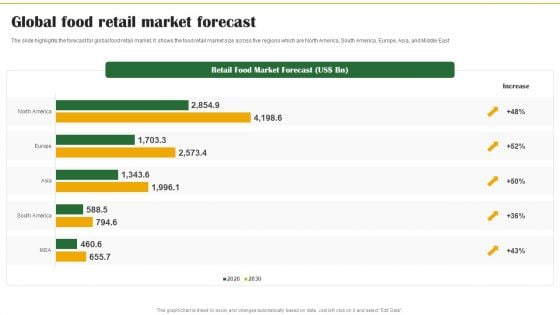
Food Organization Financial Trends Global Food Retail Market Forecast Formats PDF
The slide highlights the forecast for global food retail market. It shows the food retail market size across five regions which are North America, South America, Europe, Asia, and Middle East. Explore a selection of the finest Food Organization Financial Trends Global Food Retail Market Forecast Formats PDF here. With a plethora of professionally designed and pre-made slide templates, you can quickly and easily find the right one for your upcoming presentation. You can use our Food Organization Financial Trends Global Food Retail Market Forecast Formats PDF to effectively convey your message to a wider audience. Slidegeeks has done a lot of research before preparing these presentation templates. The content can be personalized and the slides are highly editable. Grab templates today from Slidegeeks.
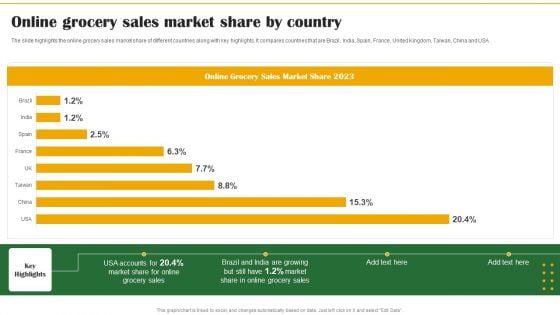
Food Organization Financial Trends Online Grocery Sales Market Share By Country Mockup PDF
The slide highlights the online grocery sales market share of different countries along with key highlights. It compares countries that are Brazil, India, Spain, France, United Kingdom, Taiwan, China and USA. The Food Organization Financial Trends Online Grocery Sales Market Share By Country Mockup PDF is a compilation of the most recent design trends as a series of slides. It is suitable for any subject or industry presentation, containing attractive visuals and photo spots for businesses to clearly express their messages. This template contains a variety of slides for the user to input data, such as structures to contrast two elements, bullet points, and slides for written information. Slidegeeks is prepared to create an impression.
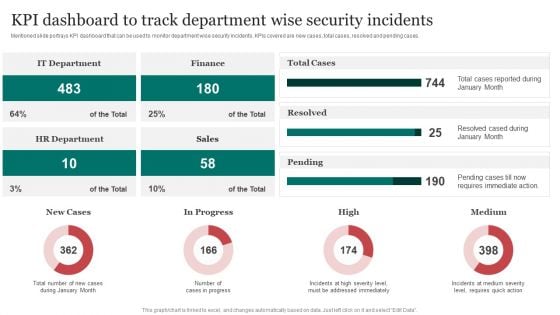
Kpi Dashboard To Track Department Wise Improving Cybersecurity With Incident Guidelines PDF
Mentioned slide portrays KPI dashboard that can be used to monitor department wise security incidents. KPIs covered are new cases, total cases, resolved and pending cases.This Kpi Dashboard To Track Department Wise Improving Cybersecurity With Incident Guidelines PDF is perfect for any presentation, be it in front of clients or colleagues. It is a versatile and stylish solution for organizing your meetings. The Kpi Dashboard To Track Department Wise Improving Cybersecurity With Incident Guidelines PDF features a modern design for your presentation meetings. The adjustable and customizable slides provide unlimited possibilities for acing up your presentation. Slidegeeks has done all the homework before launching the product for you. So, do not wait, grab the presentation templates today
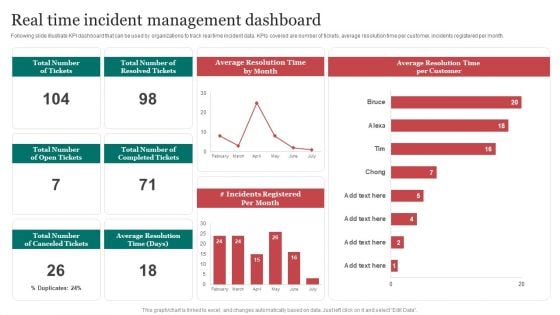
Real Time Incident Management Improving Cybersecurity With Incident Professional PDF
Following slide illustrate KPI dashboard that can be used by organizations to track real time incident data. KPIs covered are number of tickets, average resolution time per customer, incidents registered per month. The Real Time Incident Management Improving Cybersecurity With Incident Professional PDF is a compilation of the most recent design trends as a series of slides. It is suitable for any subject or industry presentation, containing attractive visuals and photo spots for businesses to clearly express their messages. This template contains a variety of slides for the user to input data, such as structures to contrast two elements, bullet points, and slides for written information. Slidegeeks is prepared to create an impression.
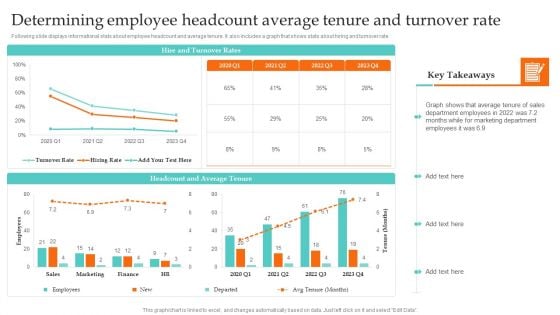
Determining Employee Headcount Average Tenure And Turnover Rate Graphics PDF
Slidegeeks is one of the best resources for PowerPoint templates. You can download easily and regulate Determining Employee Headcount Average Tenure And Turnover Rate Graphics PDF for your personal presentations from our wonderful collection. A few clicks is all it takes to discover and get the most relevant and appropriate templates. Use our Templates to add a unique zing and appeal to your presentation and meetings. All the slides are easy to edit and you can use them even for advertisement purposes.
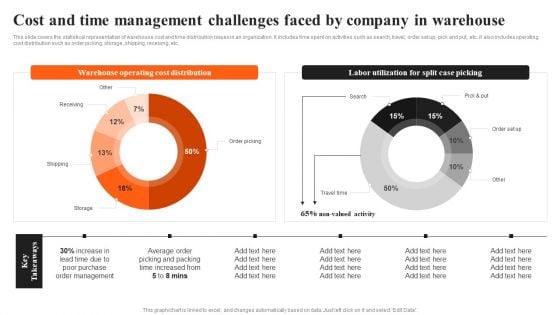
Integrating AI To Enhance Cost And Time Management Challenges Faced By Company Professional PDF
This slide covers the statistical representation of warehouse cost and time distribution issues in an organization. It includes time spent on activities such as search, travel, order set up, pick and put, etc. it also includes operating cost distribution such as order picking, storage, shipping, receiving, etc. Get a simple yet stunning designed Integrating AI To Enhance Cost And Time Management Challenges Faced By Company Professional PDF. It is the best one to establish the tone in your meetings. It is an excellent way to make your presentations highly effective. So, download this PPT today from Slidegeeks and see the positive impacts. Our easy-to-edit Integrating AI To Enhance Cost And Time Management Challenges Faced By Company Professional PDF can be your go-to option for all upcoming conferences and meetings. So, what are you waiting for Grab this template today.
Integrating AI To Enhance Dashboard For Tracking Impact Of Procurement Process Slides PDF
This slide covers the dashboard for analysing procurement performance after automation. It include KPIs such as on-time delivery, percentage of returns, compliance index percentage, procurement ROI, cost-saving, budget spent on training, etc. Slidegeeks is here to make your presentations a breeze with Integrating AI To Enhance Dashboard For Tracking Impact Of Procurement Process Slides PDF With our easy-to-use and customizable templates, you can focus on delivering your ideas rather than worrying about formatting. With a variety of designs to choose from, youre sure to find one that suits your needs. And with animations and unique photos, illustrations, and fonts, you can make your presentation pop. So whether youre giving a sales pitch or presenting to the board, make sure to check out Slidegeeks first.
Integrating AI To Enhance Dashboard For Tracking Impact Of Warehouse House Automation Professional PDF
This slide covers the dashboard with after automation warehouse overview. It include KPIs such as autonomous robots status, robotic arms status, battery level, performance, time to return, etc. Find highly impressive Integrating AI To Enhance Dashboard For Tracking Impact Of Warehouse House Automation Professional PDF on Slidegeeks to deliver a meaningful presentation. You can save an ample amount of time using these presentation templates. No need to worry to prepare everything from scratch because Slidegeeks experts have already done a huge research and work for you. You need to download Integrating AI To Enhance Dashboard For Tracking Impact Of Warehouse House Automation Professional PDF for your upcoming presentation. All the presentation templates are 100 percent editable and you can change the color and personalize the content accordingly. Download now.
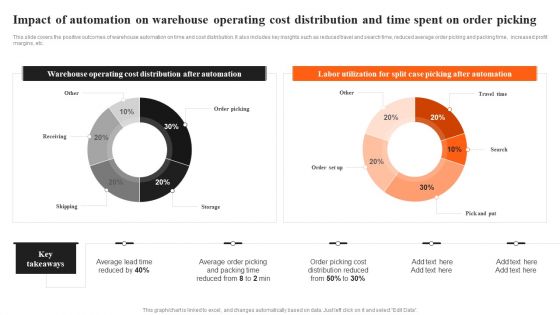
Integrating AI To Enhance Impact Of Automation On Warehouse Operating Cost Distribution Slides PDF
This slide covers the positive outcomes of warehouse automation on time and cost distribution. It also includes key insights such as reduced travel and search time, reduced average order picking and packing time, increased profit margins, etc. This modern and well-arranged Integrating AI To Enhance Impact Of Automation On Warehouse Operating Cost Distribution Slides PDF provides lots of creative possibilities. It is very simple to customize and edit with the Powerpoint Software. Just drag and drop your pictures into the shapes. All facets of this template can be edited with Powerpoint, no extra software is necessary. Add your own material, put your images in the places assigned for them, adjust the colors, and then you can show your slides to the world, with an animated slide included.
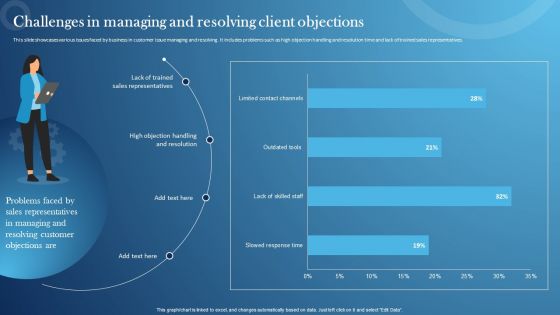
Inspecting Sales Optimization Areas Challenges In Managing And Resolving Client Objections Elements PDF
This slide showcases various issues faced by business in customer issue managing and resolving. It includes problems such as high objection handling and resolution time and lack of trained sales representatives. Boost your pitch with our creative Inspecting Sales Optimization Areas Challenges In Managing And Resolving Client Objections Elements PDF. Deliver an awe-inspiring pitch that will mesmerize everyone. Using these presentation templates you will surely catch everyones attention. You can browse the ppts collection on our website. We have researchers who are experts at creating the right content for the templates. So you dont have to invest time in any additional work. Just grab the template now and use them.
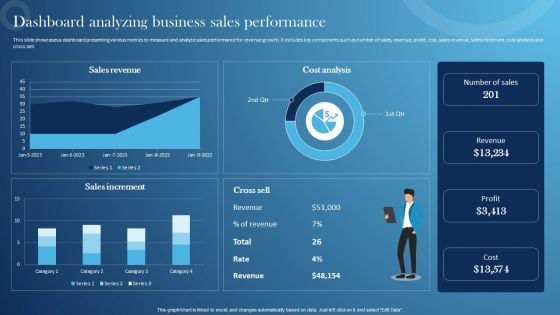
Inspecting Sales Optimization Areas Dashboard Analyzing Business Sales Performance Slides PDF
This slide showcases a dashboard presenting various metrics to measure and analyze sales performance for revenue growth. It includes key components such as number of sales, revenue, profit, cost, sales revenue, sales increment, cost analysis and cross sell. Create an editable Inspecting Sales Optimization Areas Dashboard Analyzing Business Sales Performance Slides PDF that communicates your idea and engages your audience. Whether youre presenting a business or an educational presentation, pre-designed presentation templates help save time. Inspecting Sales Optimization Areas Dashboard Analyzing Business Sales Performance Slides PDF is highly customizable and very easy to edit, covering many different styles from creative to business presentations. Slidegeeks has creative team members who have crafted amazing templates. So, go and get them without any delay.
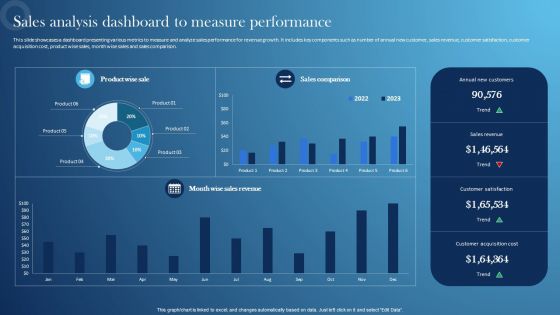
Inspecting Sales Optimization Areas Sales Analysis Dashboard To Measure Performance Demonstration PDF
This slide showcases a dashboard presenting various metrics to measure and analyze sales performance for revenue growth. It includes key components such as number of annual new customer, sales revenue, customer satisfaction, customer acquisition cost, product wise sales, month wise sales and sales comparison. From laying roadmaps to briefing everything in detail, our templates are perfect for you. You can set the stage with your presentation slides. All you have to do is download these easy-to-edit and customizable templates. Inspecting Sales Optimization Areas Sales Analysis Dashboard To Measure Performance Demonstration PDF will help you deliver an outstanding performance that everyone would remember and praise you for. Do download this presentation today.
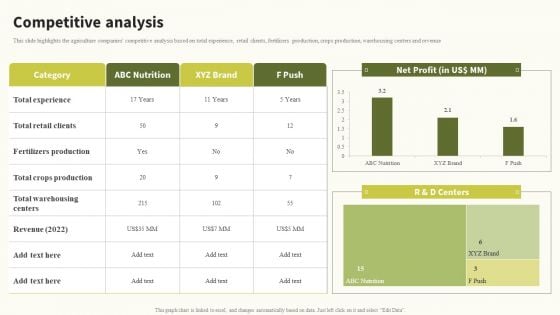
Competitive Analysis Global Food Products Company Profile Sample PDF
This slide highlights the agriculture companies competitive analysis based on total experience, retail clients, fertilizers production, crops production, warehousing centers and revenueThe Competitive Analysis Global Food Products Company Profile Sample PDF is a compilation of the most recent design trends as a series of slides. It is suitable for any subject or industry presentation, containing attractive visuals and photo spots for businesses to clearly express their messages. This template contains a variety of slides for the user to input data, such as structures to contrast two elements, bullet points, and slides for written information. Slidegeeks is prepared to create an impression.
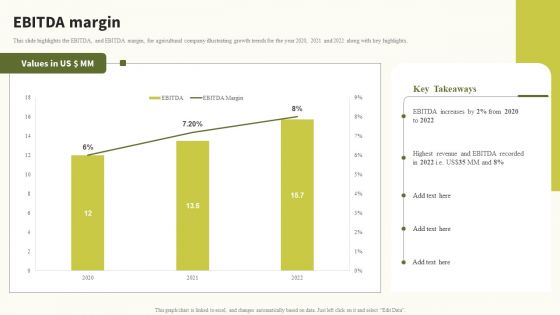
Ebitda Margin Global Food Products Company Profile Slides PDF
This slide highlights the EBITDA, and EBITDA margin, for agricultural company illustrating growth trends for the year 2020, 2021 and 2022 along with key highlights.Presenting this PowerPoint presentation, titled Ebitda Margin Global Food Products Company Profile Slides PDF, with topics curated by our researchers after extensive research. This editable presentation is available for immediate download and provides attractive features when used. Download now and captivate your audience. Presenting this Ebitda Margin Global Food Products Company Profile Slides PDF. Our researchers have carefully researched and created these slides with all aspects taken into consideration. This is a completely customizable Ebitda Margin Global Food Products Company Profile Slides PDF that is available for immediate downloading. Download now and make an impact on your audience. Highlight the attractive features available with our PPTs.
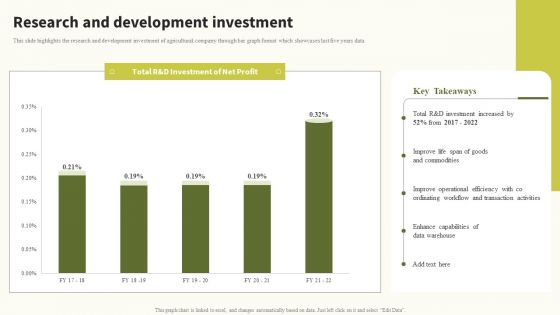
Research And Development Investment Global Food Products Company Profile Information PDF
This slide highlights the research and development investment of agricultural company through bar graph format which showcases last five years data. From laying roadmaps to briefing everything in detail, our templates are perfect for you. You can set the stage with your presentation slides. All you have to do is download these easy-to-edit and customizable templates. Research And Development Investment Global Food Products Company Profile Information PDF will help you deliver an outstanding performance that everyone would remember and praise you for. Do download this presentation today.
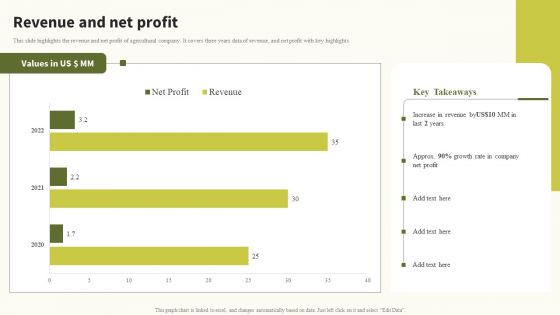
Revenue And Net Profit Global Food Products Company Profile Information PDF
This slide highlights the revenue and net profit of agricultural company. It covers three years data of revenue, and net profit with key highlights. Present like a pro with Revenue And Net Profit Global Food Products Company Profile Information PDF Create beautiful presentations together with your team, using our easy-to-use presentation slides. Share your ideas in real-time and make changes on the fly by downloading our templates. So whether you are in the office, on the go, or in a remote location, you can stay in sync with your team and present your ideas with confidence. With Slidegeeks presentation got a whole lot easier. Grab these presentations today.
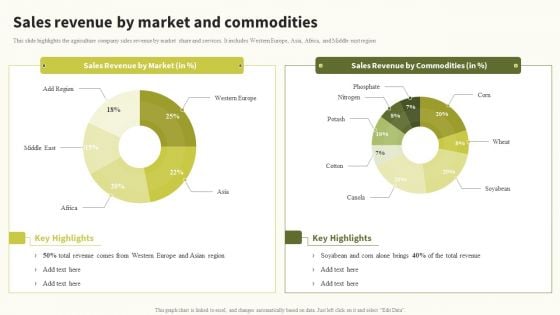
Sales Revenue By Market And Commodities Global Food Products Company Profile Slides PDF
This slide highlights the agriculture company sales revenue by market share and services. It includes Western Europe, Asia, Africa, and Middle east region. Slidegeeks is here to make your presentations a breeze with Sales Revenue By Market And Commodities Global Food Products Company Profile Slides PDF With our easy-to-use and customizable templates, you can focus on delivering your ideas rather than worrying about formatting. With a variety of designs to choose from, you are sure to find one that suits your needs. And with animations and unique photos, illustrations, and fonts, you can make your presentation pop. So whether you Are giving a sales pitch or presenting to the board, make sure to check out Slidegeeks first.
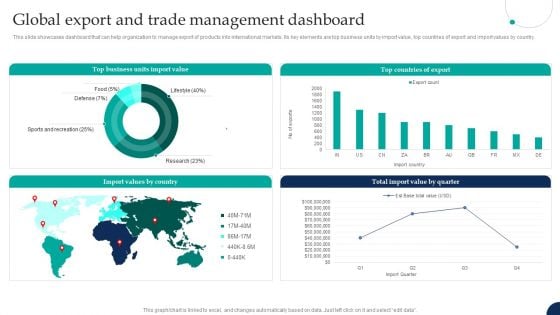
Tactical Export Guide Global Export And Trade Management Dashboard Portrait PDF
This slide showcases dashboard that can help organization to manage export of products into international markets. Its key elements are top business units by import value, top countries of export and import values by country. This modern and well-arranged Tactical Export Guide Global Export And Trade Management Dashboard Portrait PDF provides lots of creative possibilities. It is very simple to customize and edit with the Powerpoint Software. Just drag and drop your pictures into the shapes. All facets of this template can be edited with Powerpoint, no extra software is necessary. Add your own material, put your images in the places assigned for them, adjust the colors, and then you can show your slides to the world, with an animated slide included.

 Home
Home