Plan Icon
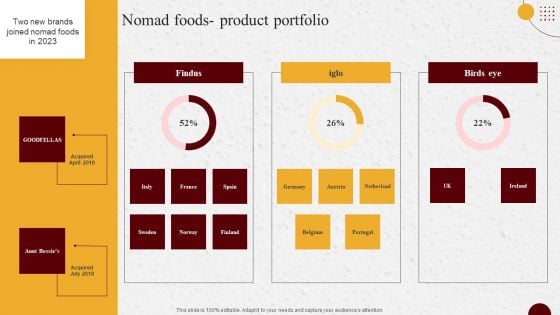
Industry Report Of Packaged Food Products Part 2 Nomad Foods Product Portfolio Ideas PDF
Find highly impressive Industry Report Of Packaged Food Products Part 2 Nomad Foods Product Portfolio Ideas PDF on Slidegeeks to deliver a meaningful presentation. You can save an ample amount of time using these presentation templates. No need to worry to prepare everything from scratch because Slidegeeks experts have already done a huge research and work for you. You need to download Industry Report Of Packaged Food Products Part 2 Nomad Foods Product Portfolio Ideas PDF for your upcoming presentation. All the presentation templates are 100 percent editable and you can change the color and personalize the content accordingly. Download now.
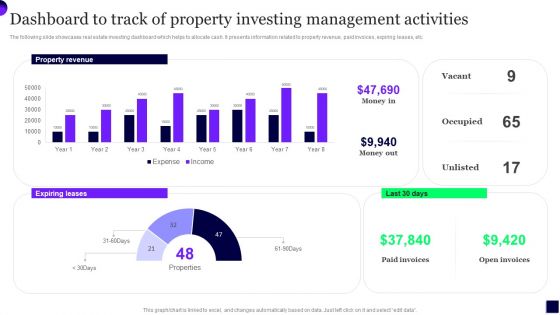
Dashboard To Track Of Property Investing Management Activities Sample PDF
The following slide showcases real estate investing dashboard which helps to allocate cash. It presents information related to property revenue, paid invoices, expiring leases, etc. Pitch your topic with ease and precision using this Dashboard To Track Of Property Investing Management Activities Sample PDF. This layout presents information on Dashboard To Track, Property Investing, Management Activities. It is also available for immediate download and adjustment. So, changes can be made in the color, design, graphics or any other component to create a unique layout.
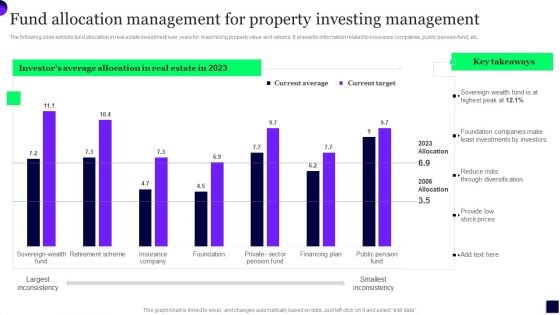
Fund Allocation Management For Property Investing Management Clipart PDF
The following slide exhibits fund allocation in real estate investment over years for maximizing property value and returns. It presents information related to insurance companies, public pension fund, etc. Showcasing this set of slides titled Fund Allocation Management For Property Investing Management Clipart PDF. The topics addressed in these templates are Property Investing Management, Key Takeaways. All the content presented in this PPT design is completely editable. Download it and make adjustments in color, background, font etc. as per your unique business setting.
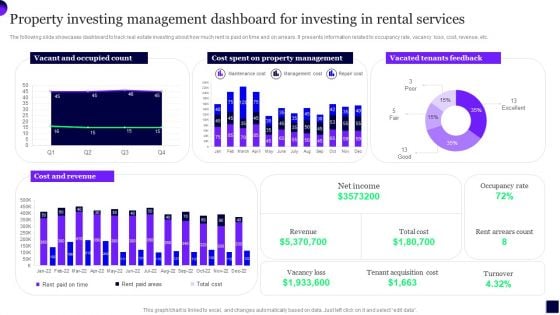
Property Investing Management Dashboard For Investing In Rental Services Template PDF
The following slide showcases dashboard to track real estate investing about how much rent is paid on time and on arrears. It presents information related to occupancy rate, vacancy loss, cost, revenue, etc. Showcasing this set of slides titled Property Investing Management Dashboard For Investing In Rental Services Template PDF. The topics addressed in these templates are Cost, Property Management, Revenue. All the content presented in this PPT design is completely editable. Download it and make adjustments in color, background, font etc. as per your unique business setting.
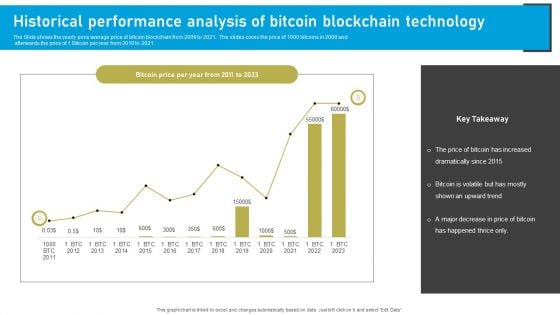
Historical Performance Analysis Of Bitcoin Blockchain Technology Inspiration PDF
The Slide shows the yearly price average price of bitcoin blockchain from 2009 to 2021. The slides coves the price of 1000 bitcoins in 2009 and afterwards the price of 1 Bitcoin per year from 2010 to 2021. Showcasing this set of slides titled Historical Performance Analysis Of Bitcoin Blockchain Technology Inspiration PDF. The topics addressed in these templates are Historical Performance Analysis, Bitcoin Blockchain Technology. All the content presented in this PPT design is completely editable. Download it and make adjustments in color, background, font etc. as per your unique business setting.
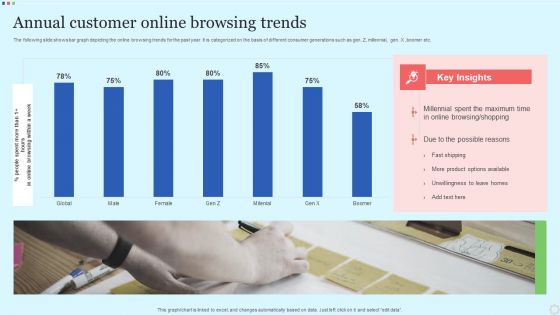
Annual Customer Online Browsing Trends Ideas PDF
The following slide shows bar graph depicting the online browsing trends for the past year. It is categorized on the basis of different consumer generations such as gen. Z, millennial, gen. X ,boomer etc. Showcasing this set of slides titled Annual Customer Online Browsing Trends Ideas PDF. The topics addressed in these templates are Online Browsing, Millennial Spent, Possible Reasons. All the content presented in this PPT design is completely editable. Download it and make adjustments in color, background, font etc. as per your unique business setting.
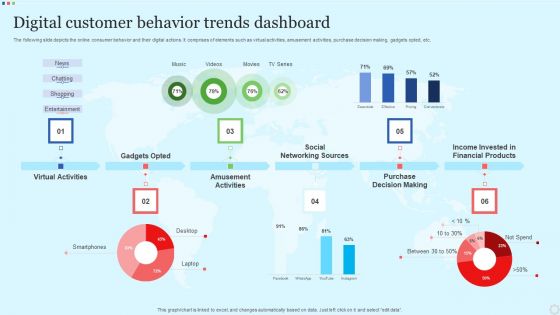
Digital Customer Behavior Trends Dashboard Slides PDF
The following slide depicts the online consumer behavior and their digital actions. It comprises of elements such as virtual activities, amusement activities, purchase decision making, gadgets opted, etc. Showcasing this set of slides titled Digital Customer Behavior Trends Dashboard Slides PDF. The topics addressed in these templates are Virtual Activities, Gadgets Opted, Amusement Activities. All the content presented in this PPT design is completely editable. Download it and make adjustments in color, background, font etc. as per your unique business setting.
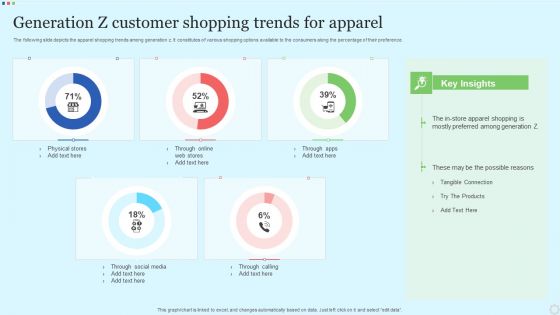
Generation Z Customer Shopping Trends For Apparel Designs PDF
The following slide depicts the apparel shopping trends among generation z. It constitutes of various shopping options available to the consumers along the percentage of their preference. Pitch your topic with ease and precision using this Generation Z Customer Shopping Trends For Apparel Designs PDF. This layout presents information on Physical Stores, Through Social Media, Through Calling. It is also available for immediate download and adjustment. So, changes can be made in the color, design, graphics or any other component to create a unique layout.
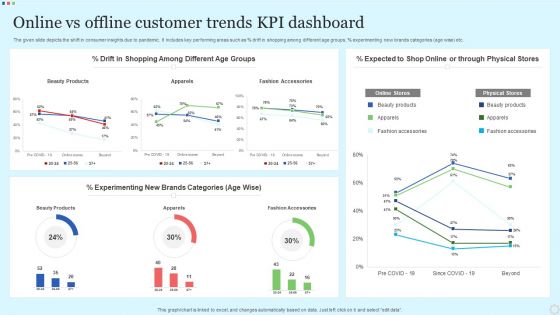
Online Vs Offline Customer Trends Kpi Dashboard Rules PDF
The given slide depicts the shift in consumer insights due to pandemic. It includes key performing areas such as percent drift in shopping among different age groups, percent experimenting new brands categories age wise etc. Showcasing this set of slides titled Online Vs Offline Customer Trends Kpi Dashboard Rules PDF. The topics addressed in these templates are Beauty Products, Apparels, Fashion Accessories. All the content presented in this PPT design is completely editable. Download it and make adjustments in color, background, font etc. as per your unique business setting.
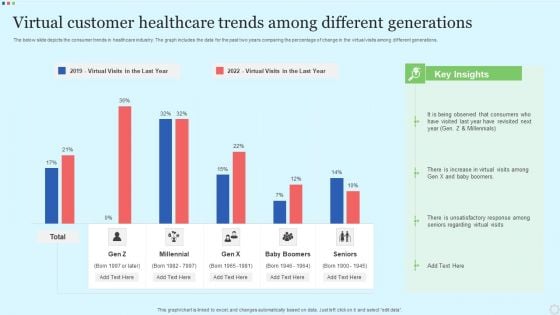
Virtual Customer Healthcare Trends Among Different Generations Professional PDF
The below slide depicts the consumer trends in healthcare industry. The graph includes the data for the past two years comparing the percentage of change in the virtual visits among different generations. Pitch your topic with ease and precision using this Virtual Customer Healthcare Trends Among Different Generations Professional PDF. This layout presents information on Millennial, Baby Boomers, Seniors. It is also available for immediate download and adjustment. So, changes can be made in the color, design, graphics or any other component to create a unique layout.
Lead Tracking Dashboard With Metric Comparison Brochure PDF
This slide showcases dashboard of lead pipeline that can help to identify total number of leads generated and expenses incurred to acquire the audience. It also showcases other key performance metrics like lead breakdown by status and number of leads per month. Pitch your topic with ease and precision using this Lead Tracking Dashboard With Metric Comparison Brochure PDF. This layout presents information on Metric Comparison, Lead Pipeline, Lead Breakdown Status. It is also available for immediate download and adjustment. So, changes can be made in the color, design, graphics or any other component to create a unique layout.
Leads Tracking Dashboard With Conversion Funnel Ideas PDF
This slide showcases dashboard that can help organization to identify the total number of customers acquired from the sales and marketing qualified lead. It also showcases financial KPIs that are cost per lead, cost per customer, customer lifetine value and return on marketing investment. Pitch your topic with ease and precision using this Leads Tracking Dashboard With Conversion Funnel Ideas PDF. This layout presents information on Audience, Prospects, Conversion Funnel. It is also available for immediate download and adjustment. So, changes can be made in the color, design, graphics or any other component to create a unique layout.
Monthly Comparison Dashboard For Lead Tracking Sample PDF
This slide showcases dashboard that can help organization to compare the leads converted in different months and make changes in sales and marketing campaigns . Its key components lead generated by country, by industry type and lead sources by month. Showcasing this set of slides titled Monthly Comparison Dashboard For Lead Tracking Sample PDF. The topics addressed in these templates are Leads Received, Industry Type, Lead Generated. All the content presented in this PPT design is completely editable. Download it and make adjustments in color, background, font etc. as per your unique business setting.
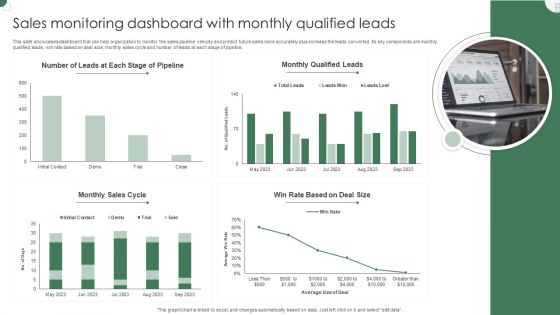
Sales Monitoring Dashboard With Monthly Qualified Leads Guidelines PDF
This slide showcases dashboard that can help organization to monitor the sales pipeline velocity and predict future sales more accurately plus increase the leads converted. Its key components are monthly qualified leads, win rate based on deal size, monthly sales cycle and number of leads at each stage of pipeline. Pitch your topic with ease and precision using this Sales Monitoring Dashboard With Monthly Qualified Leads Guidelines PDF. This layout presents information on Monthly Qualified, Monthly Sales Cycle, Deal Size. It is also available for immediate download and adjustment. So, changes can be made in the color, design, graphics or any other component to create a unique layout.
Sales Performance Dashboard With Average Lead Tracking Time Background PDF
This slide showcases dashboard for sales performance that can help organization to analyze the effectiveness of sales campaigns and average response time of lead. Its key components are average contract value, average sales cycle length, follow up contract rate and sales activity. Showcasing this set of slides titled Sales Performance Dashboard With Average Lead Tracking Time Background PDF. The topics addressed in these templates are Avg Contract Value, Sales Activity, Contract Rate. All the content presented in this PPT design is completely editable. Download it and make adjustments in color, background, font etc. as per your unique business setting.
Website Leads Tracking Dashboard With Traffic Sources Infographics PDF
This slide showcases dashboard for lead generation that can help organziation to identify the traffic sources plus visitors and make changes in SEO of website. It also showcases key metrics that are bounce rate by week, visitors by user type, top channels by conversion, top campaign by conversion and top pages by conversion. Pitch your topic with ease and precision using this Website Leads Tracking Dashboard With Traffic Sources Infographics PDF. This layout presents information on Visitors User Type, Traffic Sources, Bounce Rate Week. It is also available for immediate download and adjustment. So, changes can be made in the color, design, graphics or any other component to create a unique layout.
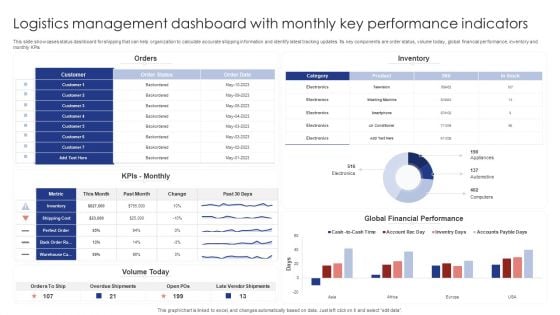
Logistics Management Dashboard With Monthly Key Performance Indicators Rules PDF
This slide showcases status dashboard for shipping that can help organization to calculate accurate shipping information and identify latest tracking updates. Its key components are order status, volume today, global financial performance, inventory and monthly KPIs. Pitch your topic with ease and precision using this Logistics Management Dashboard With Monthly Key Performance Indicators Rules PDF. This layout presents information on Orders, Inventory, Kpis Monthly. It is also available for immediate download and adjustment. So, changes can be made in the color, design, graphics or any other component to create a unique layout.
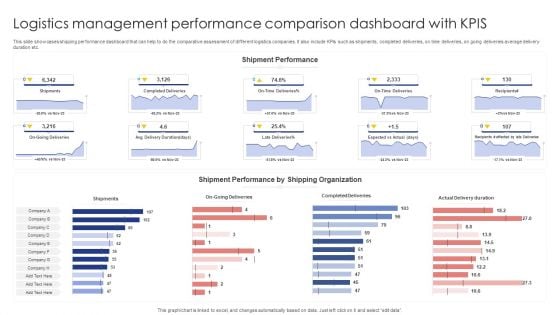
Logistics Management Performance Comparison Dashboard With Kpis Sample PDF
This slide showcases shipping performance dashboard that can help to do the comparative assessment of different logistics companies. It also include KPIs such as shipments, completed deliveries, on time deliveries, on going deliveries average delivery duration etc. Pitch your topic with ease and precision using this Logistics Management Performance Comparison Dashboard With Kpis Sample PDF. This layout presents information on Shipments, Completed Deliveries, Actual Delivery Duration. It is also available for immediate download and adjustment. So, changes can be made in the color, design, graphics or any other component to create a unique layout.
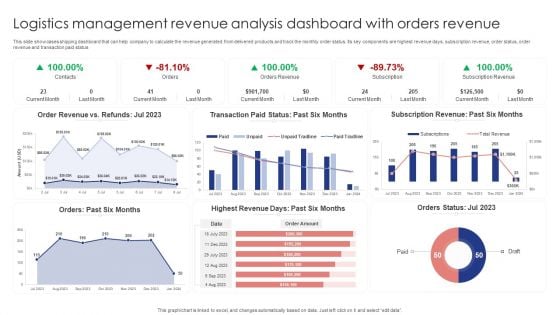
Logistics Management Revenue Analysis Dashboard With Orders Revenue Brochure PDF
This slide showcases shipping dashboard that can help company to calculate the revenue generated from delivered products and track the monthly order status. Its key components are highest revenue days, subscription revenue, order status, order revenue and transaction paid status. Showcasing this set of slides titled Logistics Management Revenue Analysis Dashboard With Orders Revenue Brochure PDF. The topics addressed in these templates are Order Revenue, Transaction Paid, Subscription Revenue. All the content presented in this PPT design is completely editable. Download it and make adjustments in color, background, font etc. as per your unique business setting.
Logistics Management Time Tracking Dashboard With Warehousing Costs Template PDF
This slide showcases shipping dashboard that can help company to deliver the products in stipulated time and keep warehousing operating expenses within pre decided budget. Its also displays perfect order rate and total shipments by country. Pitch your topic with ease and precision using this Logistics Management Time Tracking Dashboard With Warehousing Costs Template PDF. This layout presents information on Warehouse Operating Costs, Perfect Order Rate, On Time Shipments. It is also available for immediate download and adjustment. So, changes can be made in the color, design, graphics or any other component to create a unique layout.
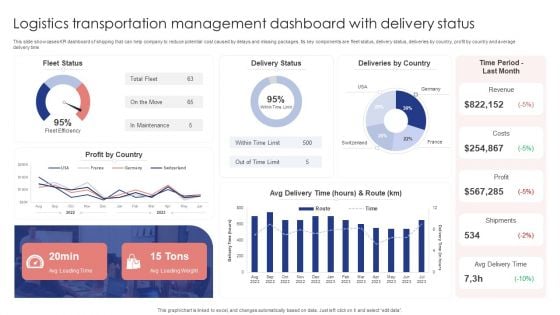
Logistics Transportation Management Dashboard With Delivery Status Portrait PDF
This slide showcases KPI dashboard of shipping that can help company to reduce potential cost caused by delays and missing packages. Its key components are fleet status, delivery status, deliveries by country, profit by country and average delivery time. Showcasing this set of slides titled Logistics Transportation Management Dashboard With Delivery Status Portrait PDF. The topics addressed in these templates are Fleet Status, Delivery Status, Deliveries By Country. All the content presented in this PPT design is completely editable. Download it and make adjustments in color, background, font etc. as per your unique business setting.
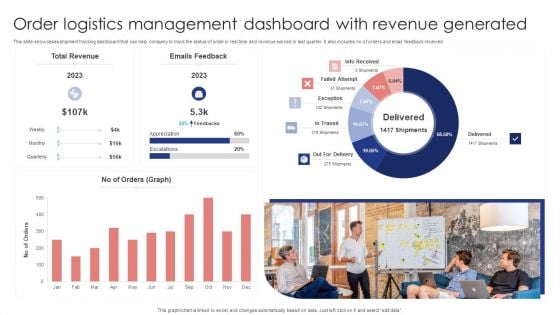
Order Logistics Management Dashboard With Revenue Generated Slides PDF
This slide showcases shipment tracking dashboard that can help company to track the status of order in real time and revenue earned in last quarter. It also includes no of orders and email feedback received. Showcasing this set of slides titled Order Logistics Management Dashboard With Revenue Generated Slides PDF. The topics addressed in these templates are Total Revenue, Emails Feedback, Orders Graph. All the content presented in this PPT design is completely editable. Download it and make adjustments in color, background, font etc. as per your unique business setting.
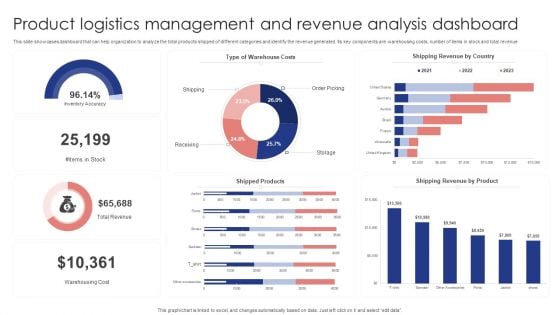
Product Logistics Management And Revenue Analysis Dashboard Demonstration PDF
This slide showcases dashboard that can help organization to analyze the total products shipped of different categories and identify the revenue generated. Its key components are warehousing costs, number of items in stock and total revenue. Pitch your topic with ease and precision using this Product Logistics Management And Revenue Analysis Dashboard Demonstration PDF. This layout presents information on Warehouse Costs, Shipping Revenue Country, Shipped Products . It is also available for immediate download and adjustment. So, changes can be made in the color, design, graphics or any other component to create a unique layout.
Dashboard For Tracking Global Share Market Indices Formats PDF
Following slide represent a comprehensive dashboard to track stock market indices of different countries. The indices mentioned in the slide are DOW jones, NASDAQ, S and P along with the highest and lowest price of indices on a particular day. Showcasing this set of slides titled Dashboard For Tracking Global Share Market Indices Formats PDF. The topics addressed in these templates are Global Share, Market Indices, Abbreviations. All the content presented in this PPT design is completely editable. Download it and make adjustments in color, background, font etc. as per your unique business setting.
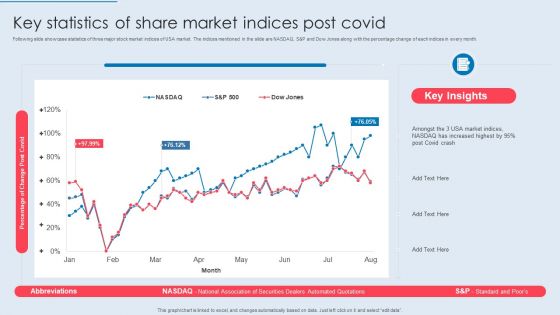
Key Statistics Of Share Market Indices Post Covid Sample PDF
Following slide showcase statistics of three major stock market indices of USA market. The indices mentioned in the slide are NASDAQ, S and P and Dow Jones along with the percentage change of each indices in every month. Showcasing this set of slides titled Key Statistics Of Share Market Indices Post Covid Sample PDF. The topics addressed in these templates are Percentage Change Post Covid, Increased Highest, Indices Post Covid. All the content presented in this PPT design is completely editable. Download it and make adjustments in color, background, font etc. as per your unique business setting.
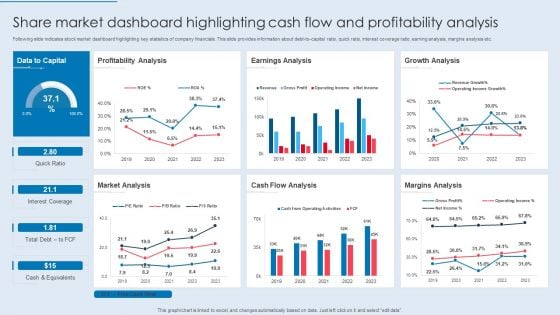
Share Market Dashboard Highlighting Cash Flow And Profitability Analysis Information PDF
Following slide indicates stock market dashboard highlighting key statistics of company financials. This slide provides information about debt-to-capital ratio, quick ratio, interest coverage ratio, earning analysis, margins analysis etc. Showcasing this set of slides titled Share Market Dashboard Highlighting Cash Flow And Profitability Analysis Information PDF. The topics addressed in these templates are Profitability Analysis, Earnings Analysis, Growth Analysis. All the content presented in this PPT design is completely editable. Download it and make adjustments in color, background, font etc. as per your unique business setting.
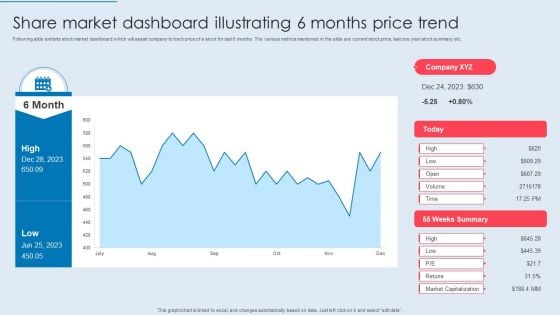
Share Market Dashboard Illustrating 6 Months Price Trend Ideas PDF
Following slide exhibits stock market dashboard which will assist company to track price of a stock for last 6 months. The various metrics mentioned in the slide are current stock price, last one year stock summary etc. Showcasing this set of slides titled Share Market Dashboard Illustrating 6 Months Price Trend Ideas PDF. The topics addressed in these templates are Share Market, Dashboard Illustrating, Months Price Trend. All the content presented in this PPT design is completely editable. Download it and make adjustments in color, background, font etc. as per your unique business setting.
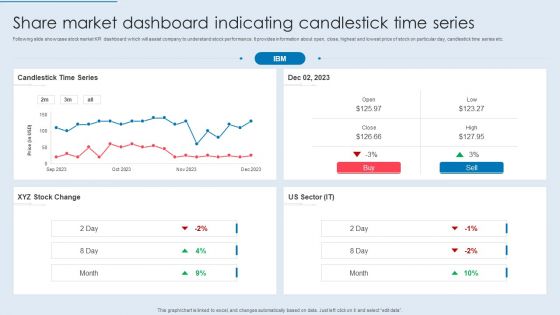
Share Market Dashboard Indicating Candlestick Time Series Formats PDF
Following slide showcase stock market KPI dashboard which will assist company to understand stock performance. It provides information about open, close, highest and lowest price of stock on particular day, candlestick time series etc. Pitch your topic with ease and precision using this Share Market Dashboard Indicating Candlestick Time Series Formats PDF. This layout presents information on Candlestick Time Series, Stock Change, US Sector. It is also available for immediate download and adjustment. So, changes can be made in the color, design, graphics or any other component to create a unique layout.
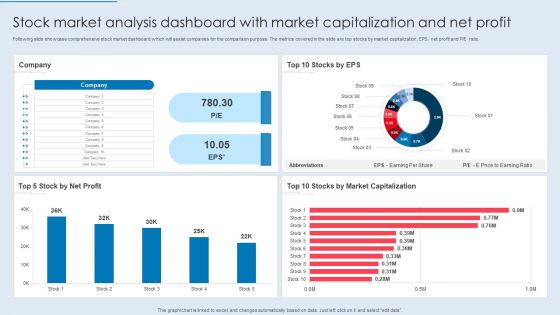
Stock Market Analysis Dashboard With Market Capitalization And Net Profit Elements PDF
Following slide showcase comprehensive stock market dashboard which will assist companies for the comparison purpose. The metrics covered in the slide are top stocks by market capitalization, EPS, net profit and PE ratio. Pitch your topic with ease and precision using this Stock Market Analysis Dashboard With Market Capitalization And Net Profit Elements PDF. This layout presents information on Company, Net Profit, Market Capitalization. It is also available for immediate download and adjustment. So, changes can be made in the color, design, graphics or any other component to create a unique layout.

Virtual Performance Management And Monitoring Dashboard Pictures PDF
Following slide illustrates remote performance dashboard utilized by organizations to monitor active issues and stay ahead of problems. This slide provides data regarding issues, problematic servers, unmonitored devices, server status, reboot time, etc. Pitch your topic with ease and precision using this Virtual Performance Management And Monitoring Dashboard Pictures PDF. This layout presents information on Total Devices, Devices With Problem, Regular Safety Check Problems. It is also available for immediate download and adjustment. So, changes can be made in the color, design, graphics or any other component to create a unique layout.
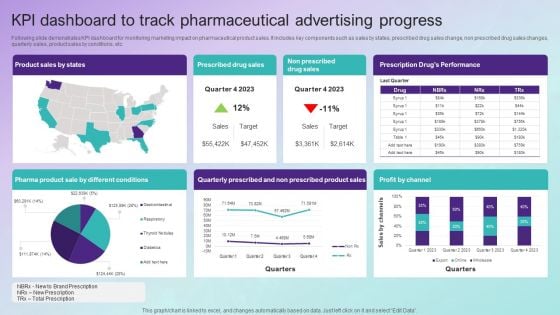
KPI Dashboard To Track Pharmaceutical Advertising Progress Topics PDF
Following slide demonstrates KPI dashboard for monitoring marketing impact on pharmaceutical product sales. It includes key components such as sales by states, prescribed drug sales change, non prescribed drug sales changes, quarterly sales, product sales by conditions, etc. Showcasing this set of slides titled KPI Dashboard To Track Pharmaceutical Advertising Progress Topics PDF. The topics addressed in these templates are Product Sales By States, Prescribed Drug Sales, Non Prescribed Drug Sales, Profit By Channel. All the content presented in this PPT design is completely editable. Download it and make adjustments in color, background, font etc. as per your unique business setting.
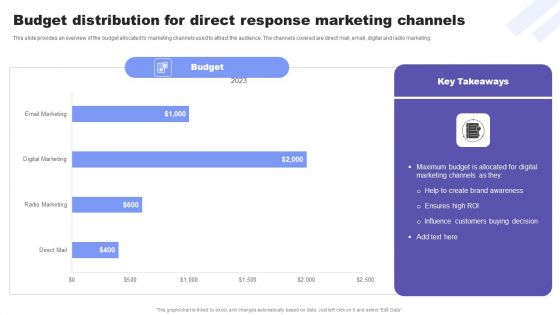
Direct Response Marketing Guide Ultimate Success Budget Distribution For Direct Sample PDF
This slide provides an overview of the budget allocated to marketing channels used to attract the audience. The channels covered are direct mail, email, digital and radio marketing. If your project calls for a presentation, then Slidegeeks is your go-to partner because we have professionally designed, easy-to-edit templates that are perfect for any presentation. After downloading, you can easily edit Direct Response Marketing Guide Ultimate Success Budget Distribution For Direct Sample PDF and make the changes accordingly. You can rearrange slides or fill them with different images. Check out all the handy templates
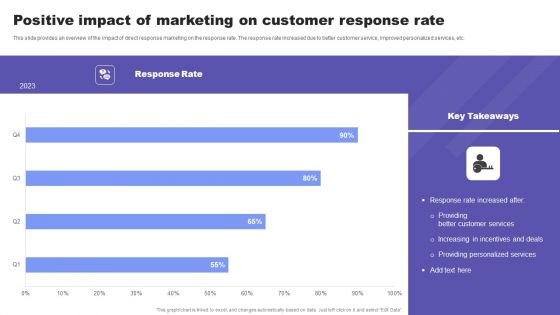
Direct Response Marketing Guide Ultimate Success Positive Impact Of Marketing On Customer Introduction PDF
This slide provides an overview of the impact of direct response marketing on the response rate. The response rate increased due to better customer service, improved personalized services, etc. Crafting an eye-catching presentation has never been more straightforward. Let your presentation shine with this tasteful yet straightforward Direct Response Marketing Guide Ultimate Success Positive Impact Of Marketing On Customer Introduction PDF template. It offers a minimalistic and classy look that is great for making a statement. The colors have been employed intelligently to add a bit of playfulness while still remaining professional. Construct the ideal Direct Response Marketing Guide Ultimate Success Positive Impact Of Marketing On Customer Introduction PDF that effortlessly grabs the attention of your audience Begin now and be certain to wow your customers
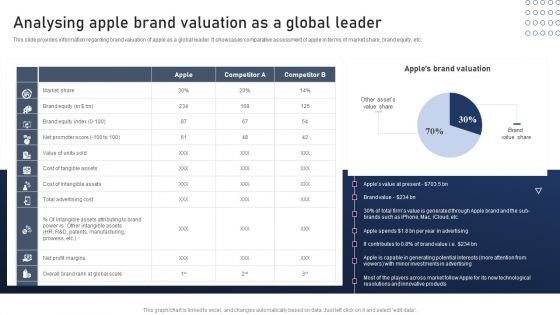
Discovering Apples Billion Dollar Branding Secret Analysing Apple Brand Valuation As A Global Leader Brochure PDF
This slide provides information regarding brand valuation of apple as a global leader. It showcases comparative assessment of apple in terms of market share, brand equity, etc. Create an editable Discovering Apples Billion Dollar Branding Secret Analysing Apple Brand Valuation As A Global Leader Ideas PDF that communicates your idea and engages your audience. Whether youre presenting a business or an educational presentation, pre designed presentation templates help save time. Discovering Apples Billion Dollar Branding Secret Analysing Apple Brand Valuation As A Global Leader Ideas PDF is highly customizable and very easy to edit, covering many different styles from creative to business presentations. Slidegeeks has creative team members who have crafted amazing templates. So, go and get them without any delay.
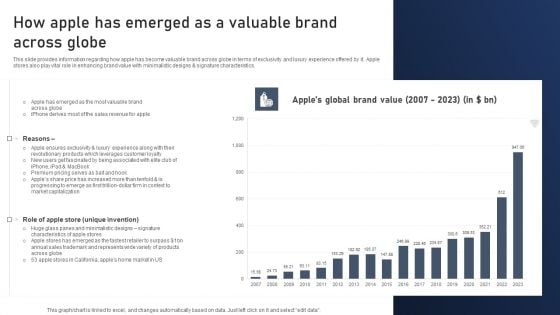
Discovering Apples Billion Dollar Branding Secret How Apple Has Emerged As A Valuable Brand Across Globe Graphics PDF
This slide provides information regarding how apple has become valuable brand across globe in terms of exclusivity and luxury experience offered by it. Apple stores also play vital role in enhancing brand value with minimalistic designs and signature characteristics. This modern and well arranged Discovering Apples Billion Dollar Branding Secret How Apple Has Emerged As A Valuable Brand Across Globe Graphics PDF provides lots of creative possibilities. It is very simple to customize and edit with the Powerpoint Software. Just drag and drop your pictures into the shapes. All facets of this template can be edited with Powerpoint no extra software is necessary. Add your own material, put your images in the places assigned for them, adjust the colors, and then you can show your slides to the world, with an animated slide included.
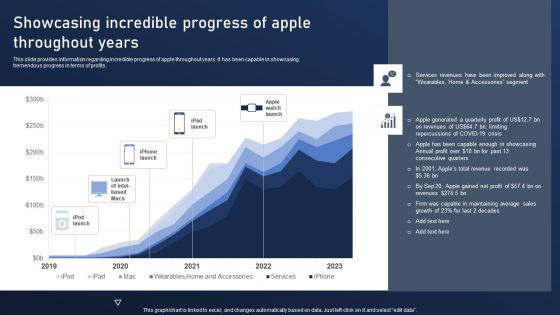
Discovering Apples Billion Dollar Branding Secret Showcasing Incredible Progress Of Apple Throughout Years Brochure PDF
This slide provides information regarding incredible progress of apple throughout years. It has been capable in showcasing tremendous progress in terms of profits. Take your projects to the next level with our ultimate collection of Discovering Apples Billion Dollar Branding Secret Showcasing Incredible Progress Of Apple Throughout Years Brochure PDF. Slidegeeks has designed a range of layouts that are perfect for representing task or activity duration, keeping track of all your deadlines at a glance. Tailor these designs to your exact needs and give them a truly corporate look with your own brand colors they will make your projects stand out from the rest.
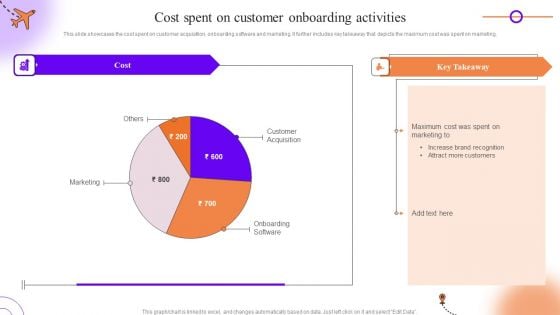
Client Onboarding Journey Impact On Business Cost Spent On Customer Onboarding Summary PDF
This slide showcases the cost spent on customer acquisition, onboarding software and marketing. It further includes key takeaway that depicts the maximum cost was spent on marketing. Find a pre-designed and impeccable Client Onboarding Journey Impact On Business Cost Spent On Customer Onboarding Summary PDF. The templates can ace your presentation without additional effort. You can download these easy-to-edit presentation templates to make your presentation stand out from others. So, what are you waiting for Download the template from Slidegeeks today and give a unique touch to your presentation.
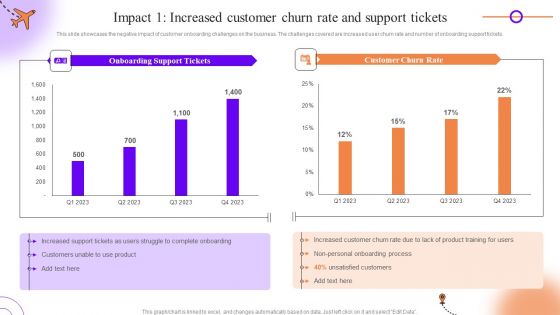
Client Onboarding Journey Impact On Business Impact 1 Increased Customer Churn Rate Download PDF
This slide showcases the negative impact of customer onboarding challenges on the business. The challenges covered are increased user churn rate and number of onboarding support tickets. Boost your pitch with our creative Client Onboarding Journey Impact On Business Impact 1 Increased Customer Churn Rate Download PDF. Deliver an awe-inspiring pitch that will mesmerize everyone. Using these presentation templates you will surely catch everyones attention. You can browse the ppts collection on our website. We have researchers who are experts at creating the right content for the templates. So you do not have to invest time in any additional work. Just grab the template now and use them.
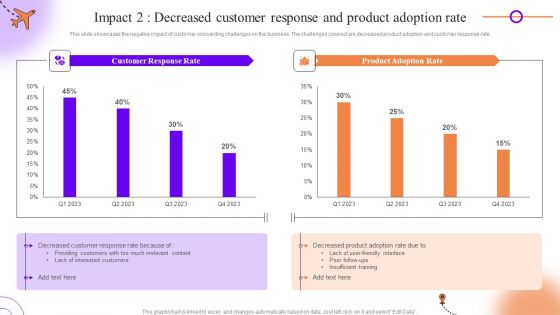
Client Onboarding Journey Impact On Business Impact 2 Decreased Customer Response Template PDF
This slide showcases the negative impact of customer onboarding challenges on the business. The challenges covered are decreased product adoption and customer response rate. Create an editable Client Onboarding Journey Impact On Business Impact 2 Decreased Customer Response Template PDF that communicates your idea and engages your audience. Whether you are presenting a business or an educational presentation, pre-designed presentation templates help save time. Client Onboarding Journey Impact On Business Impact 2 Decreased Customer Response Template PDF is highly customizable and very easy to edit, covering many different styles from creative to business presentations. Slidegeeks has creative team members who have crafted amazing templates. So, go and get them without any delay.
Intelligence Amplification IA IT Augmented Intelligence Information Tracking Dashboard Topics PDF
This slide depicts the information tracking dashboard by augmented intelligence model covering the data analysis. Data analysis includes image analysis, storage size, new users on the cloud platform, etc. Want to ace your presentation in front of a live audience Our Intelligence Amplification IA IT Augmented Intelligence Information Tracking Dashboard Topics PDF can help you do that by engaging all the users towards you.. Slidegeeks experts have put their efforts and expertise into creating these impeccable powerpoint presentations so that you can communicate your ideas clearly. Moreover, all the templates are customizable, and easy-to-edit and downloadable. Use these for both personal and commercial use.
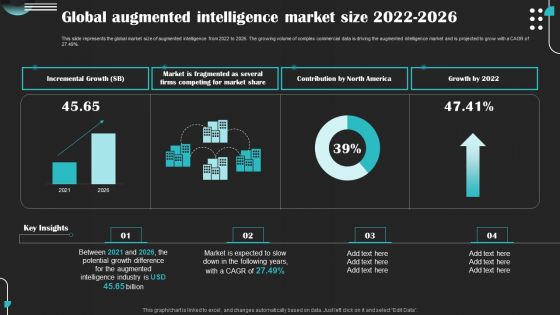
Intelligence Amplification IA IT Global Augmented Intelligence Market Size 2022 2026 Information PDF
This slide represents the global market size of augmented intelligence from 2022 to 2026. The growing volume of complex commercial data is driving the augmented intelligence market and is projected to grow with a CAGR of 27.49 percent. Get a simple yet stunning designed Intelligence Amplification IA IT Global Augmented Intelligence Market Size 2022 2026 Information PDF. It is the best one to establish the tone in your meetings. It is an excellent way to make your presentations highly effective. So, download this PPT today from Slidegeeks and see the positive impacts. Our easy-to-edit Intelligence Amplification IA IT Global Augmented Intelligence Market Size 2022 2026 Information PDF can be your go-to option for all upcoming conferences and meetings. So, what are you waiting for Grab this template today.

Cost Breakdown For Conducting Marketing Research Formats PDF
This slide covers cost breakdown for conducting market research more efficiently. It involves key elements such as reporting, project initiation, research design, field work and data analysis. If your project calls for a presentation, then Slidegeeks is your go-to partner because we have professionally designed, easy-to-edit templates that are perfect for any presentation. After downloading, you can easily edit Cost Breakdown For Conducting Marketing Research Formats PDF and make the changes accordingly. You can rearrange slides or fill them with different images. Check out all the handy templates
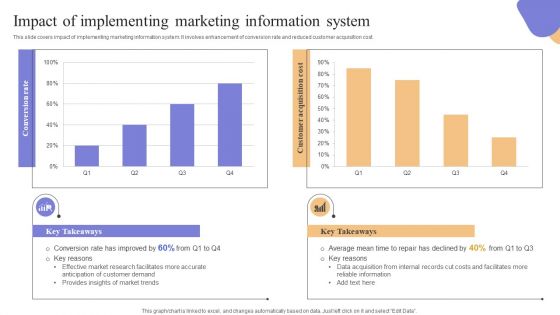
Impact Of Implementing Marketing Information System Template PDF
This slide covers impact of implementing marketing information system. It involves enhancement of conversion rate and reduced customer acquisition cost. Are you in need of a template that can accommodate all of your creative concepts This one is crafted professionally and can be altered to fit any style. Use it with Google Slides or PowerPoint. Include striking photographs, symbols, depictions, and other visuals. Fill, move around, or remove text boxes as desired. Test out color palettes and font mixtures. Edit and save your work, or work with colleagues. Download Impact Of Implementing Marketing Information System Template PDF and observe how to make your presentation outstanding. Give an impeccable presentation to your group and make your presentation unforgettable.
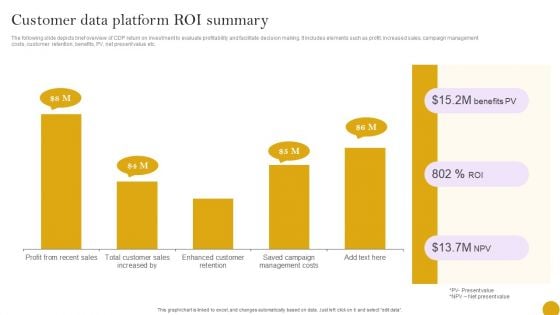
Comprehensive Customer Data Platform Guide Optimizing Promotional Initiatives Customer Data Platform ROI Summary Inspiration PDF
The following slide depicts brief overview of CDP return on investment to evaluate profitability and facilitate decision making. It includes elements such as profit, increased sales, campaign management costs, customer retention, benefits, PV, net present value etc. This Comprehensive Customer Data Platform Guide Optimizing Promotional Initiatives Customer Data Platform ROI Summary Inspiration PDF is perfect for any presentation, be it in front of clients or colleagues. It is a versatile and stylish solution for organizing your meetings. The Comprehensive Customer Data Platform Guide Optimizing Promotional Initiatives Customer Data Platform ROI Summary Inspiration PDF features a modern design for your presentation meetings. The adjustable and customizable slides provide unlimited possibilities for acing up your presentation. Slidegeeks has done all the homework before launching the product for you. So, do not wait, grab the presentation templates today
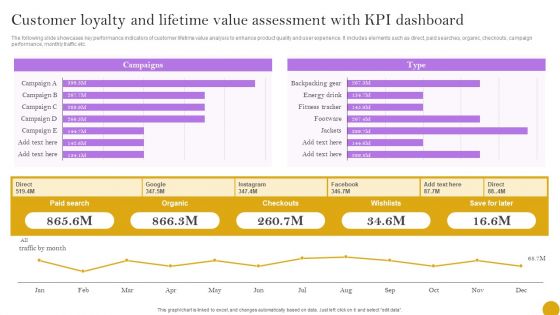
Comprehensive Customer Data Platform Guide Optimizing Promotional Initiatives Customer Loyalty And Lifetime Value Brochure PDF
The following slide showcases key performance indicators of customer lifetime value analysis to enhance product quality and user experience. It includes elements such as direct, paid searches, organic, checkouts, campaign performance, monthly traffic etc. Explore a selection of the finest Comprehensive Customer Data Platform Guide Optimizing Promotional Initiatives Customer Loyalty And Lifetime Value Brochure PDF here. With a plethora of professionally designed and pre made slide templates, you can quickly and easily find the right one for your upcoming presentation. You can use our Comprehensive Customer Data Platform Guide Optimizing Promotional Initiatives Customer Loyalty And Lifetime Value Brochure PDF to effectively convey your message to a wider audience. Slidegeeks has done a lot of research before preparing these presentation templates. The content can be personalized and the slides are highly editable. Grab templates today from Slidegeeks.
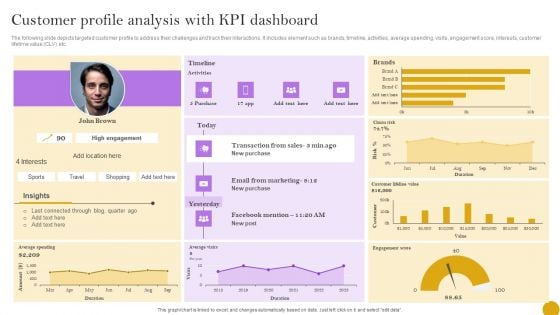
Comprehensive Customer Data Platform Guide Optimizing Promotional Initiatives Customer Profile Analysis KPI Dashboard Pictures PDF
The following slide depicts targeted customer profile to address their challenges and track their interactions. It includes element such as brands, timeline, activities, average spending, visits, engagement score, interests, customer lifetime value CLV etc. The best PPT templates are a great way to save time, energy, and resources. Slidegeeks have 100 percent editable powerpoint slides making them incredibly versatile. With these quality presentation templates, you can create a captivating and memorable presentation by combining visually appealing slides and effectively communicating your message. Download Comprehensive Customer Data Platform Guide Optimizing Promotional Initiatives Customer Profile Analysis KPI Dashboard Pictures PDF from Slidegeeks and deliver a wonderful presentation.
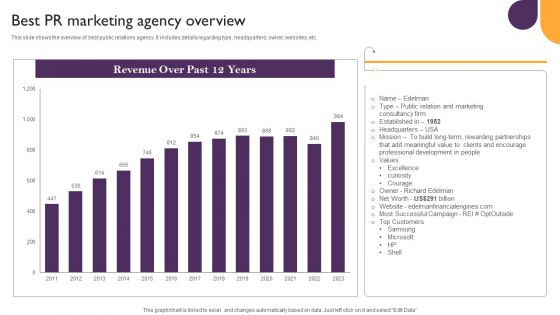
Public Relations Guide To Enhance Brand Credibility Best PR Marketing Agency Overview Elements PDF
This slide shows the overview of best public relations agency. It includes details regarding type, headquarters, owner, websites, etc. Do you have to make sure that everyone on your team knows about any specific topic I yes, then you should give Public Relations Guide To Enhance Brand Credibility Best PR Marketing Agency Overview Elements PDF a try. Our experts have put a lot of knowledge and effort into creating this impeccable Public Relations Guide To Enhance Brand Credibility Best PR Marketing Agency Overview Elements PDF. You can use this template for your upcoming presentations, as the slides are perfect to represent even the tiniest detail. You can download these templates from the Slidegeeks website and these are easy to edit. So grab these today.
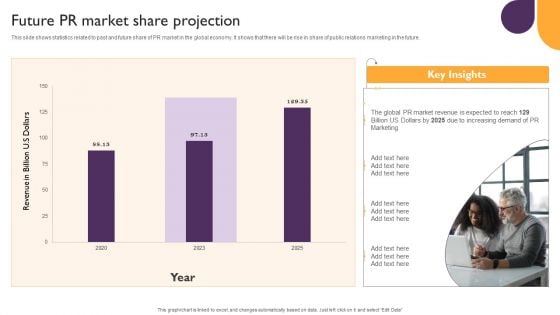
Public Relations Guide To Enhance Brand Credibility Future PR Market Share Projection Summary PDF
This slide shows statistics related to past and future share of PR market in the global economy. It shows that there will be rise in share of public relations marketing in the future. Find highly impressive Public Relations Guide To Enhance Brand Credibility Future PR Market Share Projection Summary PDF on Slidegeeks to deliver a meaningful presentation. You can save an ample amount of time using these presentation templates. No need to worry to prepare everything from scratch because Slidegeeks experts have already done a huge research and work for you. You need to download Public Relations Guide To Enhance Brand Credibility Future PR Market Share Projection Summary PDF for your upcoming presentation. All the presentation templates are 100 percent editable and you can change the color and personalize the content accordingly. Download now.
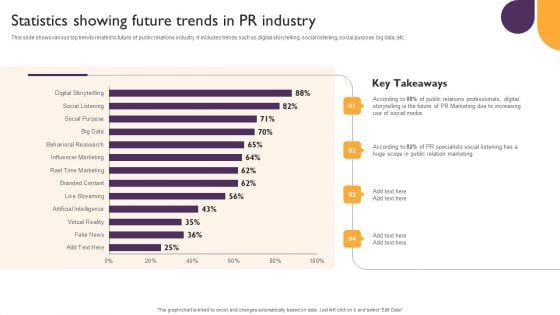
Public Relations Guide To Enhance Brand Credibility Statistics Showing Future Trends In PR Industry Ideas PDF
This slide shows various top trends related to future of public relations industry, It includes trends such as digital story telling, social listening, social purpose, big data, etc. This Public Relations Guide To Enhance Brand Credibility Statistics Showing Future Trends In PR Industry Ideas PDF from Slidegeeks makes it easy to present information on your topic with precision. It provides customization options, so you can make changes to the colors, design, graphics, or any other component to create a unique layout. It is also available for immediate download, so you can begin using it right away. Slidegeeks has done good research to ensure that you have everything you need to make your presentation stand out. Make a name out there for a brilliant performance.
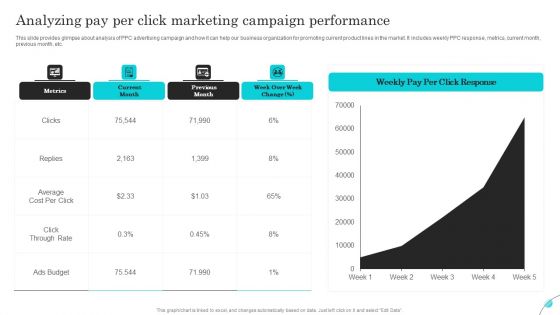
Analyzing Pay Per Click Marketing Campaign Performance Graphics PDF
This slide provides glimpse about analysis of PPC advertising campaign and how it can help our business organization for promoting current product lines in the market. It includes weekly PPC response, metrics, current month, previous month, etc. Find a pre designed and impeccable Analyzing Pay Per Click Marketing Campaign Performance Graphics PDF. The templates can ace your presentation without additional effort. You can download these easy to edit presentation templates to make your presentation stand out from others. So, what are you waiting for Download the template from Slidegeeks today and give a unique touch to your presentation.
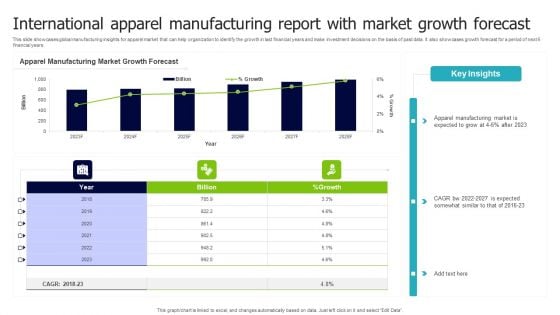
International Apparel Manufacturing Report With Market Growth Forecast Inspiration PDF
This slide showcases global manufacturing insights for apparel market that can help organization to identify the growth in last financial years and make investment decisions on the basis of past data. It also showcases growth forecast for a period of next 6 financial years. Pitch your topic with ease and precision using this International Apparel Manufacturing Report With Market Growth Forecast Inspiration PDF. This layout presents information on Apparel Manufacturing, Market Growth Forecast, Billion. It is also available for immediate download and adjustment. So, changes can be made in the color, design, graphics or any other component to create a unique layout.
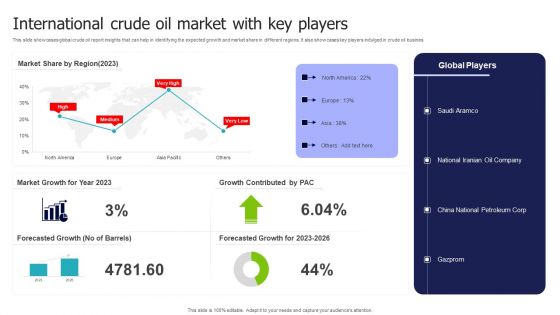
International Crude Oil Market With Key Players Demonstration PDF
This slide showcases global crude oil report insights that can help in identifying the expected growth and market share in different regions. It also showcases key players indulged in crude oil busines. Pitch your topic with ease and precision using this International Crude Oil Market With Key Players Demonstration PDF. This layout presents information on Market Share, Market Growth, Growth Contributed . It is also available for immediate download and adjustment. So, changes can be made in the color, design, graphics or any other component to create a unique layout.
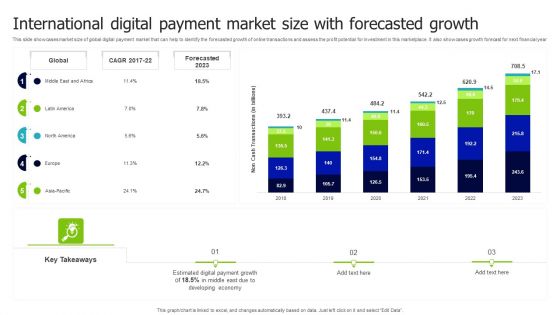
International Digital Payment Market Size With Forecasted Growth Inspiration PDF
This slide showcases market size of global digital payment market that can help to identify the forecasted growth of online transactions and assess the profit potential for investment in this marketplace. It also showcases growth forecast for next financial year. Pitch your topic with ease and precision using this International Digital Payment Market Size With Forecasted Growth Inspiration PDF. This layout presents information on Global, Forecasted, Growth. It is also available for immediate download and adjustment. So, changes can be made in the color, design, graphics or any other component to create a unique layout.
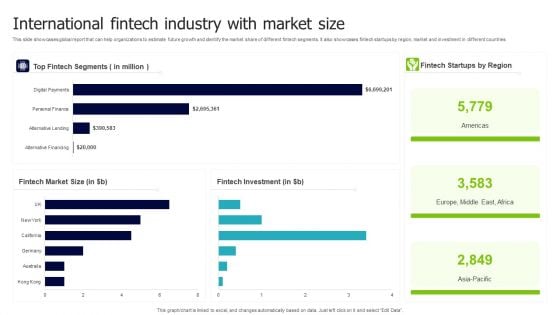
International Fintech Industry With Market Size Infographics PDF
This slide showcases global report that can help organizations to estimate future growth and identify the market share of different fintech segments. It also showcases fintech startups by region, market and investment in different countries. Showcasing this set of slides titled International Fintech Industry With Market Size Infographics PDF. The topics addressed in these templates are Fintech Segments, Region, Fintech Investment. All the content presented in this PPT design is completely editable. Download it and make adjustments in color, background, font etc. as per your unique business setting.

International Housing Market Trends With Key Drivers Inspiration PDF
This slide showcases global statistics that can help organizations to estimate the forecasted growth of housing market and identify stock by region. It also showcases key drivers contributing in new housing developments. Pitch your topic with ease and precision using this International Housing Market Trends With Key Drivers Inspiration PDF. This layout presents information on Key Drivers, Housing Market, Forecasted. It is also available for immediate download and adjustment. So, changes can be made in the color, design, graphics or any other component to create a unique layout.
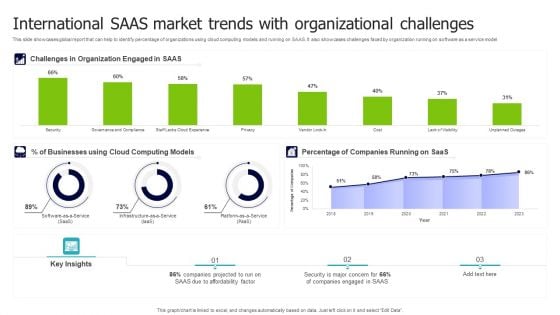
International SAAS Market Trends With Organizational Challenges Graphics PDF
This slide showcases global report that can help to identify percentage of organizations using cloud computing models and running on SAAS. It also showcases challenges faced by organization running on software as a service model. Showcasing this set of slides titled International SAAS Market Trends With Organizational Challenges Graphics PDF. The topics addressed in these templates are Challenges Organization, Businesses Using Cloud, Companies Running. All the content presented in this PPT design is completely editable. Download it and make adjustments in color, background, font etc. as per your unique business setting.
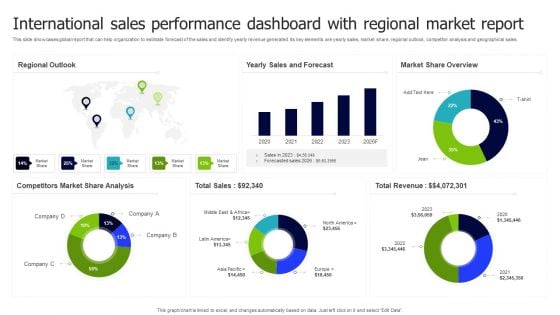
International Sales Performance Dashboard With Regional Market Report Inspiration PDF
This slide showcases global report that can help organization to estimate forecast of the sales and identify yearly revenue generated. Its key elements are yearly sales, market share, regional outlook, competitor analysis and geographical sales. Pitch your topic with ease and precision using this International Sales Performance Dashboard With Regional Market Report Inspiration PDF. This layout presents information on Regional Outlook, Sales And Forecast, Market Share Overview. It is also available for immediate download and adjustment. So, changes can be made in the color, design, graphics or any other component to create a unique layout.
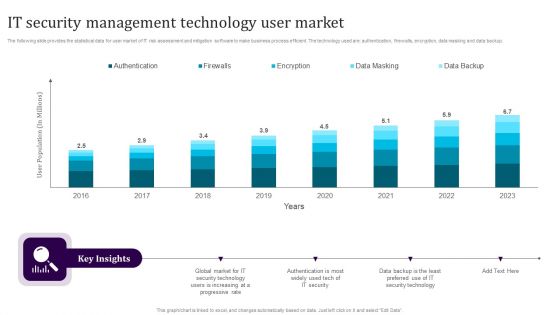
IT Security Management Technology User Market Guidelines PDF
The following slide provides the statistical data for user market of IT risk assessment and mitigation software to make business process efficient. The technology used are authentication, firewalls, encryption, data masking and data backup. Showcasing this set of slides titled IT Security Management Technology User Market Guidelines PDF. The topics addressed in these templates are Authentication, Firewalls, Encryption, Data Masking, Data Backup. All the content presented in this PPT design is completely editable. Download it and make adjustments in color, background, font etc. as per your unique business setting.
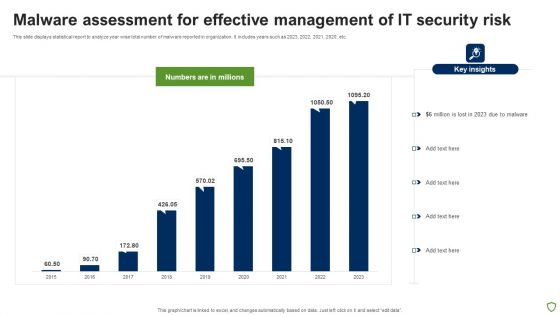
Malware Assessment For Effective Management Of IT Security Risk Portrait PDF
This slide displays statistical report to analyze year wise total number of malware reported in organization. It includes years such as 2023, 2022, 2021, 2020, etc. Showcasing this set of slides titled Malware Assessment For Effective Management Of IT Security Risk Portrait PDF. The topics addressed in these templates are Malware Assessment For Effective, Management IT Security Risk. All the content presented in this PPT design is completely editable. Download it and make adjustments in color, background, font etc. as per your unique business setting.
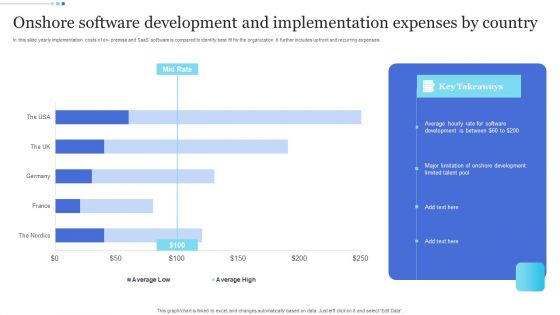
Onshore Software Development And Implementation Expenses By Country Template PDF
In this slide yearly implementation costs of on- premise and SaaS software is compared to identify best fit for the organization. It further includes upfront and recurring expenses. Showcasing this set of slides titled Onshore Software Development And Implementation Expenses By Country Template PDF. The topics addressed in these templates are Onshore Software Development, Implementation Expenses By Country. All the content presented in this PPT design is completely editable. Download it and make adjustments in color, background, font etc. as per your unique business setting.
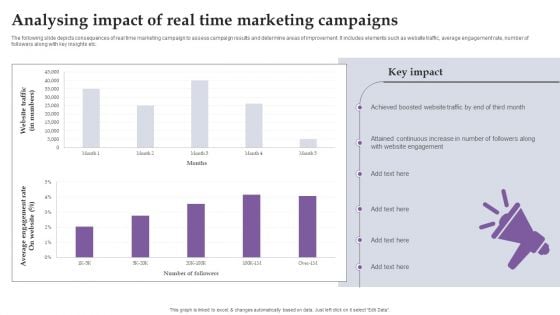
Analysing Impact Of Real Time Marketing Campaigns Ppt Show Graphic Images PDF
The following slide depicts consequences of real time marketing campaign to assess campaign results and determine areas of improvement. It includes elements such as website traffic, average engagement rate, number of followers along with key insights etc. Formulating a presentation can take up a lot of effort and time, so the content and message should always be the primary focus. The visuals of the PowerPoint can enhance the presenters message, so our Analysing Impact Of Real Time Marketing Campaigns Ppt Show Graphic Images PDF was created to help save time. Instead of worrying about the design, the presenter can concentrate on the message while our designers work on creating the ideal templates for whatever situation is needed. Slidegeeks has experts for everything from amazing designs to valuable content, we have put everything into Analysing Impact Of Real Time Marketing Campaigns Ppt Show Graphic Images PDF
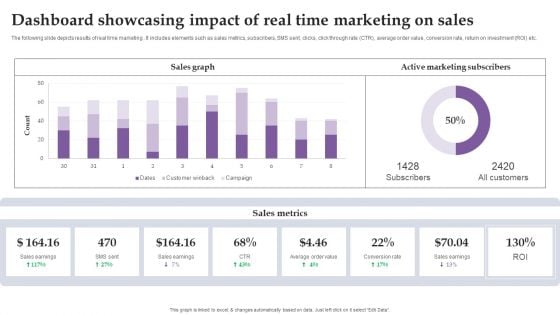
Dashboard Showcasing Impact Of Real Time Marketing On Sales Ppt Gallery Design Templates PDF
The following slide depicts results of real time marketing . It includes elements such as sales metrics, subscribers, SMS sent, clicks, click through rate CTR, average order value, conversion rate, return on investment ROI etc. This modern and well-arranged Dashboard Showcasing Impact Of Real Time Marketing On Sales Ppt Gallery Design Templates PDF provides lots of creative possibilities. It is very simple to customize and edit with the Powerpoint Software. Just drag and drop your pictures into the shapes. All facets of this template can be edited with Powerpoint, no extra software is necessary. Add your own material, put your images in the places assigned for them, adjust the colors, and then you can show your slides to the world, with an animated slide included.
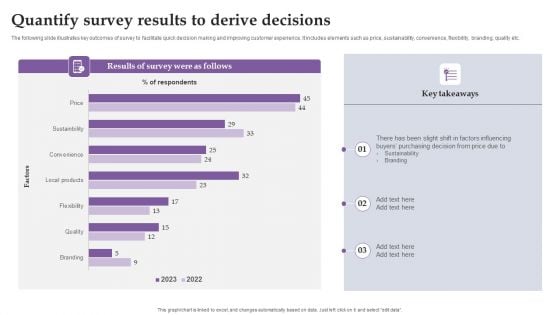
Quantify Survey Results To Derive Decisions Ppt Layouts Summary PDF
The following slide illustrates key outcomes of survey to facilitate quick decision making and improving customer experience. It includes elements such as price, sustainability, convenience, flexibility, branding, quality etc. The best PPT templates are a great way to save time, energy, and resources. Slidegeeks have 100 percent editable powerpoint slides making them incredibly versatile. With these quality presentation templates, you can create a captivating and memorable presentation by combining visually appealing slides and effectively communicating your message. Download Quantify Survey Results To Derive Decisions Ppt Layouts Summary PDF from Slidegeeks and deliver a wonderful presentation.

Real Time Content Marketing Result Dashboard Ppt Infographic Template Example PDF
The following slide depicts real time content marketing KPI dashboard to monitor traffic flow and manage promotional efforts. It includes elements such as visitors by channel, conversion rate, search, direct, sessions, average time engaged etc. The Real Time Content Marketing Result Dashboard Ppt Infographic Template Example PDF is a compilation of the most recent design trends as a series of slides. It is suitable for any subject or industry presentation, containing attractive visuals and photo spots for businesses to clearly express their messages. This template contains a variety of slides for the user to input data, such as structures to contrast two elements, bullet points, and slides for written information. Slidegeeks is prepared to create an impression.
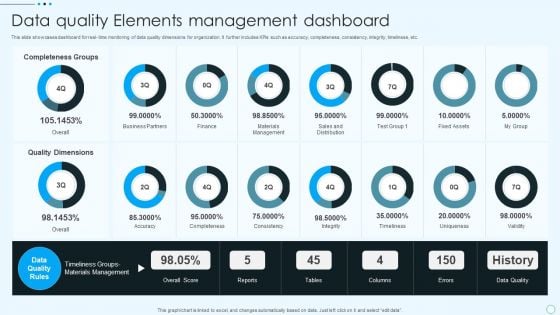
Data Quality Elements Management Dashboard Download PDF
This slide showcases dashboard for real- time monitoring of data quality dimensions for organization. It further includes KPIs such as accuracy, completeness, consistency, integrity, timeliness, etc. Showcasing this set of slides titled Data Quality Elements Management Dashboard Download PDF. The topics addressed in these templates are Quality Dimensions, Accuracy, Completeness, Consistency, Integrity, Timeliness. All the content presented in this PPT design is completely editable. Download it and make adjustments in color, background, font etc. as per your unique business setting.
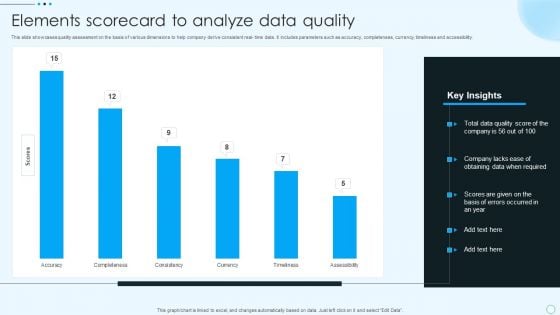
Elements Scorecard To Analyze Data Quality Structure PDF
This slide showcases quality assessment on the basis of various dimensions to help company derive consistent real- time data. It includes parameters such as accuracy, completeness, currency, timeliness and accessibility. Showcasing this set of slides titled Elements Scorecard To Analyze Data Quality Structure PDF. The topics addressed in these templates are Elements Scorecard, Analyze Data Quality. All the content presented in this PPT design is completely editable. Download it and make adjustments in color, background, font etc. as per your unique business setting.
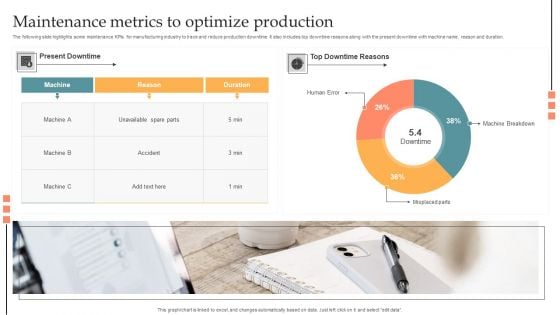
Maintenance Metrics To Optimize Production Information PDF
The following slide highlights some maintenance KPIs for manufacturing industry to trace and reduce production downtime. It also includes top downtime reasons along with the present downtime with machine name, reason and duration. Showcasing this set of slides titled Maintenance Metrics To Optimize Production Information PDF. The topics addressed in these templates are Human Error, Misplaced Parts, Machine Breakdown. All the content presented in this PPT design is completely editable. Download it and make adjustments in color, background, font etc. as per your unique business setting.
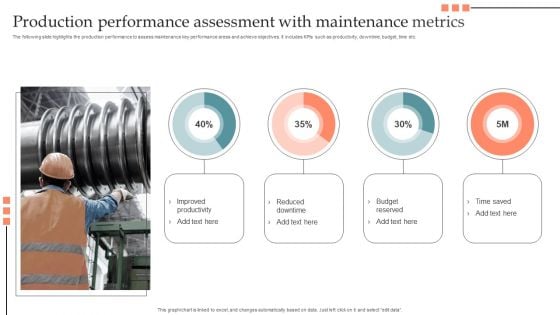
Production Performance Assessment With Maintenance Metrics Portrait PDF
The following slide highlights the production performance to assess maintenance key performance areas and achieve objectives. It includes KPIs such as productivity, downtime, budget, time etc. Showcasing this set of slides titled Production Performance Assessment With Maintenance Metrics Portrait PDF. The topics addressed in these templates are Improved Productivity, Reduced Downtime, Budget Reserved, Time Saved. All the content presented in this PPT design is completely editable. Download it and make adjustments in color, background, font etc. as per your unique business setting.
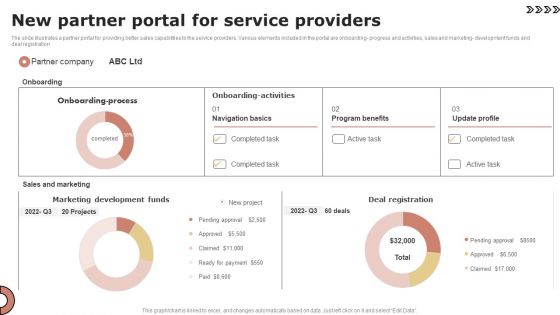
New Partner Portal For Service Providers Formats PDF
The slide illustrates a partner portal for providing better sales capabilities to the service providers. Various elements included in the portal are onboarding- progress and activities, sales and marketing- development funds and deal registration. Showcasing this set of slides titled New Partner Portal For Service Providers Formats PDF. The topics addressed in these templates are Onboarding Progress And Activities, Sales And Marketing, Development Funds, Deal Registration. All the content presented in this PPT design is completely editable. Download it and make adjustments in color, background, font etc. as per your unique business setting.
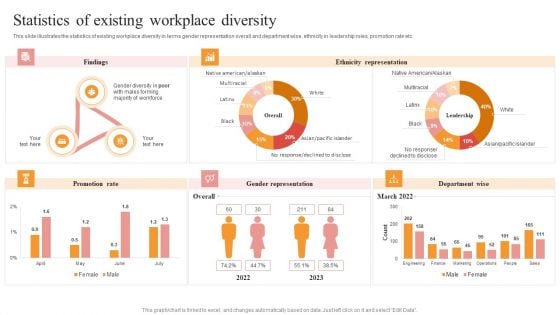
Statistics Of Existing Workplace Diversity Ideas PDF
This slide illustrates the statistics of existing workplace diversity in terms gender representation overall and department wise, ethnicity in leadership roles, promotion rate etc. The Statistics Of Existing Workplace Diversity Ideas PDF is a compilation of the most recent design trends as a series of slides. It is suitable for any subject or industry presentation, containing attractive visuals and photo spots for businesses to clearly express their messages. This template contains a variety of slides for the user to input data, such as structures to contrast two elements, bullet points, and slides for written information. Slidegeeks is prepared to create an impression.
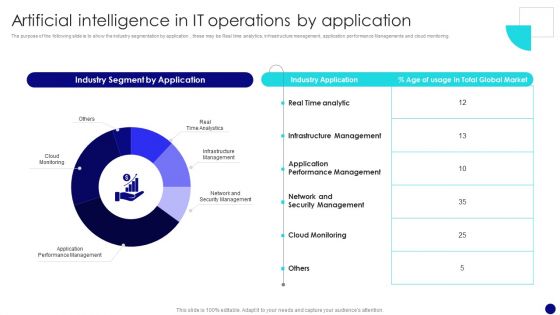
Information Technology Operations Administration With ML Artificial Intelligence In It Operations Introduction PDF
The purpose of the following slide is to show the industry segmentation by application , these may be Real time analytics, infrastructure management, application performance Managements and cloud monitoring. Are you in need of a template that can accommodate all of your creative concepts This one is crafted professionally and can be altered to fit any style. Use it with Google Slides or PowerPoint. Include striking photographs, symbols, depictions, and other visuals. Fill, move around, or remove text boxes as desired. Test out color palettes and font mixtures. Edit and save your work, or work with colleagues. Download Information Technology Operations Administration With ML Artificial Intelligence In It Operations Introduction PDF and observe how to make your presentation outstanding. Give an impeccable presentation to your group and make your presentation unforgettable.

Information Technology Operations Administration With ML Competitive Landscaping Graphics PDF
The purpose of the following slide is to show the industry segmentation by application , these may be Real time analytics, infrastructure management, application performance Managements and cloud monitoring. Formulating a presentation can take up a lot of effort and time, so the content and message should always be the primary focus. The visuals of the PowerPoint can enhance the presenters message, so our Information Technology Operations Administration With ML Competitive Landscaping Graphics PDF was created to help save time. Instead of worrying about the design, the presenter can concentrate on the message while our designers work on creating the ideal templates for whatever situation is needed. Slidegeeks has experts for everything from amazing designs to valuable content, we have put everything into Information Technology Operations Administration With ML Competitive Landscaping Graphics PDF.
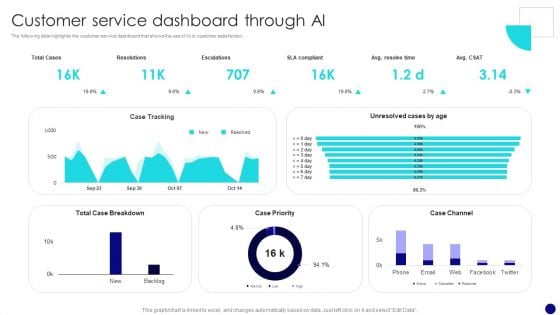
Information Technology Operations Administration With ML Customer Service Formats PDF
The following slide highlights the customer service dashboard that shows the use of AI in customer satisfaction. This modern and well arranged Information Technology Operations Administration With ML Customer Service Formats PDF provides lots of creative possibilities. It is very simple to customize and edit with the Powerpoint Software. Just drag and drop your pictures into the shapes. All facets of this template can be edited with Powerpoint no extra software is necessary. Add your own material, put your images in the places assigned for them, adjust the colors, and then you can show your slides to the world, with an animated slide included.
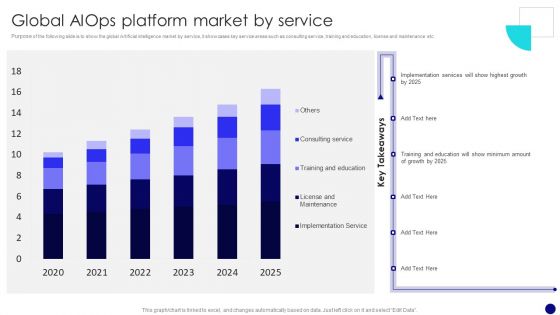
Information Technology Operations Administration With ML Global Aiops Platform Mockup PDF
Purpose of the following slide is to show the global Artificial intelligence market by service, it showcases key service areas such as consulting service, training and education, license and maintenance etc. The best PPT templates are a great way to save time, energy, and resources. Slidegeeks have 100 percent editable powerpoint slides making them incredibly versatile. With these quality presentation templates, you can create a captivating and memorable presentation by combining visually appealing slides and effectively communicating your message. Download Information Technology Operations Administration With ML Global Aiops Platform Mockup PDF from Slidegeeks and deliver a wonderful presentation.

Workplace Safety Dashboard Highlighting Injury Severity And Costs Rules PDF
This slide highlights the dashboard which showcase the critical incidents, incident cost, injury consequence, type of incident and severity level of the injury. Want to ace your presentation in front of a live audience Our Workplace Safety Dashboard Highlighting Injury Severity And Costs Rules PDF can help you do that by engaging all the users towards you. Slidegeeks experts have put their efforts and expertise into creating these impeccable powerpoint presentations so that you can communicate your ideas clearly. Moreover, all the templates are customizable, and easy to edit and downloadable. Use these for both personal and commercial use.
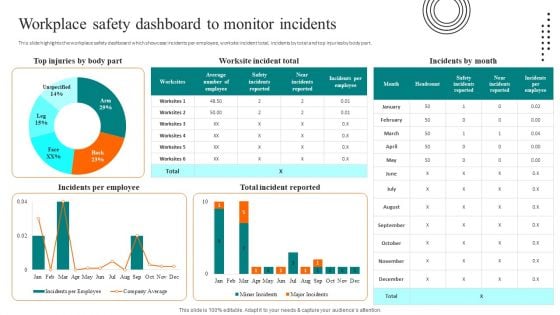
Workplace Safety Dashboard To Monitor Incidents Clipart PDF
This slide highlights the workplace safety dashboard which showcase incidents per employee, worksite incident total, incidents by total and top injuries by body part. There are so many reasons you need a Workplace Safety Dashboard To Monitor Incidents Clipart PDF. The first reason is you cannot spend time making everything from scratch, Thus, Slidegeeks has made presentation templates for you too. You can easily download these templates from our website easily.
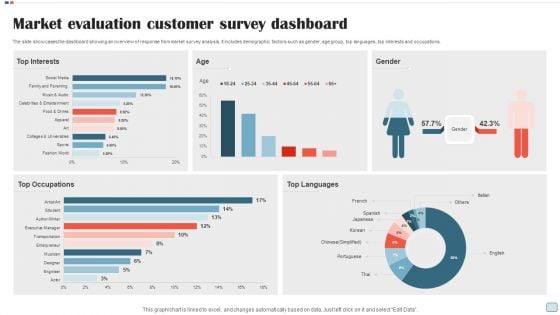
Market Evaluation Customer Survey Dashboard Topics PDF
The slide showcases the dashboard showing an overview of response from market survey analysis. It includes demographic factors such as gender, age group, top languages, top interests and occupations. Showcasing this set of slides titled Market Evaluation Customer Survey Dashboard Topics PDF. The topics addressed in these templates are Gender, Age Group, Top Languages, Top Interests And Occupations. All the content presented in this PPT design is completely editable. Download it and make adjustments in color, background, font etc. as per your unique business setting.
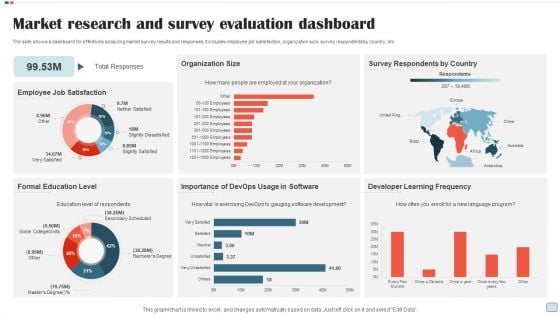
Market Research And Survey Evaluation Dashboard Rules PDF
The slide shows a dashboard for effectively analyzing market survey results and responses. It includes employee job satisfaction, organization size, survey respondents by country, etc. Pitch your topic with ease and precision using this Market Research And Survey Evaluation Dashboard Rules PDF. This layout presents information on Employee Job Satisfaction, Organization Size, Survey Respondents By Country. It is also available for immediate download and adjustment. So, changes can be made in the color, design, graphics or any other component to create a unique layout.
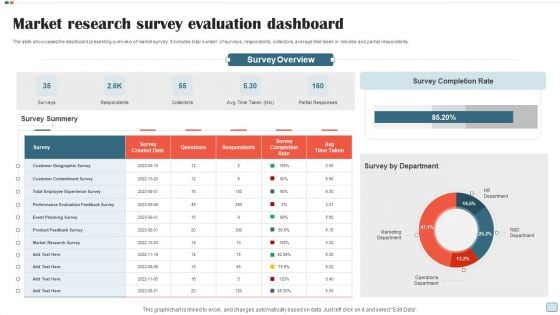
Market Research Survey Evaluation Dashboard Graphics PDF
The slide showcases the dashboard presenting overview of market survey. It includes total number of surveys, respondents, collectors, average time taken in minutes and partial respondents. Showcasing this set of slides titled Market Research Survey Evaluation Dashboard Graphics PDF. The topics addressed in these templates are Surveys, Respondents, Collectors, Partial Responses. All the content presented in this PPT design is completely editable. Download it and make adjustments in color, background, font etc. as per your unique business setting.
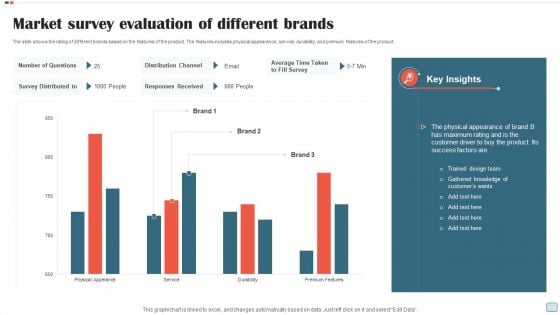
Market Survey Evaluation Of Different Brands Slides PDF
The slide shows the rating of different brands based on the features of the product. The features includes physical appearance, service, durability, and premium features of the product. Showcasing this set of slides titled Market Survey Evaluation Of Different Brands Slides PDF. The topics addressed in these templates are Physical Appearance, Service, Durability, Premium Features Product. All the content presented in this PPT design is completely editable. Download it and make adjustments in color, background, font etc. as per your unique business setting.
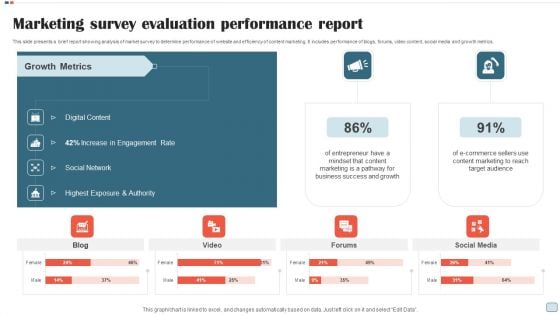
Marketing Survey Evaluation Performance Report Guidelines PDF
This slide presents a brief report showing analysis of market survey to determine performance of website and efficiency of content marketing. It includes performance of blogs, forums, video content, social media and growth metrics. Showcasing this set of slides titled Marketing Survey Evaluation Performance Report Guidelines PDF. The topics addressed in these templates are Digital Content, Engagement Rate, Social Network, Business Success, Growth. All the content presented in this PPT design is completely editable. Download it and make adjustments in color, background, font etc. as per your unique business setting.
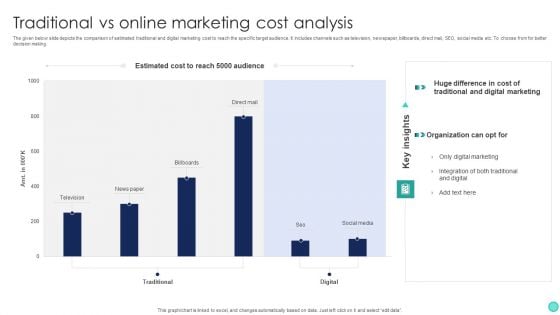
Traditional Vs Online Marketing Cost Analysis Summary PDF
The given below slide depicts the comparison of estimated traditional and digital marketing cost to reach the specific target audience. It includes channels such as television, newspaper, billboards, direct mail, SEO, social media etc. To choose from for better decision making. Showcasing this set of slides titled Traditional Vs Online Marketing Cost Analysis Summary PDF. The topics addressed in these templates are Digital Marketing, Organization, Traditional. All the content presented in this PPT design is completely editable. Download it and make adjustments in color, background, font etc. as per your unique business setting.
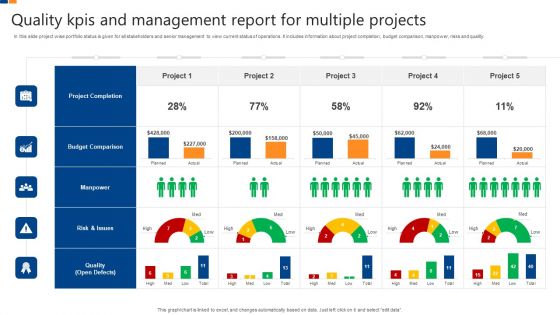
Quality Kpis And Management Report For Multiple Projects Elements PDF
In this slide project wise portfolio status is given for all stakeholders and senior management to view current status of operations. It includes information about project completion, budget comparison, manpower, risks and quality. Pitch your topic with ease and precision using this Quality Kpis And Management Report For Multiple Projects Elements PDF. This layout presents information on Project Completion, Budget Comparison, Manpower, Risks And Quality. It is also available for immediate download and adjustment. So, changes can be made in the color, design, graphics or any other component to create a unique layout.
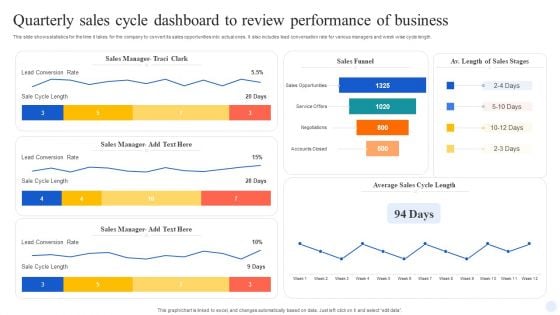
Quarterly Sales Cycle Dashboard To Review Performance Of Business Demonstration PDF
This slide shows statistics for the time it takes for the company to convert its sales opportunities into actual ones. It also includes lead conversation rate for various managers and week wise cycle length. Showcasing this set of slides titled Quarterly Sales Cycle Dashboard To Review Performance Of Business Demonstration PDF. The topics addressed in these templates are Sales Manager, Sales Funnel, Lead Conversion Rate. All the content presented in this PPT design is completely editable. Download it and make adjustments in color, background, font etc. as per your unique business setting.
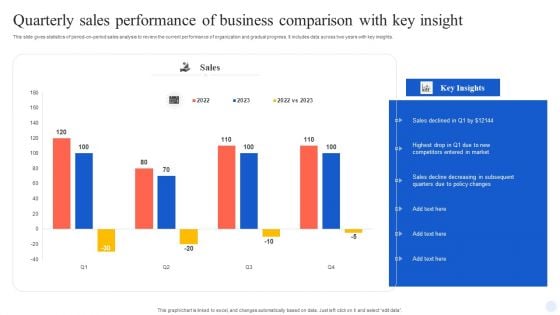
Quarterly Sales Performance Of Business Comparison With Key Insight Guidelines PDF
This slide gives statistics of period-on-period sales analysis to review the current performance of organization and gradual progress. It includes data across two years with key insights. Showcasing this set of slides titled Quarterly Sales Performance Of Business Comparison With Key Insight Guidelines PDF. The topics addressed in these templates are Quarterly Sales Performance, Business Comparison, Key Insight. All the content presented in this PPT design is completely editable. Download it and make adjustments in color, background, font etc. as per your unique business setting.
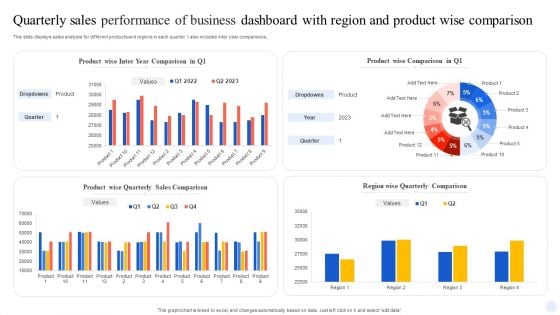
Quarterly Sales Performance Of Business Dashboard With Region And Product Wise Comparison Guidelines PDF
This slide displays sales analysis for different products and regions in each quarter. t also includes inter year comparisons. Pitch your topic with ease and precision using this Quarterly Sales Performance Of Business Dashboard With Region And Product Wise Comparison Guidelines PDF. This layout presents information on Product Wise Quarterly Sales, Comparison. It is also available for immediate download and adjustment. So, changes can be made in the color, design, graphics or any other component to create a unique layout.
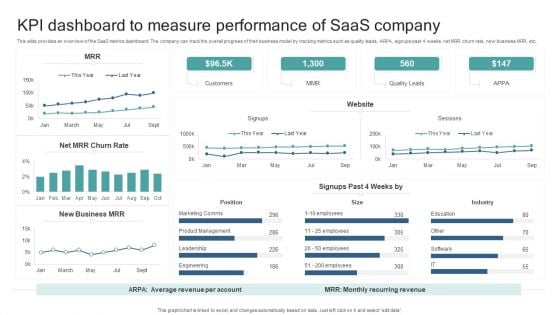
KPI Dashboard To Measure Performance Of Saas Company Introduction PDF
This slide provides an overview of the SaaS metrics dashboard. The company can track the overall progress of their business model by tracking metrics such as quality leads, ARPA, signups past 4 weeks, net MRR churn rate, new business MRR, etc. Pitch your topic with ease and precision using this KPI Dashboard To Measure Performance Of Saas Company Introduction PDF. This layout presents information on Industry, Position, Customers, Quality Leads. It is also available for immediate download and adjustment. So, changes can be made in the color, design, graphics or any other component to create a unique layout.
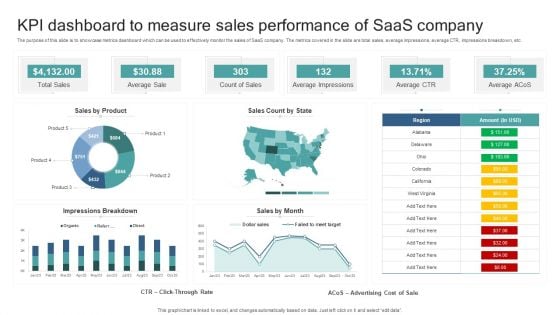
KPI Dashboard To Measure Sales Performance Of Saas Company Summary PDF
The purpose of this slide is to showcase metrics dashboard which can be used to effectively monitor the sales of SaaS company. The metrics covered in the slide are total sales, average impressions, average CTR, impressions breakdown, etc. Showcasing this set of slides titled KPI Dashboard To Measure Sales Performance Of Saas Company Summary PDF. The topics addressed in these templates are Total Sales, Average Sale, Count Of Sales, Average Impressions, Average Ctr. All the content presented in this PPT design is completely editable. Download it and make adjustments in color, background, font etc. as per your unique business setting.
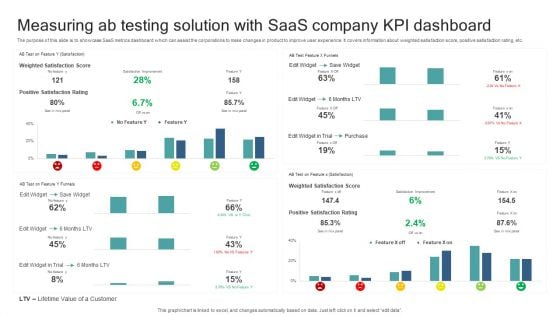
Measuring Ab Testing Solution With Saas Company KPI Dashboard Guidelines PDF
The purpose of this slide is to showcase SaaS metrics dashboard which can assist the corporations to make changes in product to improve user experience. It covers information about weighted satisfaction score, positive satisfaction rating, etc. Pitch your topic with ease and precision using this Measuring Ab Testing Solution With Saas Company KPI Dashboard Guidelines PDF. This layout presents information on Lifetime Value Customer, Positive Satisfaction Rating, Save Widget, Weighted Satisfaction Score. It is also available for immediate download and adjustment. So, changes can be made in the color, design, graphics or any other component to create a unique layout.
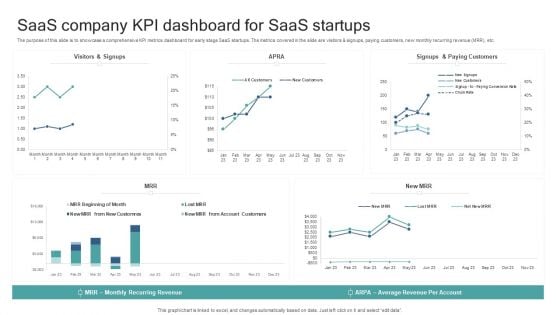
Saas Company KPI Dashboard For Saas Startups Background PDF
The purpose of this slide is to showcase a comprehensive KPI metrics dashboard for early stage SaaS startups. The metrics covered in the slide are visitors and signups, paying customers, new monthly recurring revenue MRR, etc. Showcasing this set of slides titled Saas Company KPI Dashboard For Saas Startups Background PDF. The topics addressed in these templates are Average Revenue Per Account, Monthly Recurring Revenue. All the content presented in this PPT design is completely editable. Download it and make adjustments in color, background, font etc. as per your unique business setting.
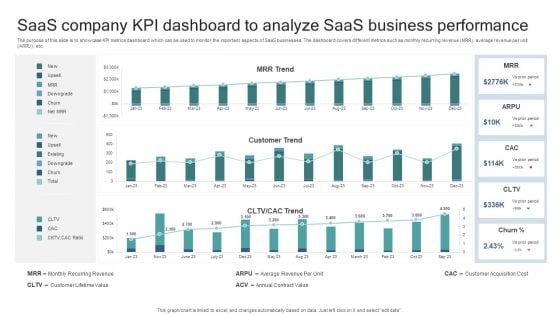
Saas Company KPI Dashboard To Analyze Saas Business Performance Elements PDF
The purpose of this slide is to showcase KPI metrics dashboard which can be used to monitor the important aspects of SaaS businesses. The dashboard covers different metrics such as monthly recurring revenue MRR, average revenue per unit ARPU, etc. Pitch your topic with ease and precision using this Saas Company KPI Dashboard To Analyze Saas Business Performance Elements PDF. This layout presents information on Monthly Recurring Revenue, Customer Lifetime Value, Average Revenue Per Unit, Annual Contract Value, Customer Acquisition Cost. It is also available for immediate download and adjustment. So, changes can be made in the color, design, graphics or any other component to create a unique layout.
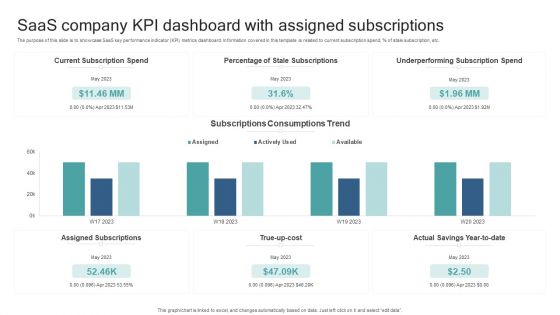
Saas Company KPI Dashboard With Assigned Subscriptions Formats PDF
The purpose of this slide is to showcase SaaS key performance indicator KPI metrics dashboard. Information covered in this template is related to current subscription spend, percent of stale subscription, etc. Pitch your topic with ease and precision using this Saas Company KPI Dashboard With Assigned Subscriptions Formats PDF. This layout presents information on Current Subscription Spend, Percentage Of Stale Subscriptions, True Up Cost, Underperforming Subscription Spend. It is also available for immediate download and adjustment. So, changes can be made in the color, design, graphics or any other component to create a unique layout.
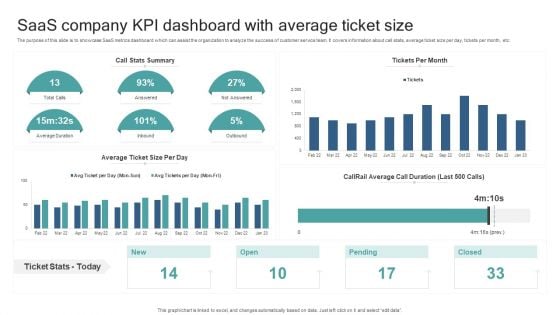
Saas Company KPI Dashboard With Average Ticket Size Sample PDF
The purpose of this slide is to showcase SaaS metrics dashboard which can assist the organization to analyze the success of customer service team. It covers information about call stats, average ticket size per day, tickets per month, etc. Showcasing this set of slides titled Saas Company KPI Dashboard With Average Ticket Size Sample PDF. The topics addressed in these templates are Saas Company Kpi, Dashboard, Average Ticket Size. All the content presented in this PPT design is completely editable. Download it and make adjustments in color, background, font etc. as per your unique business setting.
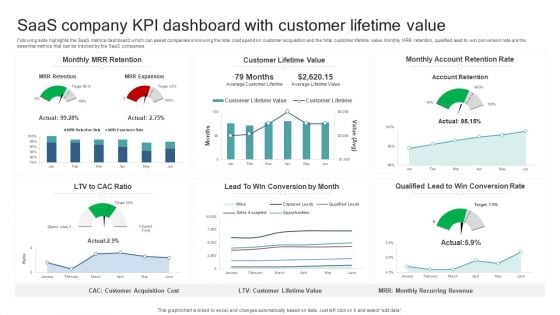
Saas Company KPI Dashboard With Customer Lifetime Value Professional PDF
Following slide highlights the SaaS metrics dashboard which can assist companies in knowing the total cost spend on customer acquisition and the total customer lifetime value. Monthly MRR retention, qualified lead to win conversion rate are the essential metrics that can be tracked by the SaaS companies. Showcasing this set of slides titled Saas Company KPI Dashboard With Customer Lifetime Value Professional PDF. The topics addressed in these templates are Monthly Mrr Retention, Customer Lifetime Value, Monthly Account Retention Rate. All the content presented in this PPT design is completely editable. Download it and make adjustments in color, background, font etc. as per your unique business setting.
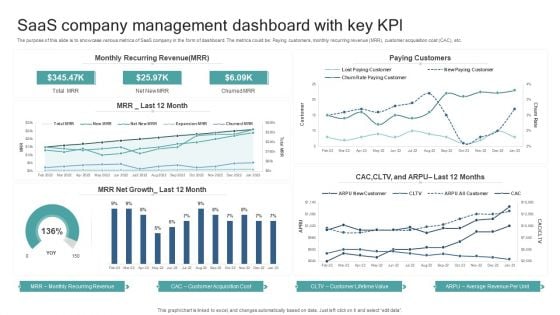
Saas Company Management Dashboard With Key Kpl Template PDF
The purpose of this slide is to showcase various metrics of SaaS company in the form of dashboard. The metrics could be, Paying customers, monthly recurring revenue MRR, customer acquisition cost CAC, etc. Showcasing this set of slides titled Saas Company Management Dashboard With Key Kpl Template PDF. The topics addressed in these templates are Monthly Recurring Revenue, Customer Acquisition Cost, Customer Lifetime Value, Average Revenue Per Unit. All the content presented in this PPT design is completely editable. Download it and make adjustments in color, background, font etc. as per your unique business setting.
Marketers Guide To Data Analysis Optimization Dashboard For Tracking Business Blog Kpis Infographics PDF
This slide covers the dashboard for analyzing blogging KPIs such as performance, published posts, views, new blog subscribers, top blog posts by pageviews, top blog posts by CTR, etc. Coming up with a presentation necessitates that the majority of the effort goes into the content and the message you intend to convey. The visuals of a PowerPoint presentation can only be effective if it supplements and supports the story that is being told. Keeping this in mind our experts created Marketers Guide To Data Analysis Optimization Dashboard For Tracking Business Blog Kpis Infographics PDF to reduce the time that goes into designing the presentation. This way, you can concentrate on the message while our designers take care of providing you with the right template for the situation.
Marketers Guide To Data Analysis Optimization KPI Dashboard For Tracking Email Marketing Campaign Infographics PDF
This slide covers the dashboard for analyzing email marketing metrics such as overall open rate, click-through rate, click-to-open ratio, unsubscribe rate, hard bounce rate, soft rate, monthly open rate, total monthly subscribers, etc. Presenting this PowerPoint presentation, titled Marketers Guide To Data Analysis Optimization KPI Dashboard For Tracking Email Marketing Campaign Infographics PDF, with topics curated by our researchers after extensive research. This editable presentation is available for immediate download and provides attractive features when used. Download now and captivate your audience. Presenting this Marketers Guide To Data Analysis Optimization KPI Dashboard For Tracking Email Marketing Campaign Infographics PDF. Our researchers have carefully researched and created these slides with all aspects taken into consideration. This is a completely customizable Marketers Guide To Data Analysis Optimization KPI Dashboard For Tracking Email Marketing Campaign Infographics PDF that is available for immediate downloading. Download now and make an impact on your audience. Highlight the attractive features available with our PPTs.
Marketers Guide To Data Analysis Optimization KPI Dashboard For Tracking Paid Ad Campaign Performance Clipart PDF
This slide covers the dashboard for analyzing paid search metrics such as ad cost, clicks, impressions, click-through rate, cost per conversion, conversion rate, cost per click, etc. Here you can discover an assortment of the finest PowerPoint and Google Slides templates. With these templates, you can create presentations for a variety of purposes while simultaneously providing your audience with an eye catching visual experience. Download Marketers Guide To Data Analysis Optimization KPI Dashboard For Tracking Paid Ad Campaign Performance Clipart PDF to deliver an impeccable presentation. These templates will make your job of preparing presentations much quicker, yet still, maintain a high level of quality. Slidegeeks has experienced researchers who prepare these templates and write high quality content for you. Later on, you can personalize the content by editing the Marketers Guide To Data Analysis Optimization KPI Dashboard For Tracking Paid Ad Campaign Performance Clipart PDF.
Marketers Guide To Data Analysis Optimization KPI Dashboard For Tracking SEO Analytics Template PDF
This slide covers the KPI dashboard for analyzing SEO metrics such as authority score, organic traffic, organic keywords, paid keywords, ref. Domains, site audit, link-building tool, organic traffic, on-page SEO checker, backlink audit, etc. This Marketers Guide To Data Analysis Optimization KPI Dashboard For Tracking SEO Analytics Template PDF from Slidegeeks makes it easy to present information on your topic with precision. It provides customization options, so you can make changes to the colors, design, graphics, or any other component to create a unique layout. It is also available for immediate download, so you can begin using it right away. Slidegeeks has done good research to ensure that you have everything you need to make your presentation stand out. Make a name out there for a brilliant performance.

Marketers Guide To Data Analysis Optimization Social Media Analytics KPI Dashboard Clipart PDF
This slide covers a dashboard for tracking social media KPIs such as face engagements, total likes, followers, audience growth, YouTube subscribers, views, Instagram reach and , likes, LinkedIn impressions, etc. Find a pre designed and impeccable Marketers Guide To Data Analysis Optimization Social Media Analytics KPI Dashboard Clipart PDF. The templates can ace your presentation without additional effort. You can download these easy to edit presentation templates to make your presentation stand out from others. So, what are you waiting for Download the template from Slidegeeks today and give a unique touch to your presentation.
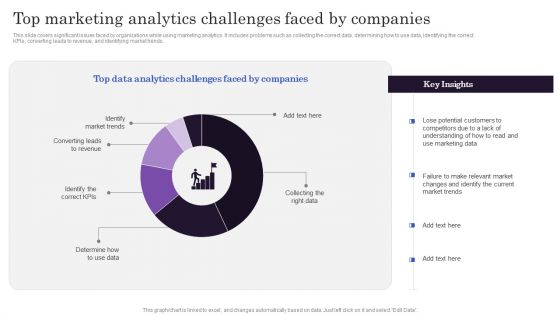
Marketers Guide To Data Analysis Optimization Top Marketing Analytics Challenges Faced By Companies Formats PDF
This slide covers significant issues faced by organizations while using marketing analytics. It includes problems such as collecting the correct data, determining how to use data, identifying the correct KPIs, converting leads to revenue, and identifying market trends. Boost your pitch with our creative Marketers Guide To Data Analysis Optimization Top Marketing Analytics Challenges Faced By Companies Formats PDF. Deliver an awe-inspiring pitch that will mesmerize everyone. Using these presentation templates you will surely catch everyones attention. You can browse the ppts collection on our website. We have researchers who are experts at creating the right content for the templates. So you do not have to invest time in any additional work. Just grab the template now and use them.
Marketers Guide To Data Analysis Optimization Website Landing Page KPI Tracking Dashboard Information PDF
This slide covers a dashboard for analyzing the metrics of the website landing page. It includes KPIs such as conversions, conversion rate, sessions, bounce rate, engagement sickness, etc. Present like a pro with Marketers Guide To Data Analysis Optimization Website Landing Page KPI Tracking Dashboard Information PDF Create beautiful presentations together with your team, using our easy to use presentation slides. Share your ideas in real time and make changes on the fly by downloading our templates. So whether you are in the office, on the go, or in a remote location, you can stay in sync with your team and present your ideas with confidence. With Slidegeeks presentation got a whole lot easier. Grab these presentations today.
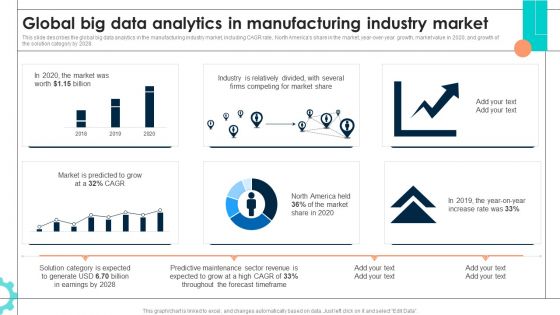
Intelligent Manufacturing Global Big Data Analytics In Manufacturing Industry Market Structure PDF
This slide describes the global big data analytics in the manufacturing industry market, including CAGR rate, North Americas share in the market, year-over-year growth, market value in 2020, and growth of the solution category by 2028. Formulating a presentation can take up a lot of effort and time, so the content and message should always be the primary focus. The visuals of the PowerPoint can enhance the presenters message, so our Intelligent Manufacturing Global Big Data Analytics In Manufacturing Industry Market Structure PDF was created to help save time. Instead of worrying about the design, the presenter can concentrate on the message while our designers work on creating the ideal templates for whatever situation is needed. Slidegeeks has experts for everything from amazing designs to valuable content, we have put everything into Intelligent Manufacturing Global Big Data Analytics In Manufacturing Industry Market Structure PDF
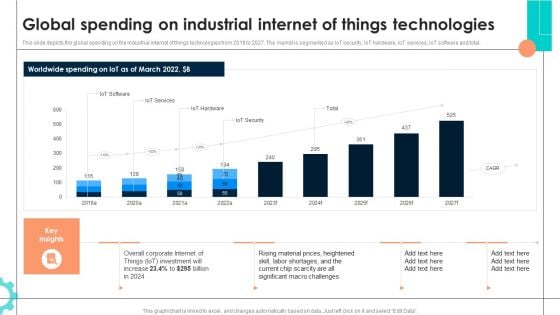
Intelligent Manufacturing Global Spending On Industrial Internet Of Things Technologies Infographics PDF
This slide depicts the global spending on the industrial internet of things technologies from 2019 to 2027. The market is segmented as IoT security, IoT hardware, IoT services, IoT software and total. Coming up with a presentation necessitates that the majority of the effort goes into the content and the message you intend to convey. The visuals of a PowerPoint presentation can only be effective if it supplements and supports the story that is being told. Keeping this in mind our experts created Intelligent Manufacturing Global Spending On Industrial Internet Of Things Technologies Infographics PDF to reduce the time that goes into designing the presentation. This way, you can concentrate on the message while our designers take care of providing you with the right template for the situation.
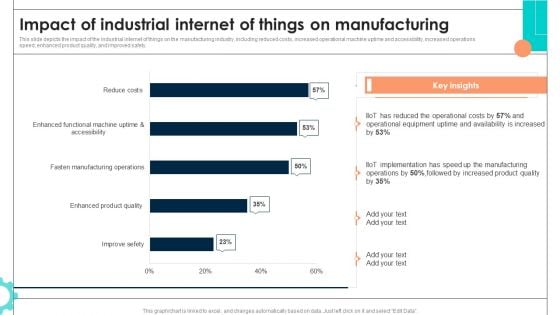
Intelligent Manufacturing Impact Of Industrial Internet Of Things On Manufacturing Microsoft PDF
This slide depicts the impact of the industrial internet of things on the manufacturing industry, including reduced costs, increased operational machine uptime and accessibility, increased operations speed, enhanced product quality, and improved safety. The Intelligent Manufacturing Impact Of Industrial Internet Of Things On Manufacturing Microsoft PDF is a compilation of the most recent design trends as a series of slides. It is suitable for any subject or industry presentation, containing attractive visuals and photo spots for businesses to clearly express their messages. This template contains a variety of slides for the user to input data, such as structures to contrast two elements, bullet points, and slides for written information. Slidegeeks is prepared to create an impression.
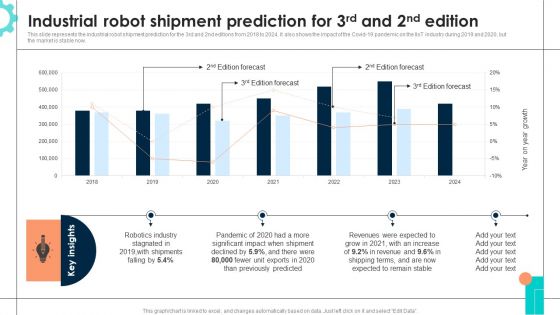
Intelligent Manufacturing Industrial Robot Shipment Prediction For 3Rd And 2Nd Edition Microsoft PDF
This slide represents the industrial robot shipment prediction for the 3rd and 2nd editions from 2018 to 2024. It also shows the impact of the Covid-19 pandemic on the IIoT industry during 2019 and 2020, but the market is stable now. Here you can discover an assortment of the finest PowerPoint and Google Slides templates. With these templates, you can create presentations for a variety of purposes while simultaneously providing your audience with an eye catching visual experience. Download Intelligent Manufacturing Industrial Robot Shipment Prediction For 3Rd And 2Nd Edition Microsoft PDF to deliver an impeccable presentation. These templates will make your job of preparing presentations much quicker, yet still, maintain a high level of quality. Slidegeeks has experienced researchers who prepare these templates and write high quality content for you. Later on, you can personalize the content by editing the Intelligent Manufacturing Industrial Robot Shipment Prediction For 3Rd And 2Nd Edition Microsoft PDF.
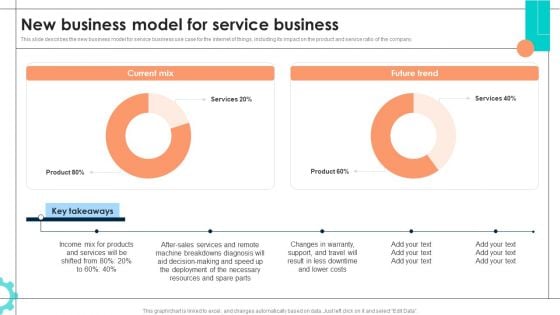
Intelligent Manufacturing New Business Model For Service Business Professional PDF
This slide describes the new business model for service business use case for the internet of things, including its impact on the product and service ratio of the company. Slidegeeks is here to make your presentations a breeze with Intelligent Manufacturing New Business Model For Service Business Professional PDF With our easy to use and customizable templates, you can focus on delivering your ideas rather than worrying about formatting. With a variety of designs to choose from, you are sure to find one that suits your needs. And with animations and unique photos, illustrations, and fonts, you can make your presentation pop. So whether you are giving a sales pitch or presenting to the board, make sure to check out Slidegeeks first.
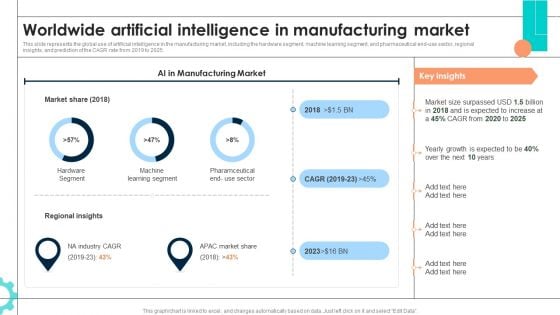
Worldwide Artificial Intelligence In Manufacturing Market Designs PDF
This slide represents the global use of artificial intelligence in the manufacturing market, including the hardware segment, machine learning segment, and pharmaceutical end-use sector, regional insights, and prediction of the CAGR rate from 2019 to 2025. Get a simple yet stunning designed Worldwide Artificial Intelligence In Manufacturing Market Designs PDF. It is the best one to establish the tone in your meetings. It is an excellent way to make your presentations highly effective. So, download this PPT today from Slidegeeks and see the positive impacts. Our easy to edit Worldwide Artificial Intelligence In Manufacturing Market Designs PDF can be your go to option for all upcoming conferences and meetings. So, what are you waiting for Grab this template today.
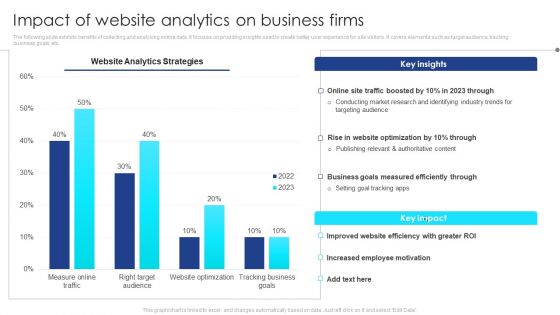
Impact Of Website Analytics On Business Firms Ideas PDF
The following slide exhibits benefits of collecting and analysing online data. It focuses on providing insights used to create better user experience for site visitors. It covers elements such as target audience, tracking business goals, etc. Showcasing this set of slides titled Impact Of Website Analytics On Business Firms Ideas PDF. The topics addressed in these templates are Business Goals, Employee Motivation, Website Efficiency, Website Optimization, Online Site Traffic. All the content presented in this PPT design is completely editable. Download it and make adjustments in color, background, font etc. as per your unique business setting.
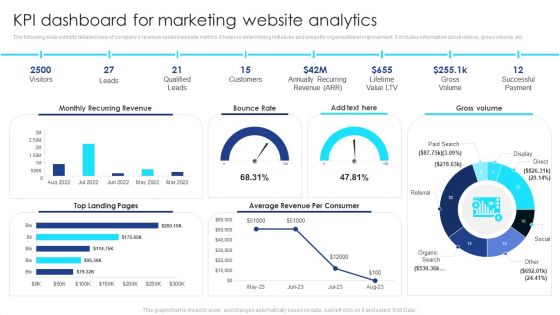
KPI Dashboard For Marketing Website Analytics Summary PDF
The following slide exhibits detailed view of companys revenue-related website metrics. It helps in determining initiatives and areas for organisational improvement. It includes information about visitors, gross volume, etc. Pitch your topic with ease and precision using this KPI Dashboard For Marketing Website Analytics Summary PDF. This layout presents information on Visitors, Leads, Qualified Leads, Customers, Gross Volume, Successful Payment. It is also available for immediate download and adjustment. So, changes can be made in the color, design, graphics or any other component to create a unique layout.
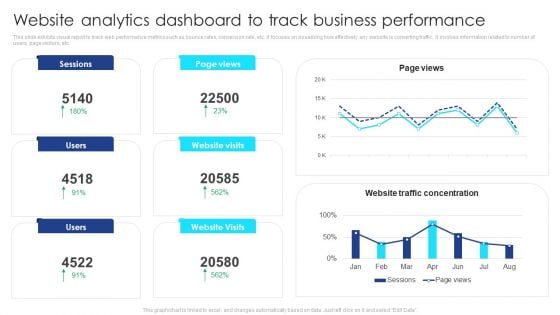
Website Analytics Dashboard To Track Business Performance Guidelines PDF
This slide exhibits visual report to track web performance metrics such as bounce rates, conversion rate, etc. It focuses on visualizing how effectively any website is converting traffic. It involves information related to number of users, page visitors, etc. Pitch your topic with ease and precision using this Website Analytics Dashboard To Track Business Performance Guidelines PDF. This layout presents information on Website Analytics, Dashboard To Track, Business Performance. It is also available for immediate download and adjustment. So, changes can be made in the color, design, graphics or any other component to create a unique layout.

Identifying And Increasing Brand Awareness Dashboard Depicting Website Data Insights Rules PDF
This slide shows the dashboard that depicts website data insights which covers channels such as display, social and email with total sessions, pages, average session duration, bounce rate, goal completion. There are so many reasons you need a Identifying And Increasing Brand Awareness Dashboard Depicting Website Data Insights Rules PDF. The first reason is you can not spend time making everything from scratch, Thus, Slidegeeks has made presentation templates for you too. You can easily download these templates from our website easily.
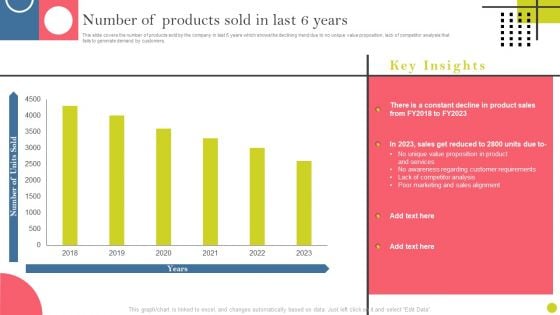
Identifying And Increasing Brand Awareness Number Of Products Sold In Last 6 Years Rules PDF
This slide covers the number of products sold by the company in last 6 years which shows the declining trend due to no unique value proposition, lack of competitor analysis that fails to generate demand by customers. Find highly impressive Identifying And Increasing Brand Awareness Number Of Products Sold In Last 6 Years Rules PDF on Slidegeeks to deliver a meaningful presentation. You can save an ample amount of time using these presentation templates. No need to worry to prepare everything from scratch because Slidegeeks experts have already done a huge research and work for you. You need to download Identifying And Increasing Brand Awareness Number Of Products Sold In Last 6 Years Rules PDF for your upcoming presentation. All the presentation templates are 100 percent editable and you can change the color and personalize the content accordingly. Download now.
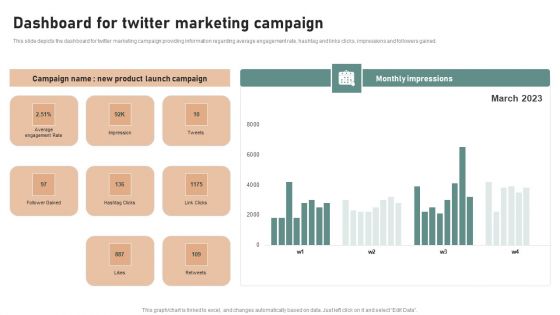
Utilizing Twitter For Social Media Dashboard For Twitter Marketing Campaign Mockup PDF
This slide depicts the dashboard for twitter marketing campaign providing information regarding average engagement rate, hashtag and links clicks, impressions and followers gained. Formulating a presentation can take up a lot of effort and time, so the content and message should always be the primary focus. The visuals of the PowerPoint can enhance the presenters message, so our Utilizing Twitter For Social Media Dashboard For Twitter Marketing Campaign Mockup PDF was created to help save time. Instead of worrying about the design, the presenter can concentrate on the message while our designers work on creating the ideal templates for whatever situation is needed. Slidegeeks has experts for everything from amazing designs to valuable content, we have put everything into Utilizing Twitter For Social Media Dashboard For Twitter Marketing Campaign Mockup PDF.
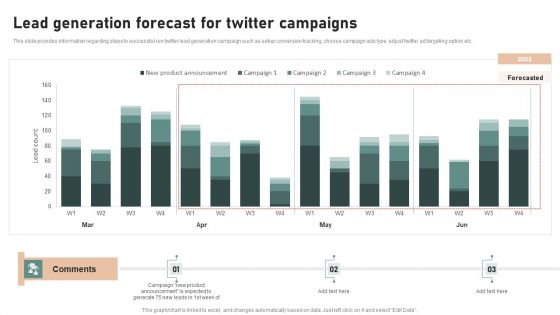
Utilizing Twitter For Social Media Lead Generation Forecast For Twitter Campaigns Information PDF
This slide provides information regarding steps to successful run twitter lead generation campaign such as setup conversion tracking, choose campaign ads type, adjust twitter ad targeting option etc. Boost your pitch with our creative Utilizing Twitter For Social Media Lead Generation Forecast For Twitter Campaigns Information PDF. Deliver an awe-inspiring pitch that will mesmerize everyone. Using these presentation templates you will surely catch everyones attention. You can browse the ppts collection on our website. We have researchers who are experts at creating the right content for the templates. So you do not have to invest time in any additional work. Just grab the template now and use them.
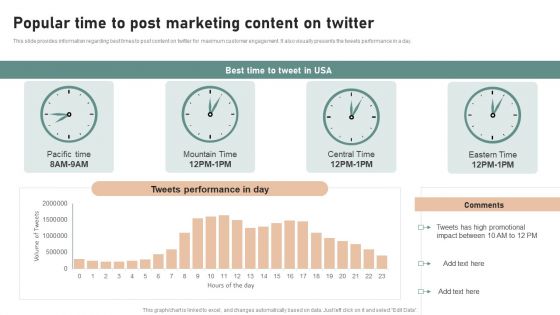
Utilizing Twitter For Social Media Popular Time To Post Marketing Content On Twitter Background PDF
This slide provides information regarding best times to post content on twitter for maximum customer engagement. It also visually presents the tweets performance in a day. Do you have to make sure that everyone on your team knows about any specific topic I yes, then you should give Utilizing Twitter For Social Media Popular Time To Post Marketing Content On Twitter Background PDF a try. Our experts have put a lot of knowledge and effort into creating this impeccable Utilizing Twitter For Social Media Popular Time To Post Marketing Content On Twitter Background PDF. You can use this template for your upcoming presentations, as the slides are perfect to represent even the tiniest detail. You can download these templates from the Slidegeeks website and these are easy to edit. So grab these today.
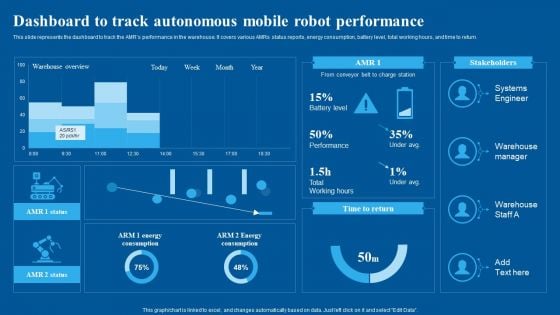
Dashboard To Track Autonomous Mobile Robot Performance Infographics PDF
This slide represents the dashboard to track the AMRs performance in the warehouse. It covers various AMRs status reports, energy consumption, battery level, total working hours, and time to return. Take your projects to the next level with our ultimate collection of Dashboard To Track Autonomous Mobile Robot Performance Infographics PDF. Slidegeeks has designed a range of layouts that are perfect for representing task or activity duration, keeping track of all your deadlines at a glance. Tailor these designs to your exact needs and give them a truly corporate look with your own brand colors they will make your projects stand out from the rest.
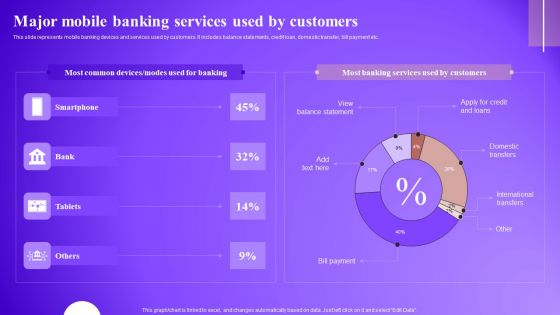
Major Mobile Banking Services Used By Customers Background PDF
This slide represents mobile banking devices and services used by customers. It includes balance statements, credit loan, domestic transfer, bill payment etc. Present like a pro with Major Mobile Banking Services Used By Customers Background PDF Create beautiful presentations together with your team, using our easy to use presentation slides. Share your ideas in real time and make changes on the fly by downloading our templates. So whether you are in the office, on the go, or in a remote location, you can stay in sync with your team and present your ideas with confidence. With Slidegeeks presentation got a whole lot easier. Grab these presentations today.
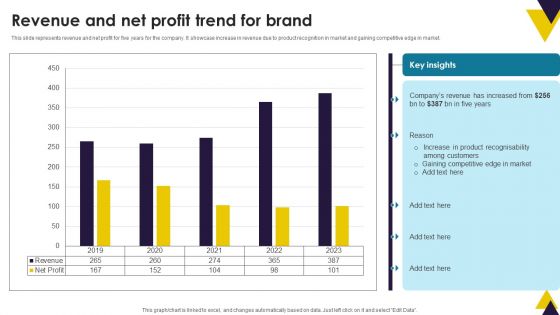
Developing Brand Identity Culture Through Branding Revenue And Net Profit Trend For Brand Brochure PDF
This slide represents revenue and net profit for five years for the company. It showcase increase in revenue due to product recognition in market and gaining competitive edge in market. If your project calls for a presentation, then Slidegeeks is your go to partner because we have professionally designed, easy to edit templates that are perfect for any presentation. After downloading, you can easily edit Developing Brand Identity Culture Through Branding Revenue And Net Profit Trend For Brand Brochure PDF and make the changes accordingly. You can rearrange slides or fill them with different images. Check out all the handy templates
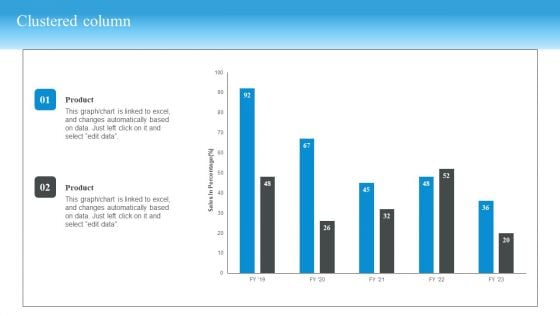
Market Evaluation Of IT Industry Clustered Column Sample PDF
There are so many reasons you need a Market Evaluation Of IT Industry Clustered Column Sample PDF. The first reason is you cannot spend time making everything from scratch, Thus, Slidegeeks has made presentation templates for you too. You can easily download these templates from our website easily.

 Home
Home