Plans And Pricing

Strategic Guide To Launch New Product In Market Existing Concerns Due To Ineffective Product Introduction Portrait PDF
This slide provides information regarding present concerns faced by firm due to ineffective product introduction in terms of rise in product development cost, product failures and product delays. Deliver an awe inspiring pitch with this creative strategic guide to launch new product in market existing concerns due to ineffective product introduction portrait pdf bundle. Topics like existing concerns due to ineffective product introduction can be discussed with this completely editable template. It is available for immediate download depending on the needs and requirements of the user.
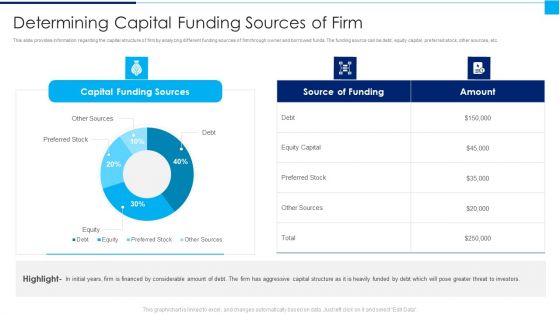
Ways To Enhance Organizations Profitability Determining Capital Funding Sources Of Firm Themes PDF
This slide provides information regarding the capital structure of firm by analyzing different funding sources of firm through owner and borrowed funds. The funding source can be debt, equity capital, preferred stock, other sources, etc. Deliver and pitch your topic in the best possible manner with this ways to enhance organizations profitability determining capital funding sources of firm themes pdf Use them to share invaluable insights on determining cost associated to organizational department and impress your audience. This template can be altered and modified as per your expectations. So, grab it now.
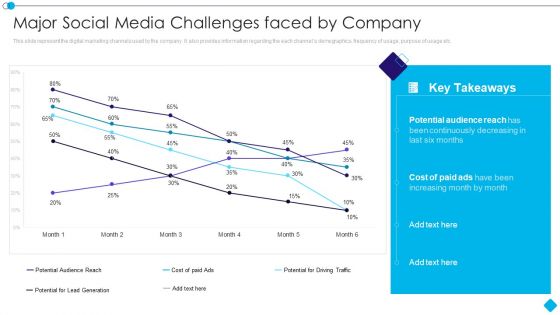
Linkedin Promotion Services Major Social Media Challenges Faced By Company Information PDF
This slide represent the digital marketing channels used by the company. It also provides information regarding the each channels demographics, frequency of usage, purpose of usage etc. Deliver an awe inspiring pitch with this creative linkedin promotion services major social media challenges faced by company information pdf bundle. Topics like potential audience reach, potential for lead generation, cost of paid ads, potential for driving traffic can be discussed with this completely editable template. It is available for immediate download depending on the needs and requirements of the user.
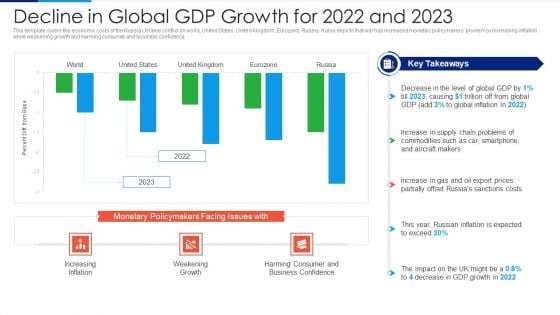
Russia Ukraine Conflict Effect Decline In Global GDP Growth For 2022 And 2023 Ideas PDF
This template covers the economic costs of the Russia Ukraine conflict on world, United States, United Kingdom, Eurozone, Russia. It also depicts that war has increased monetary policymakers problem by increasing inflation while weakening growth and harming consumer and business confidence. Deliver and pitch your topic in the best possible manner with this Russia Ukraine Conflict Effect Decline In Global GDP Growth For 2022 And 2023 Ideas PDF. Use them to share invaluable insights on Monetary Policymakers, Facing Issues, Increasing Inflation, Weakening, Growth, Harming Consumer And Business Confidence and impress your audience. This template can be altered and modified as per your expectations. So, grab it now.
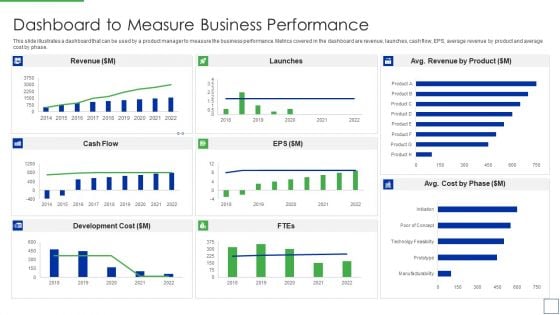
Product Portfolio Management For New Target Region Dashboard To Measure Business Rules PDF
This slide illustrates a dashboard that can be used by a product manager to measure the business performance. Metrics covered in the dashboard are revenue, launches, cash flow, EPS, average revenue by product and average cost by phase.Deliver and pitch your topic in the best possible manner with this Product Portfolio Management For New Target Region Dashboard To Measure Business Rules PDF Use them to share invaluable insights on Dashboard to Measure Business Performance and impress your audience. This template can be altered and modified as per your expectations. So, grab it now.
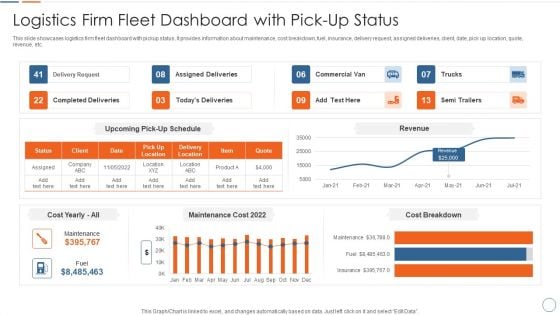
Logistics Firm Fleet Dashboard With Pick Up Status Introduction PDF
This slide showcases logistics firm fleet dashboard with pickup status. It provides information about maintenance, cost breakdown, fuel, insurance, delivery request, assigned deliveries, client, date, pick up location, quote, revenue, etc. Pitch your topic with ease and precision using this Logistics Firm Fleet Dashboard With Pick Up Status Introduction PDF. This layout presents information on Logistics Firm Fleet Dashboard With Pick Up Status. It is also available for immediate download and adjustment. So, changes can be made in the color, design, graphics or any other component to create a unique layout.
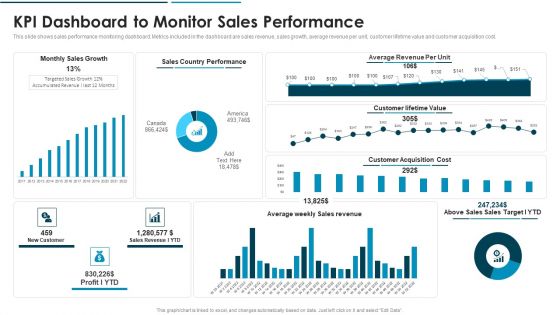
Go To Market Approach For New Product KPI Dashboard To Monitor Sales Performance Clipart PDF
This slide shows sales performance monitoring dashboard. Metrics included in the dashboard are sales revenue, sales growth, average revenue per unit, customer lifetime value and customer acquisition cost.Deliver and pitch your topic in the best possible manner with this Go To Market Approach For New Product KPI Dashboard To Monitor Sales Performance Clipart PDF Use them to share invaluable insights on Kpi Dashboard To Monitor Sales Performance and impress your audience. This template can be altered and modified as per your expectations. So, grab it now.
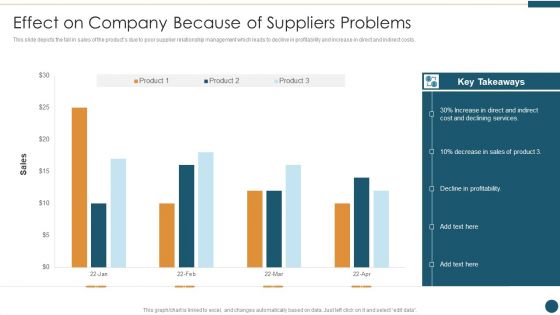
Supplier Relationship Management Effect On Company Because Of Suppliers Problems Sample PDF
This slide depicts the fall in sales of the products due to poor supplier relationship management which leads to decline in profitability and increase in direct and indirect costs. Deliver and pitch your topic in the best possible manner with this Supplier Relationship Management Effect On Company Because Of Suppliers Problems Sample PDF Use them to share invaluable insights on Effect On Company Because Of Suppliers Problems and impress your audience. This template can be altered and modified as per your expectations. So, grab it now.
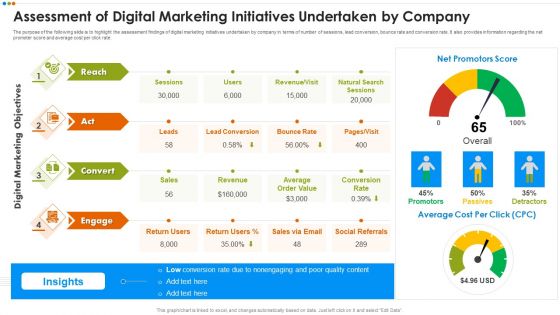
Quarterly Budget Analysis Of Business Organization Assessment Of Digital Marketing Initiatives Rules PDF
The purpose of the following slide is to highlight the assessment findings of digital marketing initiatives undertaken by company in terms of number of sessions, lead conversion, bounce rate and conversion rate. It also provides information regarding the net promoter score and average cost per click rate. Deliver an awe inspiring pitch with this creative Quarterly Budget Analysis Of Business Organization Assessment Of Digital Marketing Initiatives Rules PDF bundle. Topics like Assessment Of Digital Marketing Initiatives Undertaken By Company can be discussed with this completely editable template. It is available for immediate download depending on the needs and requirements of the user.
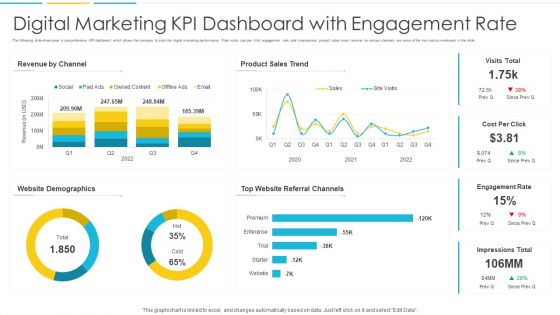
Digital Marketing KPI Dashboard With Engagement Rate Background PDF
The following slide showcases a comprehensive KPI dashboard which allows the company to track the digital marketing performance. Total visits, cost per click, engagement rate, total impressions, product sales trend, revenue by various channels are some of the key metrics mentioned in the slide. Showcasing this set of slides titled Digital Marketing KPI Dashboard With Engagement Rate Background PDF. The topics addressed in these templates are Demographics, Revenue, Sales. All the content presented in this PPT design is completely editable. Download it and make adjustments in color, background, font etc. as per your unique business setting.
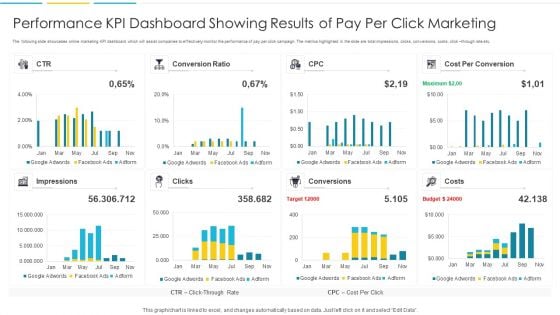
Performance KPI Dashboard Showing Results Of Pay Per Click Marketing Portrait PDF
The following slide showcases online marketing KPI dashboard which will assist companies to effectively monitor the performance of pay per click campaign. The metrics highlighted in the slide are total impressions, clicks, conversions, costs, click through rate etc. Pitch your topic with ease and precision using this Performance KPI Dashboard Showing Results Of Pay Per Click Marketing Portrait PDF. This layout presents information on Impressions, Target, Budget. It is also available for immediate download and adjustment. So, changes can be made in the color, design, graphics or any other component to create a unique layout.
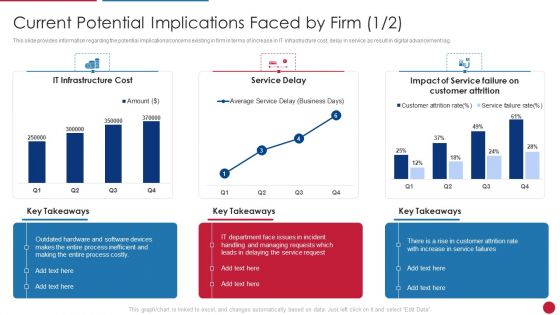
Facilitating IT Intelligence Architecture Current Potential Implications Structure PDF
This slide provides information regarding the potential implications concerns existing in firm in terms of increase in IT infrastructure cost, delay in service as result in digital advancement lag. Deliver and pitch your topic in the best possible manner with this Facilitating IT Intelligence Architecture Current Potential Implications Structure PDF Use them to share invaluable insights on Service Delay, Customer Attrition, Impact Of Service Failure and impress your audience. This template can be altered and modified as per your expectations. So, grab it now.
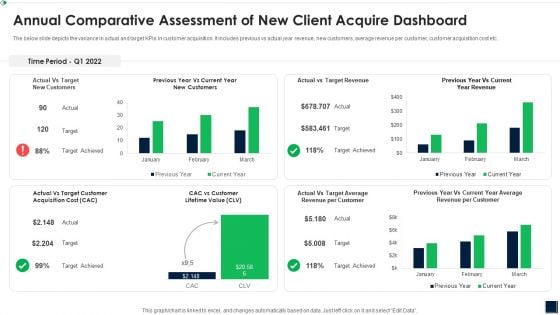
Annual Comparative Assessment Of New Client Acquire Dashboard Topics PDF
The below slide depicts the variance in actual and target KPIs in customer acquisition. It includes previous vs actual year revenue, new customers, average revenue per customer, customer acquisition cost etc. Showcasing this set of slides titled Annual Comparative Assessment Of New Client Acquire Dashboard Topics PDF The topics addressed in these templates are Annual Comparative Assessment OF New Client Acquire Dashboard All the content presented in this PPT design is completely editable. Download it and make adjustments in color, background, font etc. as per your unique business setting.
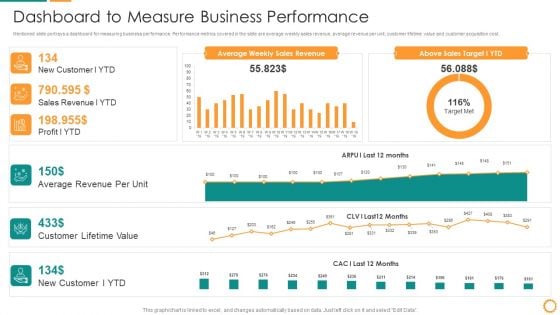
IT Consolidation Post Mergers And Acquisition Dashboard To Measure Business Performance Clipart PDF
Mentioned slide portrays a dashboard for measuring business performance. Performance metrics covered in the slide are average weekly sales revenue, average revenue per unit, customer lifetime value and customer acquisition cost. Deliver and pitch your topic in the best possible manner with this IT Consolidation Post Mergers And Acquisition Dashboard To Measure Business Performance Clipart PDF. Use them to share invaluable insights on Average Revenue, Customer Lifetime Value, Sales Revenue, Sales Target and impress your audience. This template can be altered and modified as per your expectations. So, grab it now.
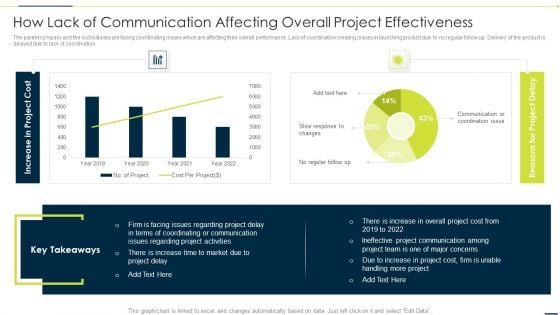
Enhancing Companys Project How Lack Of Communication Affecting Overall Project Topics PDF
The parent company and the subsidiaries are facing coordinating issues which are affecting their overall performance. Lack of coordination creating issues in launching product due to no regular follow up. Delivery of the product is delayed due to lack of coordination. Deliver and pitch your topic in the best possible manner with this Enhancing Companys Project How Lack Of Communication Affecting Overall Project Topics PDF. Use them to share invaluable insights on Communication Coordination Issue, Slow Response Changes, Increase Project Cost and impress your audience. This template can be altered and modified as per your expectations. So, grab it now.
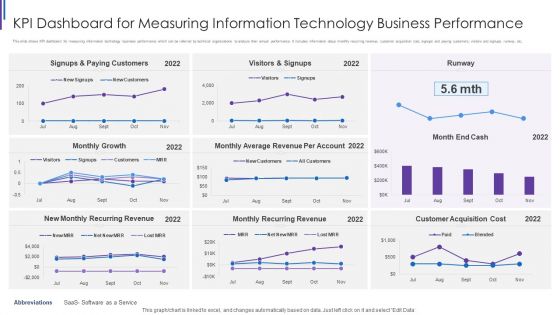
KPI Dashboard For Measuring Information Technology Business Performance Designs PDF
This slide shows KPI dashboard for measuring information technology business performance which can be referred by technical organizations to analyze their annual performance. It includes information about monthly recurring revenue, customer acquisition cost, signups and paying customers, visitors and signups, runway, etc. Showcasing this set of slides titled KPI Dashboard For Measuring Information Technology Business Performance Designs PDF. The topics addressed in these templates are Signups And Paying, Customers Monthly Growth, Visitors And Signups, Monthly Average Revenue. All the content presented in this PPT design is completely editable. Download it and make adjustments in color, background, font etc. as per your unique business setting.
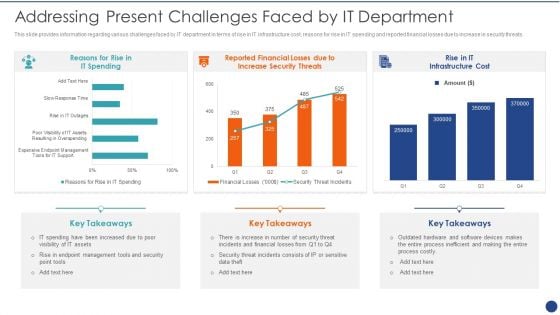
Cios Value Optimization Addressing Present Challenges Faced By IT Department Summary PDF
This slide provides information regarding various challenges faced by IT department in terms of rise in IT infrastructure cost, reasons for rise in IT spending and reported financial losses due to increase in security threats. Deliver an awe inspiring pitch with this creative Cios Value Optimization Addressing Present Challenges Faced By IT Department Summary PDF bundle. Topics like Reported Financial, Increase Security, IT Spending can be discussed with this completely editable template. It is available for immediate download depending on the needs and requirements of the user.
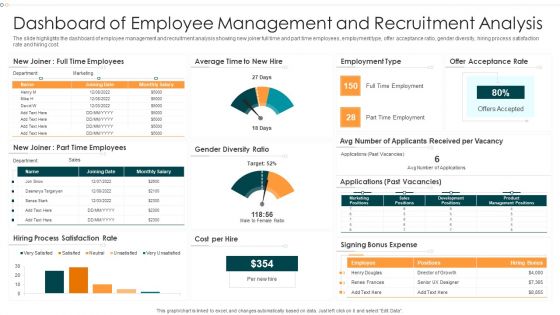
Dashboard Of Employee Management And Recruitment Analysis Infographics PDF
The slide highlights the dashboard of employee management and recruitment analysis showing new joiner full time and part time employees, employment type, offer acceptance ratio, gender diversity, hiring process satisfaction rate and hiring cost.Pitch your topic with ease and precision using this Dashboard Of Employee Management And Recruitment Analysis Infographics PDF This layout presents information on Dashboard Employee, Management, Recruitment Analysis It is also available for immediate download and adjustment. So, changes can be made in the color, design, graphics or any other component to create a unique layout.
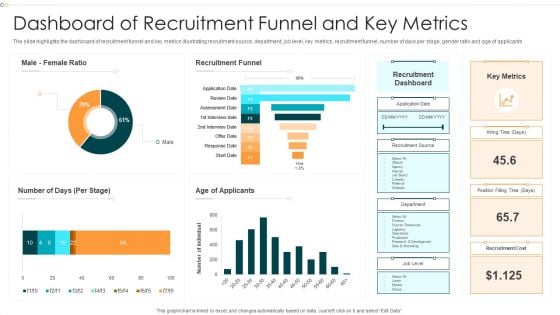
Dashboard Of Recruitment Funnel And Key Metrics Information PDF
The slide highlights the dashboard of recruitment funnel and key metrics illustrating recruitment source, department, job level, key metrics, recruitment funnel, number of days per stage, gender ratio and age of applicants.Pitch your topic with ease and precision using this Dashboard Of Recruitment Funnel And Key Metrics Information PDF This layout presents information on Recruitment Funnel, Recruitment Dashboard, Recruitment Cost It is also available for immediate download and adjustment. So, changes can be made in the color, design, graphics or any other component to create a unique layout.
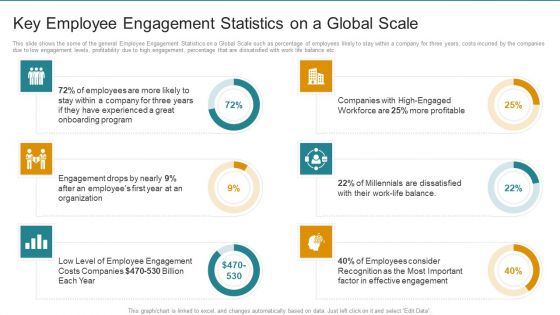
Key Employee Engagement Statistics On A Global Scale Ideas PDF
This slide shows the some of the general Employee Engagement Statistics on a Global Scale such as percentage of employees likely to stay within a company for three years, costs incurred by the companies due to low engagement levels, profitability due to high engagement, percentage that are dissatisfied with work life balance etc. Deliver an awe inspiring pitch with this creative Key Employee Engagement Statistics On A Global Scale Ideas PDF bundle. Topics like Work Life Balance, Effective Engagement, Employee Engagement can be discussed with this completely editable template. It is available for immediate download depending on the needs and requirements of the user.
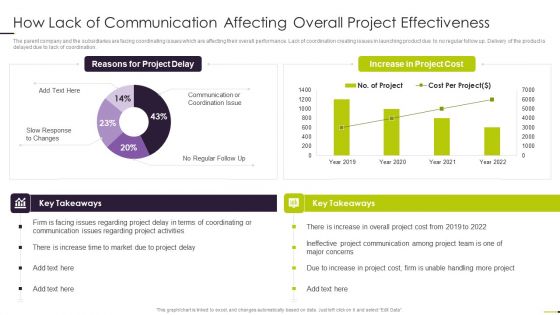
Managing Project Communication How Lack Of Communication Affecting Overall Project Effectiveness Infographics PDF
The parent company and the subsidiaries are facing coordinating issues which are affecting their overall performance. Lack of coordination creating issues in launching product due to no regular follow up. Delivery of the product is delayed due to lack of coordination. Deliver and pitch your topic in the best possible manner with this Managing Project Communication How Lack Of Communication Affecting Overall Project Effectiveness Infographics PDF. Use them to share invaluable insights on Project Team, Project Communication, Project Cost and impress your audience. This template can be altered and modified as per your expectations. So, grab it now.
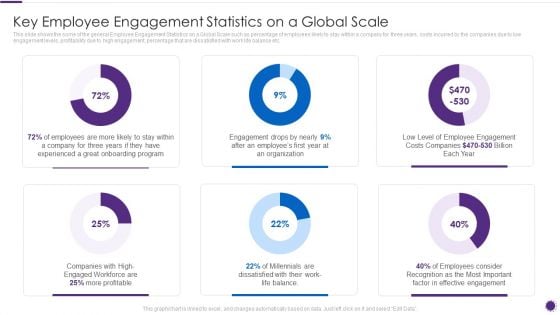
Complete Guide For Total Employee Involvement Strategic Approach Key Employee Engagement Topics PDF
This slide shows the some of the general Employee Engagement Statistics on a Global Scale such as percentage of employees likely to stay within a company for three years, costs incurred by the companies due to low engagement levels, profitability due to high engagement, percentage that are dissatisfied with work life balance etc. Deliver an awe inspiring pitch with this creative Complete Guide For Total Employee Involvement Strategic Approach Key Employee Engagement Topics PDF bundle. Topics like Engagement Drops, Employee Engagement, Employees Consider can be discussed with this completely editable template. It is available for immediate download depending on the needs and requirements of the user.
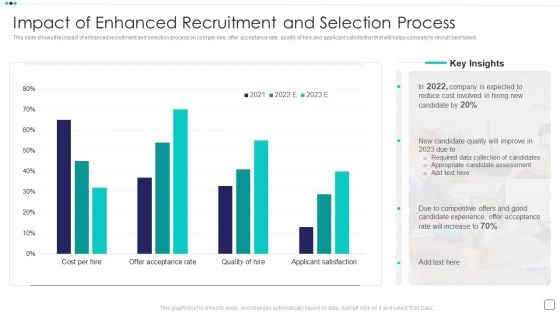
Steps Of Employee Hiring Process For HR Management Impact Of Enhanced Recruitment And Selection Process Introduction PDF
This slide shows the impact of enhanced recruitment and selection process on cost per hire, offer acceptance rate, quality of hire and applicant satisfaction that will helps company to recruit best talent.Deliver an awe inspiring pitch with this creative Steps Of Employee Hiring Process For HR Management Impact Of Enhanced Recruitment And Selection Process Introduction PDF bundle. Topics like Candidate Quality, Candidate Assessment, Candidate Experience can be discussed with this completely editable template. It is available for immediate download depending on the needs and requirements of the user.
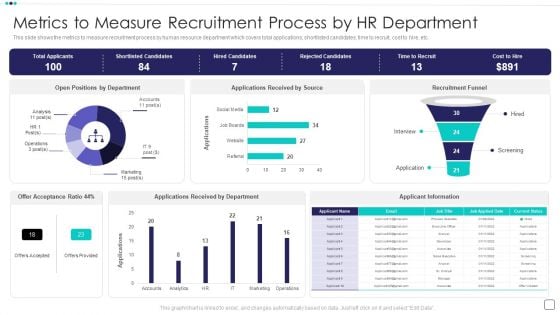
Steps Of Employee Hiring Process For HR Management Metrics To Measure Recruitment Process By HR Department Rules PDF
This slide shows the metrics to measure recruitment process by human resource department which covers total applications, shortlisted candidates, time to recruit, cost to hire, etc.Deliver and pitch your topic in the best possible manner with this Steps Of Employee Hiring Process For HR Management Metrics To Measure Recruitment Process By HR Department Rules PDF Use them to share invaluable insights on Rejected Candidates, Positions Department, Received Department and impress your audience. This template can be altered and modified as per your expectations. So, grab it now.
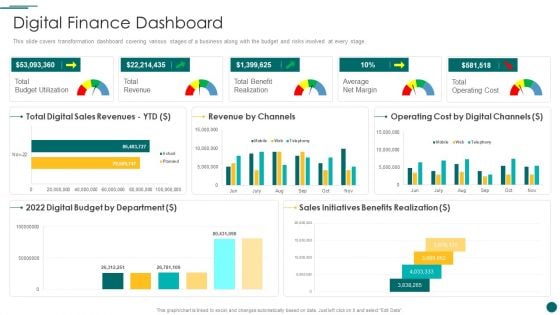
Organization Reinvention Digital Finance Dashboard Clipart PDF
This slide covers the advanced technologies entering the market from past few decades. The combinatorial effects of base technologies, such as mobile, cloud, sensors, analytics and the Internet of Things IoT, are accelerating progress exponentially. This slide covers transformation dashboard covering various stages of a business along with the budget and risks involved at every stage. Deliver and pitch your topic in the best possible manner with this Organization Reinvention Digital Finance Dashboard Clipart PDF. Use them to share invaluable insights on Revenue By Channels, Operating Cost, Digital Budget and impress your audience. This template can be altered and modified as per your expectations. So, grab it now.
Marketing And Operations Dashboard For Performance Management Icons PDF
This slide covers sales and operation dashboard for performance management. It involves details such as number of new buyers, sales revenue, average revenue per unit etc. Pitch your topic with ease and precision using this Marketing And Operations Dashboard For Performance Management Icons PDF. This layout presents information on Average Revenue Per Unit, Customer Acquisition Cost, Customer Lifetime Value. It is also available for immediate download and adjustment. So, changes can be made in the color, design, graphics or any other component to create a unique layout.
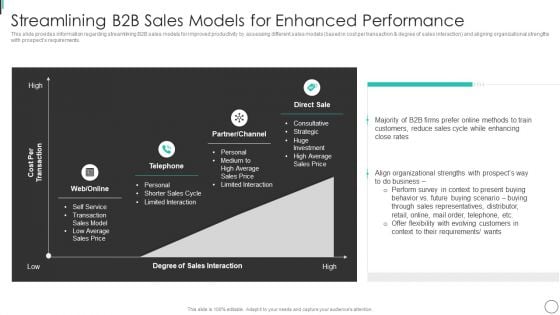
Streamlining B2B Sales Models For Enhanced Performance Portrait PDF
This slide provides information regarding streamlining B2B sales models for improved productivity by assessing different sales models based in cost per transaction degree of sales interaction and aligning organizational strengths with prospects requirements. Deliver and pitch your topic in the best possible manner with this Streamlining B2B Sales Models For Enhanced Performance Portrait PDF. Use them to share invaluable insights on Limited Interaction, Sales Interaction, Align Organizational and impress your audience. This template can be altered and modified as per your expectations. So, grab it now.
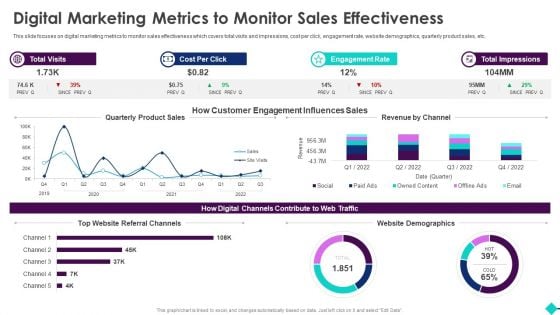
Sales Process Automation For Revenue Growth Digital Marketing Metrics To Monitor Sales Effectiveness Graphics PDF
This slide focuses on digital marketing metrics to monitor sales effectiveness which covers total visits and impressions, cost per click, engagement rate, website demographics, quarterly product sales, etc.Deliver and pitch your topic in the best possible manner with this Sales Process Automation For Revenue Growth Digital Marketing Metrics To Monitor Sales Effectiveness Graphics PDF. Use them to share invaluable insights on Automation Potential, Role Of Automation, Included Activities and impress your audience. This template can be altered and modified as per your expectations. So, grab it now.
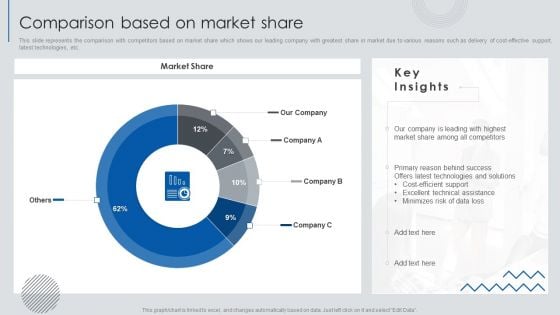
Information Technology Solutions Business Profile Comparison Based On Market Share Rules PDF
This slide represents the comparison with competitors based on market share which shows our leading company with greatest share in market due to various reasons such as delivery of cost-effective support, latest technologies, etc. Deliver and pitch your topic in the best possible manner with this Information Technology Solutions Business Profile Comparison Based On Market Share Rules PDF. Use them to share invaluable insights on Leading Highest, Among Competitors, Behind Success and impress your audience. This template can be altered and modified as per your expectations. So, grab it now.
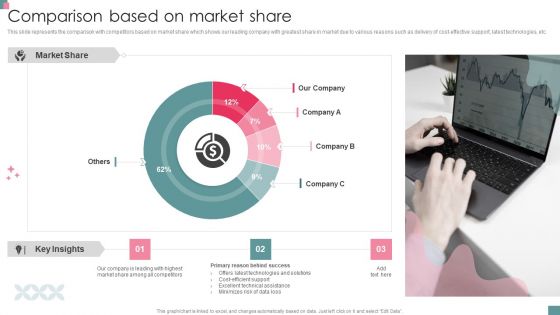
Small Business Venture Company Profile Comparison Based On Market Share Summary PDF
This slide represents the comparison with competitors based on market share which shows our leading company with greatest share in market due to various reasons such as delivery of cost-effective support, latest technologies, etc. Deliver and pitch your topic in the best possible manner with this Small Business Venture Company Profile Comparison Based On Market Share Summary PDF. Use them to share invaluable insights on Among Competitors, Technologies And Solutions, Technical Assistance and impress your audience. This template can be altered and modified as per your expectations. So, grab it now.

Logistics KPI Status Dashboard With Monthly KPI Ppt Infographic Template Layout PDF
The following slide highlights the transportation status dashboard with monthly KPI illustrating order status with customer, order date and delivery date. It shows financial performance for four quarters as well as todays order, inventory and monthly KPI with Inventory, shipping cost for past 30 days. Pitch your topic with ease and precision using this Logistics KPI Status Dashboard With Monthly KPI Ppt Infographic Template Layout PDF. This layout presents information on Order Status, Today Order, Inventory, Monthly KPI. It is also available for immediate download and adjustment. So, changes can be made in the color, design, graphics or any other component to create a unique layout.
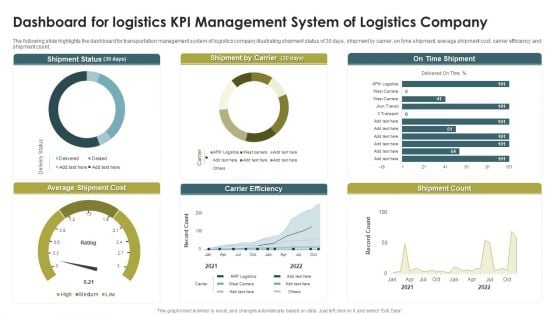
Dashboard For Logistics KPI Management System Of Logistics Company Infographics PDF
The following slide highlights the dashboard for transportation management system of logistics company illustrating shipment status of 30 days, shipment by carrier, on time shipment, average shipment cost, carrier efficiency and shipment count. Pitch your topic with ease and precision using this Dashboard For Logistics KPI Management System Of Logistics Company Infographics PDF. This layout presents information on Shipment Status, Shipment By Carrier, On Time Shipment. It is also available for immediate download and adjustment. So, changes can be made in the color, design, graphics or any other component to create a unique layout.
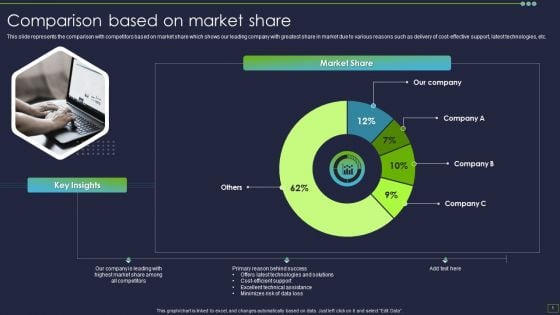
IT Consultancy Services Company Profile Comparison Based On Market Share Ideas PDF
This slide represents the comparison with competitors based on market share which shows our leading company with greatest share in market due to various reasons such as delivery of cost-effective support, latest technologies, etc. Deliver and pitch your topic in the best possible manner with this IT Consultancy Services Company Profile Comparison Based On Market Share Ideas PDF. Use them to share invaluable insights on Market Share, Key Insights, Primary Reason and impress your audience. This template can be altered and modified as per your expectations. So, grab it now.
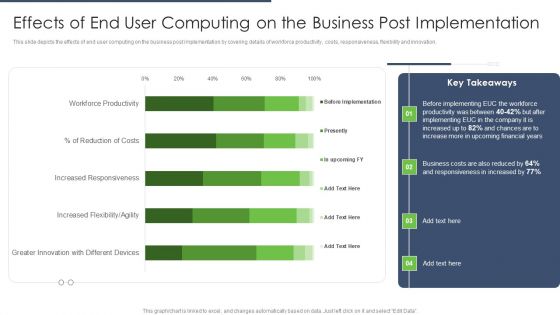
End User Computing Effects Of End User Computing On The Business Post Implementation Introduction PDF
This slide depicts the effects of end user computing on the business post implementation by covering details of workforce productivity, costs, responsiveness, flexibility and innovation.Deliver and pitch your topic in the best possible manner with this End User Computing Effects Of End User Computing On The Business Post Implementation Introduction PDF. Use them to share invaluable insights on Greater Innovation, Different Devices, Increased Flexibility, Increased Responsiveness and impress your audience. This template can be altered and modified as per your expectations. So, grab it now.
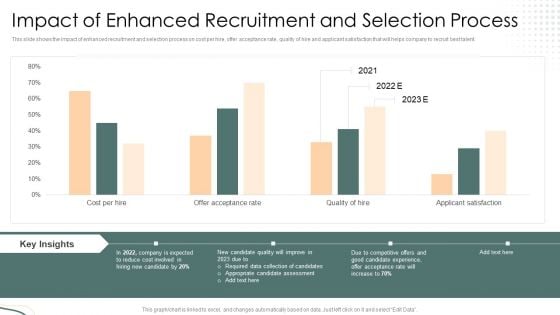
Impact Of Enhanced Recruitment And Selection Process Introduction PDF
This slide shows the impact of enhanced recruitment and selection process on cost per hire, offer acceptance rate, quality of hire and applicant satisfaction that will helps company to recruit best talent.Deliver and pitch your topic in the best possible manner with this Impact Of Enhanced Recruitment And Selection Process Introduction PDF. Use them to share invaluable insights on Company Expected, Candidate Assessment, Collection Of Candidates and impress your audience. This template can be altered and modified as per your expectations. So, grab it now.

Business Performance Review Dashboard To Measure Overall Business Performance Formats PDF
The following slide highlights a comprehensive quarterly business review QBR dashboard which can be used by the organization to evaluate business performance. The metrics used for review are total revenue, new customers, gross profit, overall costs, sales comparison, sales by different products and top performing channels. Showcasing this set of slides titled Business Performance Review Dashboard To Measure Overall Business Performance Formats PDF. The topics addressed in these templates are Sales Comparison, Sales Product, High Performing. All the content presented in this PPT design is completely editable. Download it and make adjustments in color, background, font etc. as per your unique business setting.
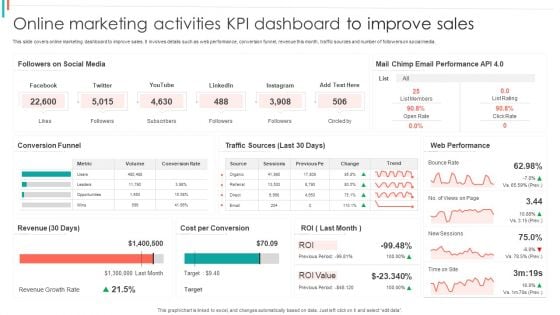
Online Marketing Activities KPI Dashboard To Improve Sales Ideas PDF
This slide covers online marketing dashboard to improve sales. It involves details such as web performance, conversion funnel, revenue this month, traffic sources and number of followers on social media.Pitch your topic with ease and precision using this Online Marketing Activities KPI Dashboard To Improve Sales Ideas PDF. This layout presents information on Email Performance, Web Performance, Cost Conversion. It is also available for immediate download and adjustment. So, changes can be made in the color, design, graphics or any other component to create a unique layout.
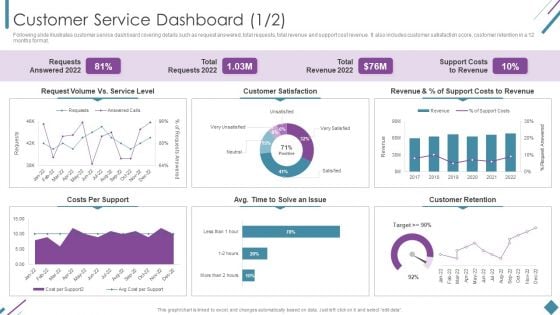
Metrics To Measure Business Performance Customer Service Dashboard Sample PDF
Following slide illustrates customer service dashboard covering details such as request answered, total requests, total revenue and support cost revenue. It also includes customer satisfaction score, customer retention in a 12 months format. Deliver and pitch your topic in the best possible manner with this Metrics To Measure Business Performance Customer Service Dashboard Sample PDF. Use them to share invaluable insights on Requests Answered 2022, Total Requests 2022, Total Revenue 2022 and impress your audience. This template can be altered and modified as per your expectations. So, grab it now.
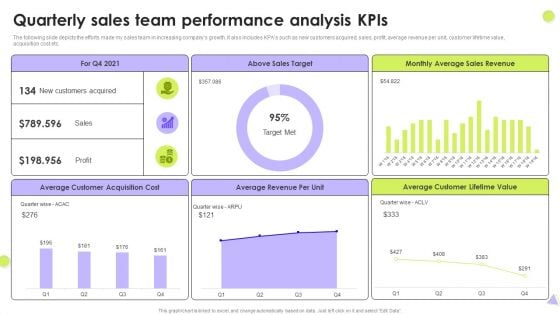
Quarterly Sales Team Performance Analysis Kpis Slides PDF
The following slide depicts the efforts made my sales team in increasing companys growth. It also includes KPAs such as new customers acquired, sales, profit, average revenue per unit, customer lifetime value, acquisition cost etc. Showcasing this set of slides titled Quarterly Sales Team Performance Analysis Kpis Slides PDF. The topics addressed in these templates are Above Sales Target, Average Sales Revenue, Average Customer. All the content presented in this PPT design is completely editable. Download it and make adjustments in color, background, font etc. as per your unique business setting.
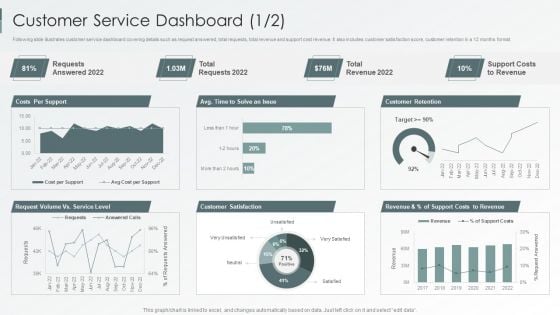
Enterprise Sustainability Performance Metrics Customer Service Dashboard Professional PDF
Following slide illustrates customer service dashboard covering details such as request answered, total requests, total revenue and support cost revenue. It also includes customer satisfaction score, customer retention in a 12 months format.Deliver and pitch your topic in the best possible manner with this Enterprise Sustainability Performance Metrics Customer Service Dashboard Professional PDF. Use them to share invaluable insights on Customer Satisfaction, Customer Retention, Support Revenue and impress your audience. This template can be altered and modified as per your expectations. So, grab it now.
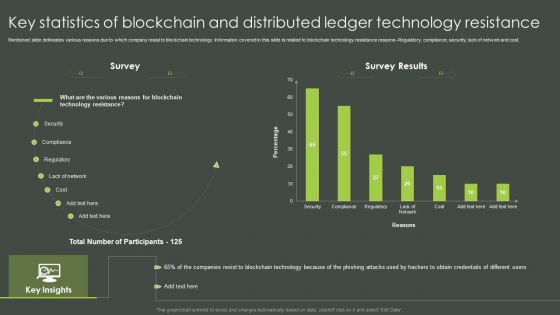
Key Statistics Of Blockchain And Distributed Ledger Technology Resistance Themes PDF
Mentioned slide delineates various reasons due to which company resist to blockchain technology. Information covered in this slide is related to blockchain technology resistance reasons -Regulatory, compliance, security, lack of network and cost. Showcasing this set of slides titled Key Statistics Of Blockchain And Distributed Ledger Technology Resistance Themes PDF. The topics addressed in these templates are Blockchain, Technology Resistance, Total Number Participants. All the content presented in this PPT design is completely editable. Download it and make adjustments in color, background, font etc. as per your unique business setting.
Promotional Investments Barriers For B2B Sales And Marketing Data Quality Icons PDF
This slide depicts top investment challenges in B2B sales and marketing data quality. It includes barriers such as cost, better ROI with others, inadequate understanding of data quality, lack of results evidenced and absence of decision makers.Pitch your topic with ease and precision using this Promotional Investments Barriers For B2B Sales And Marketing Data Quality Icons PDF. This layout presents information on Loyalty Increases, Products Instagram, Business Presence. It is also available for immediate download and adjustment. So, changes can be made in the color, design, graphics or any other component to create a unique layout.
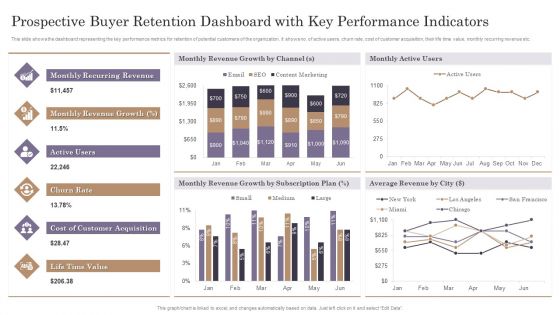
Prospective Buyer Retention Dashboard With Key Performance Indicators Themes PDF
This slide shows the dashboard representing the key performance metrics for retention of potential customers of the organization. It shows no. of active users, churn rate, cost of customer acquisition, their life time value, monthly recurring revenue etc.Pitch your topic with ease and precision using this Prospective Buyer Retention Dashboard With Key Performance Indicators Themes PDF. This layout presents information on Recurring Revenue, Revenue Growth, Customer Acquisition. It is also available for immediate download and adjustment. So, changes can be made in the color, design, graphics or any other component to create a unique layout.
Customer Service Metrics Dashboard With Customer Retention Rate Icons PDF
This slide showcases KPIs dashboard for customer service that can help organization to track the consumer satisfaction score and improve product or service by improving customer loyalty. Its key components are net promoter score, customer retention and support costs. Showcasing this set of slides titled Customer Service Metrics Dashboard With Customer Retention Rate Icons PDF. The topics addressed in these templates are Customer Retention, Net Promoter Score, Service Level. All the content presented in this PPT design is completely editable. Download it and make adjustments in color, background, font etc. as per your unique business setting.
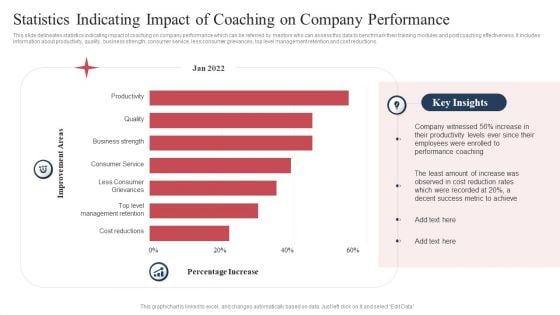
Statistics Indicating Impact Of Coaching On Company Performance Formats PDF
This slide delineates statistics indicating impact of coaching on company performance which can be referred by mentors who can assess this data to benchmark their training modules and post coaching effectiveness. It includes information about productivity, quality, business strength, consumer service, less consumer grievances, top level management retention and cost reductions. Pitch your topic with ease and precision using this Statistics Indicating Impact Of Coaching On Company Performance Formats PDF. This layout presents information on Productivity, Quality, Business Strength. It is also available for immediate download and adjustment. So, changes can be made in the color, design, graphics or any other component to create a unique layout.
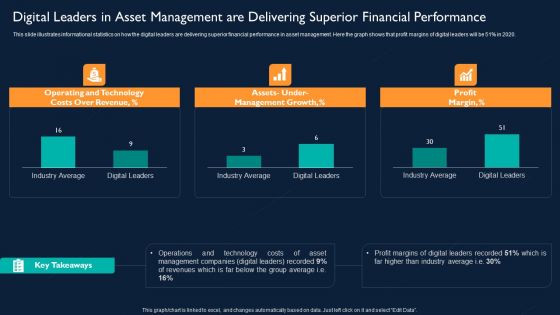
Digital Leaders In Asset Management Are Delivering Superior Financial Performance Designs PDF
This slide illustrates informational statistics on how the digital leaders are delivering superior financial performance in asset management. Here the graph shows that profit margins of digital leaders will be 51 percentage in 2020. Deliver and pitch your topic in the best possible manner with this Digital Leaders In Asset Management Are Delivering Superior Financial Performance Designs PDF. Use them to share invaluable insights on Operating And Technology Costs, Management Growth, Profit Margin and impress your audience. This template can be altered and modified as per your expectations. So, grab it now.
Tracking Channel Campaign Metrics To Measure Web Traffic Sample PDF
This slide covers measuring campaign key performance indicators through tracking channel web traffic which includes total visit, cost per click, engagement rate and total impressions. Pitch your topic with ease and precision using this Tracking Channel Campaign Metrics To Measure Web Traffic Sample PDF. This layout presents information on Revenue By Channel, Website Demographics, Product Sales Trend. It is also available for immediate download and adjustment. So, changes can be made in the color, design, graphics or any other component to create a unique layout.
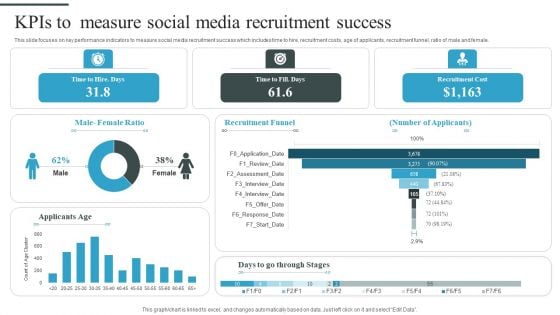
Tactical Process For Social Kpis To Measure Social Media Recruitment Success Demonstration PDF
This slide focuses on key performance indicators to measure social media recruitment success which includes time to hire, recruitment costs, age of applicants, recruitment funnel, ratio of male and female. Deliver an awe inspiring pitch with this creative Tactical Process For Social Kpis To Measure Social Media Recruitment Success Demonstration PDF bundle. Topics like Male Female Ratio, Recruitment Funnel, Number Applicants can be discussed with this completely editable template. It is available for immediate download depending on the needs and requirements of the user.
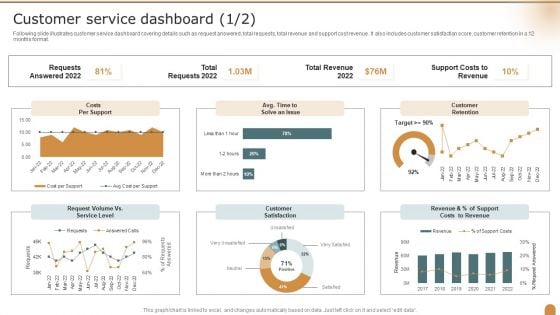
Customer Service Dashboard Company Performance Evaluation Using KPI Themes PDF
Following slide illustrates customer service dashboard covering details such as request answered, total requests, total revenue and support cost revenue. It also includes customer satisfaction score, customer retention in a 12 months format. Deliver and pitch your topic in the best possible manner with this Customer Service Dashboard Company Performance Evaluation Using KPI Themes PDF. Use them to share invaluable insights on Requests Answered, Total Revenue, Customer Retention and impress your audience. This template can be altered and modified as per your expectations. So, grab it now.
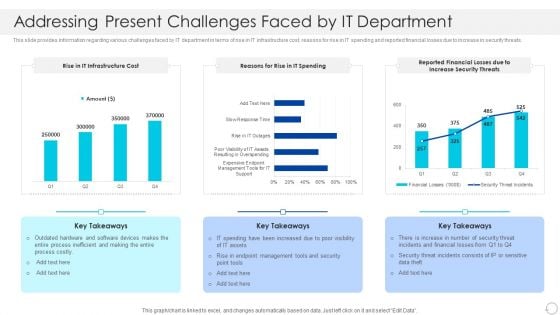
Addressing Present Challenges Faced By IT Department Download PDF
This slide provides information regarding various challenges faced by IT department in terms of rise in IT infrastructure cost, reasons for rise in IT spending and reported financial losses due to increase in security threats. Deliver and pitch your topic in the best possible manner with this Addressing Present Challenges Faced By IT Department Download PDF. Use them to share invaluable insights on Management Tools, Financial, Security and impress your audience. This template can be altered and modified as per your expectations. So, grab it now.

Key Challenges Of Pharmaceutical Quality Control In Industry Ppt PowerPoint Presentation Slides Examples PDF
This slide displays statistical analysis for most common operational barriers faced by pharmaceutical industry in quality management. It includes details such as digitalization, automation, cost inflations, process transparency, etc. Pitch your topic with ease and precision using this Key Challenges Of Pharmaceutical Quality Control In Industry Ppt PowerPoint Presentation Slides Examples PDF. This layout presents information on Opretional Inconsistencies, Latest Technologies, Automation Related. It is also available for immediate download and adjustment. So, changes can be made in the color, design, graphics or any other component to create a unique layout.
Dashboard For Analyzing IT Hiring Status Ppt PowerPoint Presentation Icon Slides PDF
This slide defines the analysis dashboard for information technology IT recruitment status. It includes information related to technical and non- technical hiring, hiring pipeline, etc. Showcasing this set of slides titled Dashboard For Analyzing IT Hiring Status Ppt PowerPoint Presentation Icon Slides PDF. The topics addressed in these templates are Current Hiring Pipeline, Recruitment Costs YTD, Acceptance Rate. All the content presented in this PPT design is completely editable. Download it and make adjustments in color, background, font etc. as per your unique business setting.
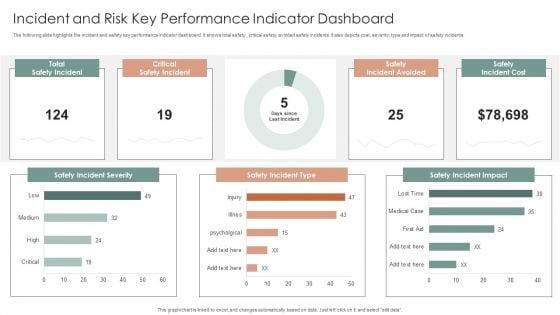
Incident And Risk Key Performance Indicator Dashboard Ppt Gallery Mockup PDF
The following slide highlights the incident and safety key performance indicator dashboard. It shows total safety, critical safety, avoided safety incidents. It also depicts cost, severity, type and impact of safety incidents. Showcasing this set of slides titled Incident And Risk Key Performance Indicator Dashboard Ppt Gallery Mockup PDF. The topics addressed in these templates are Safety Incident Severity, Safety Incident Type, Safety Incident Impact. All the content presented in this PPT design is completely editable. Download it and make adjustments in color, background, font etc. as per your unique business setting.
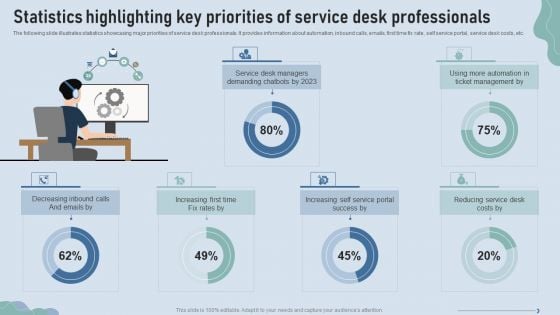
Improve IT Service Desk Statistics Highlighting Key Priorities Of Service Topics PDF
The following slide illustrates statistics showcasing major priorities of service desk professionals. It provides information about automation, inbound calls, emails, first time fix rate, self service portal, service desk costs, etc. Deliver and pitch your topic in the best possible manner with this Improve IT Service Desk Statistics Highlighting Key Priorities Of Service Topics PDF. Use them to share invaluable insights on Service Managers, Ticket Management, Increasing Time and impress your audience. This template can be altered and modified as per your expectations. So, grab it now.
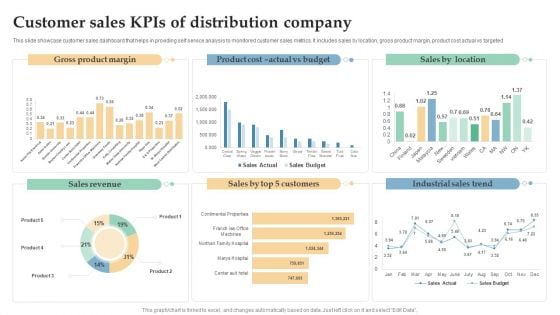
Customer Sales Kpis Of Distribution Company Ppt Infographic Template Templates PDF
This slide showcase customer sales dashboard that helps in providing self service analysis to monitored customer sales metrics. It includes sales by location, gross product margin, product cost actual vs targeted. Showcasing this set of slides titled Customer Sales Kpis Of Distribution Company Ppt Infographic Template Templates PDF. The topics addressed in these templates are Gross Product Margin, Sales Revenue, Industrial Sales Trend. All the content presented in this PPT design is completely editable. Download it and make adjustments in color, background, font etc. as per your unique business setting.
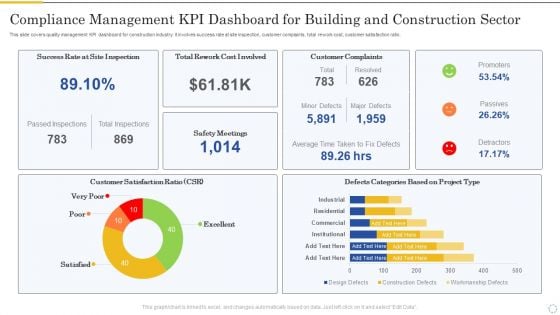
Compliance Management Kpi Dashboard For Building And Construction Sector Inspiration PDF
This slide covers quality management KPI dashboard for construction industry. It involves success rate at site inspection, customer complaints, total rework cost, customer satisfaction ratio. Pitch your topic with ease and precision using this Compliance Management Kpi Dashboard For Building And Construction Sector Inspiration PDF. This layout presents information on Customer Complaints, Customer Satisfaction, Safety Meetings. It is also available for immediate download and adjustment. So, changes can be made in the color, design, graphics or any other component to create a unique layout.

Business Revenue Bar Graph With Business Operational Expenditure Details Summary PDF
This slide represents business revenue bar graph with OPEX details which can be referred by companies to earn more revenue by controlling expenditures. It also provides information about marketing and sales, research and development, administration, total revenue, etc. Pitch your topic with ease and precision using this Business Revenue Bar Graph With Business Operational Expenditure Details Summary PDF. This layout presents information on Cost Of Marketing, Sales, Highest Amount. It is also available for immediate download and adjustment. So, changes can be made in the color, design, graphics or any other component to create a unique layout.
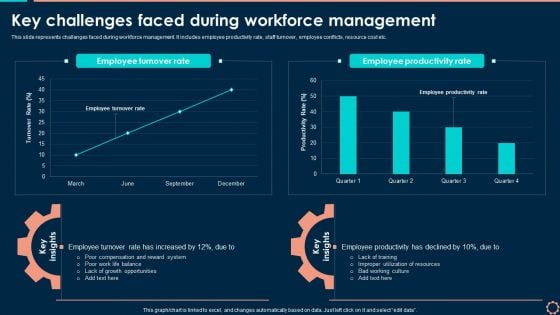
Key Challenges Faced During Workforce Management Inspiration PDF
This slide represents challenges faced during workforce management. It includes employee productivity rate, staff turnover, employee conflicts, resource cost etc. Want to ace your presentation in front of a live audience Our Key Challenges Faced During Workforce Management Inspiration PDF can help you do that by engaging all the users towards you. Slidegeeks experts have put their efforts and expertise into creating these impeccable powerpoint presentations so that you can communicate your ideas clearly. Moreover, all the templates are customizable, and easy to edit and downloadable. Use these for both personal and commercial use.
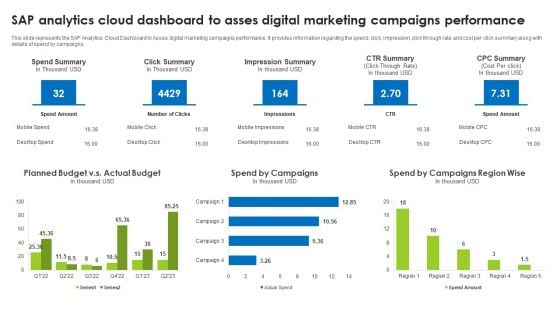
Sap Analytics Cloud Dashboard To Asses Digital Marketing Campaigns Performance Ideas PDF
This slide represents the SAP Analytics Cloud Dashboard to Asses digital marketing campaigns performance. It provides information regarding the spend, click, impression, click through rate and cost per click summary along with details of spend by campaigns. The best PPT templates are a great way to save time, energy, and resources. Slidegeeks have 100 percent editable powerpoint slides making them incredibly versatile. With these quality presentation templates, you can create a captivating and memorable presentation by combining visually appealing slides and effectively communicating your message. Download Sap Analytics Cloud Dashboard To Asses Digital Marketing Campaigns Performance Ideas PDF from Slidegeeks and deliver a wonderful presentation.
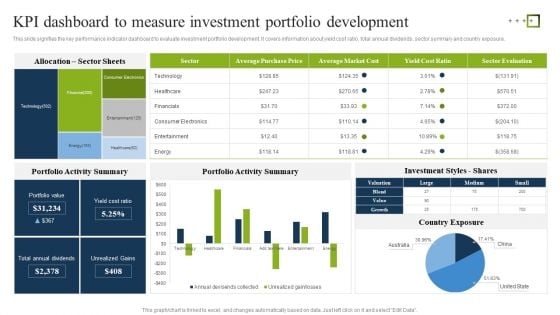
KPI Dashboard To Measure Investment Portfolio Development Ppt Inspiration Gallery PDF
This slide signifies the key performance indicator dashboard to evaluate investment portfolio development. It covers information about yield cost ratio, total annual dividends, sector summary and country exposure. Showcasing this set of slides titled KPI Dashboard To Measure Investment Portfolio Development Ppt Inspiration Gallery PDF. The topics addressed in these templates are Portfolio Activity Summary, Investment Styles Shares, Country Exposure. All the content presented in this PPT design is completely editable. Download it and make adjustments in color, background, font etc. as per your unique business setting.


 Continue with Email

 Home
Home


