Platform Icon
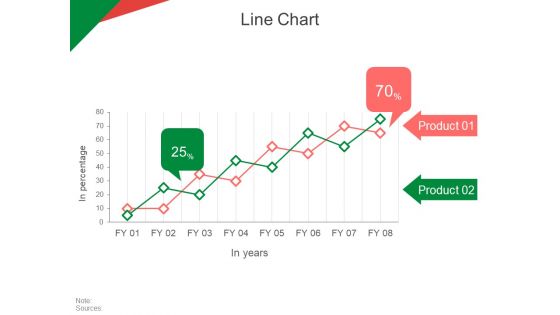
Line Chart Ppt PowerPoint Presentation Professional Smartart
This is a line chart ppt powerpoint presentation professional smartart. This is a two stage process. The stages in this process are in percentage, in years, product, finance, business.
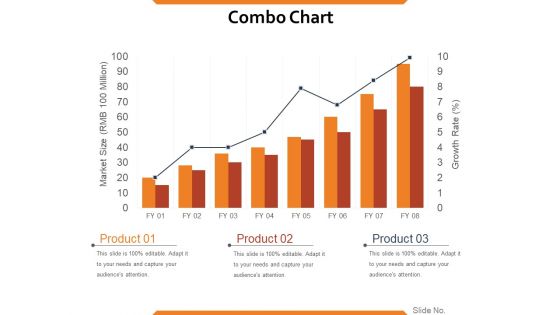
Combo Chart Ppt PowerPoint Presentation Styles Good
This is a combo chart ppt powerpoint presentation styles good. This is a eight stage process. The stages in this process are market size, growth rate, product, growth, strategy, graph, finance.
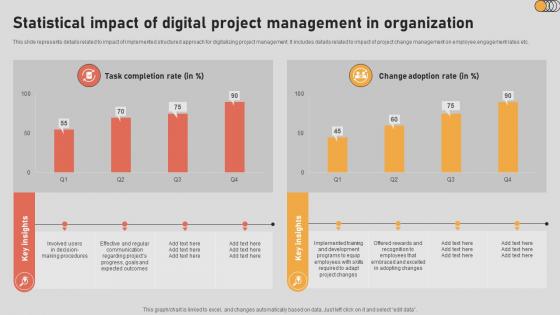
The Digital Project Managers Statistical Impact Of Digital Project Management In Organization
This slide represents details related to impact of implemented structured approach for digitalizing project management. It includes details related to impact of project change management on employee engagement rates etc. Do you have to make sure that everyone on your team knows about any specific topic I yes, then you should give The Digital Project Managers Statistical Impact Of Digital Project Management In Organization a try. Our experts have put a lot of knowledge and effort into creating this impeccable The Digital Project Managers Statistical Impact Of Digital Project Management In Organization. You can use this template for your upcoming presentations, as the slides are perfect to represent even the tiniest detail. You can download these templates from the Slidegeeks website and these are easy to edit. So grab these today This slide represents details related to impact of implemented structured approach for digitalizing project management. It includes details related to impact of project change management on employee engagement rates etc.
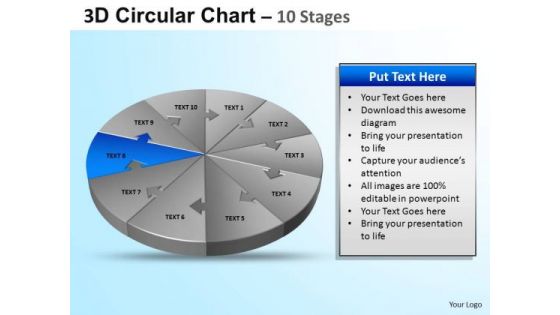
PowerPoint Template Diagram Circular Ppt Design
PowerPoint Template Diagram Circular PPT Design Business Power Points-The Circle of Life - a concept emmbedded in our minds and hence easy to comprehend. Life and Business is made up of processes comprising stages that flow from one to another. An excellent graphic to attract the attention of and understanding by your audience to improve earnings.-These amazing PowerPoint pre-designed slides and PowerPoint templates have been carefully created by our team of experts to help you impress your audience. Our stunning collection of Powerpoint slides are 100% editable and can easily fit in any PowerPoint presentations. By using these animations and graphics in PowerPoint and you can easily make professional presentations. Any text can be entered at any point in the PowerPoint template or slide. Just DOWNLOAD our awesome PowerPoint templates and you are ready to go. Dont ignore the perils of a boring presentation. Liven it up with our PowerPoint Template Diagram Circular Ppt Design. Make sure your presentation gets the attention it deserves.

Collaborating To Build Business PowerPoint Themes And PowerPoint Slides 0411
Microsoft PowerPoint Theme and Slide with a team collaborating to build a puzzle promoting team work Our Collaborating To Build Business PowerPoint Themes And PowerPoint Slides 0411 raise the excitement to a fever pitch. Accelerate the action as per your desire.
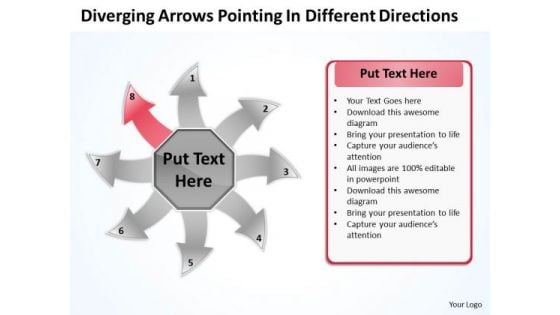
Diverging Arrows Pointing Different Directions Chart Software PowerPoint Templates
We present our diverging arrows pointing different directions Chart Software PowerPoint templates.Download and present our Communication PowerPoint Templates because it Shines the light on your thoughts and motivates your team to improve the quality of celebration for all around you. Download our Arrows PowerPoint Templates because you have the ability to think out of the box. It helps you maintain your unique identity. Use our Circle Charts PowerPoint Templates because this layout helps you to see satisfaction spread across the room as they unravel your gifted views. Download and present our Business PowerPoint Templates because this template helps you to grab the attention of your listeners. Download our Shapes PowerPoint Templates because you have to coordinate and motivate your team.Use these PowerPoint slides for presentations relating to Arrow, Bio, Business, Chart, Circle, Concept, Control, Cycle, Design, Development, Diagram, Eco, Ecology, Environmental, Evaluate, Flow, Flowchart, Fresh, Graphic, Green, Idea, Infographic, Iterative, Life, Lifecycle, Management, Method, Model, Natural, Nature, Organic, Process, Quality, Recycle, Research, Schema, Spiral, Step, Strategy, Success, System. The prominent colors used in the PowerPoint template are Pink, Gray, White. Customers tell us our diverging arrows pointing different directions Chart Software PowerPoint templates are Adorable. Customers tell us our Control PowerPoint templates and PPT Slides are Adorable. Presenters tell us our diverging arrows pointing different directions Chart Software PowerPoint templates are Stylish. PowerPoint presentation experts tell us our Concept PowerPoint templates and PPT Slides are specially created by a professional team with vast experience. They diligently strive to come up with the right vehicle for your brilliant Ideas. Customers tell us our diverging arrows pointing different directions Chart Software PowerPoint templates are the best it can get when it comes to presenting. Professionals tell us our Circle PowerPoint templates and PPT Slides are Exuberant. Pick up any field of study. Our Diverging Arrows Pointing Different Directions Chart Software PowerPoint Templates ensure success in your endeavour.

Incorporating HIS To Enhance Healthcare Services Roles And Responsibilities Of HIS Management Formats PDF
This slide covers roles and responsibilities associated with health information system management. It involves key roles such as medical biller, compliance officer, billing coder and medical records manager. Retrieve professionally designed Incorporating HIS To Enhance Healthcare Services Roles And Responsibilities Of HIS Management Formats PDF to effectively convey your message and captivate your listeners. Save time by selecting pre made slideshows that are appropriate for various topics, from business to educational purposes. These themes come in many different styles, from creative to corporate, and all of them are easily adjustable and can be edited quickly. Access them as PowerPoint templates or as Google Slides themes. You do not have to go on a hunt for the perfect presentation because Slidegeeks got you covered from everywhere.
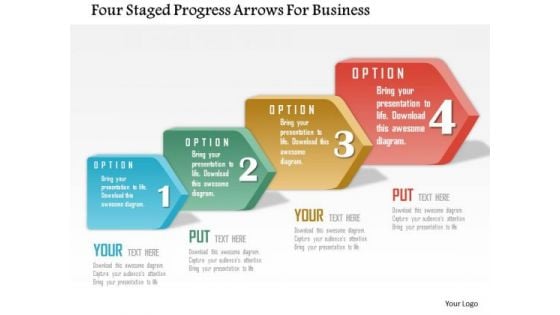
Business Daigram Four Staged Progress Arrows For Business Presentation Templets
This diagram contains design of four staged process arrows. This business slide is designed with graphics of arrows depicting growth and progress steps. Download this diagram slide to make business process related presentations.
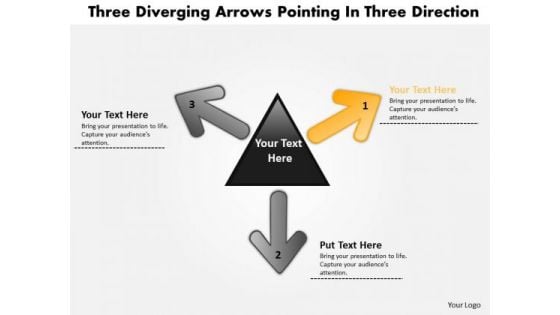
Diverging Arrows Pointing Direction 5 Relative Circular Diagram PowerPoint Templates
We present our diverging arrows pointing direction 5 Relative Circular Diagram PowerPoint templates.Download and present our Process and flows PowerPoint Templates because watching them will strengthen your companys sinews. Download and present our Business PowerPoint Templates because like the famed William Tell, they put aside all emotions and concentrate on the target. Download and present our Marketing PowerPoint Templates because The marketplace is the merger of your dreams and your ability. Use our Shapes PowerPoint Templates because you have the people in place, selected the team leaders and all are raring to go. Present our Flow charts PowerPoint Templates because generation of sales is the core of any business.Use these PowerPoint slides for presentations relating to Arrow, brochure, business,businessman, button, chart, circle,company, cyclic, data, demonstration,diagram, financial, five,glossy, goal, graph, illustration, info,information, investment, man, manage,marketing, model, navigation, option,part, people, person, pie, presentation,process, result, section, segmented. The prominent colors used in the PowerPoint template are Green, Black, Gray. People tell us our diverging arrows pointing direction 5 Relative Circular Diagram PowerPoint templates are Vintage. Professionals tell us our button PowerPoint templates and PPT Slides are Whimsical. We assure you our diverging arrows pointing direction 5 Relative Circular Diagram PowerPoint templates are readymade to fit into any presentation structure. PowerPoint presentation experts tell us our chart PowerPoint templates and PPT Slides are Royal. We assure you our diverging arrows pointing direction 5 Relative Circular Diagram PowerPoint templates are Beautiful. People tell us our button PowerPoint templates and PPT Slides are Wonderful. Keep the camera trained on you with our Diverging Arrows Pointing Direction 5 Relative Circular Diagram PowerPoint Templates. Just download, type and present.
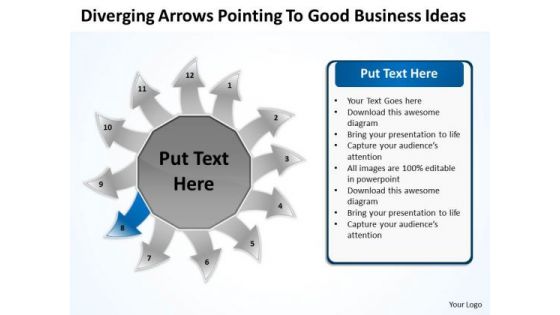
PowerPoint Presentation Ideas Ppt Relative Circular Flow Arrow Diagram Templates
We present our powerpoint presentation ideas ppt Relative Circular Flow Arrow Diagram templates.Use our Communication PowerPoint Templates because there are so many different pieces to the puzzle. Use our Arrows PowerPoint Templates because they enhance the essence of your viable ideas. Use our Circle Charts PowerPoint Templates because they are Gauranteed to focus the minds of your team. Use our Business PowerPoint Templates because your product has established a foothold in the market. Customers are happy with the value it brings to their lives. Present our Shapes PowerPoint Templates because you can Transmit your passion via our creative templates.Use these PowerPoint slides for presentations relating to Arrow, Bio, Business, Chart, Circle, Concept, Control, Cycle, Design, Development, Diagram, Eco, Ecology, Environmental, Evaluate, Flow, Flowchart, Fresh, Graphic, Green, Idea, Infographic, Iterative, Life, Lifecycle, Management, Method, Model, Natural, Nature, Organic, Process, Quality, Recycle, Research, Schema, Spiral, Step, Strategy, Success, System. The prominent colors used in the PowerPoint template are Blue, Gray, Black. Customers tell us our powerpoint presentation ideas ppt Relative Circular Flow Arrow Diagram templates provide great value for your money. Be assured of finding the best projection to highlight your words. Customers tell us our Chart PowerPoint templates and PPT Slides are Fabulous. Presenters tell us our powerpoint presentation ideas ppt Relative Circular Flow Arrow Diagram templates are Glamorous. PowerPoint presentation experts tell us our Cycle PowerPoint templates and PPT Slides are Great. Customers tell us our powerpoint presentation ideas ppt Relative Circular Flow Arrow Diagram templates are Stylish. Professionals tell us our Design PowerPoint templates and PPT Slides will get their audience's attention. Fashionable is what fashionable does. With our PowerPoint Presentation Ideas Ppt Relative Circular Flow Arrow Diagram Templates you will fit the bill.
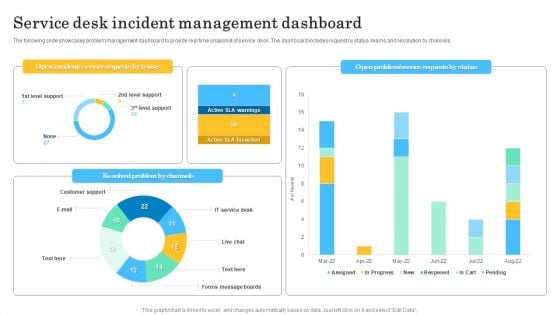
Service Desk Incident Management Dashboard Summary PDF
The following slide showcases problem management dashboard to provide real time snapshot of service desk. The dashboard includes request by status, teams and resolution by channels. Showcasing this set of slides titled Service Desk Incident Management Dashboard Summary PDF. The topics addressed in these templates are Open Incidents Service, Requests By Teams. All the content presented in this PPT design is completely editable. Download it and make adjustments in color, background, font etc. as per your unique business setting.
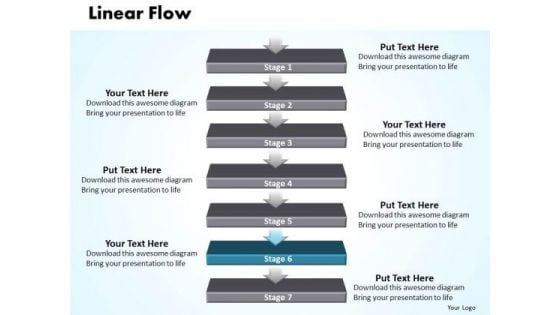
Success Ppt Non-linear PowerPoint Flow 7 Stages Time Management Design
We present our success PPT non-linear Powerpoint flow 7 stages time management design. Use our Arrows PowerPoint Templates because; Churn the wheels of the brains of your colleagues. Use our Layers PowerPoint Templates because, Business 3D Circular Puzzle:- Your business and plans for its growth consist of processes that are highly co-related. Use our Shapes PowerPoint Templates because, Present your views using our innovative slides and be assured of leaving a lasting impression. Use our Business PowerPoint Templates because, Marketing Strategy Business Template: - Maximizing sales of your product is the intended destination. Use our Process and Flows PowerPoint Templates because, this template with an image of helps you chart the course of your presentation. Use these PowerPoint slides for presentations relating to abstract, algorithm, arrow, block diagram, business, chart, color, connection, design, development, diagram, direction, element, flow, graph, linear, linear diagram, management, organization, plan, process, section, segment, set, sign, solution, strategy, symbol, technology, vector. The prominent colors used in the PowerPoint template are Blue, Gray, and Black Clear the blocks for your thoughts. Open up the pipeline with our Success Ppt Non-linear PowerPoint Flow 7 Stages Time Management Design.

Affiliate Web Marketing Techniques Diagram Powerpoint Graphics
This is a affiliate web marketing techniques diagram powerpoint graphics. This is a four stage process. The stages in this process are affiliate gets a commission you get a sale, affiliate puts your ad on their website, customer clicks and converts, conversions are tracked.
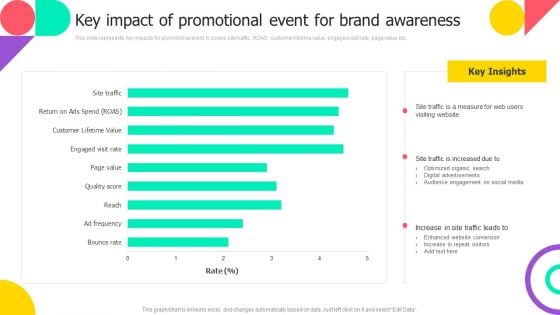
Brand Engagement Promotional Campaign Implementation Key Impact Of Promotional Event For Brand Awareness Diagrams PDF
This slide represents key impacts for promotional event. It covers site traffic, ROAS, customer lifetime value, engaged visit rate, page value etc. Find a pre designed and impeccable Brand Engagement Promotional Campaign Implementation Key Impact Of Promotional Event For Brand Awareness Diagrams PDF. The templates can ace your presentation without additional effort. You can download these easy to edit presentation templates to make your presentation stand out from others. So, what are you waiting for Download the template from Slidegeeks today and give a unique touch to your presentation.
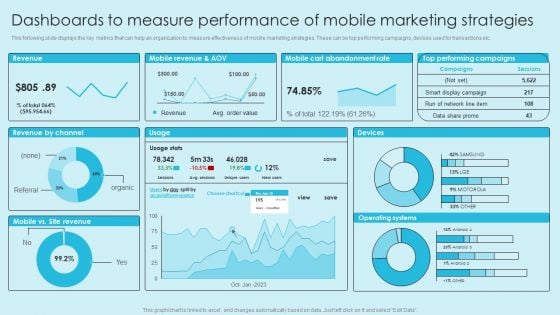
Online Marketing Techniques For Acquiring Clients Dashboards To Measure Performance Of Mobile Marketing Diagrams PDF
This following slide displays the key metrics that can help an organization to measure effectiveness of mobile marketing strategies. These can be top performing campaigns, devises used for transactions etc. Find a pre designed and impeccable Online Marketing Techniques For Acquiring Clients Dashboards To Measure Performance Of Mobile Marketing Diagrams PDF. The templates can ace your presentation without additional effort. You can download these easy to edit presentation templates to make your presentation stand out from others. So, what are you waiting for. Download the template from Slidegeeks today and give a unique touch to your presentation.
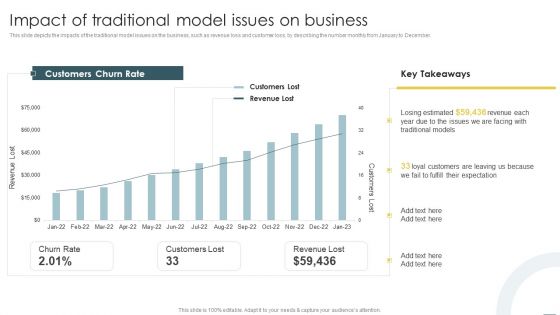
Crystal Methods In Agile Framework Impact Of Traditional Model Issues On Business Diagrams PDF
This slide depicts the impacts of the traditional model issues on the business, such as revenue loss and customer loss, by describing the number monthly from January to December. Take your projects to the next level with our ultimate collection of Crystal Methods In Agile Framework Impact Of Traditional Model Issues On Business Diagrams PDF. Slidegeeks has designed a range of layouts that are perfect for representing task or activity duration, keeping track of all your deadlines at a glance. Tailor these designs to your exact needs and give them a truly corporate look with your own brand colors they will make your projects stand out from the rest.
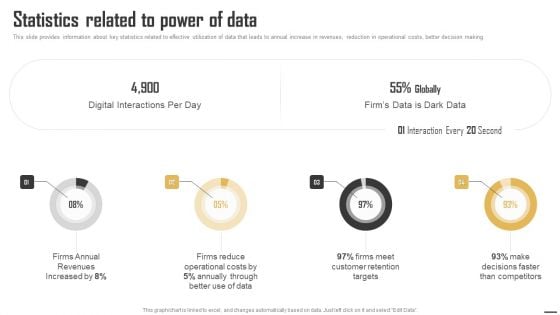
Data Monetization And Management Statistics Related To Power Of Data Diagrams PDF
This slide provides information about key statistics related to effective utilization of data that leads to annual increase in revenues, reduction in operational costs, better decision making. Find a pre-designed and impeccable Data Monetization And Management Statistics Related To Power Of Data Diagrams PDF. The templates can ace your presentation without additional effort. You can download these easy-to-edit presentation templates to make your presentation stand out from others. So, what are you waiting for Download the template from Slidegeeks today and give a unique touch to your presentation.
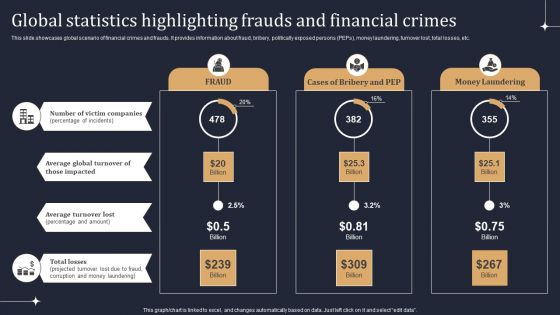
KYC Transaction Monitoring System Business Security Global Statistics Highlighting Frauds Diagrams PDF
This slide showcases global scenario of financial crimes and frauds. It provides information about fraud, bribery, politically exposed persons PEPs, money laundering, turnover lost, total losses, etc. Take your projects to the next level with our ultimate collection of KYC Transaction Monitoring System Business Security Global Statistics Highlighting Frauds Diagrams PDF. Slidegeeks has designed a range of layouts that are perfect for representing task or activity duration, keeping track of all your deadlines at a glance. Tailor these designs to your exact needs and give them a truly corporate look with your own brand colors they will make your projects stand out from the rest.
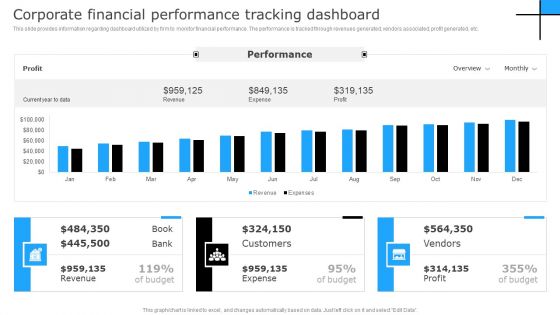
Successful Corporate Technique Enhancing Firms Performance Corporate Financial Performance Diagrams PDF
This slide provides information regarding dashboard utilized by firm to monitor financial performance. The performance is tracked through revenues generated, vendors associated, profit generated, etc. Find a pre designed and impeccable Successful Corporate Technique Enhancing Firms Performance Corporate Financial Performance Diagrams PDF. The templates can ace your presentation without additional effort. You can download these easy to edit presentation templates to make your presentation stand out from others. So, what are you waiting for Download the template from Slidegeeks today and give a unique touch to your presentation.
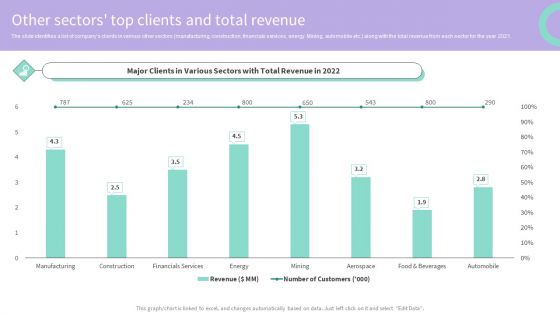
Buy Side Merger And Acquisition Advisory Other Sectors Top Clients And Total Revenue Diagrams PDF
The slide identifies a list of companys clients in various other sectors manufacturing, construction, financials services, energy. Mining, automobile etc. along with the total revenue from each sector for the year 2021. Take your projects to the next level with our ultimate collection of Buy Side Merger And Acquisition Advisory Other Sectors Top Clients And Total Revenue Diagrams PDF. Slidegeeks has designed a range of layouts that are perfect for representing task or activity duration, keeping track of all your deadlines at a glance. Tailor these designs to your exact needs and give them a truly corporate look with your own brand colors they will make your projects stand out from the rest.
Providing Efficient Client Services Kpi Dashboard For Tracking Customer Retention Diagrams PDF
This slide covers the dashboard for analyzing customer loyalty with metrics such as NPS, loyal customer rate, premium users, CLV, customer churn, revenue churn, net retention, MRR growth, etc. Take your projects to the next level with our ultimate collection of Providing Efficient Client Services Kpi Dashboard For Tracking Customer Retention Diagrams PDF. Slidegeeks has designed a range of layouts that are perfect for representing task or activity duration, keeping track of all your deadlines at a glance. Tailor these designs to your exact needs and give them a truly corporate look with your own brand colors they will make your projects stand out from the rest.
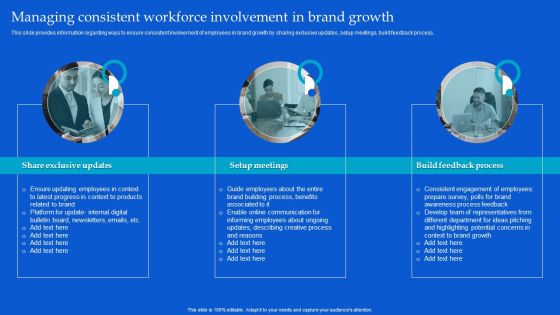
Strategic Guide To Build Brand Personality Managing Consistent Workforce Involvement In Brand Growth Slides PDF
Are you searching for a Strategic Guide To Build Brand Personality Managing Consistent Workforce Involvement In Brand Growth Slides PDF that is uncluttered, straightforward, and original. Its easy to edit, and you can change the colors to suit your personal or business branding. For a presentation that expresses how much effort youve put in, this template is ideal. With all of its features, including tables, diagrams, statistics, and lists, its perfect for a business plan presentation. Make your ideas more appealing with these professional slides. Download Strategic Guide To Build Brand Personality Managing Consistent Workforce Involvement In Brand Growth Slides PDF from Slidegeeks today.
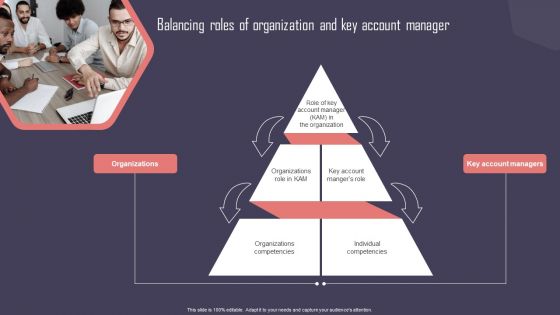
Key Business Account Management And Planning Techniques Balancing Roles Of Organization And Key Account Designs PDF
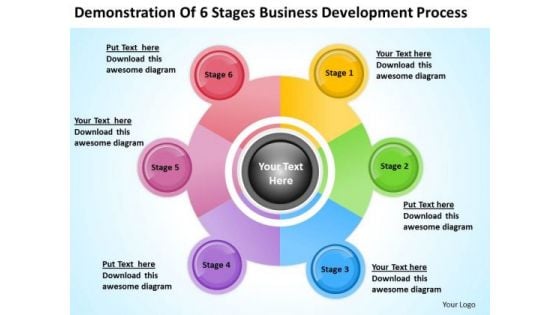
6 Stages Business Development Process Ppt Plan Outline PowerPoint Templates
We present our 6_stages_business_development_process_ppt_plan_outline_PowerPoint_templates.Use our Business PowerPoint Templates because Our PowerPoint Templates and Slides are the chords of your song. String them along and provide the lilt to your views. Download and present our Shapes PowerPoint Templates because Our PowerPoint Templates and Slides are created by a hardworking bunch of busybees. Always flitting around with solutions gauranteed to please. Download and present our Process and Flows PowerPoint Templates because Our PowerPoint Templates and Slides will generate and maintain the level of interest you desire. They will create the impression you want to imprint on your audience. Use our Circle Charts PowerPoint Templates because You will get more than you ever bargained for. Dispatch your thoughts on our 6 Stages Business Development Process Ppt Plan Outline PowerPoint Templates. They will take them the farthest possible.
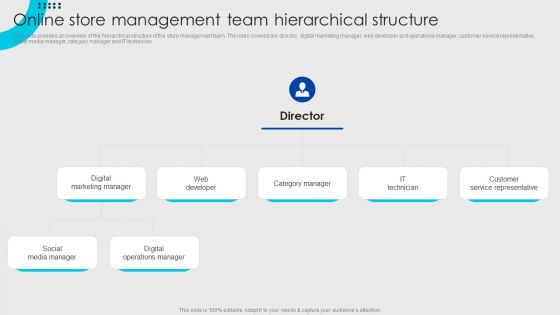
Online Fashion Firm Summary Online Store Management Team Hierarchical Structure Structure PDF
This slide provides an overview of the hierarchical structure of the store management team. The roles covered are director, digital marketing manager, web developer and operations manager, customer service representative, social media manager, category manager and IT technician. Are you searching for a Online Fashion Firm Summary Online Store Management Team Hierarchical Structure Structure PDF that is uncluttered, straightforward, and original Its easy to edit, and you can change the colors to suit your personal or business branding. For a presentation that expresses how much effort youve put in, this template is ideal With all of its features, including tables, diagrams, statistics, and lists, its perfect for a business plan presentation. Make your ideas more appealing with these professional slides. Download Online Fashion Firm Summary Online Store Management Team Hierarchical Structure Structure PDF from Slidegeeks today.
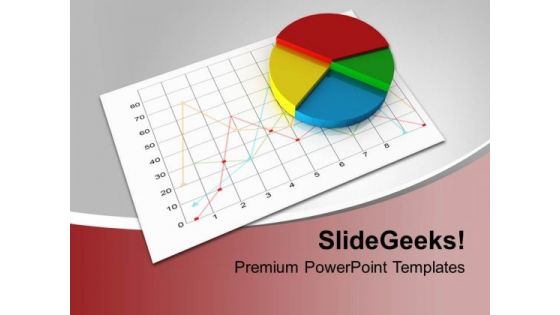
Colorful Pie Chart On Linear Graph PowerPoint Templates Ppt Backgrounds For Slides 0213
We present our Colorful Pie Chart On Linear Graph PowerPoint Templates PPT Backgrounds For Slides 0213.Download our Pie Charts PowerPoint Templates because Our PowerPoint Templates and Slides are truly out of this world. Even the MIB duo has been keeping tabs on our team. Use our Business PowerPoint Templates because our PowerPoint Templates and Slides are the string of your bow. Fire of your ideas and conquer the podium. Present our Marketing PowerPoint Templates because Our PowerPoint Templates and Slides will steer your racing mind. Hit the right buttons and spur on your audience. Download and present our Success PowerPoint Templates because It is Aesthetically crafted by artistic young minds. Our PowerPoint Templates and Slides are designed to display your dexterity. Download and present our Shapes PowerPoint Templates because Our PowerPoint Templates and Slides team portray an attitude of elegance. Personify this quality by using them regularly.Use these PowerPoint slides for presentations relating to Colorful pie chart under the bar graph, pie charts, business, marketing, success, shapes. The prominent colors used in the PowerPoint template are Red, Yellow, White. Let your thoughts do a duet with our Colorful Pie Chart On Linear Graph PowerPoint Templates Ppt Backgrounds For Slides 0213. They'll make great music together.

Businessman Presenting Statistical Chart PowerPoint Templates Ppt Backgrounds For Slides 0313
We present our Businessman Presenting Statistical Chart PowerPoint Templates PPT Backgrounds For Slides 0313.Use our Marketing PowerPoint Templates because Your ideas provide food for thought. Our PowerPoint Templates and Slides will help you create a dish to tickle the most discerning palate. Use our Finance PowerPoint Templates because It will Raise the bar of your Thoughts. They are programmed to take you to the next level. Download and present our People PowerPoint Templates because You can Rise to the occasion with our PowerPoint Templates and Slides. You will bring your audience on their feet in no time. Download and present our Pie charts PowerPoint Templates because Our PowerPoint Templates and Slides will let your ideas bloom. Create a bed of roses for your audience. Download and present our Business PowerPoint Templates because our PowerPoint Templates and Slides are the string of your bow. Fire of your ideas and conquer the podium.Use these PowerPoint slides for presentations relating to person pointing a pie chart, people, business, marketing, pie chart, finance. The prominent colors used in the PowerPoint template are Green, Red, White. Do not let yourself go astray. Keep clear of fallacy with our Businessman Presenting Statistical Chart PowerPoint Templates Ppt Backgrounds For Slides 0313.
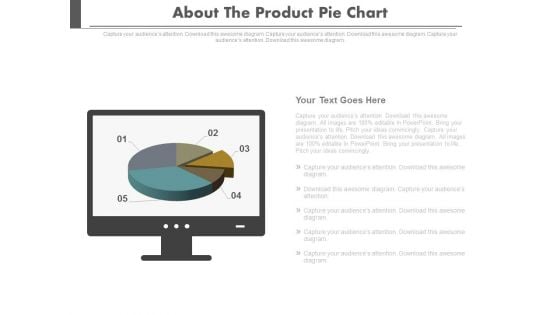
About The Product Pie Chart Ppt Slides
This is a about the product pie chart ppt slides. This is a five stage process. The stages in this process are business, success, marketing.

Geographical Segmentation Gender Ratio Chart Ppt Slides
This is a geographical segmentation gender ratio chart ppt slides. This is a one stage process. The stages in this process are global, geographical, business, success.
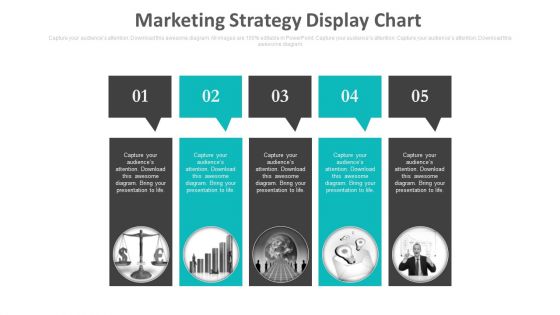
Marketing Strategy Display Chart Ppt Slides
This is a marketing strategy display chart ppt slides. This is a five stage process. The stages in this process are business, marketing, success.
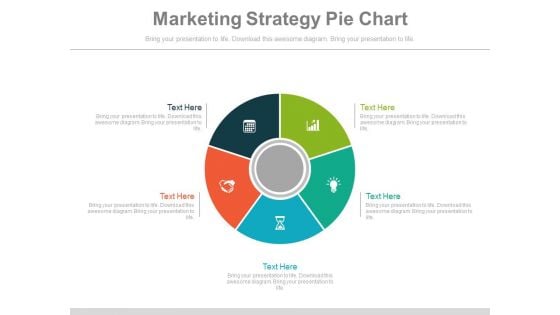
Marketing Strategy Pie Chart Ppt Slides
This is a marketing strategy pie chart ppt slides. This is a five stage process. The stages in this process are business, marketing, success.
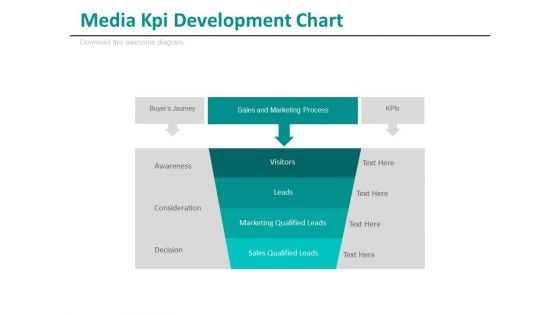
Media Kpi Development Chart Ppt Slides
This is a media KPI development chart ppt slides. This is a one stage process. The stages in this process are business, media, success.
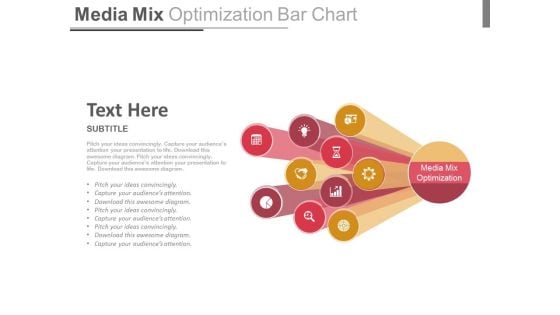
Media Mix Optimization Bar Chart Ppt Slides
This is a media mix optimization bar chart ppt slides. This is a one stage process. The stages in this process are business, media, success.

Pricing Package Tags Chart Ppt Slides
This is a pricing package tags chart ppt slides. This is a four stage process. The stages in this process are business, symbol, marketing, finance, success.
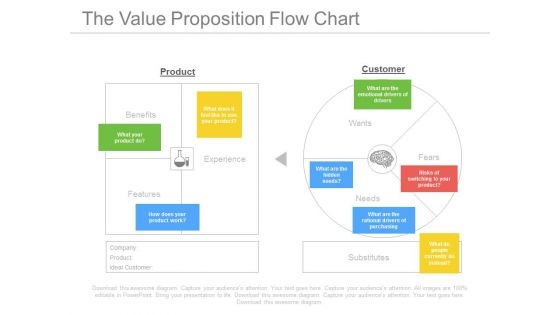
The Value Proposition Flow Chart Ppt Slides
This is a the value proposition flow chart ppt slides. This is a two stage process. The stages in this process are business, success.
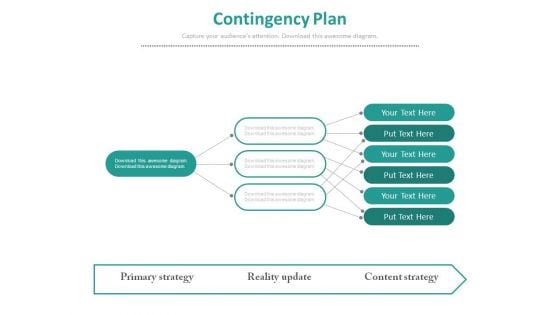
Contingency Plan Flow Chart Ppt Slides
This is a contingency plan flow chart ppt slides. This is a one stage process. The stages in this process are business, marketing.
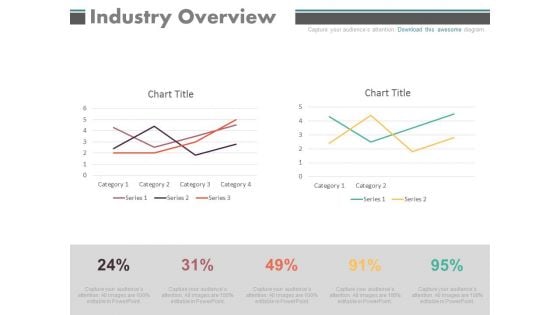
Industry Overview Percentage Chart Ppt Slides
This is a industry overview percentage chart ppt slides. This is a two stage process. The stages in this process are business, marketing.
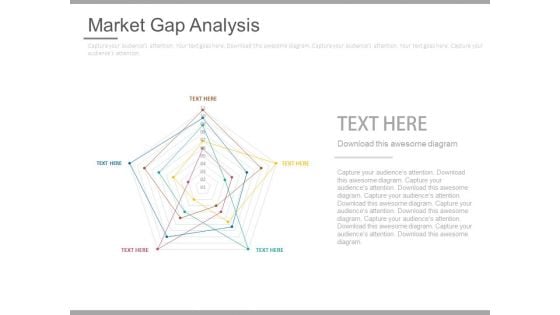
Market Gap Analysis Chart Ppt Slides
This is a market gap analysis chart ppt slides. This is a one stage process. The stages in this process are business, marketing.
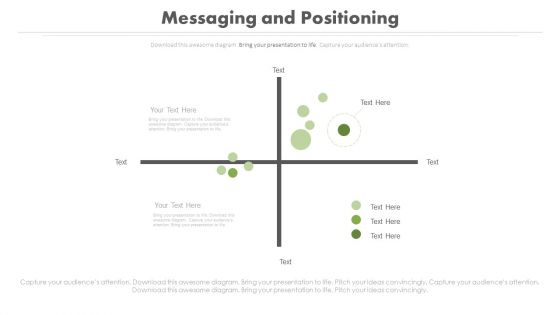
Messaging And Positioning Line Chart Ppt Slides
This is a messaging and positioning line chart ppt slides. This is a two stage process. The stages in this process are business, marketing.

Product Pricing List Chart Ppt Slides
This is a product pricing list chart ppt slides. This is a four stage process. The stages in this process are arrows, business, marketing.
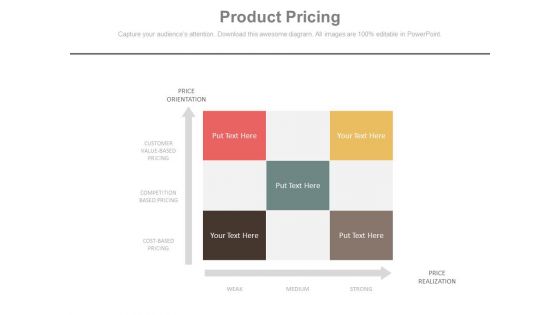
Product Pricing Tabulation Chart Ppt Slides
This is a product pricing tabulation chart ppt slides. This is a five stage process. The stages in this process are arrows, business, marketing.
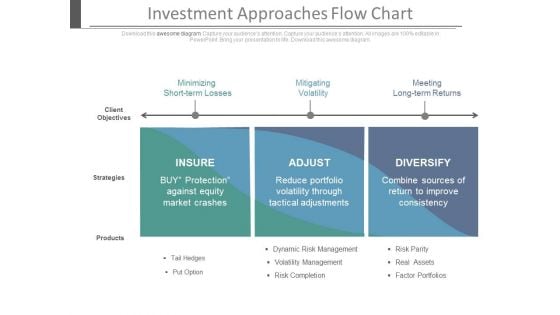
Investment Approaches Flow Chart Ppt Slides
This is an investment approached flow chart ppt slides. This is a three stage process. The stages in this process are marketing, business, success.
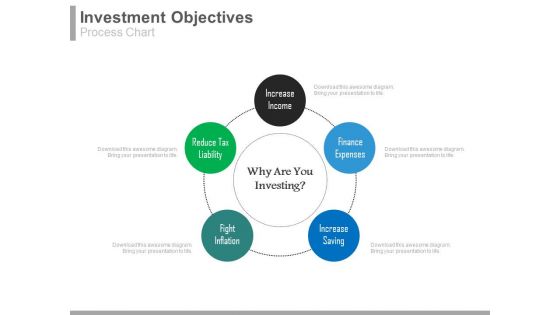
Investment Objectives Process Chart Ppt Slides
This is an investment objectives process chart ppt slides. This is a five stage process. The stages in this process are business, success, marketing.

Investor Personality Gantt Chart Ppt Slides
This is an investor personality gantt chart ppt slides. This is a one stage process. The stages in this process are marketing, business, success.

Portfolio Evaluation Pie Chart Ppt Slides
This is a portfolio evolution pie chart ppt slides. This is a six stage process. The stages in this process are business, finance, marketing.
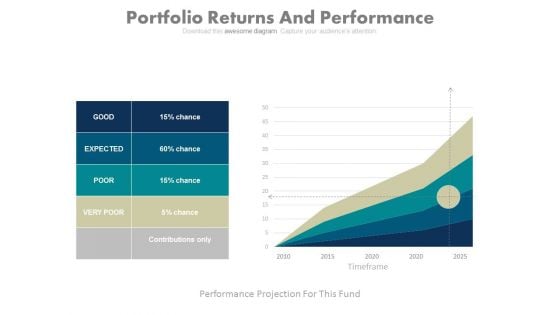
Portfolio Returns And Performance Chart Ppt Slides
This is a portfolio returns and performance chart ppt slides. This is a five stage process. The stages in this process are business, finance, marketing.
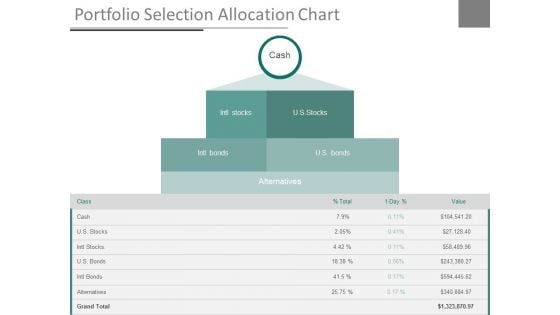
Portfolio Selection Allocation Chart Ppt Slides
This is a portfolio selection allocation chart ppt slides. This is a one stage process. The stages in this process are business, finance, marketing.
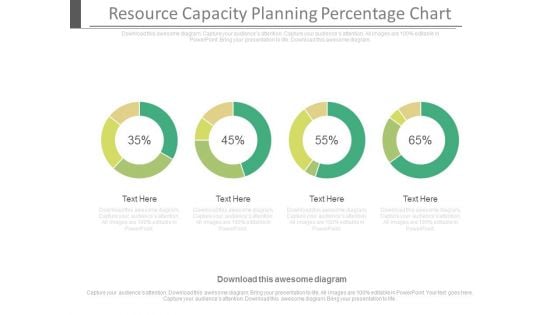
Resource Capacity Planning Percentage Chart Ppt Slides
This is a resource capacity planning percentage chart ppt slides. This is a four stage process. The stages in this process are business, finance, marketing.
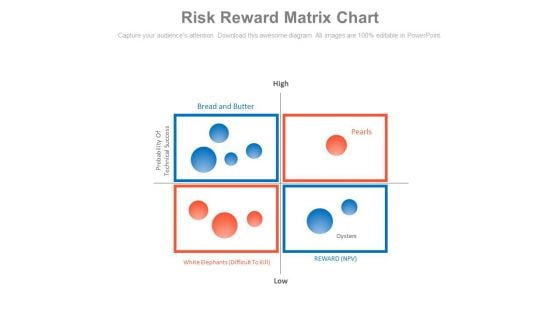
Risk Reward Matrix Chart Ppt Slides
This is a risk reward matrix chart ppt slides. This is a four stage process. The stages in this process are business, marketing, success.
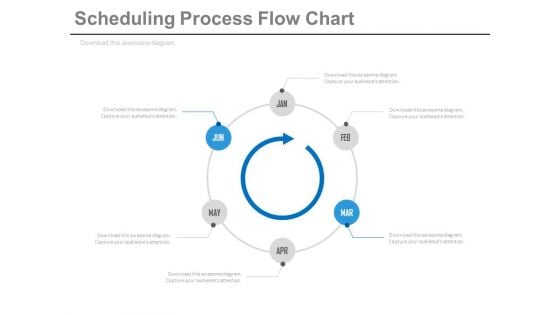
Scheduling Process Flow Chart Ppt Slides
This is a scheduling process flow chart ppt slides. This is a six stage process. The stages in this process are business, time planning, marketing, process and flows.
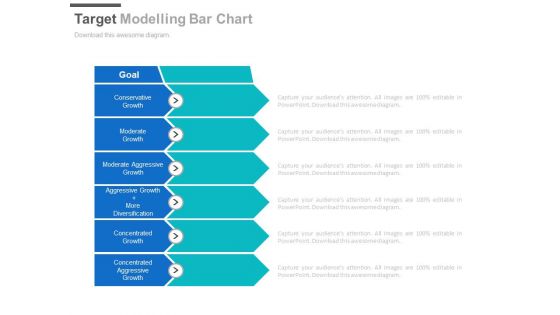
Target Modelling Bar Chart Ppt Slides
This is a target modelling bar chart ppt slides. This is a six stage process. The stages in this process are arrows, business, success.
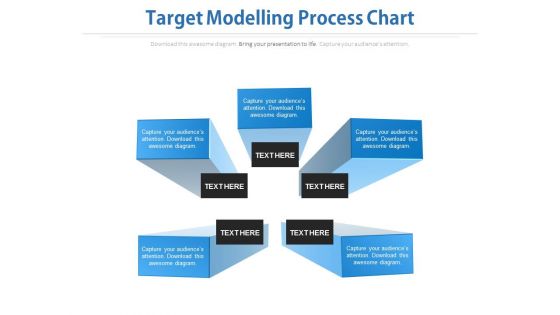
Target Modelling Process Chart Ppt Slides
This is a target modelling process chart ppt slides. This is a five stage process. The stages in this process are business, success, marketing.

What If Modelling Flow Chart Ppt Slides
This is a what if modelling flow chart ppt slides. This is a four stage process. The stages in this process are business, success, marketing, process and flows.
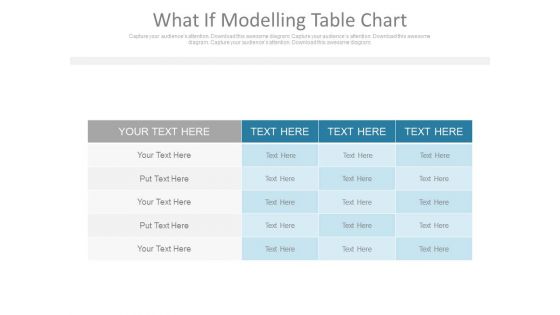
What If Modelling Table Chart Ppt Slides
This is a what if modelling table chart ppt slides. This is a one stage process. The stages in this process are business, success, marketing.
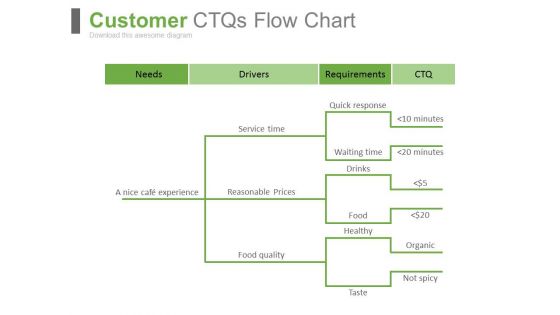
Customer Ctqs Flow Chart Ppt Slides
This is a customer ctqs flow chart ppt slides. This is a one stage process. The stages in this process are business, process and flows.
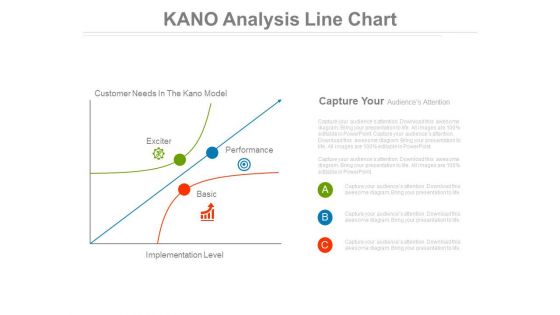
Kano Analysis Line Chart Ppt Slides
This is a kano analysis line chart ppt slides. This is a three stage process. The stages in this process are marketing, business.\n\n
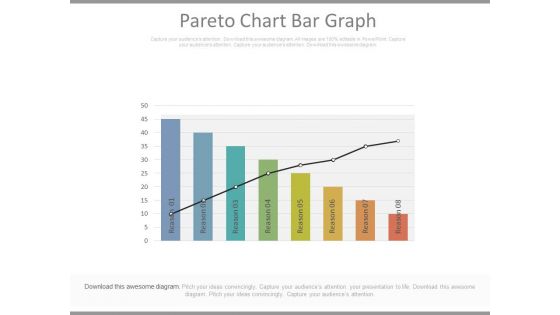
Pareto Chart Bar Graph Ppt Slides
This is a pareto chart bar graph ppt slides. This is a eight stage process. The stages in this process are business, marketing, success.\n
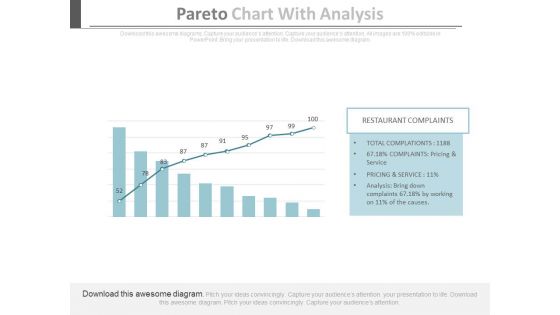
Pareto Chart With Analysis Ppt Slides
This is a pareto chart with analysis ppt slides. This is a one stage process. The stages in this process are business, success, marketing.\n\n\n
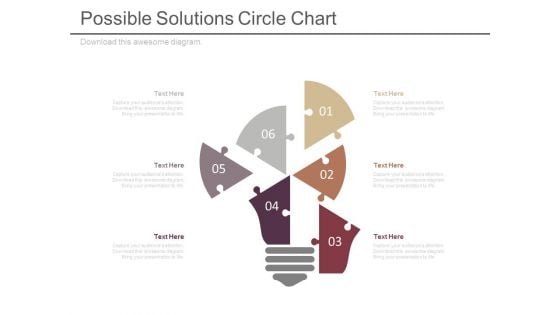
Possible Solutions Circle Chart Ppt Slides
This is a possible solutions circle chart ppt slides. This is a six stage process. The stages in this process are puzzles or jigsaws, business, technology, light bulbs.\n\n\n\n
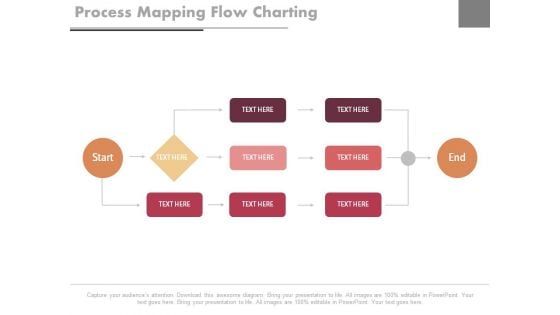
Process Mapping Flow Charting Ppt Slides
This is a process mapping flow charting ppt slides. This is a one stage process. The stages in this process are success, process and flows, business.


 Continue with Email

 Home
Home


