Platform Icon
Investment Ask Thermal Battery Packs Manufacturer Investor Funding Elevator Pitch Deck
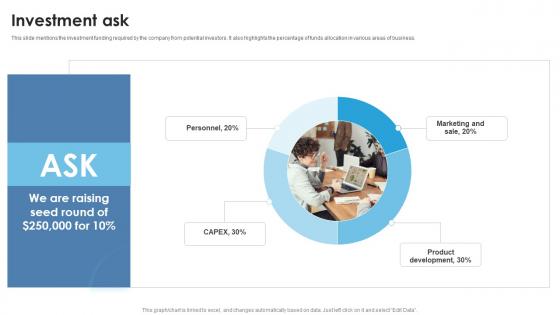
This slide mentions the investment funding required by the company from potential investors. It also highlights the percentage of funds allocation in various areas of business. Whether you have daily or monthly meetings, a brilliant presentation is necessary. Investment Ask Thermal Battery Packs Manufacturer Investor Funding Elevator Pitch Deck can be your best option for delivering a presentation. Represent everything in detail using Investment Ask Thermal Battery Packs Manufacturer Investor Funding Elevator Pitch Deck and make yourself stand out in meetings. The template is versatile and follows a structure that will cater to your requirements. All the templates prepared by Slidegeeks are easy to download and edit. Our research experts have taken care of the corporate themes as well. So, give it a try and see the results. This slide mentions the investment funding required by the company from potential investors. It also highlights the percentage of funds allocation in various areas of business.
Investment Ask Automotive Battery Manufacturer Investor Funding Elevator Pitch Deck
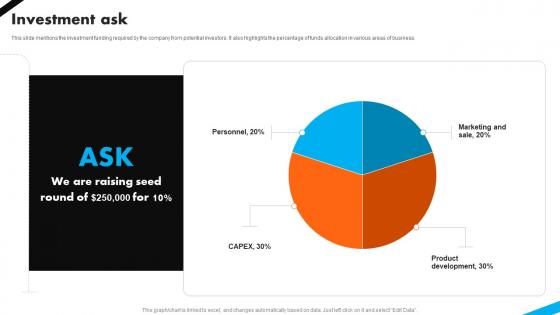
This slide mentions the investment funding required by the company from potential investors. It also highlights the percentage of funds allocation in various areas of business. Whether you have daily or monthly meetings, a brilliant presentation is necessary. Investment Ask Automotive Battery Manufacturer Investor Funding Elevator Pitch Deck can be your best option for delivering a presentation. Represent everything in detail using Investment Ask Automotive Battery Manufacturer Investor Funding Elevator Pitch Deck and make yourself stand out in meetings. The template is versatile and follows a structure that will cater to your requirements. All the templates prepared by Slidegeeks are easy to download and edit. Our research experts have taken care of the corporate themes as well. So, give it a try and see the results. This slide mentions the investment funding required by the company from potential investors. It also highlights the percentage of funds allocation in various areas of business.
Earning Per Share Engineering Solution Provider Company Profile CP SS V
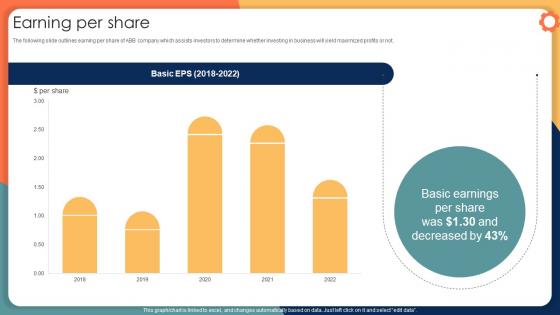
The following slide outlines earning per share of ABB company which assists investors to determine whether investing in business will yield maximized profits or not. Whether you have daily or monthly meetings, a brilliant presentation is necessary. Earning Per Share Engineering Solution Provider Company Profile CP SS V can be your best option for delivering a presentation. Represent everything in detail using Earning Per Share Engineering Solution Provider Company Profile CP SS V and make yourself stand out in meetings. The template is versatile and follows a structure that will cater to your requirements. All the templates prepared by Slidegeeks are easy to download and edit. Our research experts have taken care of the corporate themes as well. So, give it a try and see the results. The following slide outlines earning per share of ABB company which assists investors to determine whether investing in business will yield maximized profits or not.
Strategic Supplier Evaluation For KPI Dashboard For Tracking Supplier Compliance
Mentioned slide demonstrates KPI dashboard for evaluating supplier compliance and performance. It includes key components such as total suppliers, contracts, unlisted, contact compliance rate. Whether you have daily or monthly meetings, a brilliant presentation is necessary. Strategic Supplier Evaluation For KPI Dashboard For Tracking Supplier Compliance can be your best option for delivering a presentation. Represent everything in detail using Strategic Supplier Evaluation For KPI Dashboard For Tracking Supplier Compliance and make yourself stand out in meetings. The template is versatile and follows a structure that will cater to your requirements. All the templates prepared by Slidegeeks are easy to download and edit. Our research experts have taken care of the corporate themes as well. So, give it a try and see the results. Mentioned slide demonstrates KPI dashboard for evaluating supplier compliance and performance. It includes key components such as total suppliers, contracts, unlisted, contact compliance rate,
Employee Count By Business Areas Automobile Development Company Profile CP SS V
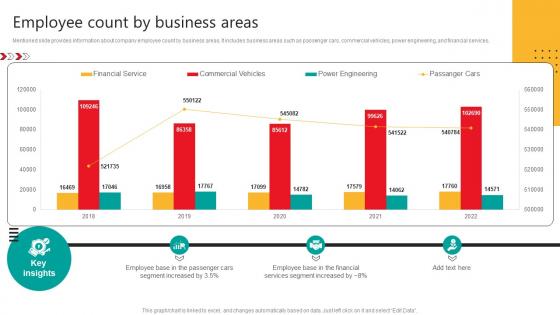
Mentioned slide provides information about company employee count by business areas. It includes business areas such as passenger cars, commercial vehicles, power engineering, and financial services.Whether you have daily or monthly meetings, a brilliant presentation is necessary. Employee Count By Business Areas Automobile Development Company Profile CP SS V can be your best option for delivering a presentation. Represent everything in detail using Employee Count By Business Areas Automobile Development Company Profile CP SS V and make yourself stand out in meetings. The template is versatile and follows a structure that will cater to your requirements. All the templates prepared by Slidegeeks are easy to download and edit. Our research experts have taken care of the corporate themes as well. So, give it a try and see the results. Mentioned slide provides information about company employee count by business areas. It includes business areas such as passenger cars, commercial vehicles, power engineering, and financial services.
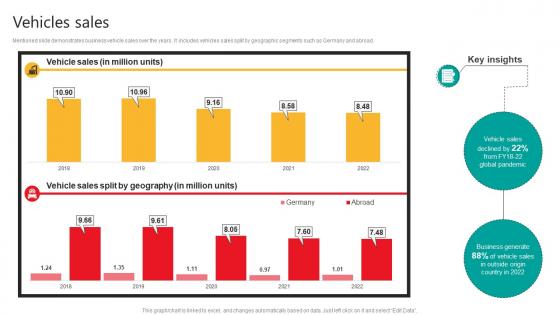
Vehicles Sales Automobile Development Company Profile CP SS V
Mentioned slide demonstrates business vehicle sales over the years. It includes vehicles sales split by geographic segments such as Germany and abroad.Whether you have daily or monthly meetings, a brilliant presentation is necessary. Vehicles Sales Automobile Development Company Profile CP SS V can be your best option for delivering a presentation. Represent everything in detail using Vehicles Sales Automobile Development Company Profile CP SS V and make yourself stand out in meetings. The template is versatile and follows a structure that will cater to your requirements. All the templates prepared by Slidegeeks are easy to download and edit. Our research experts have taken care of the corporate themes as well. So, give it a try and see the results. Mentioned slide demonstrates business vehicle sales over the years. It includes vehicles sales split by geographic segments such as Germany and abroad.

Operating Profit And Margin Consumer Electronics Company Profile CP SS V
Mentioned slide provides information about Apple operating income earned during last five years. It includes key elements such as yearly operating profit, operating margin, and key insights.Whether you have daily or monthly meetings, a brilliant presentation is necessary. Operating Profit And Margin Consumer Electronics Company Profile CP SS V can be your best option for delivering a presentation. Represent everything in detail using Operating Profit And Margin Consumer Electronics Company Profile CP SS V and make yourself stand out in meetings. The template is versatile and follows a structure that will cater to your requirements. All the templates prepared by Slidegeeks are easy to download and edit. Our research experts have taken care of the corporate themes as well. So, give it a try and see the results. Mentioned slide provides information about Apple operating income earned during last five years. It includes key elements such as yearly operating profit, operating margin, and key insights.
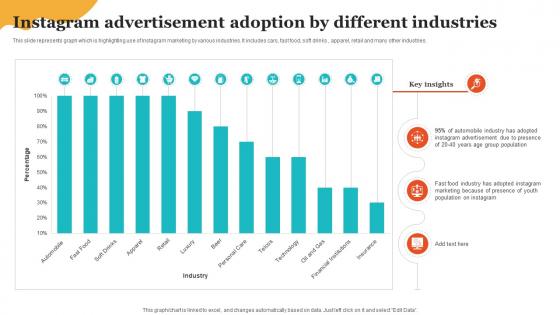
Social Media Marketing To Enhance Instagram Advertisement Adoption By Different Industries MKT SS V
This slide represents graph which is highlighting use of Instagram marketing by various industries. It includes cars, fast food, soft drinks, apparel, retail and many other industries. Whether you have daily or monthly meetings, a brilliant presentation is necessary. Social Media Marketing To Enhance Instagram Advertisement Adoption By Different Industries MKT SS V can be your best option for delivering a presentation. Represent everything in detail using Social Media Marketing To Enhance Instagram Advertisement Adoption By Different Industries MKT SS V and make yourself stand out in meetings. The template is versatile and follows a structure that will cater to your requirements. All the templates prepared by Slidegeeks are easy to download and edit. Our research experts have taken care of the corporate themes as well. So, give it a try and see the results. This slide represents graph which is highlighting use of Instagram marketing by various industries. It includes cars, fast food, soft drinks, apparel, retail and many other industries.
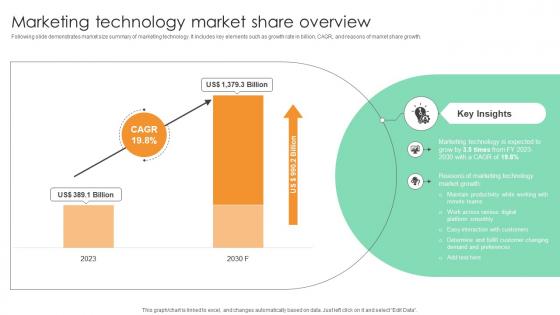
Marketing Technology Market Share Overview Comprehensive Guide For Marketing Technology
Following slide demonstrates market size summary of marketing technology. It includes key elements such as growth rate in billion, CAGR, and reasons of market share growth.Whether you have daily or monthly meetings, a brilliant presentation is necessary. Marketing Technology Market Share Overview Comprehensive Guide For Marketing Technology can be your best option for delivering a presentation. Represent everything in detail using Marketing Technology Market Share Overview Comprehensive Guide For Marketing Technology and make yourself stand out in meetings. The template is versatile and follows a structure that will cater to your requirements. All the templates prepared by Slidegeeks are easy to download and edit. Our research experts have taken care of the corporate themes as well. So, give it a try and see the results. Following slide demonstrates market size summary of marketing technology. It includes key elements such as growth rate in billion, CAGR, and reasons of market share growth.
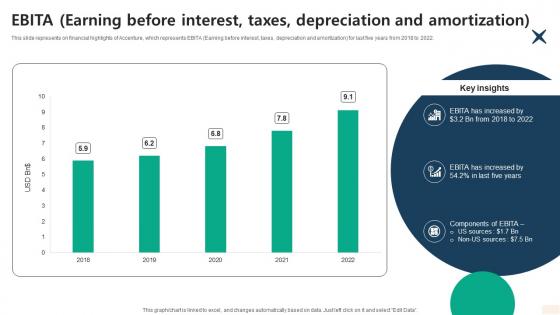
EBITA Earning Before Interest Taxes Depreciation And Amortization CP SS V
This slide represents on financial highlights of Accenture, which represents EBITA Earning before interest, taxes, depreciation and amortization for last five years from 2018 to 2022.Whether you have daily or monthly meetings, a brilliant presentation is necessary. EBITA Earning Before Interest Taxes Depreciation And Amortization CP SS V can be your best option for delivering a presentation. Represent everything in detail using EBITA Earning Before Interest Taxes Depreciation And Amortization CP SS V and make yourself stand out in meetings. The template is versatile and follows a structure that will cater to your requirements. All the templates prepared by Slidegeeks are easy to download and edit. Our research experts have taken care of the corporate themes as well. So, give it a try and see the results. This slide represents on financial highlights of Accenture, which represents EBITA Earning before interest, taxes, depreciation and amortization for last five years from 2018 to 2022.

Cash Flow Analysis Liquid Refreshment Manufacturer Company Profile Ppt Template CP SS V
This slide represents on financial highlights of Coca-Cola which represents cash flow statement analysis for last five years from 2018 to 2022. Whether you have daily or monthly meetings, a brilliant presentation is necessary. Cash Flow Analysis Liquid Refreshment Manufacturer Company Profile Ppt Template CP SS V can be your best option for delivering a presentation. Represent everything in detail using Cash Flow Analysis Liquid Refreshment Manufacturer Company Profile Ppt Template CP SS V and make yourself stand out in meetings. The template is versatile and follows a structure that will cater to your requirements. All the templates prepared by Slidegeeks are easy to download and edit. Our research experts have taken care of the corporate themes as well. So, give it a try and see the results. This slide represents on financial highlights of Coca-Cola which represents cash flow statement analysis for last five years from 2018 to 2022.
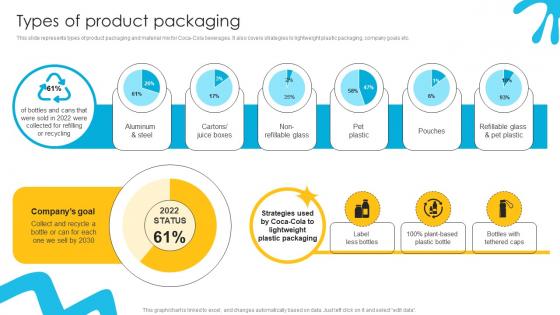
Types Of Product Packaging Liquid Refreshment Manufacturer Company Profile Ppt Sample CP SS V
This slide represents types of product packaging and material mix for Coca-Cola beverages. It also covers strategies to lightweight plastic packaging, company goals etc. Whether you have daily or monthly meetings, a brilliant presentation is necessary. Types Of Product Packaging Liquid Refreshment Manufacturer Company Profile Ppt Sample CP SS V can be your best option for delivering a presentation. Represent everything in detail using Types Of Product Packaging Liquid Refreshment Manufacturer Company Profile Ppt Sample CP SS V and make yourself stand out in meetings. The template is versatile and follows a structure that will cater to your requirements. All the templates prepared by Slidegeeks are easy to download and edit. Our research experts have taken care of the corporate themes as well. So, give it a try and see the results. This slide represents types of product packaging and material mix for Coca-Cola beverages. It also covers strategies to lightweight plastic packaging, company goals etc.
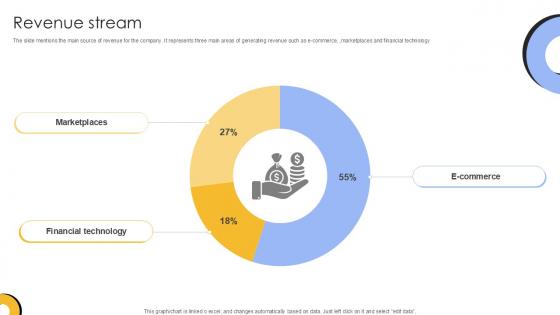
Revenue Stream Investment Company Investor Funding Elevator Ppt Presentation
The slide mentions the main source of revenue for the company. It represents three main areas of generating revenue such as e-commerce, ,marketplaces and financial technology. Whether you have daily or monthly meetings, a brilliant presentation is necessary. Revenue Stream Investment Company Investor Funding Elevator Ppt Presentation can be your best option for delivering a presentation. Represent everything in detail using Revenue Stream Investment Company Investor Funding Elevator Ppt Presentation and make yourself stand out in meetings. The template is versatile and follows a structure that will cater to your requirements. All the templates prepared by Slidegeeks are easy to download and edit. Our research experts have taken care of the corporate themes as well. So, give it a try and see the results. The slide mentions the main source of revenue for the company. It represents three main areas of generating revenue such as e-commerce, ,marketplaces and financial technology
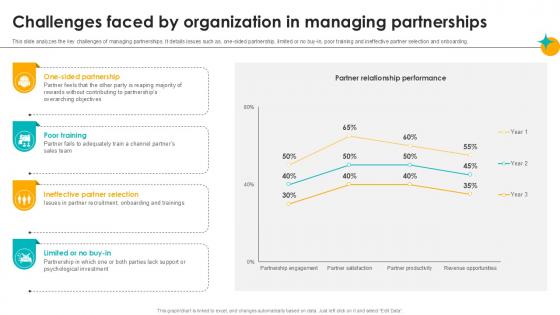
Challenges Faced By Organization In Managing Partner Relationship Ppt Template
This slide analyzes the key challenges of managing partnerships. It details issues such as, one-sided partnership, limited or no buy-in, poor training and ineffective partner selection and onboarding. Whether you have daily or monthly meetings, a brilliant presentation is necessary. Challenges Faced By Organization In Managing Partner Relationship Ppt Template can be your best option for delivering a presentation. Represent everything in detail using Challenges Faced By Organization In Managing Partner Relationship Ppt Template and make yourself stand out in meetings. The template is versatile and follows a structure that will cater to your requirements. All the templates prepared by Slidegeeks are easy to download and edit. Our research experts have taken care of the corporate themes as well. So, give it a try and see the results. This slide analyzes the key challenges of managing partnerships. It details issues such as, one sided partnership, limited or no buy in, poor training and ineffective partner selection and onboarding.

Total Revenue Luxury Automobile Vehicles PPT Slide CP SS V
This slide showcases the total revenue of organization. Total revenue is the total sales made by a company after certain expenses are deducted. Whether you have daily or monthly meetings, a brilliant presentation is necessary. Total Revenue Luxury Automobile Vehicles PPT Slide CP SS V can be your best option for delivering a presentation. Represent everything in detail using Total Revenue Luxury Automobile Vehicles PPT Slide CP SS V and make yourself stand out in meetings. The template is versatile and follows a structure that will cater to your requirements. All the templates prepared by Slidegeeks are easy to download and edit. Our research experts have taken care of the corporate themes as well. So, give it a try and see the results. This slide showcases the total revenue of organization. Total revenue is the total sales made by a company after certain expenses are deducted.
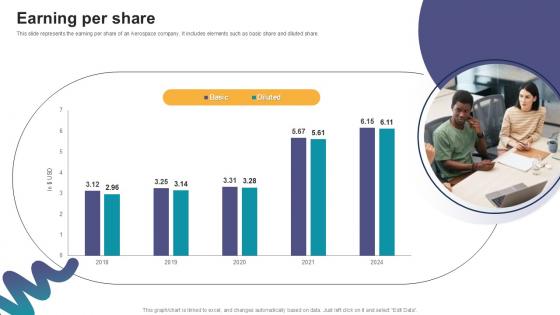
Earning Per Share Digital Marketings Strategies PPT Example CP SS V
This slide represents the earning per share of an Aerospace company. It includes elements such as basic share and diluted share. Whether you have daily or monthly meetings, a brilliant presentation is necessary. Earning Per Share Digital Marketings Strategies PPT Example CP SS V can be your best option for delivering a presentation. Represent everything in detail using Earning Per Share Digital Marketings Strategies PPT Example CP SS V and make yourself stand out in meetings. The template is versatile and follows a structure that will cater to your requirements. All the templates prepared by Slidegeeks are easy to download and edit. Our research experts have taken care of the corporate themes as well. So, give it a try and see the results. This slide represents the earning per share of an Aerospace company. It includes elements such as basic share and diluted share.
Global Wind Energy Installations Global Wind Power Market PPT Example IR SS V
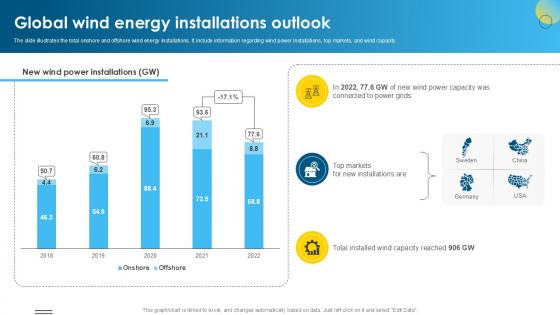
The slide illustrates the total onshore and offshore wind energy installations. It include information regarding wind power installations, top markets, and wind capacity. Whether you have daily or monthly meetings, a brilliant presentation is necessary. Global Wind Energy Installations Global Wind Power Market PPT Example IR SS V can be your best option for delivering a presentation. Represent everything in detail using Global Wind Energy Installations Global Wind Power Market PPT Example IR SS V and make yourself stand out in meetings. The template is versatile and follows a structure that will cater to your requirements. All the templates prepared by Slidegeeks are easy to download and edit. Our research experts have taken care of the corporate themes as well. So, give it a try and see the results. The slide illustrates the total onshore and offshore wind energy installations. It include information regarding wind power installations, top markets, and wind capacity.

Load Testing Performance Monitoring Dashboard Stress Testing For Robust Ppt Template
The purpose of this slide is to highlight the components in the load testing performance monitoring dashboard such as load size, hit time, log message, failed rounds, throughput, etc. Whether you have daily or monthly meetings, a brilliant presentation is necessary. Load Testing Performance Monitoring Dashboard Stress Testing For Robust Ppt Template can be your best option for delivering a presentation. Represent everything in detail using Load Testing Performance Monitoring Dashboard Stress Testing For Robust Ppt Template and make yourself stand out in meetings. The template is versatile and follows a structure that will cater to your requirements. All the templates prepared by Slidegeeks are easy to download and edit. Our research experts have taken care of the corporate themes as well. So, give it a try and see the results. The purpose of this slide is to highlight the components in the load testing performance monitoring dashboard such as load size, hit time, log message, failed rounds, throughput, etc.
Global Market Size Of Security Harnessing The World Of Ethical Ppt Slide
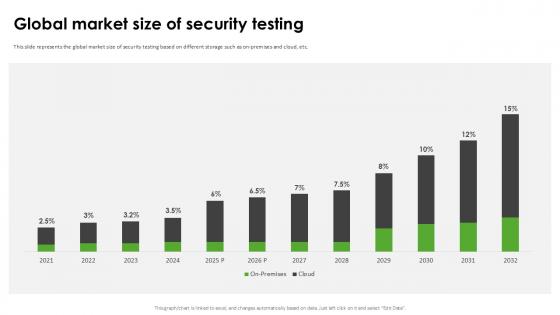
This slide represents the global market size of security testing based on different storage such as on-premises and cloud, etc. Whether you have daily or monthly meetings, a brilliant presentation is necessary. Global Market Size Of Security Harnessing The World Of Ethical Ppt Slide can be your best option for delivering a presentation. Represent everything in detail using Global Market Size Of Security Harnessing The World Of Ethical Ppt Slide and make yourself stand out in meetings. The template is versatile and follows a structure that will cater to your requirements. All the templates prepared by Slidegeeks are easy to download and edit. Our research experts have taken care of the corporate themes as well. So, give it a try and see the results. This slide represents the global market size of security testing based on different storage such as on-premises and cloud, etc.
Digital Media And Entertainment International Trade Of Products And Services PPT Example CP SS V
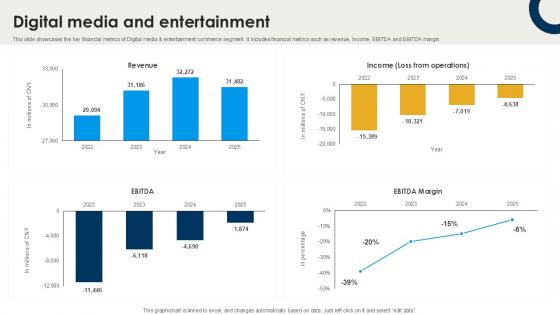
This slide showcases the key financial metrics of Digital media and entertainment commerce segment. It includes financial metrics such as revenue, Income, EBITDA and EBITDA margin. Whether you have daily or monthly meetings, a brilliant presentation is necessary. Digital Media And Entertainment International Trade Of Products And Services PPT Example CP SS V can be your best option for delivering a presentation. Represent everything in detail using Digital Media And Entertainment International Trade Of Products And Services PPT Example CP SS V and make yourself stand out in meetings. The template is versatile and follows a structure that will cater to your requirements. All the templates prepared by Slidegeeks are easy to download and edit. Our research experts have taken care of the corporate themes as well. So, give it a try and see the results. This slide showcases the key financial metrics of Digital media and entertainment commerce segment. It includes financial metrics such as revenue, Income, EBITDA and EBITDA margin.

5 Development Stages For Group Dynamics Ppt PowerPoint Presentation Slides Mockup PDF
Presenting 5 development stages for group dynamics ppt powerpoint presentation slides mockup pdf to dispense important information. This template comprises five stages. It also presents valuable insights into the topics including forming stage, storming stage, norming stage, performing stage, adjourning stage. This is a completely customizable PowerPoint theme that can be put to use immediately. So, download it and address the topic impactfully.
Cyber Incident Crisis Management Strategy Guidelines PDF
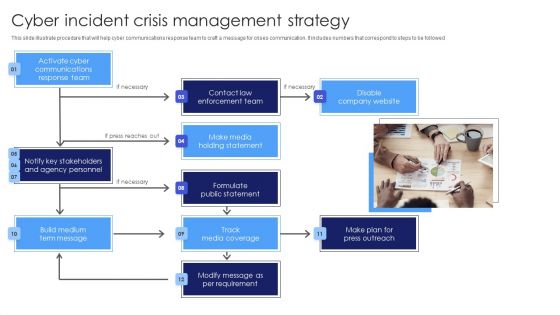
This slide illustrate procedure that will help cyber communications response team to craft a message for crises communication. It includes numbers that correspond to steps to be followed. Presenting Cyber Incident Crisis Management Strategy Guidelines PDF to dispense important information. This template comprises one stages. It also presents valuable insights into the topics including Make Media Holding Statement, Contact Law Enforcement Team, Disable Company Website. This is a completely customizable PowerPoint theme that can be put to use immediately. So, download it and address the topic impactfully.
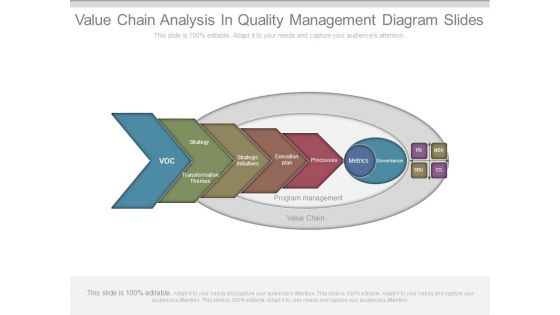
Value Chain Analysis In Quality Management Diagram Slides
This is a value chain analysis in quality management diagram slides. This is a five stage process. The stages in this process are voc, strategy, themes, transformation, strategic initiatives, execution plan, processes, metrics, governance, program management, value chain, pd, mbu, sbu, cs.
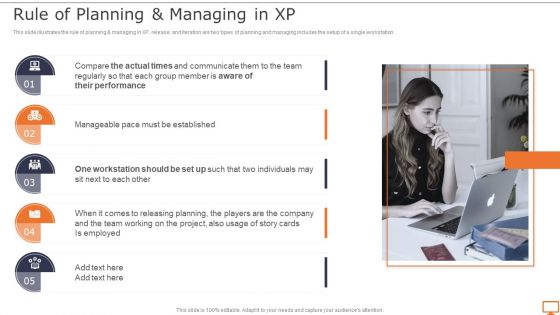
Deploying XP Practices To Enhance Operational Efficiency Rule Of Planning And Managing In XP Infographics PDF
This slide illustrates the rule of planning managing in XP, release, and iteration are two types of planning and managing includes the setup of a single workstation. If you are looking for a format to display your unique thoughts, then the professionally designed Deploying XP Practices To Enhance Operational Efficiency Rule Of Planning And Managing In XP Infographics PDF is the one for you. You can use it as a Google Slides template or a PowerPoint template. Incorporate impressive visuals, symbols, images, and other charts. Modify or reorganize the text boxes as you desire. Experiment with shade schemes and font pairings. Alter, share or cooperate with other people on your work. Download Deploying XP Practices To Enhance Operational Efficiency Rule Of Planning And Managing In XP Infographics PDF and find out how to give a successful presentation. Present a perfect display to your team and make your presentation unforgettable.
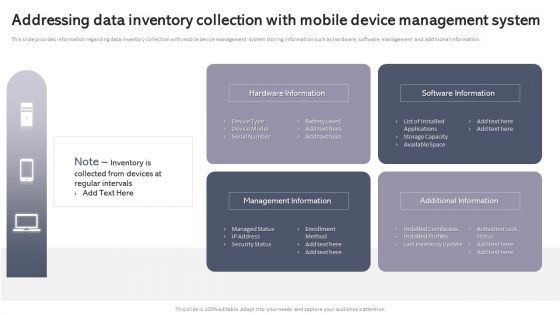
Addressing Data Inventory Collection With Mobile Device Management System Designs PDF
This slide provides information regarding data inventory collection with mobile device management system storing information such as hardware, software, management and additional information. If you are looking for a format to display your unique thoughts, then the professionally designed Addressing Data Inventory Collection With Mobile Device Management System Designs PDF is the one for you. You can use it as a Google Slides template or a PowerPoint template. Incorporate impressive visuals, symbols, images, and other charts. Modify or reorganize the text boxes as you desire. Experiment with shade schemes and font pairings. Alter, share or cooperate with other people on your work. Download Addressing Data Inventory Collection With Mobile Device Management System Designs PDF and find out how to give a successful presentation. Present a perfect display to your team and make your presentation unforgettable.
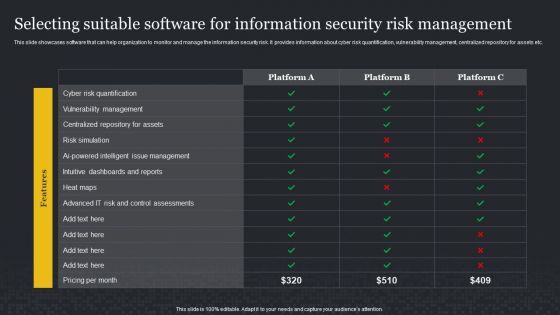
Selecting Suitable Software For Information Security Risk Management Cybersecurity Risk Assessment Infographics PDF
This slide showcases software that can help organization to monitor and manage the information security risk. It provides information about cyber risk quantification, vulnerability management, centralized repository for assets etc. If you are looking for a format to display your unique thoughts, then the professionally designed Selecting Suitable Software For Information Security Risk Management Cybersecurity Risk Assessment Infographics PDF is the one for you. You can use it as a Google Slides template or a PowerPoint template. Incorporate impressive visuals, symbols, images, and other charts. Modify or reorganize the text boxes as you desire. Experiment with shade schemes and font pairings. Alter, share or cooperate with other people on your work. Download Selecting Suitable Software For Information Security Risk Management Cybersecurity Risk Assessment Infographics PDF and find out how to give a successful presentation. Present a perfect display to your team and make your presentation unforgettable.
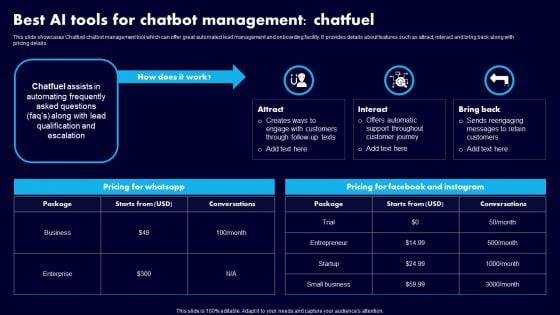
Best AI Tools For Chatbot Management Chatfuel Ppt Ideas Graphics PDF
This slide showcases Chatfuel chatbot management tool which can offer great automated lead management and onboarding facility. It provides details about features such as attract, interact and bring back along with pricing details. If you are looking for a format to display your unique thoughts, then the professionally designed Best AI Tools For Chatbot Management Chatfuel Ppt Ideas Graphics PDF is the one for you. You can use it as a Google Slides template or a PowerPoint template. Incorporate impressive visuals, symbols, images, and other charts. Modify or reorganize the text boxes as you desire. Experiment with shade schemes and font pairings. Alter, share or cooperate with other people on your work. Download Best AI Tools For Chatbot Management Chatfuel Ppt Ideas Graphics PDF and find out how to give a successful presentation. Present a perfect display to your team and make your presentation unforgettable.
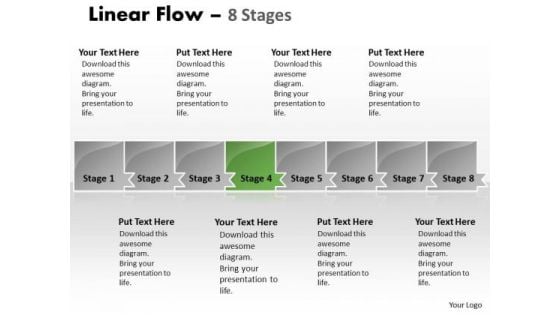
Usa Ppt Theme Parellel Representation Of 8 Issues Business Plan PowerPoint 5 Image
We present our USA PPT Theme parallel representation of 8 issues business plan power point 5 Image. Use our Advertising PowerPoint Templates because, But you have an idea of which you are sure. Use our Shapes PowerPoint Templates because, There are a bucketful of brilliant ideas swirling around within your group. Use our Business PowerPoint Templates because, Marketing Strategy Business Template: - Maximizing sales of your product is the intended destination. Use our Finance PowerPoint Templates because, A healthy is the essence of a sense of happiness. Use our Process and Flows PowerPoint Templates because; educate your team and the attention you have paid. Use these PowerPoint slides for presentations relating to abstract, algorithm, arrow, business, chart, color, connection, design, development, direction, element, flow, graph, linear, management, model, organization, plan, process, program, section, segment, set, sign, solution, strategy, symbol, technology. The prominent colors used in the PowerPoint template are Green, Gray, and Black Facilitate the assimilation of your ideas. Our Usa Ppt Theme Parellel Representation Of 8 Issues Business Plan PowerPoint 5 Image make it esier to digest.
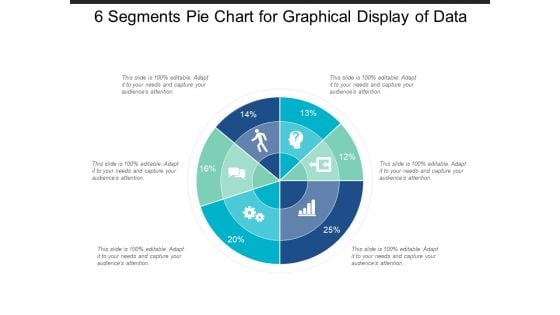
6 Segments Pie Chart For Graphical Display Of Data Ppt PowerPoint Presentation Portfolio Rules
This is a 6 segments pie chart for graphical display of data ppt powerpoint presentation portfolio rules. This is a six stage process. The stages in this process are 6 piece pie chart, 6 segment pie chart, 6 parts pie chart.

7 Segments Pie Chart For Graphical Display Of Data Ppt PowerPoint Presentation Model Elements
This is a 7 segments pie chart for graphical display of data ppt powerpoint presentation model elements. This is a seven stage process. The stages in this process are 6 piece pie chart, 6 segment pie chart, 6 parts pie chart.
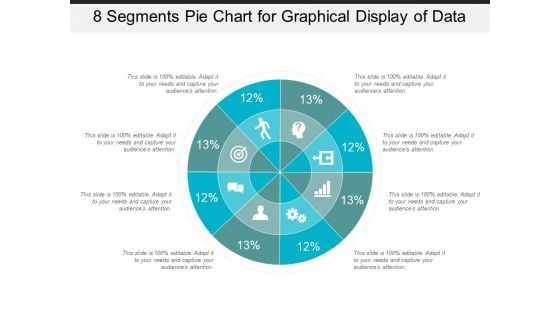
8 Segments Pie Chart For Graphical Display Of Data Ppt PowerPoint Presentation Infographic Template Templates
This is a 8 segments pie chart for graphical display of data ppt powerpoint presentation infographic template templates. This is a eight stage process. The stages in this process are 6 piece pie chart, 6 segment pie chart, 6 parts pie chart.
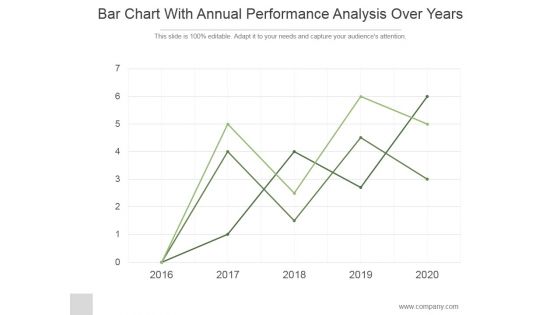
Bar Chart With Annual Performance Analysis Over Years Ppt PowerPoint Presentation Design Ideas
This is a bar chart with annual performance analysis over years ppt powerpoint presentation design ideas. This is a five stage process. The stages in this process are business, strategy, marketing, analysis, line graph.
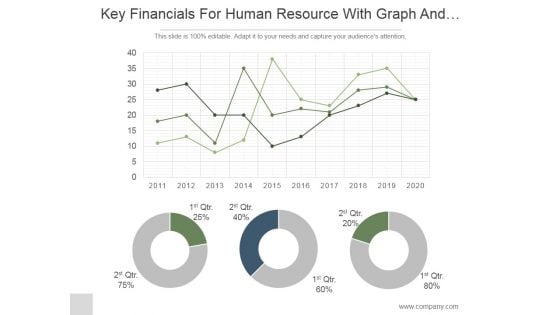
Key Financials For Human Resource With Graph And Pie Chart Ppt PowerPoint Presentation Ideas
This is a key financials for human resource with graph and pie chart ppt powerpoint presentation ideas. This is a three stage process. The stages in this process are business, strategy, marketing, analysis, donut, growth.
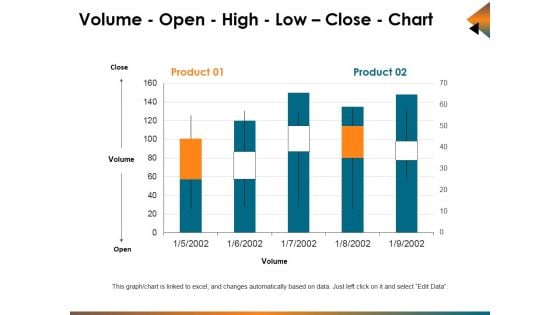
Volume Open High Low Close Chart Ppt PowerPoint Presentation Ideas Graphics Example
This is a volume open high low close chart ppt powerpoint presentation ideas graphics example. This is a five stage process. The stages in this process are business, bar graph, stock, cost, market.
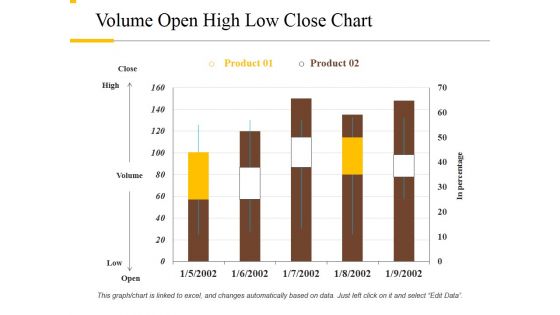
Volume Open High Low Close Chart Ppt PowerPoint Presentation Layouts Background Image
This is a volume open high low close chart ppt powerpoint presentation layouts background image. This is a two stage process. The stages in this process are close, high, volume, low, open.
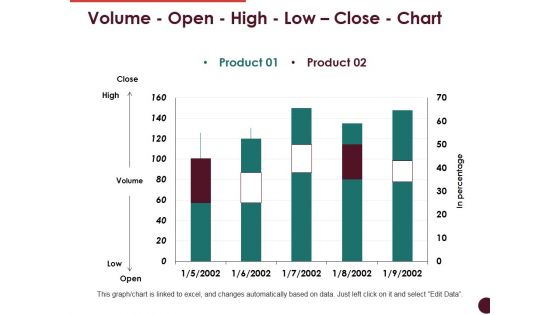
Volume Open High Low Close Chart Ppt PowerPoint Presentation File Graphics Template
This is a volume open high low close chart ppt powerpoint presentation file graphics template. This is a two stage process. The stages in this process are close, high, volume, low, open, product.
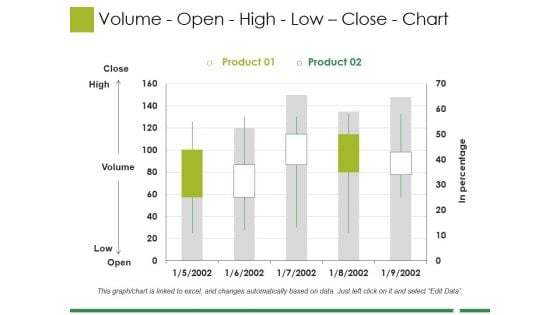
Volume Open High Low Close Chart Ppt PowerPoint Presentation Professional Format
This is a volume open high low close chart ppt powerpoint presentation professional format. This is a five stage process. The stages in this process are business, marketing, strategy, finance, planning.
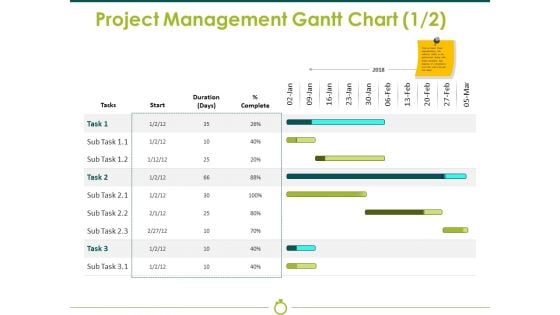
Project Management Gantt Chart Template 1 Ppt PowerPoint Presentation Gallery Graphics Template
This is a project management gantt chart template 1 ppt powerpoint presentation gallery graphics template. This is a two stage process. The stages in this process are start, duration, complete, business, finance.
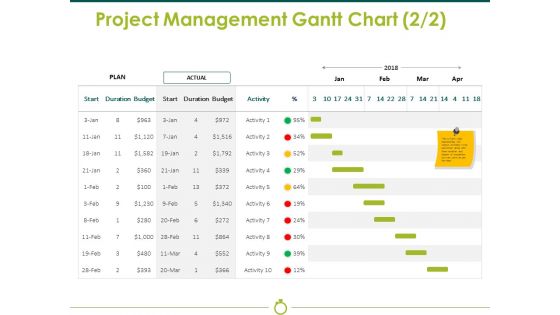
Project Management Gantt Chart Template 2 Ppt PowerPoint Presentation Show Styles
This is a project management gantt chart template 2 ppt powerpoint presentation show styles. This is a two stage process. The stages in this process are plan, actual, budget, duration, start.
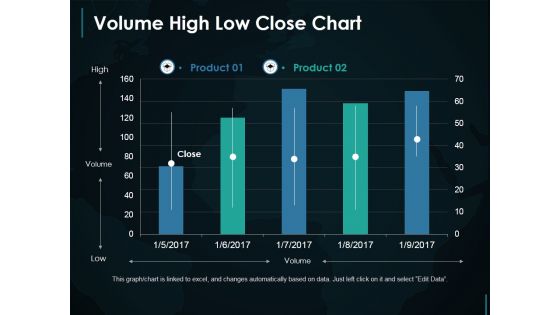
Volume High Low Close Chart Ppt PowerPoint Presentation Slides Example File
This is a volume high low close chart ppt powerpoint presentation slides example file. This is a two stage process. The stages in this process are high, volume, low.
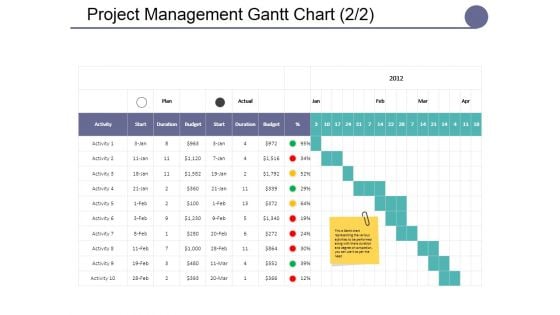
Project Management Gantt Chart Template Ppt PowerPoint Presentation Summary Master Slide
This is a project management gantt chart template ppt powerpoint presentation summary master slide. This is a seven stage process. The stages in this process are lists, table, data, management, marketing.
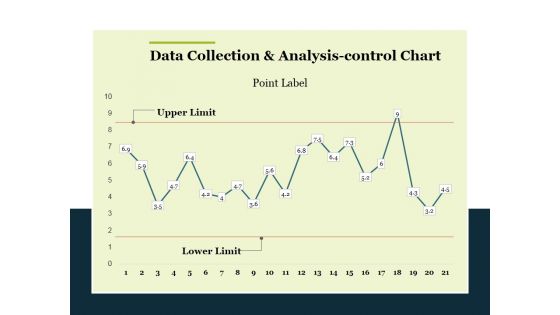
Data Collection And Analysis Control Chart Ppt PowerPoint Presentation Summary Templates
This is a data collection and analysis control chart ppt powerpoint presentation summary templates. This is a one stage process. The stages in this process are business, marketing, point label, upper limit, lower limit.
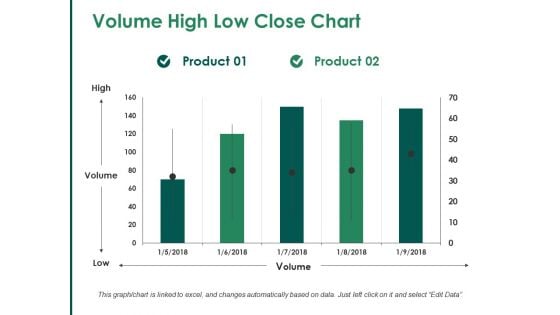
Volume High Low Close Chart Ppt PowerPoint Presentation Visual Aids Slides
This is a volume high low close chart ppt powerpoint presentation visual aids slides. This is a two stage process. The stages in this process are bar graph, marketing, strategy, finance, planning.
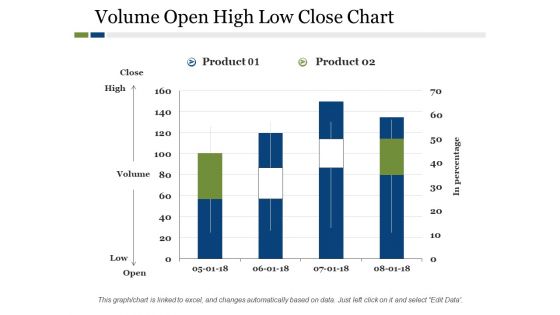
Volume Open High Low Close Chart Ppt PowerPoint Presentation Outline Mockup
This is a volume open high low close chart ppt powerpoint presentation outline mockup. This is a two stage process. The stages in this process are product, high, low, in percentage, volume.
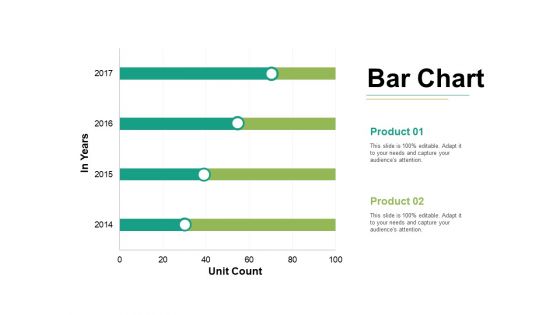
Bar Chart Ppt PowerPoint Presentation Styles Graphics Tutorials Ppt PowerPoint Presentation Slides Gallery
This is a bar chart ppt powerpoint presentation styles graphics tutorials ppt powerpoint presentation slides gallery. This is a two stage process. The stages in this process are bar graph, growth, success, business, marketing.
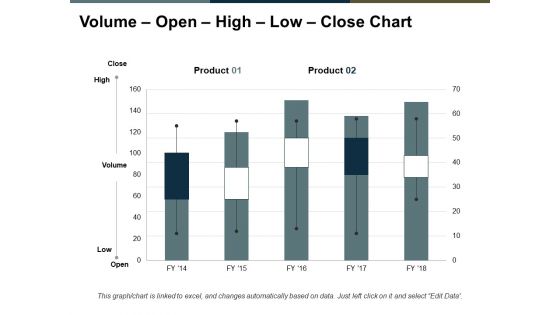
Volume Open High Low Close Chart Ppt PowerPoint Presentation Model Ideas
This is a volume open high low close chart ppt powerpoint presentation model ideas. This is a five stage process. The stages in this process are finance, marketing, analysis, business, investment.
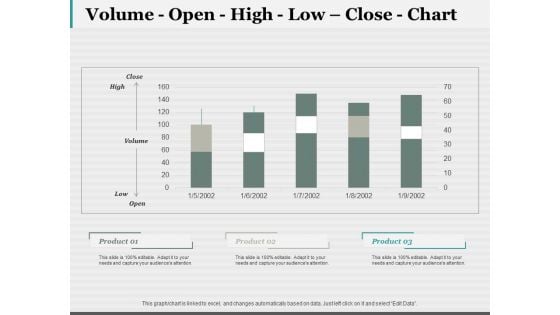
Volume Open High Low Close Chart Ppt PowerPoint Presentation Pictures Tips
This is a volume open high low close chart ppt powerpoint presentation pictures tips. This is a three stage process. The stages in this process are high, volume, low, open, business.
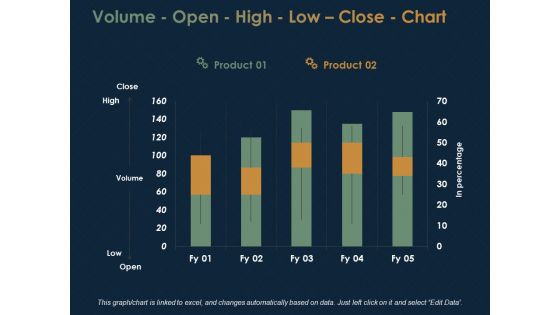
Volume Open High Low Close Chart Finance Ppt PowerPoint Presentation Gallery Graphic Tips
This is a volume open high low close chart finance ppt powerpoint presentation gallery graphic tips. This is a two stage process. The stages in this process are finance, analysis, business, investment, marketing.
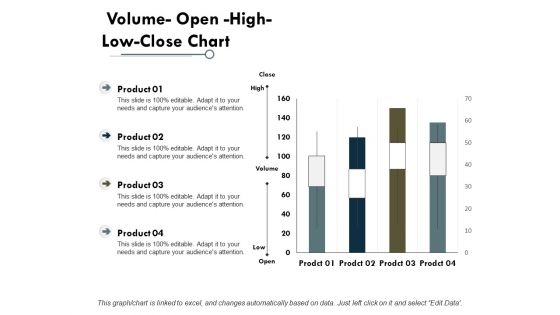
Volume Open High Low Close Chart Finance Ppt PowerPoint Presentation Professional Background Image
This is a volume open high low close chart finance ppt powerpoint presentation professional background image. This is a four stage process. The stages in this process are finance, analysis, business, investment, marketing.
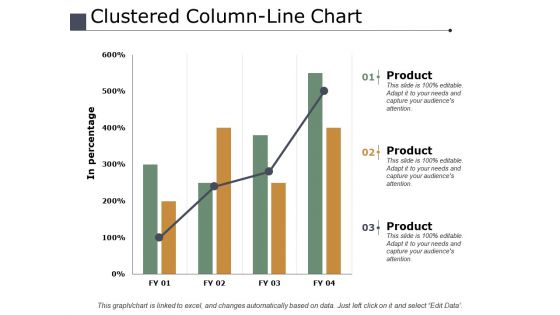
Clustered Column Line Chart Finance Ppt PowerPoint Presentation Inspiration Design Templates
This is a clustered column line chart finance ppt powerpoint presentation inspiration design templates. This is a three stage process. The stages in this process are finance, analysis, business, investment, marketing.
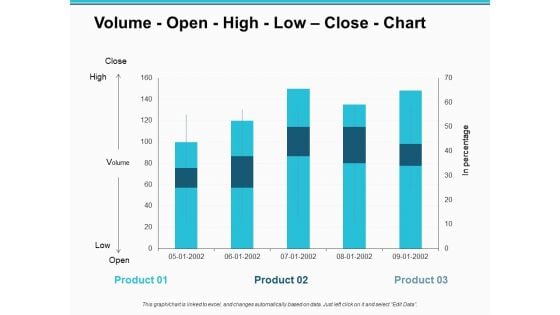
Volume Open High Low Close Chart Finance Ppt PowerPoint Presentation Model Graphic Images
This is a volume open high low close chart finance ppt powerpoint presentation model graphic images. This is a three stage process. The stages in this process are finance, analysis, business, investment, marketing.
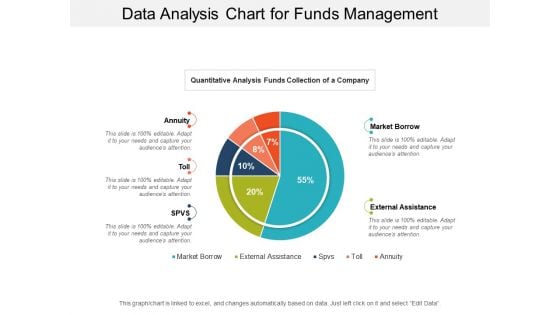
Data Analysis Chart For Funds Management Ppt PowerPoint Presentation Infographic Template Files
This is a data analysis chart for funds management ppt powerpoint presentation infographic template files. This is a five stage process. The stages in this process are financial analysis, quantitative, statistical modelling.
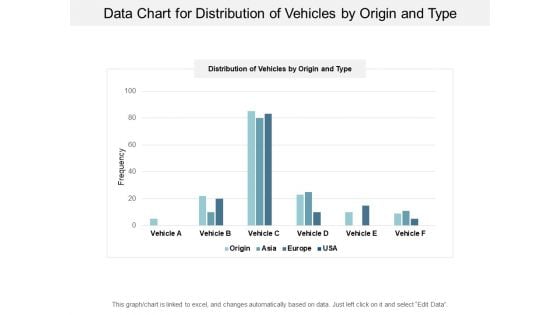
Data Chart For Distribution Of Vehicles By Origin And Type Ppt PowerPoint Presentation Infographics Topics
This is a data chart for distribution of vehicles by origin and type ppt powerpoint presentation infographics topics. This is a four stage process. The stages in this process are financial analysis, quantitative, statistical modelling.
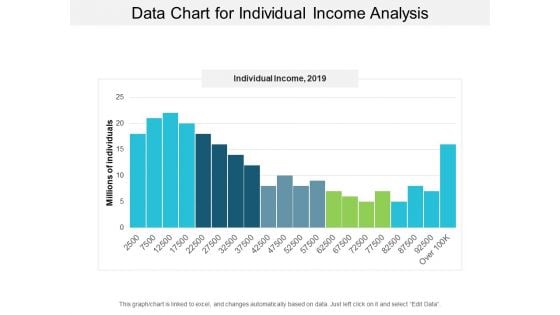
Data Chart For Individual Income Analysis Ppt PowerPoint Presentation Layouts Visual Aids
This is a data chart for individual income analysis ppt powerpoint presentation layouts visual aids. This is a five stage process. The stages in this process are financial analysis, quantitative, statistical modelling.
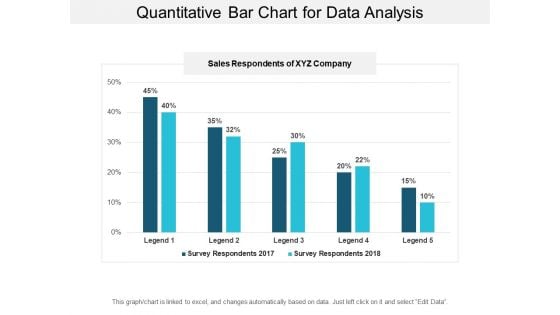
Quantitative Bar Chart For Data Analysis Ppt PowerPoint Presentation Model Graphic Tips
This is a quantitative bar chart for data analysis ppt powerpoint presentation model graphic tips. This is a two stage process. The stages in this process are financial analysis, quantitative, statistical modelling.
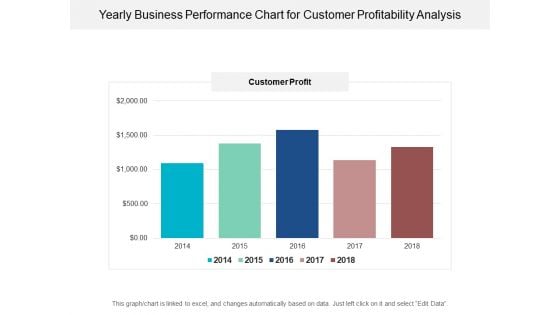
Yearly Business Performance Chart For Customer Profitability Analysis Ppt PowerPoint Presentation Ideas Picture
This is a yearly business performance chart for customer profitability analysis ppt powerpoint presentation ideas picture. This is a five stage process. The stages in this process are financial analysis, quantitative, statistical modelling.
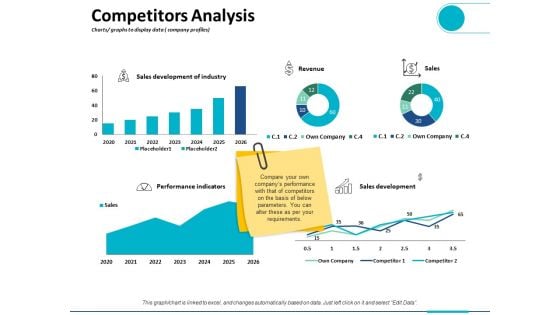
Competitors Analysis Charts Graphs To Display Data Company Profiles Ppt PowerPoint Presentation Outline Visual Aids
This is a competitors analysis charts graphs to display data company profiles ppt powerpoint presentation outline visual aids. This is a five stage process. The stages in this process are finance, analysis, business, investment, marketing.
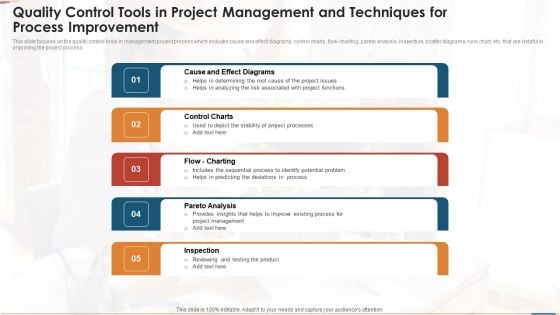
Quality Control Tools In Project Management And Techniques For Process Improvement Guidelines PDF
This slide focuses on the quality control tools in management project process which includes cause and effect diagrams, control charts, flow-charting, pareto analysis, inspection, scatter diagrams, runs chart, etc. that are helpful in improving the project process. Presenting quality control tools in project management and techniques for process improvement guidelines pdf to dispense important information. This template comprises five stages. It also presents valuable insights into the topics including cause and effect diagrams, control charts, flow charting, pareto analysis, inspection. This is a completely customizable PowerPoint theme that can be put to use immediately. So, download it and address the topic impactfully.
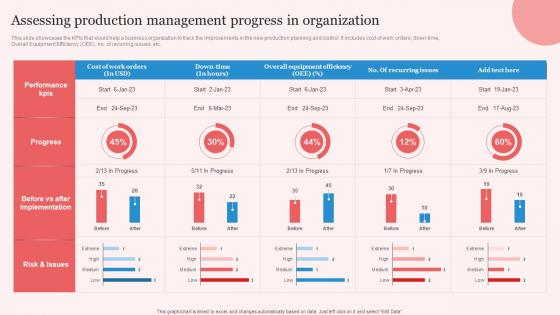
Assessing Production Enhancing Manufacturing Operation Effectiveness Slides Pdf
This slide showcases the KPIs that would help a business organization to track the improvements in the new production planning and control. It includes cost of work orders, down time, Overall Equipment Efficiency OEE, no. of recurring issues, etc. Create an editable Assessing Production Enhancing Manufacturing Operation Effectiveness Slides Pdf that communicates your idea and engages your audience. Whether you are presenting a business or an educational presentation, pre designed presentation templates help save time. Assessing Production Enhancing Manufacturing Operation Effectiveness Slides Pdf is highly customizable and very easy to edit, covering many different styles from creative to business presentations. Slidegeeks has creative team members who have crafted amazing templates. So, go and get them without any delay. This slide showcases the KPIs that would help a business organization to track the improvements in the new production planning and control. It includes cost of work orders, down time, Overall Equipment Efficiency OEE, no. of recurring issues, etc.
Employer Branding Strategy For Competitive Analyzing Employee Engagement Trends Professional Pdf
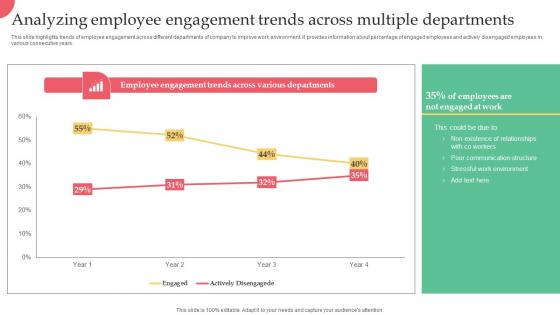
This slide highlights trends of employee engagement across different departments of company to improve work environment. It provides information about percentage of engaged employees and actively disengaged employees in various consecutive years. Create an editable Employer Branding Strategy For Competitive Analyzing Employee Engagement Trends Professional Pdf that communicates your idea and engages your audience. Whether you are presenting a business or an educational presentation, pre-designed presentation templates help save time. Employer Branding Strategy For Competitive Analyzing Employee Engagement Trends Professional Pdf is highly customizable and very easy to edit, covering many different styles from creative to business presentations. Slidegeeks has creative team members who have crafted amazing templates. So, go and get them without any delay. This slide highlights trends of employee engagement across different departments of company to improve work environment. It provides information about percentage of engaged employees and actively disengaged employees in various consecutive years.


 Continue with Email

 Home
Home


