Platform Icon
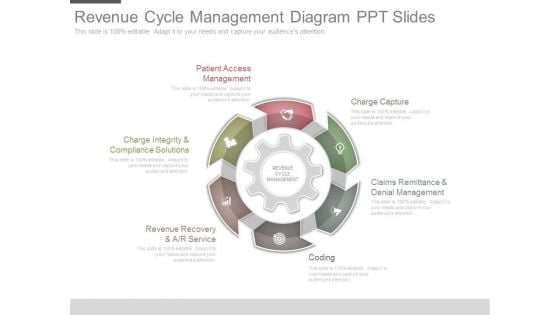
Revenue Cycle Management Diagram Ppt Slides
This is a revenue cycle management diagram ppt slides. This is a six stage process. The stages in this process are charge capture, claims remittance and denial management, coding, revenue recovery and a r service, charge integrity and compliance solutions, patient access management, revenue cycle management.
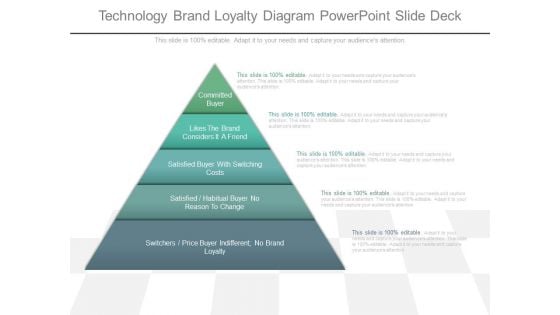
Technology Brand Loyalty Diagram Powerpoint Slide Deck
This is a technology brand loyalty diagram powerpoint slide deck. This is a five stage process. The stages in this process are committed buyer, likes the brand considers it a friend, satisfied buyer with switching costs, satisfied habitual buyer no reason to change, switches price buyer indifferent no brand loyalty.
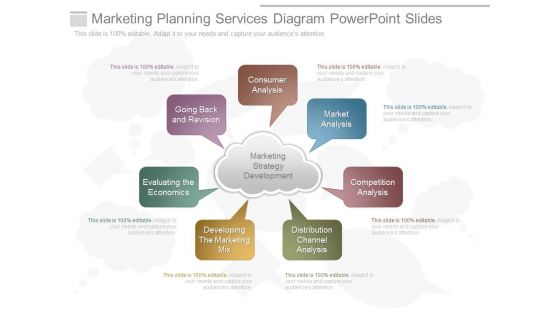
Marketing Planning Services Diagram Powerpoint Slides
This is a marketing planning services diagram powerpoint slides. This is a seven stage process. The stages in this process are marketing strategy development, consumer analysis, market analysis, competition analysis, distribution channel analysis, developing the marketing mix, evaluating the economics, going back and revision.
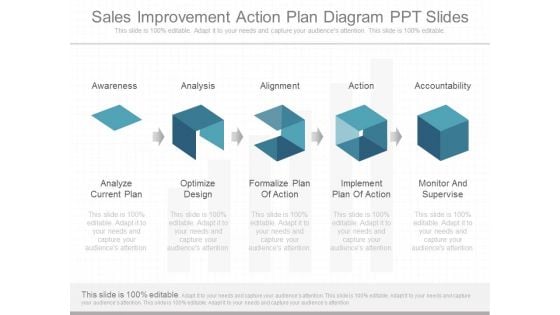
Sales Improvement Action Plan Diagram Ppt Slides
This is a sales improvement action plan diagram ppt slides. This is a five stage process. The stages in this process are awareness, analysis, alignment, action, accountability, analyze current plan, optimize design, formalize plan of action, implement plan of action, monitor and supervise.
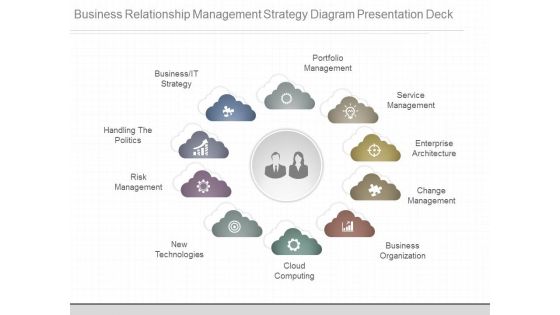
Business Relationship Management Strategy Diagram Presentation Deck
This is a business relationship management strategy diagram presentation deck. This is a ten stage process. The stages in this process are portfolio management, service management, enterprise architecture, change management, business organization, cloud computing, new technologies, risk management, handling the politics, business it strategy.
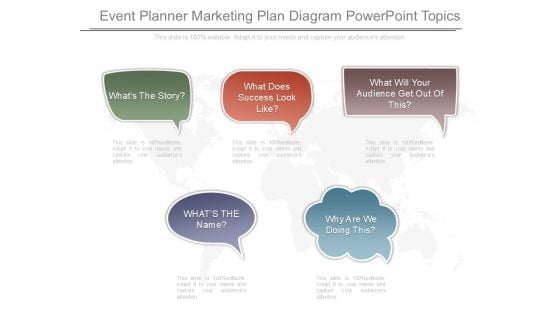
Event Planner Marketing Plan Diagram Powerpoint Topics
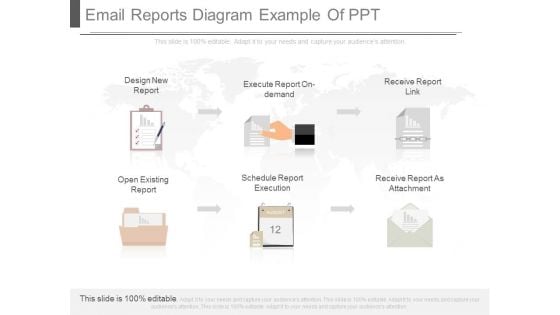
Email Reports Diagram Example Of Ppt
This is a email reports diagram example of ppt. This is a six stage process. The stages in this process are design new report, execute report on demand, receive report link, open existing report, schedule report execution, receive report as attachment.
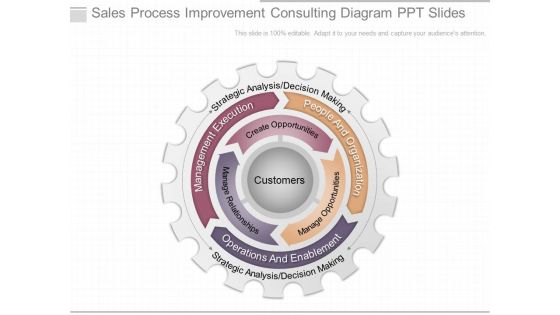
Sales Process Improvement Consulting Diagram Ppt Slides
This is a sales process improvement consulting diagram ppt slides. This is a one stage process. The stages in this process are customers, create opportunities, manage relationships, manage opportunities, people and organization, operations and enablement, management execution, strategic analysis decision making.
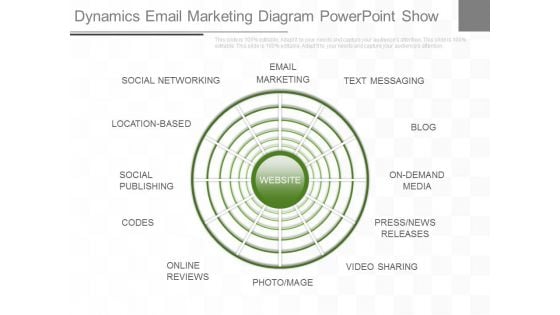
Dynamics Email Marketing Diagram Powerpoint Show
This is a dynamics email marketing diagram powerpoint show. This is a one stage process. The stages in this process are text messaging, blog, on demand media, press news releases, video sharing, photo mage, online reviews, codes, social publishing, location based, social networking, email marketing, website.
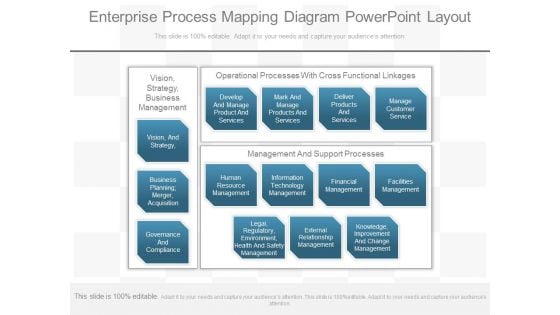
Enterprise Process Mapping Diagram Powerpoint Layout
This is an enterprise process mapping diagram powerpoint layout. This is a one stage process. The stages in this process are develop and manage product and services, human resource management, mark and manage products and services, information technology management, deliver products and services, manage customer service, management, financial.
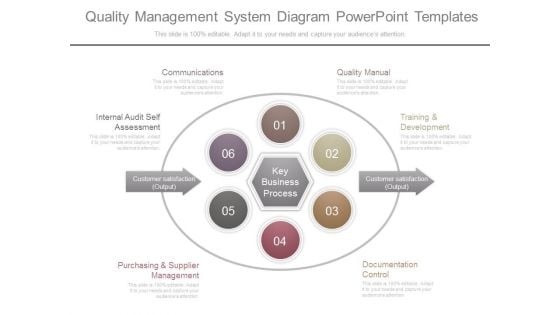
Quality Management System Diagram Powerpoint Templates
This is a quality management system diagram powerpoint templates. This is a nine stage process. The stages in this process are communications, internal audit self assessment, purchasing and supplier management, quality manual, training and development, documentation control, customer satisfaction output, customer satisfaction output, key business process.
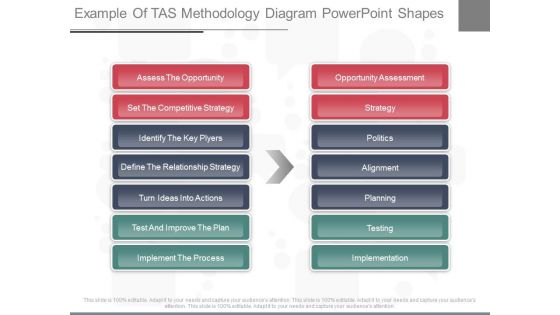
Example Of Tas Methodology Diagram Powerpoint Shapes
This is an example of tas methodology diagram powerpoint shapes. This is a fourteen stage process. The stages in this process are assess the opportunity, set the competitive strategy, identify the key players, define the relationship strategy, turn ideas into actions, test and improve the plan, implement the process, opportunity assessment, strategy, politics, alignment, planning, testing, implementation.
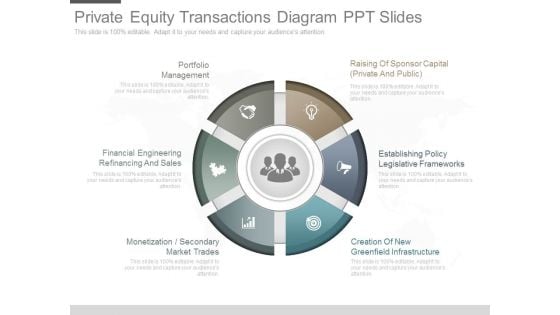
Private Equity Transactions Diagram Ppt Slides
This is a private equity transactions diagram ppt slides. This is a six stage process. The stages in this process are portfolio management, establishing policy legislative frameworks, creation of new greenfield infrastructure, monetization secondary market trades, financial engineering refinancing and sales, raising of sponsor capital.
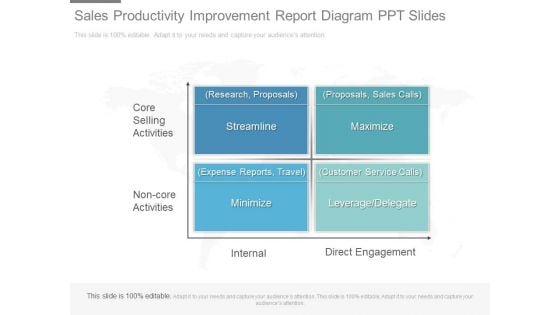
Sales Productivity Improvement Report Diagram Ppt Slides
This is a sales productivity improvement report diagram ppt slides. This is a one stage process. The stages in this process are core selling activities, non core activities, research, proposals, streamline, expense reports, travel, minimize, internal, proposals, sales calls, maximize, customer service calls, leverage delegate, direct engagement.
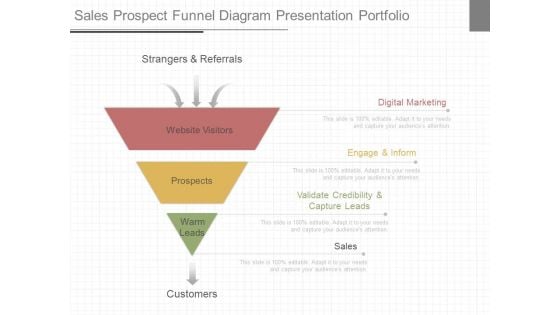
Sales Prospect Funnel Diagram Presentation Portfolio
This is a sales prospect funnel diagram presentation portfolio. This is a nine stage process. The stages in this process are strangers and referrals, website visitors, prospects, warm leads, customers, digital marketing, engage and inform, validate credibility and capture leads, sales.

Computer Aided Facility Management Diagram Model
This is a computer aided facility management diagram model. This is a five stage process. The stages in this process are manage buildings and property portfolios, centralize data, make informed decisions, comply with regulation affecting those assets, manage building operational issues.

Consultative Sales Approach Diagram Ppt Background
This is a consultative sales approach diagram ppt background. This is a five stage process. The stages in this process are set an appointment in person or telephone, understand the prospect, prospect asks to purchase, establish rapport, align product benefits with prospect needs.
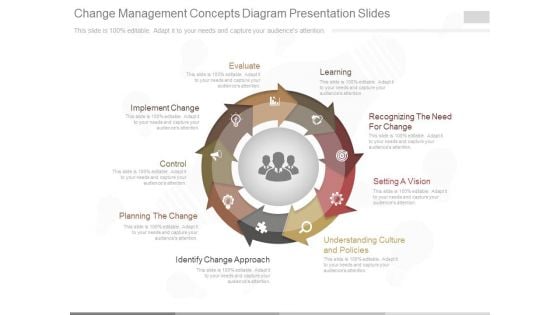
Change Management Concepts Diagram Presentation Slides
This is a change management concepts diagram presentation slides. This is a nine stage process. The stages in this process are implement change, evaluate, learning, recognizing the need for change, setting a vision, understanding culture and policies, identify change approach, planning the change, control.
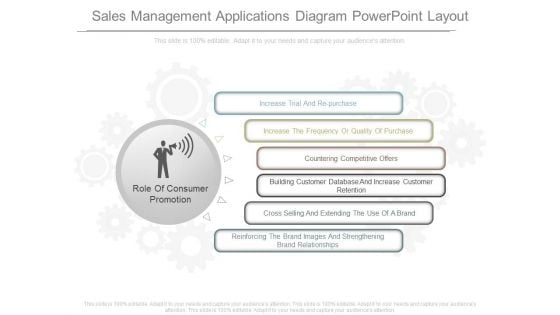
Sales Management Applications Diagram Powerpoint Layout
This is a sales management applications diagram powerpoint layout. This is a six stage process. The stages in this process are increase trial and re purchase, increase the frequency or quality of purchase, countering competitive offers, building customer database and increase customer retention, cross selling and extending the use of a brand, reinforcing the brand images and strengthening brand relationships, role of consumer promotion.
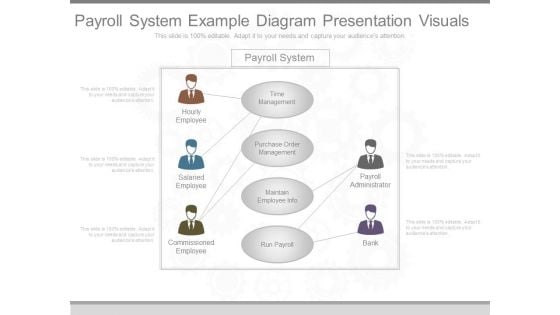
Payroll System Example Diagram Presentation Visuals
This is a payroll system example diagram presentation visuals. This is a five stage process. The stages in this process are payroll system, time management, purchase order management, maintain employee info, run payroll, hourly employee, salaried employee, commissioned employee, payroll administrator, bank.
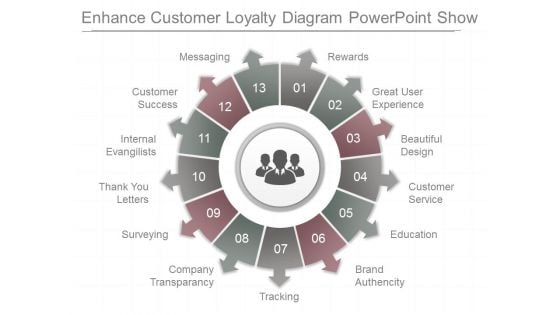
Enhance Customer Loyalty Diagram Powerpoint Show
This is a enhance customer loyalty diagram powerpoint show. This is a thirteen stage process. The stages in this process are rewards, great user experience, beautiful design, customer service, education, brand authencity, tracking, company transparancy, surveying, thank you letters, internal evangilists, customer success, messaging.
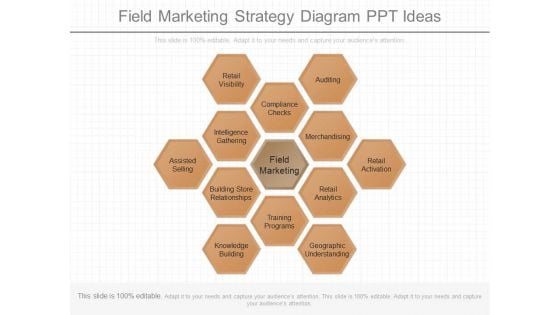
Field Marketing Strategy Diagram Ppt Ideas
This is a field marketing strategy diagram ppt ideas. This is a thirteen stage process. The stages in this process are retail visibility, auditing, compliance checks, intelligence gathering, merchandising, assisted selling, field marketing, retail activation, building store relationships, retail analytics, training programs, knowledge building, geographic understanding.
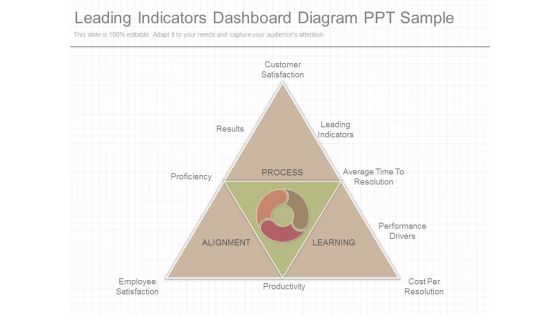
Leading Indicators Dashboard Diagram Ppt Sample
This is a leading indicators dashboard diagram ppt sample. This is a five stage process. The stages in this process are customer satisfaction, leading indicators, average time to resolution, performance drivers, cost per resolution, productivity, employee satisfaction, proficiency, results, process, learning, alignment.
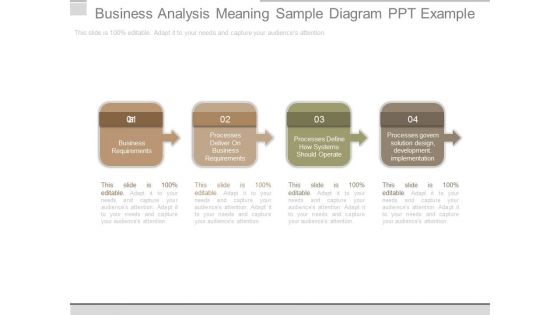
Business Analysis Meaning Sample Diagram Ppt Example
This is a business analysis meaning sample diagram ppt example. This is a four stage process. The stages in this process are business requirements, processes deliver on business requirements, processes define how systems should operate, processes govern solution design, development implementation.
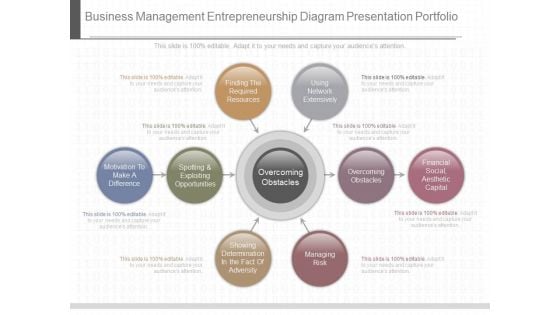
Business Management Entrepreneurship Diagram Presentation Portfolio
This is a business management entrepreneurship diagram presentation portfolio. This is an eight stage process. The stages in this process are overcoming obstacles, financial social, aesthetic capital, showing determination in the fact of adversity, managing risk, motivation to make a difference, spotting and exploiting opportunities, finding the required resources, using network extensively.
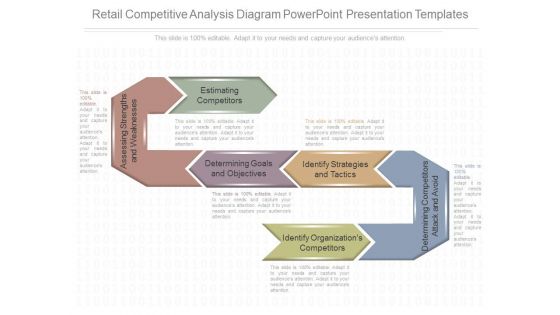
Retail Competitive Analysis Diagram Powerpoint Presentation Templates
This is a retail competitive analysis diagram powerpoint presentation templates. This is a six stage process. The stages in this process are estimating competitors, assessing strengths and weaknesses, determining goals and objectives, identify strategies and tactics, determining competitors attack and avoid, identify organizations competitors.
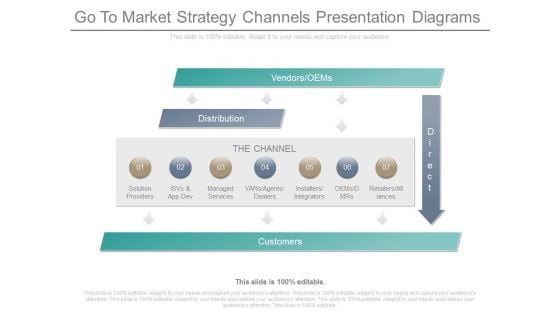
Go To Market Strategy Channels Presentation Diagrams
This is a go to market strategy channels presentation diagrams. This is a seven stage process. The stages in this process are the channels, solution providers, isvs and app dev, managed services, vars agents dealers, installers integrators, oems dmrs, retailers alliances, vendors oems, customers, direct, distribution.
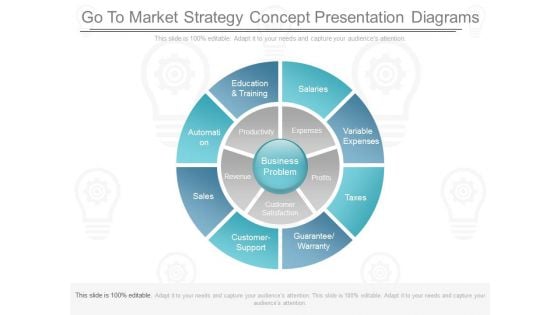
Go To Market Strategy Concept Presentation Diagrams
This is a go to market strategy concept presentation diagrams. This is an eight stage process. The stages in this process are education and training, salaries, variable expenses, automation, taxes, guarantee warranty, customer support, sales, automation, productivity, expenses, profits, customer satisfaction, revenue, business problem.
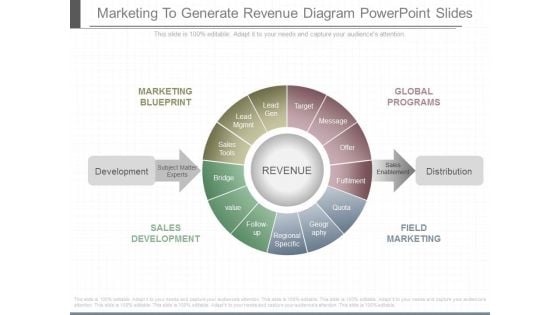
Marketing To Generate Revenue Diagram Powerpoint Slides
This is a marketing to generate revenue diagram powerpoint slides. This is a four stage process. The stages in this process are lead gen, target, message, offer, fulfilment, quota, geography, regional specific, follow up, value, bridge, sales tools, lead mgmnt, global programs, distribution, field marketing, sales development, marketing blueprint, development, subject matter experts, sales enablement, revenue.
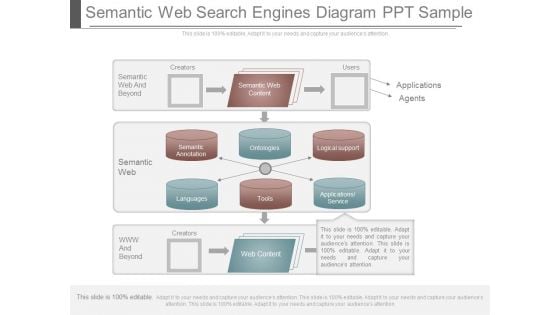
Semantic Web Search Engines Diagram Ppt Sample
This is a semantic web search engines diagram ppt sample. This is a one stage process. The stages in this process are semantic web and beyond, creators, semantic web, semantic annotation, semantic web content, users, ontologies, languages, tools, logical support, applications service, creators, web content, applications, agents.
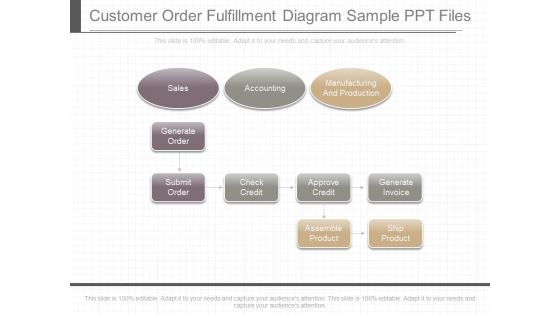
Customer Order Fulfillment Diagram Sample Ppt Files
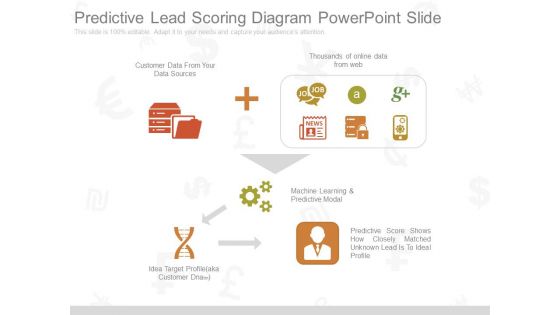
Predictive Lead Scoring Diagram Powerpoint Slide
This is a predictive lead scoring diagram powerpoint slide. This is a one stage process. The stages in this process are thousands of online data from web, customer data from your data sources, machine learning and predictive modal, predictive score shows how closely matched unknown lead is to ideal profile, idea target profile aka customer dnatm.
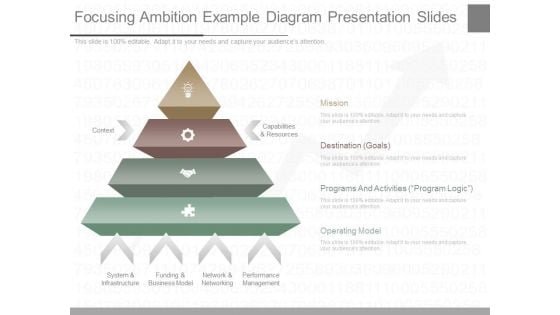
Focusing Ambition Example Diagram Presentation Slides
This is a focusing ambition example diagram presentation slides. This is a four stage process. The stages in this process are context, capabilities and resources, mission, destination goals, programs and activities program logic, operating model, system and infrastructure, funding and business model, network and networking, performance management.\n\n\n\n\n\n
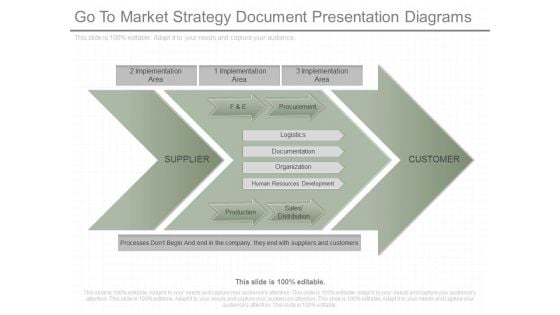
Go To Market Strategy Document Presentation Diagrams
This is a go to market strategy document presentation diagrams. This is a three stage process. The stages in this process are \nimplementation area, supplier, f and e, procurement, logistics, documentation, organization, human resources development, production, sales distribution, customer, processes don?t begin and end in the company they end with suppliers and customers.\n\n\n\n\n\n\n\n\n\n\n\n\n
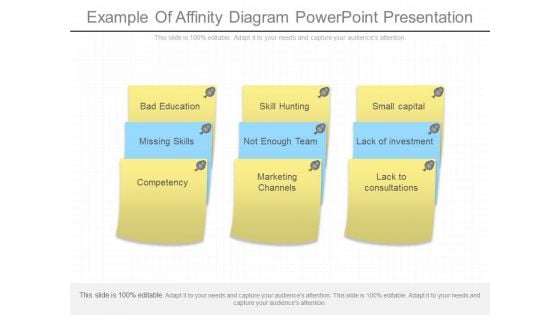
Example Of Affinity Diagram Powerpoint Presentation
This is a example of affinity diagram powerpoint presentation. This is a nine stage process. The stages in this process are bad education, skill hunting, small capital, missing skills, not enough team, lack of investment, competency, marketing channels, lack to consultations.
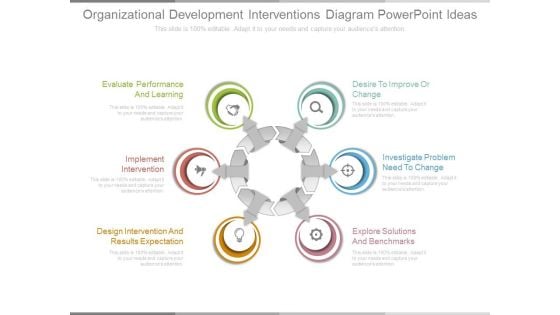
Organizational Development Interventions Diagram Powerpoint Ideas
This is a organizational development interventions diagram powerpoint ideas. This is a six stage process. The stages in this process are evaluate performance and learning, implement intervention, design intervention and results expectation, desire to improve or change, investigate problem need to change, explore solutions and benchmarks.
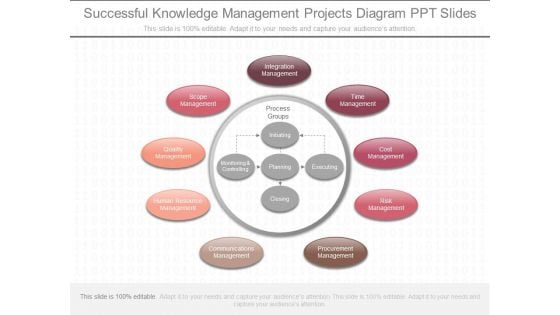
Successful Knowledge Management Projects Diagram Ppt Slides
This is a successful knowledge management projects diagram ppt slides. This is a nine stage process. The stages in this process are integration management, time management, cost management, risk management, procurement management, communications management, human resource management, quality management, scope management, process groups, initiating, monitoring and controlling, planning, closing, executing.
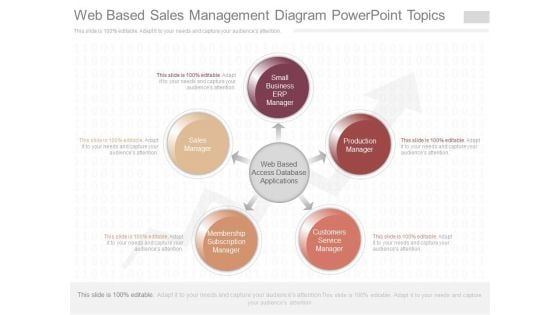
Web Based Sales Management Diagram Powerpoint Topics
This is a web based sales management diagram powerpoint topics. This is a five stage process. The stages in this process are small business erp manager, sales manager, membership subscription manager, customers service manager, production manager, web based access database applications.
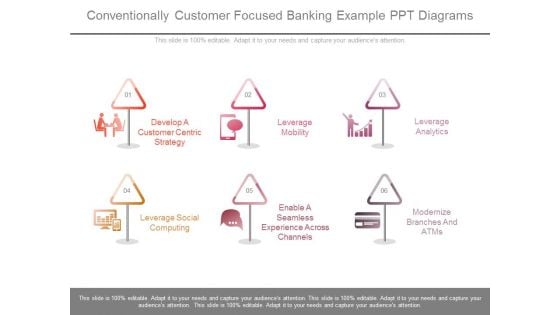
Conventionally Customer Focused Banking Example Ppt Diagrams
This is a conventionally customer focused banking example ppt diagrams. This is a six stage process. The stages in this process are develop a customer centric strategy, leverage mobility, leverage analytics, leverage social computing, enable a seamless experience across channels, modernize branches and atms.
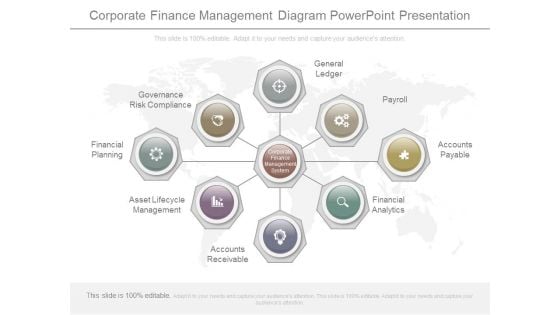
Corporate Finance Management Diagram Powerpoint Presentation
This is a corporate finance management diagram powerpoint presentation. This is a eight stage process. The stages in this process are corporate finance management system, general ledger, payroll, accounts payable, financial analytics, accounts receivable, asset lifecycle management, financial planning, governance risk compliance.
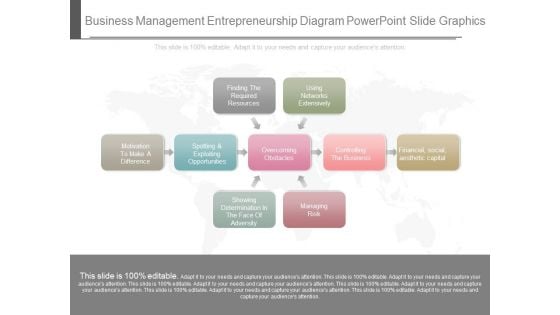
Business Management Entrepreneurship Diagram Powerpoint Slide Graphics
This is a business management entrepreneurship diagram powerpoint slide graphics. This is a nine stage process. The stages in this process are finding the required resources, using networks extensively, motivation to make a difference, spotting and exploiting opportunities, overcoming obstacles, controlling the business, financial, social, aesthetic capital, managing risk, showing determination in the face of adversity.\n\n\n\n
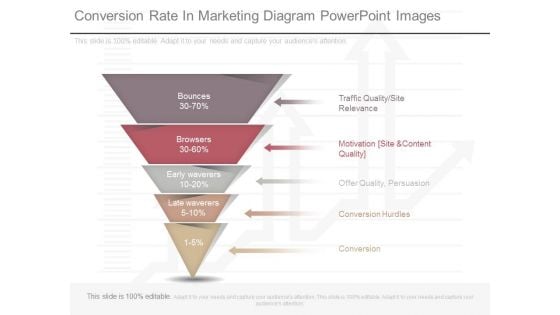
Conversion Rate In Marketing Diagram Powerpoint Images
This is a conversion rate in marketing diagram powerpoint images. This is a five stage process. The stages in this process are traffic quality site relevance, motivation site and content quality, offer quality, persuasion, conversion hurdles, conversion, bounces, browsers, early waverers, late waverers.\n\n\n\n\n\n\n\n\n\n\n\n\n\n\n\n
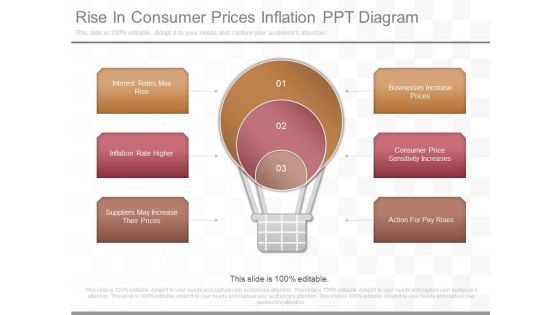
Rise In Consumer Prices Inflation Ppt Diagram
This is a rise in consumer prices inflation ppt diagram. This is a three stage process. The stages in this process are interest rates may rise, inflation rate higher, suppliers may increase their prices, businesses increase prices, consumer price sensitivity increases, action for pay rises.
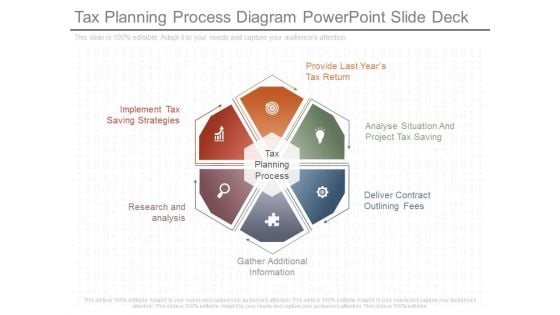
Tax Planning Process Diagram Powerpoint Slide Deck
This is a tax planning process diagram powerpoint slide deck. This is a six stage process. The stages in this process are provide last years tax return, analyse situation and project tax saving, deliver contract outlining fees, gather additional information, research and analysis, implement tax saving strategies, tax planning process.
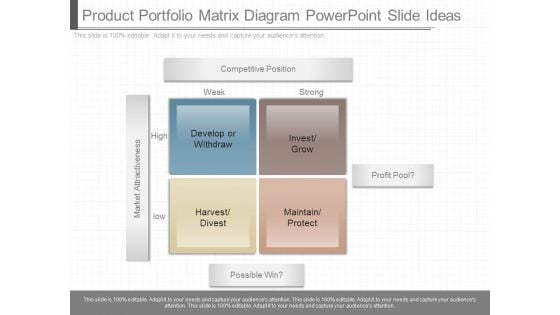
Product Portfolio Matrix Diagram Powerpoint Slide Ideas
This is a product portfolio matrix diagram powerpoint slide ideas. This is a four stage process. The stages in this process are competitive position, weak, strong, develop or withdraw, invest grow, harvest divest, maintain protect, possible win, profit pool, high, low, market attractiveness.
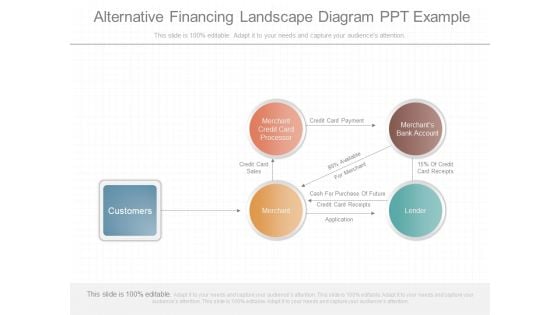
Alternative Financing Landscape Diagram Ppt Example
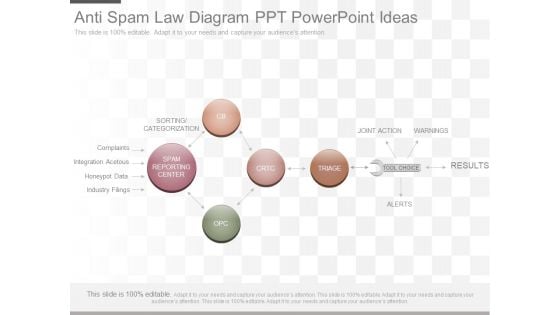
Anti Spam Law Diagram Ppt Powerpoint Ideas
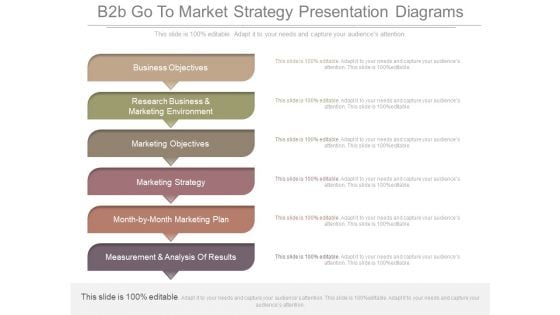
B2b Go To Market Strategy Presentation Diagrams
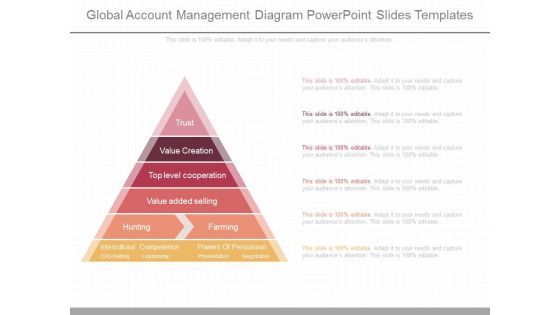
Global Account Management Diagram Powerpoint Slides Templates
This is a global account management diagram powerpoint slides templates. This is a six stage process. The stages in this process are trust, value creation, top level cooperation, value added selling, hunting, farming, intercultural competence, powers of persuasion, cxo selling, leadership, presentation, negotiation.

Business Analysis Levels Sample Diagram Examples Slides
This is a business analysis levels sample diagram examples slides. This is a one stage process. The stages in this process are business analysis, strategic, operational, tactical, vision goal objective, structure polices, i want, you want, we weant, they want, opportunities, problems, application architecture, text, cep, vp marketing, vp proctive, sales manager, project manager, vpit, prodect owner, sme.
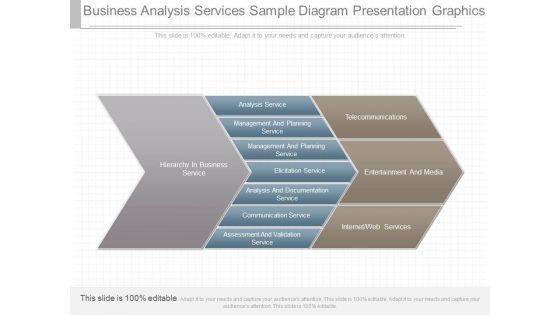
Business Analysis Services Sample Diagram Presentation Graphics
This is a business analysis services sample diagram presentation graphics. This is a three stage process. The stages in this process are hierarchy in business service, analysis service, management and planning service, management and planning service, elicitation service, analysis and documentation service, communication service, assessment and validation service, telecommunications, entertainment and media, internet web services.
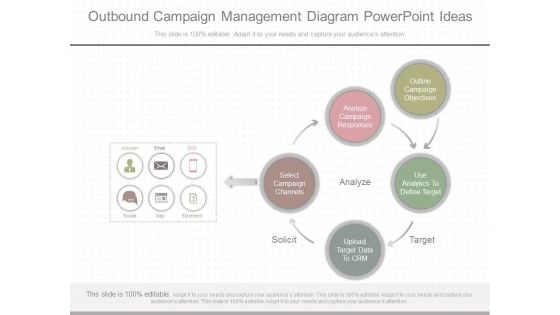
Outbound Campaign Management Diagram Powerpoint Ideas
This is a outbound campaign management diagram powerpoint ideas. This is a five stage process. The stages in this process are solicit , select campaign channels, analyze campaign responses, outline campaign objectives, use analytics to define target, upload target data to crm, analyze, target.
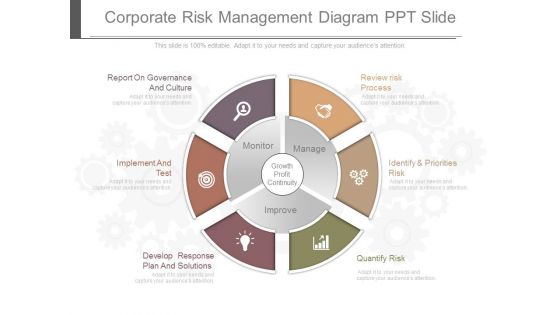
Corporate Risk Management Diagram Ppt Slide
This is a corporate risk management diagram ppt slide. This is a six stage process. The stages in this process are report on governance and culture, implement and test, develop response plan and solutions, quantify risk, identify and priorities risk, review risk process, monitor, manage, improve.
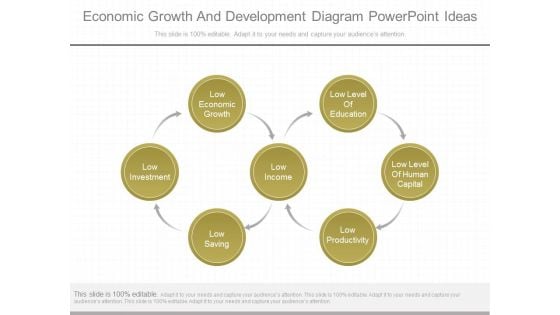
Economic Growth And Development Diagram Powerpoint Ideas
This is a economic growth and development diagram powerpoint ideas. This is a seven stage process. The stages in this process are low level of education, low level of human capital, low productivity, low income, low economic growth, low investment, low saving.
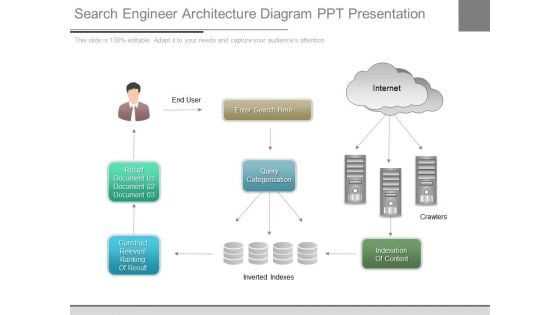
Search Engineer Architecture Diagram Ppt Presentation
This is a search engineer architecture diagram ppt presentation. This is a one stage process. The stages in this process are end user, enter search here, internet, result document, query categorization, construct relevant ranking of result, inverted indexes, indexation of content.
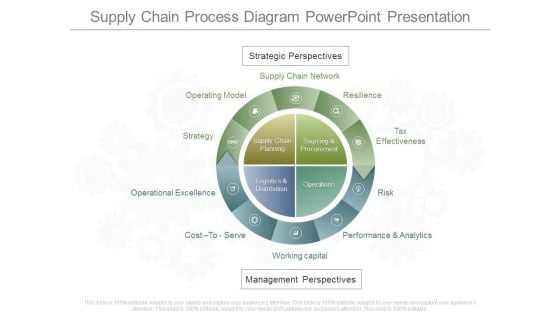
Supply Chain Process Diagram Powerpoint Presentation
This is a supply chain process diagram powerpoint presentation. This is a ten stage process. The stages in this process are strategic perspectives, supply chain network, operating model, resilience, tax effectiveness, operational excellence, cost to serve, working capital, performance and analytics, risk, supply chain planning, sourcing And procurement, logistics and distribution, operations, management perspectives.\n\n\n\n\n\n\n\n\n\n\n\n\n\n
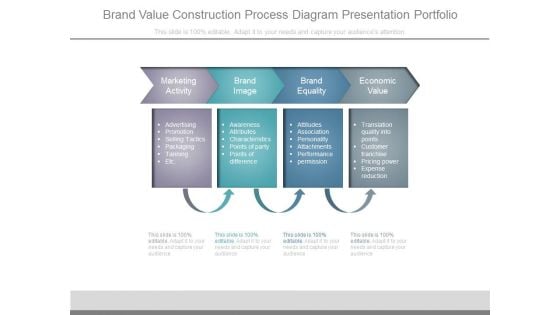
Brand Value Construction Process Diagram Presentation Portfolio
This is a brand value construction process diagram presentation portfolio. This is a four stage process. The stages in this process are marketing activity, brand image, brand equality, economic value, advertising, promotion, selling tactics, packaging, tanning, awareness, attributes, characteristics, points of party, points of difference, attitudes, association, personality, attachments, performance, permission, translation quality into points, customer franchise, pricing power, expense reduction.
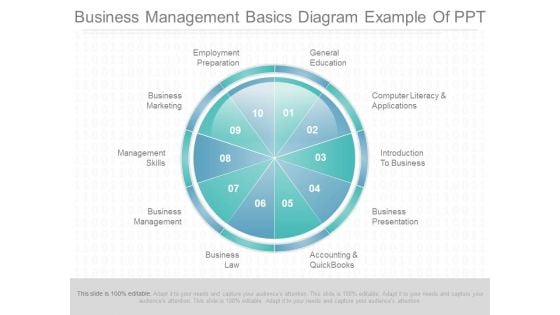
Business Management Basics Diagram Example Of Ppt
This is a business management basics diagram example of ppt. This is a ten stage process. The stages in this process are general education, computer literacy and applications, introduction to business, business presentation, accounting and quickbooks, business law, business management, management skills, business marketing, employment preparation.
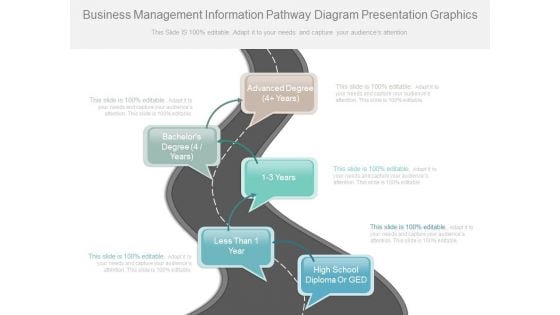
Business Management Information Pathway Diagram Presentation Graphics
This is a business management information pathway diagram presentation graphics. This is a five stage process. The stages in this process are high school diploma or ged, less than 1 year, 1 3 years, bachelor s degree 4 years, advanced degree4 years.

Three Level Business Continuity Diagram Ppt Slides
This is a three level business continuity diagram ppt slides. This is a three stage process. The stages in this process are business continuity planning, security management, disaster recovery, technology, roles, testing, risk management, data assessment, coordination, communicating plan, policy, technology, services, procedures, incident response.


 Continue with Email

 Home
Home


