Platform Icon
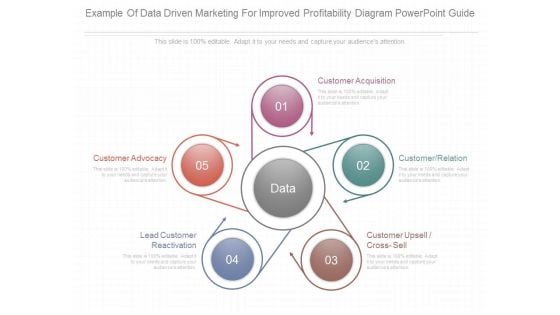
Example Of Data Driven Marketing For Improved Profitability Diagram Powerpoint Guide
This is a example of data driven marketing for improved profitability diagram powerpoint guide. This is a five stage process. The stages in this process are customer acquisition, customer relation, customer upsell cross sell, lead customer reactivation, customer advocacy.
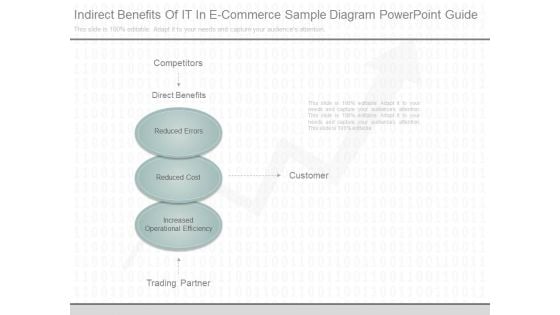
Indirect Benefits Of It In E Commerce Sample Diagram Powerpoint Guide
This is a indirect benefits of it in e commerce sample diagram powerpoint guide. This is a three stage process. The stages in this process are competitors, direct benefits, reduced errors, reduced cost, customer, increased operational efficiency, trading partner.
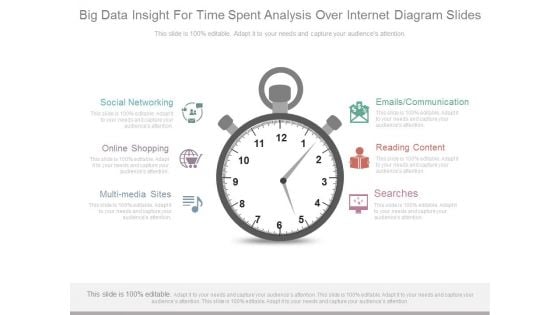
Big Data Insight For Time Spent Analysis Over Internet Diagram Slides
This is a big data insight for time spent analysis over internet diagram slides. This is a one stage process. The stages in this process are social networking, online shopping, multimedia sites, searches, reading content, emails communication.
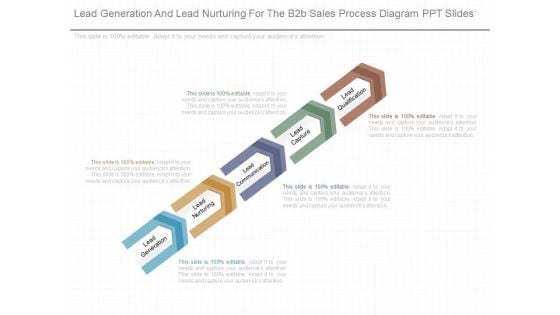
Lead Generation And Lead Nurturing For The B2b Sales Process Diagram Ppt Slides
This is a lead generation and lead nurturing for the b2b sales process diagram ppt slides. This is a five stage process. The stages in this process are lead generation, lead nurturing, lead communication, lead capture, lead qualification.
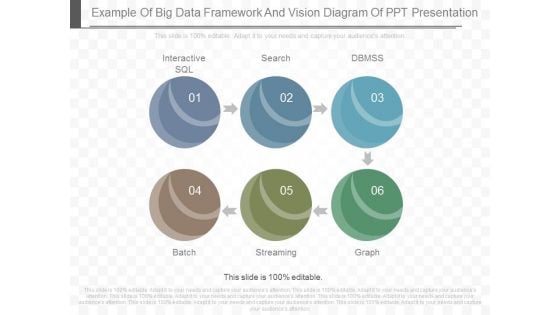
Example Of Big Data Framework And Vision Diagram Of Ppt Presentation
This is a example of big data framework and vision diagram of ppt presentation. This is a six stage process. The stages in this process are interactive sql, search, dbmss, batch, streaming, graph.
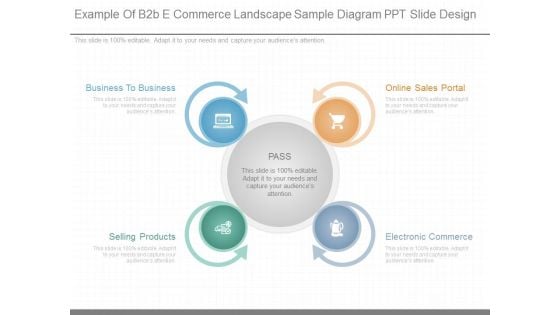
Example Of B2b E Commerce Landscape Sample Diagram Ppt Slide Design
This is a example of b2b e commerce landscape sample diagram ppt slide design. This is a four stage process. The stages in this process are pass, online sales portal, electronic?commerce, selling products, business to business.
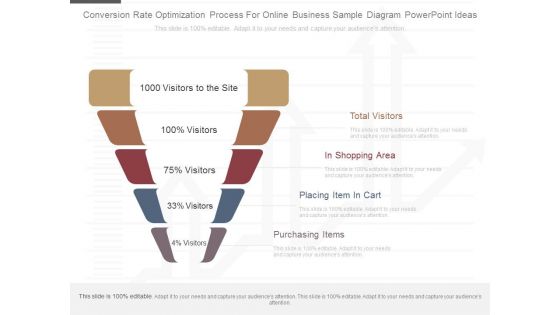
Conversion Rate Optimization Process For Online Business Sample Diagram Powerpoint Ideas
This is a conversion rate optimization process for online business sample diagram powerpoint ideas. This is a five stage process. The stages in this process are total visitors, in shopping area, placing item in cart, purchasing items.
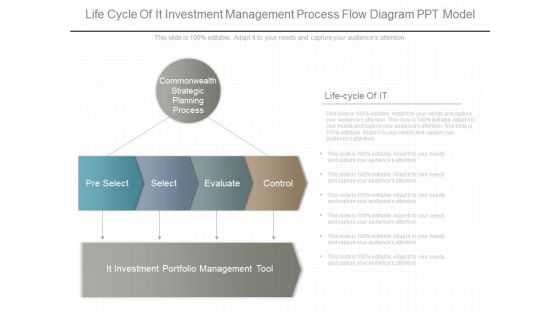
Life Cycle Of It Investment Management Process Flow Diagram Ppt Model
This is a life cycle of it investment management process flow diagram ppt model. This is a three stage process. The stages in this process are commonwealth strategic planning process, pre select, select, evaluate, control, it investment portfolio management tool.
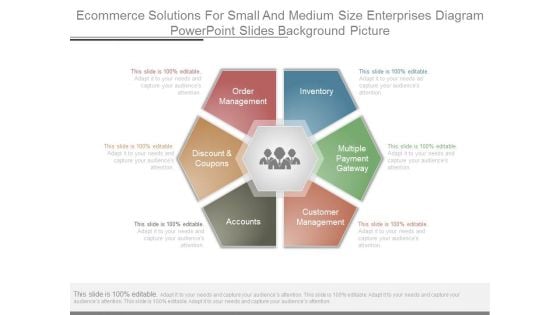
Ecommerce Solutions For Small And Medium Size Enterprises Diagram Powerpoint Slides Background Picture
This is a ecommerce solutions for small and medium size enterprises diagram powerpoint slides background picture. This is a six stage process. The stages in this process are inventory, multiple payment gateway, customer management, accounts, discount and coupons, order management.
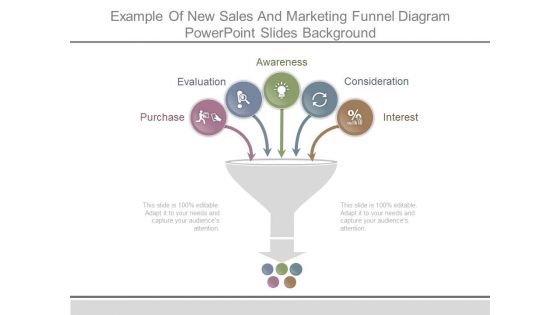
Example Of New Sales And Marketing Funnel Diagram Powerpoint Slides Background
This is a example of new sales and marketing funnel diagram powerpoint slides background. This is a five stage process. The stages in this process are purchase, evaluation, awareness, consideration, interest.
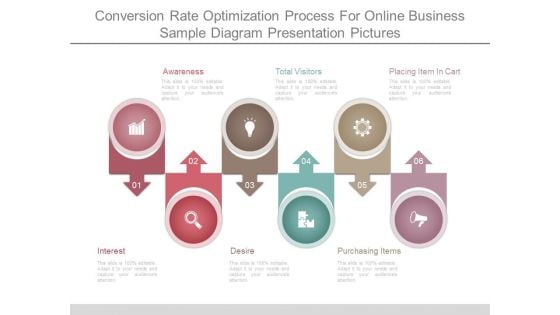
Conversion Rate Optimization Process For Online Business Sample Diagram Presentation Pictures
This is a conversion rate optimization process for online business sample diagram presentation pictures. This is a six stage process. The stages in this process are awareness, total visitors, placing item in cart, interest, desire, purchasing items.

Example Of Zero Level Distribution Process Diagram Powerpoint Slides Presentation Tips
This is a example of zero level distribution process diagram powerpoint slides presentation tips. This is a three stage process. The stages in this process are producer, channel, consumer.

Sample Of Three Types Of Internet Of Things Diagram Ppt Slides
This is a sample of three types of internet of things diagram ppt slides. This is a three stage process. The stages in this process are things with networked sensors, analytic engines, data storage.
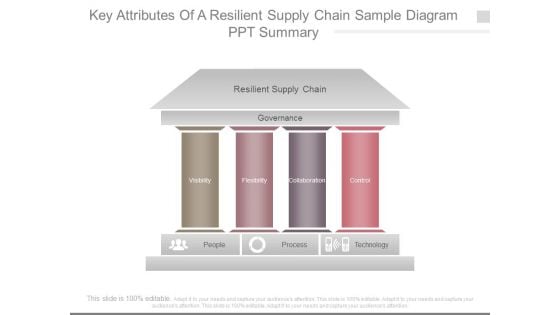
Key Attributes Of A Resilient Supply Chain Sample Diagram Ppt Summary
This is a key attributes of a resilient supply chain sample diagram ppt summary. This is a four stage process. The stages in this process are resilient supply chain, governance, visibility, flexibility, collaboration, control, technology, process, people.
Process Of Conversion Tracking And Attribution Modelling Sample Diagram Powerpoint Ideas
This is a process of conversion tracking and attribution modelling sample diagram powerpoint ideas. This is a four stage process. The stages in this process are display impression, referral, display, desktop.
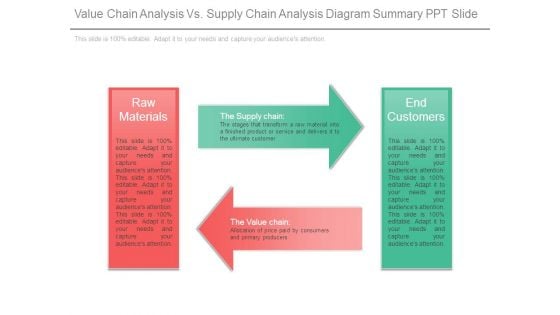
Value Chain Analysis Vs Supply Chain Analysis Diagram Summary Ppt Slide
This is a value chain analysis vs supply chain analysis diagram summary ppt slide. This is a two stage process. The stages in this process are raw materials, the supply chain, end customers, the value chain.
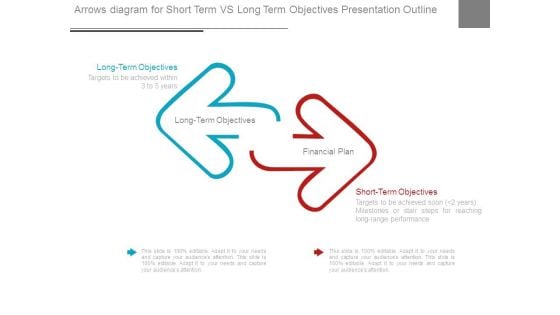
Arrows Diagram For Short Term Vs Long Term Objectives Presentation Outline
This is a arrows diagram for short term vs long term objectives presentation outline. This is a two stage process. The stages in this process are long term objectives, financial plan, short term objectives.
Lego Diagram For Improving Work Life Balance Powerpoint Slide Presentation Guidelines
This is a lego diagram for improving work life balance powerpoint slide presentation guidelines. This is a three stage process. The stages in this process are lego, game, play, children, enjoy.
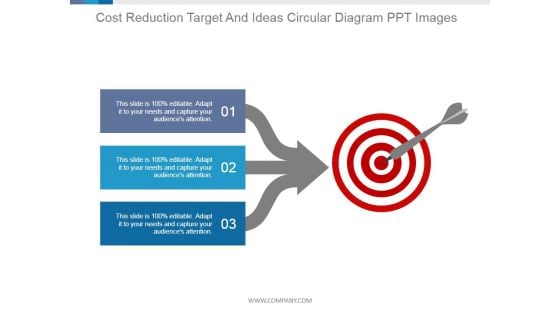
Cost Reduction Target And Ideas Circular Diagram Ppt PowerPoint Presentation Background Image
This is a cost reduction target and ideas circular diagram ppt powerpoint presentation background image. This is a three stage process. The stages in this process are target, achievement, success, arrow, business.
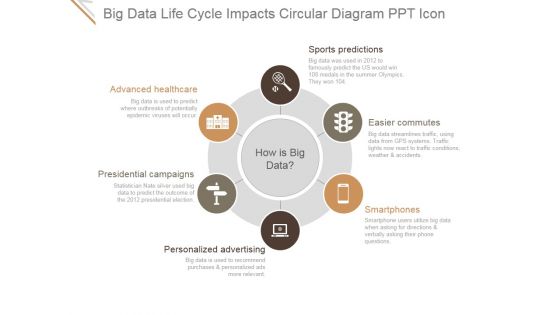
Big Data Life Cycle Impacts Circular Diagram Ppt PowerPoint Presentation Introduction
This is a big data life cycle impacts circular diagram ppt powerpoint presentation introduction. This is a six stage process. The stages in this process are sports predictions, easier commutes, smartphones, personalized advertising, presidential campaigns, advanced healthcare.
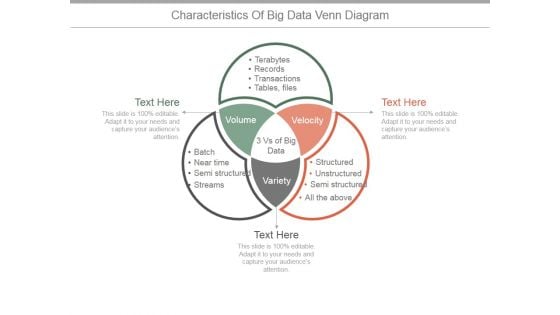
Characteristics Of Big Data Venn Diagram Ppt PowerPoint Presentation Example 2015
This is a characteristics of big data venn diagram ppt powerpoint presentation example 2015. This is a three stage process. The stages in this process are volume, velocity, variety, tables, files, transactions, records, terabytes.
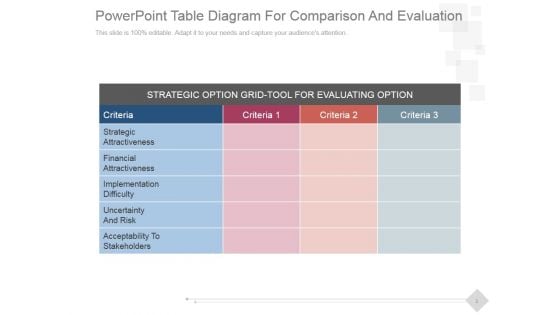
PowerPoint Table Diagram For Comparison And Evaluation Ppt PowerPoint Presentation Microsoft
This is a powerpoint table diagram for comparison and evaluation ppt powerpoint presentation microsoft. This is a three stage process. The stages in this process are financial, attractiveness, strategic, implementation, difficulty.
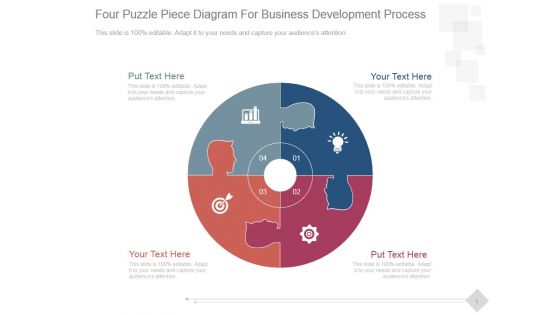
Four Puzzle Piece Diagram For Business Development Process Ppt PowerPoint Presentation Images
This is a four puzzle piece diagram for business development process ppt powerpoint presentation images. This is a four stage process. The stages in this process are business, marketing, success, management, puzzles.
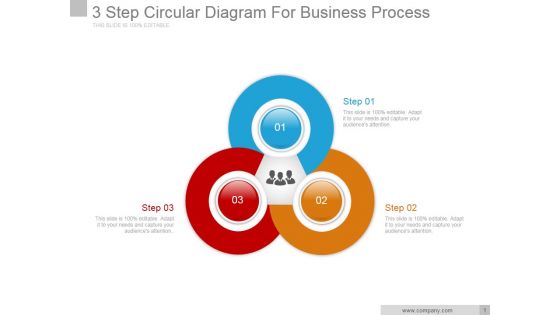
3 Step Circular Diagram For Business Process Ppt PowerPoint Presentation Example
This is a 3 step circular diagram for business process ppt powerpoint presentation example. This is a three stage process. The stages in this process are business, marketing, process, strategy, communication.
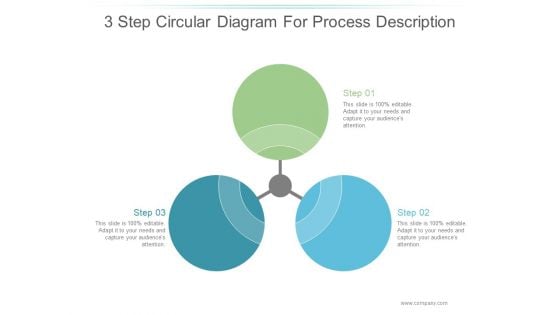
3 Step Circular Diagram For Process Description Ppt PowerPoint Presentation Ideas
This is a 3 step circular diagram for process description ppt powerpoint presentation ideas. This is a three stage process. The stages in this process are business, marketing, process, management, description.
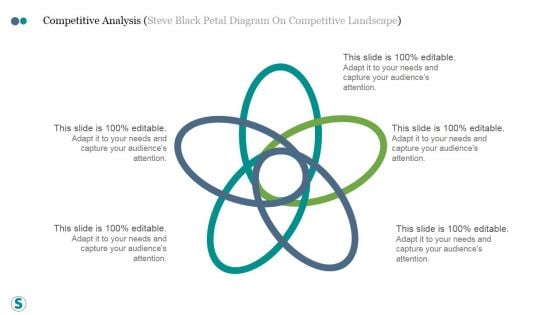
Competitive Analysis Steve Black Petal Diagram On Competitive Landscape Ppt PowerPoint Presentation Visuals
This is a competitive analysis steve black petal diagram on competitive landscape ppt powerpoint presentation visuals. This is a five stage process. The stages in this process are business, strategy, marketing, success, process, analysis.
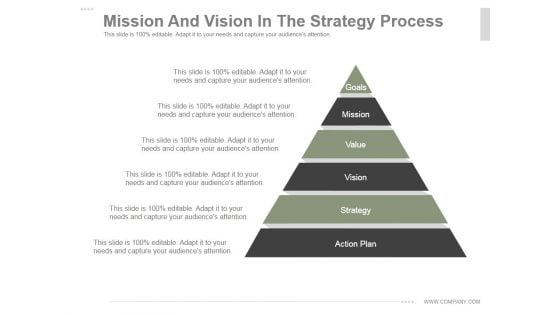
Mission And Vision In The Strategy Process Ppt PowerPoint Presentation Diagrams
This is a mission and vision in the strategy process ppt powerpoint presentation diagrams. This is a six stage process. The stages in this process are goals, mission, value, vision, strategy, action plan.
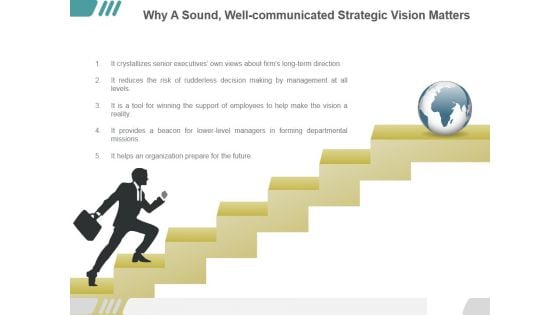
Why A Sound Well Communicated Strategic Vision Matters Ppt PowerPoint Presentation Diagrams
This is a why a sound well communicated strategic vision matters ppt powerpoint presentation diagrams. This is a five stage process. The stages in this process are communication, success, business, marketing, growth.
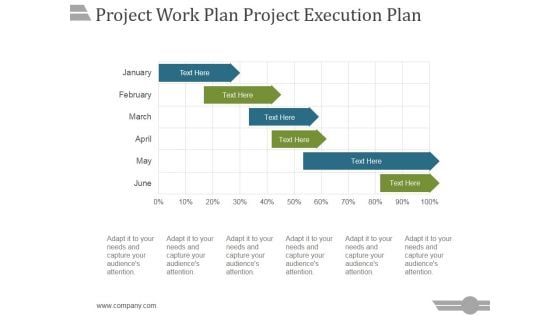
Project Work Plan Project Execution Plan Template 1 Ppt PowerPoint Presentation Diagrams
This is a project work plan project execution plan template 1 ppt powerpoint presentation diagrams. This is a six stage process. The stages in this process are business, strategy, marketing, analysis, success, arrow.
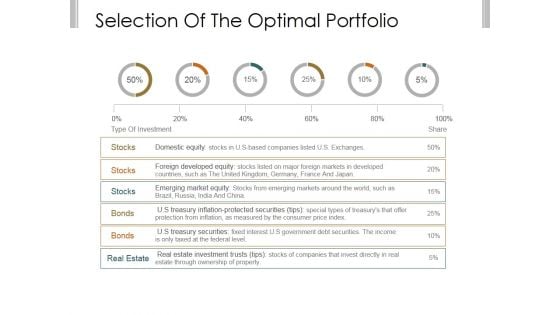
Selection Of The Optimal Portfolio Template 1 Ppt PowerPoint Presentation Diagrams
This is a selection of the optimal portfolio template 1 ppt powerpoint presentation diagrams. This is a six stage process. The stages in this process are domestic equity, foreign developed equity, emerging market equity, treasury securities, real estate investment trusts.
Analysing Results Of Brainstorming Session Affinity Diagrams Ppt PowerPoint Presentation Show
This is a analysing results of brainstorming session affinity diagrams ppt powerpoint presentation show. This is a three stage process. The stages in this process are business, marketing, success, management, process.
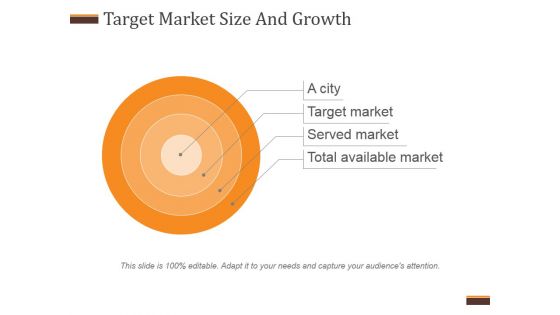
Target Market Size And Growth Template 1 Ppt PowerPoint Presentation Diagrams
This is a target market size and growth template 1 ppt powerpoint presentation diagrams. This is a four stage process. The stages in this process are a city, target market, served market, total available market.
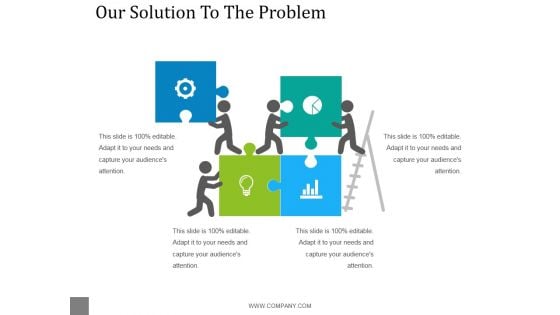
Our Solution To The Problem Template 1 Ppt PowerPoint Presentation Diagrams
This is a our solution to the problem template 1 ppt powerpoint presentation diagrams. This is a four stage process. The stages in this process are business, marketing, management, puzzle, missing, solution.
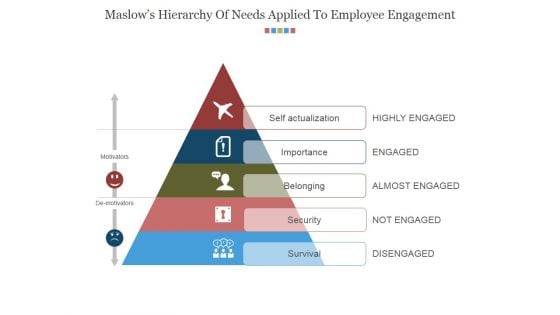
Maslows Hierarchy Of Needs Applied To Employee Engagement Ppt PowerPoint Presentation Diagrams
This is a maslows hierarchy of needs applied to employee engagement ppt powerpoint presentation diagrams. This is a five stage process. The stages in this process are self actualization, importance, belonging, security, survival.
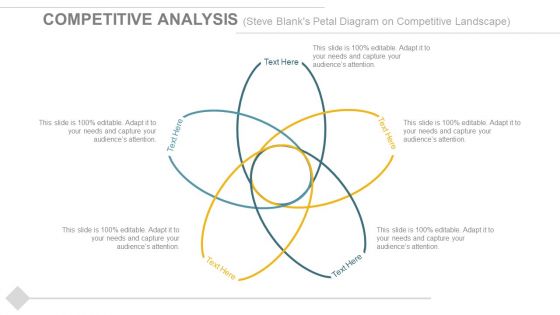
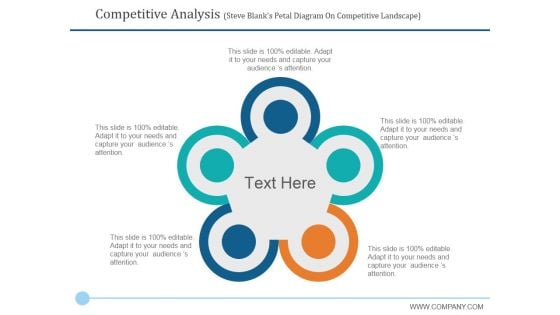
Competitive Analysis Steve Blanks Petal Diagram On Competitive Landscape Ppt PowerPoint Presentation Portfolio Show
This is a competitive analysis steve blanks petal diagram on competitive landscape ppt powerpoint presentation portfolio show. This is a five stage process. The stages in this process are competitive, analysis, business, process, success.
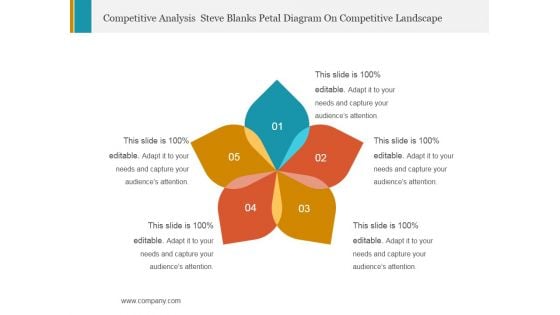
Competitive Analysis Steve Blanks Petal Diagram On Competitive Landscape Ppt PowerPoint Presentation Professional Guide
This is a competitive analysis steve blanks petal diagram on competitive landscape ppt powerpoint presentation professional guide. This is a five stage process. The stages in this process are business, marketing, process, management.
Competitive Analysis Steve Blanks Petal Diagram On Competitive Landscape Ppt PowerPoint Presentation Slides Graphics Pictures
This is a competitive analysis steve blanks petal diagram on competitive landscape ppt powerpoint presentation slides graphics pictures. This is a five stage process. The stages in this process are business, marketing, management.
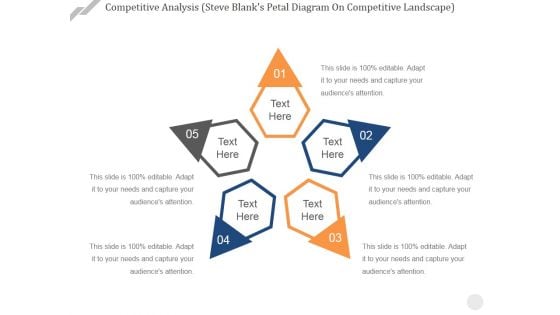
Competitive Analysis Steve Blanks Petal Diagram On Competitive Landscape Ppt PowerPoint Presentation Slides Sample
This is a competitive analysis steve blanks petal diagram on competitive landscape ppt powerpoint presentation slides sample. This is a five stage process. The stages in this process are business, marketing, process, circular, success.
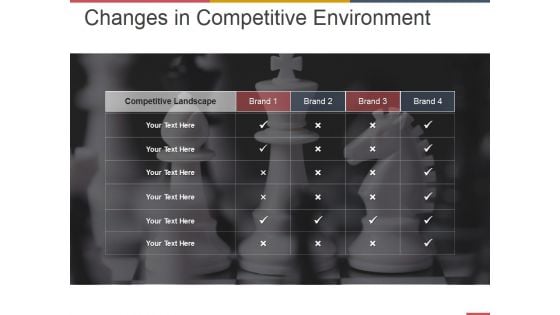
Changes In Competitive Environment Template 1 Ppt PowerPoint Presentation Summary Diagrams
This is a changes in competitive environment template 1 ppt powerpoint presentation summary diagrams. This is a four stage process. The stages in this process are business, strategy, marketing, analysis, competitive landscape.
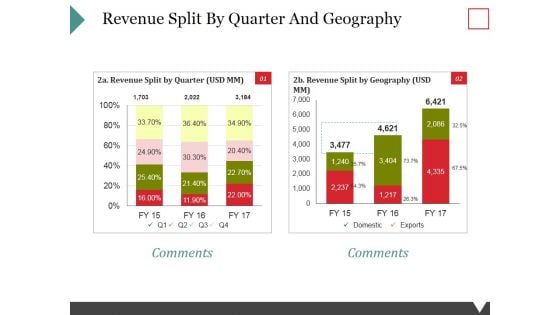
Revenue Split By Quarter And Geography Ppt PowerPoint Presentation Visual Aids Diagrams
This is a revenue split by quarter and geography ppt powerpoint presentation visual aids diagrams. This is a two stage process. The stages in this process are revenue split by quarter, revenue split by geography, domestic, exports.
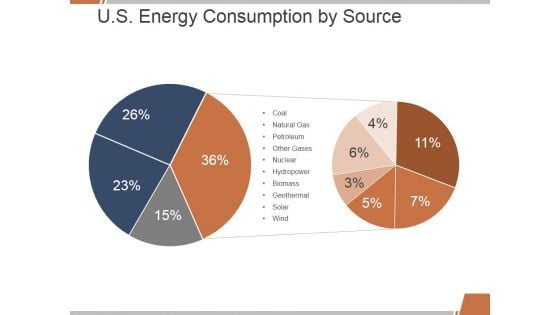
U S Energy Consumption By Source Ppt PowerPoint Presentation Model Diagrams
This is a u s energy consumption by source ppt powerpoint presentation model diagrams. This is a two stage process. The stages in this process are coal, natural gas, petroleum, other gases, nuclear, hydropower.
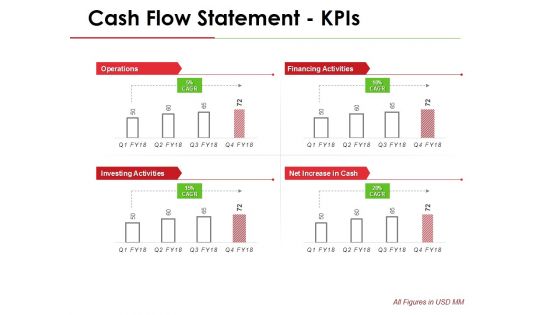
Cash Flow Statement Kpis Template 1 Ppt PowerPoint Presentation Gallery Diagrams
This is a cash flow statement kpis template 1 ppt powerpoint presentation gallery diagrams. This is a four stage process. The stages in this process are operations, financing activities, investing activities, net increase in cash.
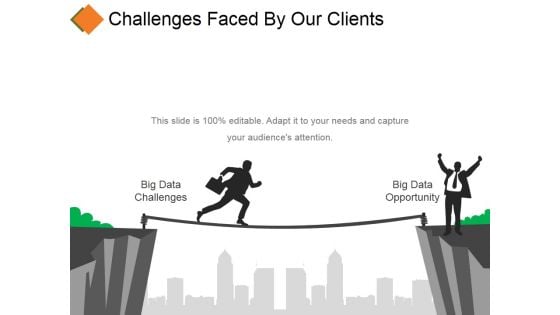
Challenges Faced By Our Clients Template 1 Ppt PowerPoint Presentation Diagrams
This is a challenges faced by our clients template 1 ppt powerpoint presentation diagrams. This is a two stage process. The stages in this process are big data challenges, big data opportunity, threat, communication.
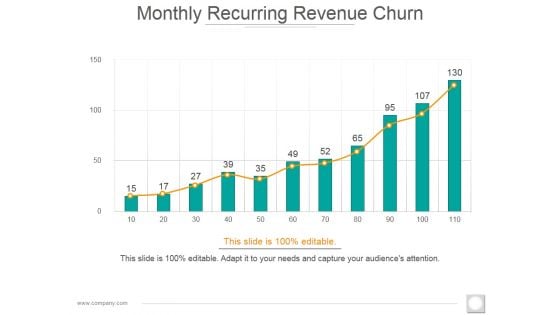
Monthly Recurring Revenue Churn Template 2 Ppt PowerPoint Presentation Diagram Images
This is a monthly recurring revenue churn template 2 ppt powerpoint presentation diagram images. This is a eleven stage process. The stages in this process are bar graph, growth, success, business, marketing.
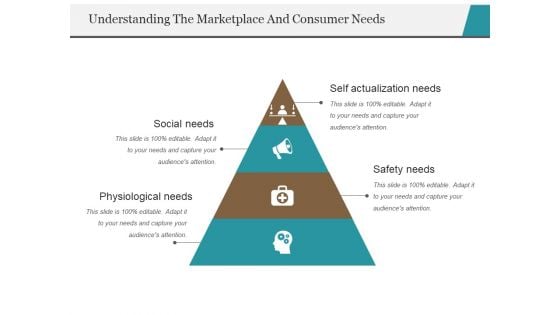
Understanding The Marketplace And Consumer Needs Template 1 Ppt PowerPoint Presentation Portfolio Diagrams
This is a understanding the marketplace and consumer needs template 1 ppt powerpoint presentation portfolio diagrams. This is a four stage process. The stages in this process are social needs, physiological needs, safety needs, self actualization needs.
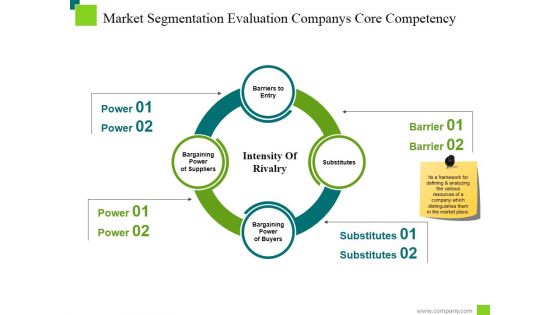
Market Segmentation Evaluation Companys Core Competency Template 1 Ppt PowerPoint Presentation Professional Diagrams
This is a market segmentation evaluation companys core competency template 1 ppt powerpoint presentation professional diagrams. This is a four stage process. The stages in this process are barriers to entry, substitutes, bargaining power of buyers, intensity of rivalry.
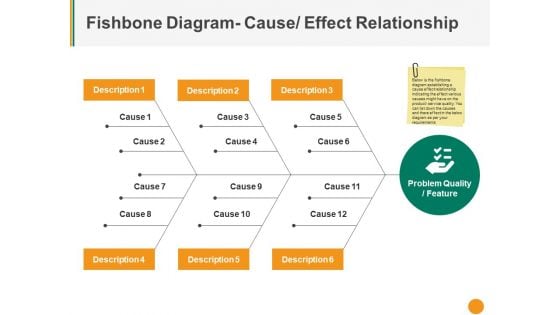
Fishbone Diagram Cause Effect Relationship Ppt PowerPoint Presentation Slides Master Slide
This is a fishbone diagram cause effect relationship ppt powerpoint presentation slides master slide. This is a three stage process. The stages in this process are description, cause, problem quality feature, management, strategy.
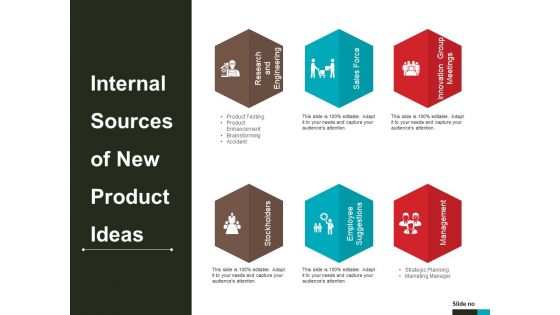
Internal Sources Of New Product Ideas Ppt PowerPoint Presentation File Diagrams
This is a internal sources of new product ideas ppt powerpoint presentation file diagrams. This is a six stage process. The stages in this process are stockholders, employee suggestions, sales force, management, research and engineering.
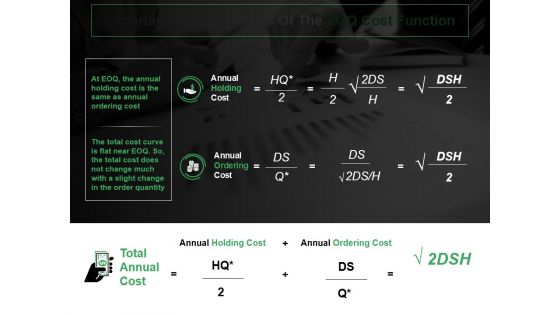
Important Characteristics Of The Eoq Cost Function Ppt PowerPoint Presentation Diagram Images
This is a important characteristics of the eoq cost function ppt powerpoint presentation diagram images. This is a two stage process. The stages in this process are annual holding cos, annual ordering cost, total annual cost.
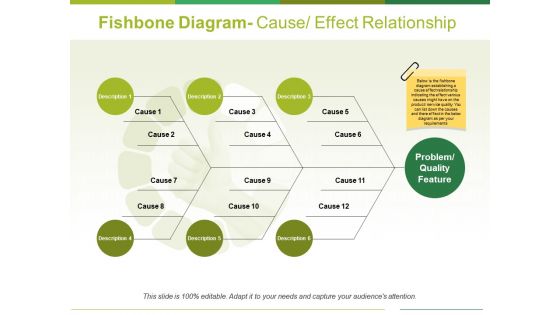
Fishbone Diagram Cause Effect Relationship Ppt PowerPoint Presentation Professional Background Designs
This is a fishbone diagram cause effect relationship ppt powerpoint presentation professional background designs. This is a twelve stage process. The stages in this process are description, cause, problem quality feature.
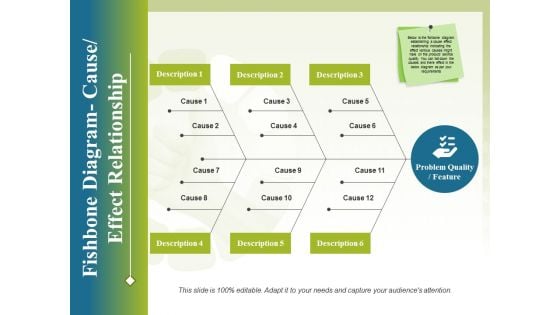
Fishbone Diagram Cause Effect Relationship Ppt PowerPoint Presentation Styles Design Inspiration
This is a fishbone diagram cause effect relationship ppt powerpoint presentation styles design inspiration. This is a three stage process. The stages in this process are business, process, analysis, strategy, management.
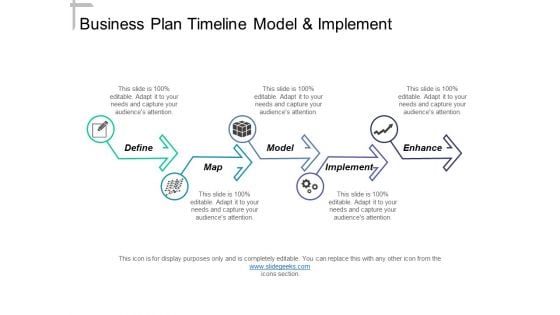
Business Plan Timeline Model And Implement Ppt PowerPoint Presentation Slides Diagrams
This is a business plan timeline model and implement ppt powerpoint presentation slides diagrams. This is a five stage process. The stages in this process are past present future, future state, before after.
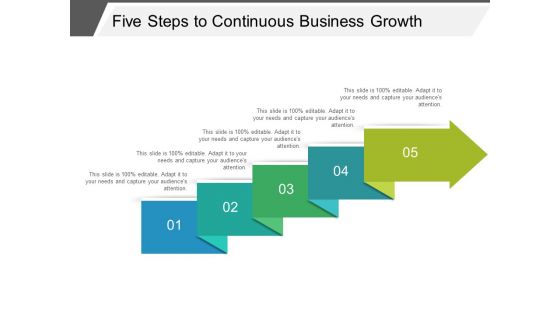
Five Steps To Continuous Business Growth Ppt PowerPoint Presentation Infographic Template Diagrams
This is a five steps to continuous business growth ppt powerpoint presentation infographic template diagrams. This is a five stage process. The stages in this process are circular, continuity, continuum.
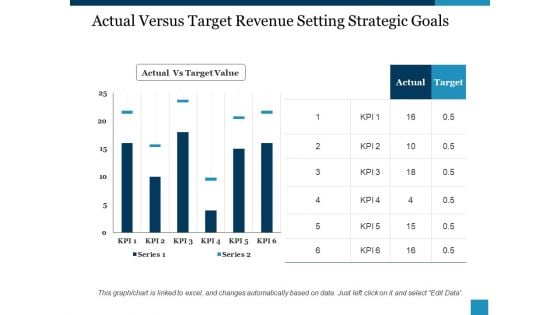
Actual Versus Target Revenue Setting Strategic Goals Ppt PowerPoint Presentation Visual Aids Diagrams
This is a actual versus target revenue setting strategic goals ppt powerpoint presentation visual aids diagrams. This is a six stage process. The stages in this process are actual vs target value, actual, target, kpi, series.
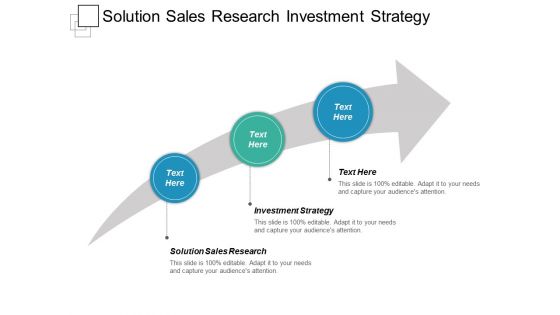
Solution Sales Research Investment Strategy Ppt PowerPoint Presentation Visual Aids Diagrams
This is a solution sales research investment strategy ppt powerpoint presentation visual aids diagrams. This is a three stage process. The stages in this process are solution sales research, investment strategy.
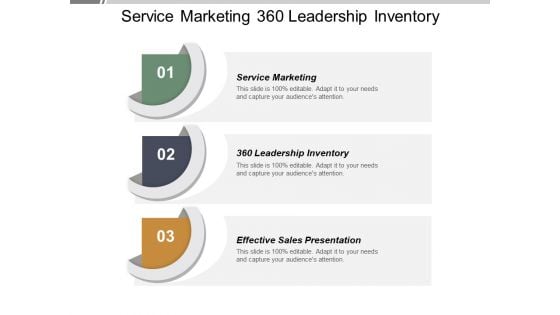
Service Marketing 360 Leadership Inventory Effective Sales Presentation Ppt PowerPoint Presentation Show Diagrams
This is a service marketing 360 leadership inventory effective sales presentation ppt powerpoint presentation show diagrams. This is a three stage process. The stages in this process are service marketing, 360 leadership inventory, effective sales presentation.
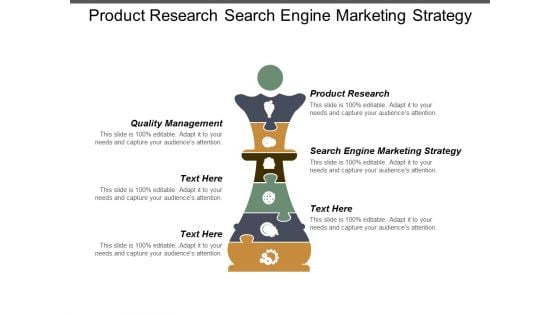
Product Research Search Engine Marketing Strategy Quality Management Ppt PowerPoint Presentation Ideas Diagrams
This is a product research search engine marketing strategy quality management ppt powerpoint presentation ideas diagrams. This is a six stage process. The stages in this process are product research, search engine marketing strategy, quality management.
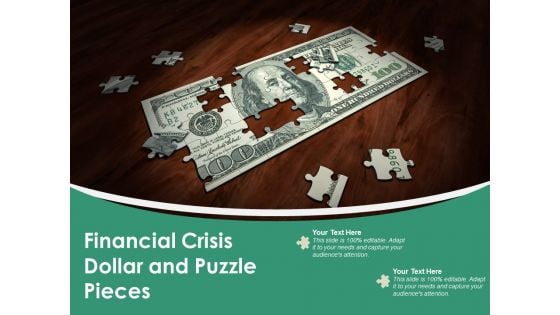
Financial Crisis Dollar And Puzzle Pieces Ppt PowerPoint Presentation Diagram Templates
This is a financial crisis dollar and puzzle pieces ppt powerpoint presentation diagram templates. This is a one stage process. The stages in this process are mutual funds, funds to buy, investment slide.
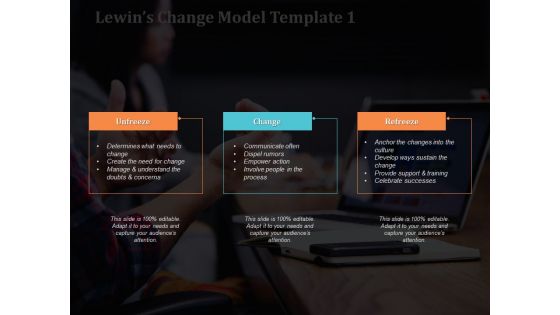
Lewins Change Model Create The Need For Change Ppt PowerPoint Presentation Summary Diagrams
This is a lewins change model create the need for change ppt powerpoint presentation summary diagrams. This is a three stage process. The stages in this process are communicate often, dispel rumors, empower action, involve people in the process.
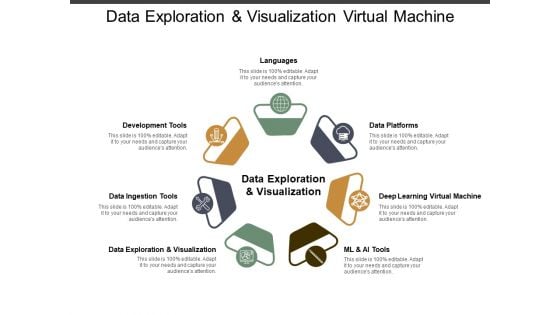
Data Exploration And Visualization Virtual Machine Ppt PowerPoint Presentation Infographics Diagrams
This is a data exploration and visualization virtual machine ppt powerpoint presentation infographics diagrams. This is a seven stage process. The stages in this process are data, analysis, data science, information science.


 Continue with Email

 Home
Home


