Platform Icon
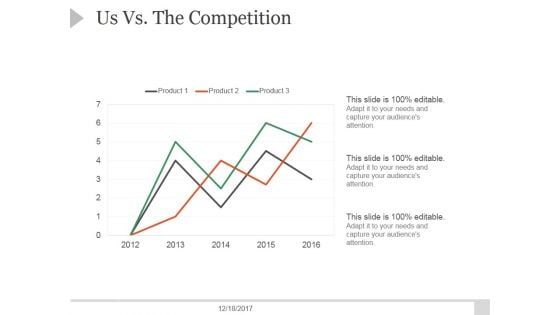
Us Vs The Competition Ppt PowerPoint Presentation Shapes
This is a us vs the competition ppt powerpoint presentation shapes. This is a three stage process. The stages in this process are chart graph, planning, business, marketing, strategy.

Lean Project Management Ppt PowerPoint Presentation Complete Deck With Slides
This is a lean project management ppt powerpoint presentation complete deck with slides. This is a one stage process. The stages in this process are business, strategy, finance, analysis, project management, chart and graph.
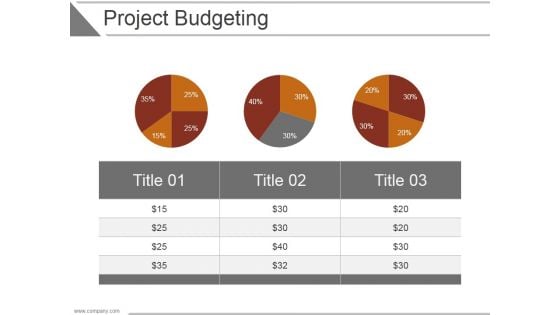
Project Budgeting Ppt PowerPoint Presentation Picture
This is a project budgeting ppt powerpoint presentation picture. This is a three stage process. The stages in this process are business, strategy, analysis, marketing, chart and graph, finance.
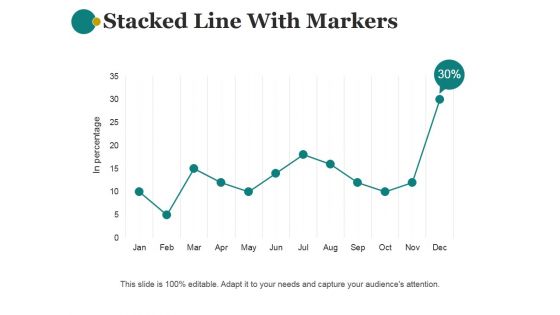
Stacked Line With Markers Template 1 Ppt PowerPoint Presentation Portfolio
This is a stacked line with markers template 1 ppt powerpoint presentation portfolio. This is a one stage process. The stages in this process are chart graph, marketing, planning ,business, management, strategy.
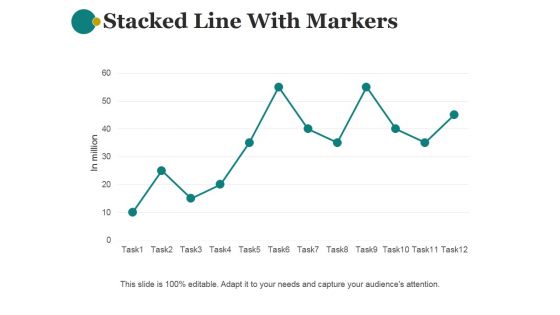
Stacked Line With Markers Template 2 Ppt PowerPoint Presentation Images
This is a stacked line with markers template 2 ppt powerpoint presentation images. This is a one stage process. The stages in this process are chart graph, marketing, planning ,business, management, strategy.
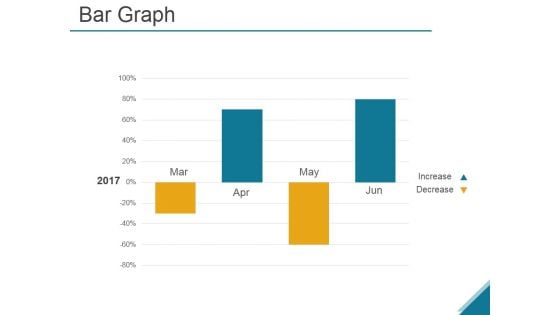
Bar Graph Ppt PowerPoint Presentation Infographic Template Background
This is a bar graph ppt powerpoint presentation infographic template background. This is a four stage process. The stages in this process are business, strategy, analysis, growth, chart and graph.
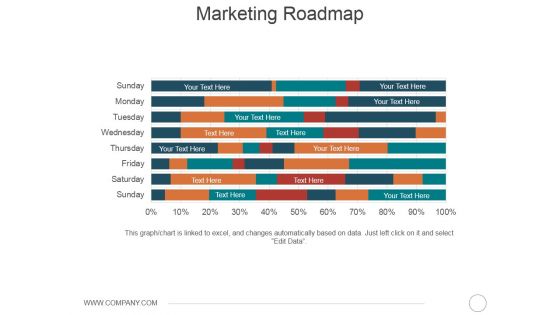
Marketing Roadmap Ppt PowerPoint Presentation Show Graphic Tips
This is a marketing roadmap ppt powerpoint presentation show graphic tips. This is a eight stage process. The stages in this process are business, marketing, strategy, analysis, bar chart.
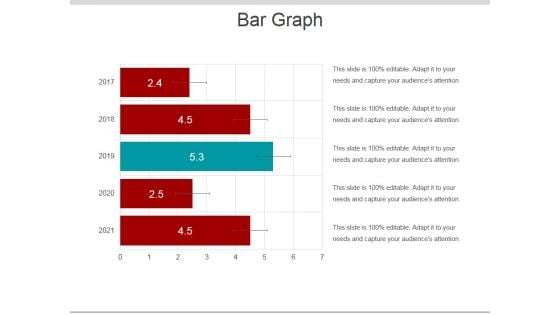
Bar Graph Ppt PowerPoint Presentation Infographic Template Deck
This is a bar graph ppt powerpoint presentation infographic template deck. This is a five stage process. The stages in this process are bar chart, business, marketing, strategy, planning.
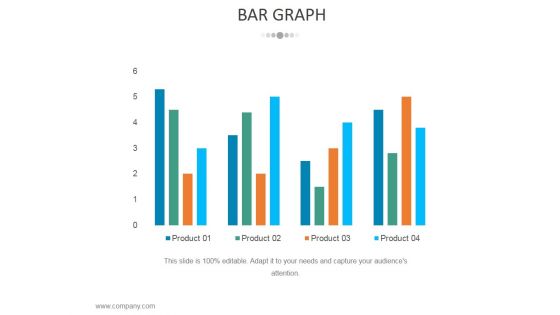
Bar Graph Ppt PowerPoint Presentation Ideas Sample
This is a bar graph ppt powerpoint presentation ideas sample. This is a four stage process. The stages in this process are business, strategy, marketing, analysis, chart and graph, bar graph.
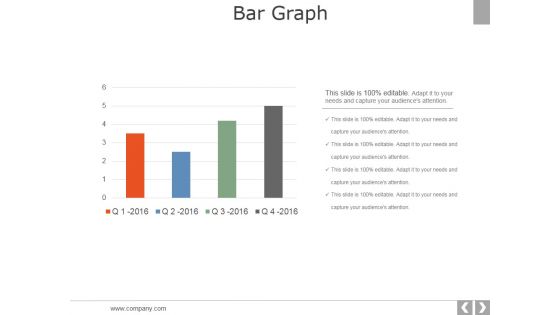
Bar Graph Ppt PowerPoint Presentation Styles Picture
This is a bar graph ppt powerpoint presentation styles picture. This is a four stage process. The stages in this process are business, strategy, marketing, analysis, chart and graph, bar graph.
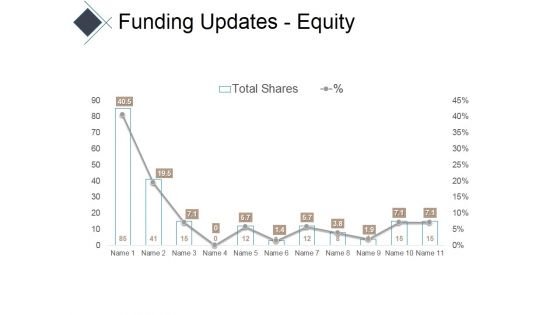
Funding Updates Equity Ppt PowerPoint Presentation Infographic Template Portfolio
This is a funding updates equity ppt powerpoint presentation infographic template portfolio. This is a eleven stage process. The stages in this process are charts, area, marketing, business, success.
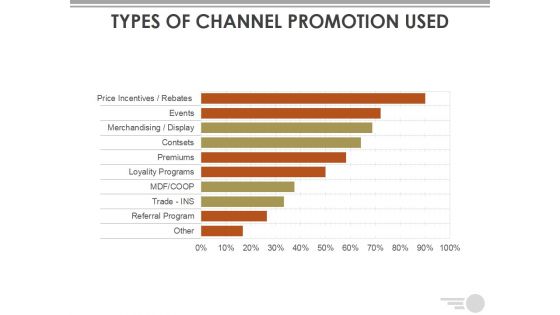
Types Of Channel Promotion Used Ppt PowerPoint Presentation Outline Display
This is a types of channel promotion used ppt powerpoint presentation outline display. This is a ten stage process. The stages in this process are bar graph, business, marketing, strategy, charts.
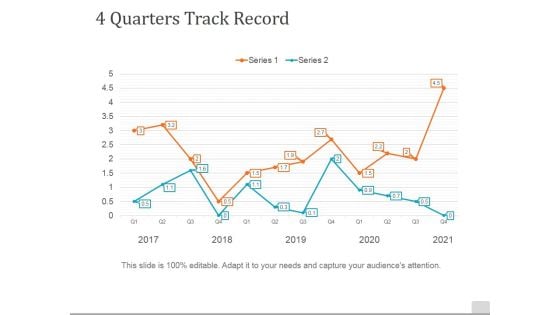
4 Quarters Track Record Template 1 Ppt PowerPoint Presentation Slides Example
This is a 4 quarters track record template 1 ppt powerpoint presentation slides example. This is a two stage process. The stages in this process are management, business, marketing, graph, line chart.
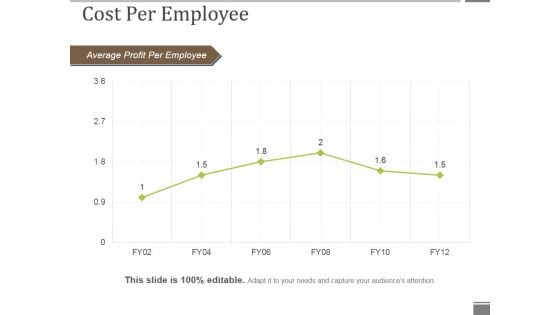
Cost Per Employee Ppt PowerPoint Presentation Model Graphics Download
This is a cost per employee ppt powerpoint presentation model graphics download. This is a six stage process. The stages in this process are average profit per employee, line chart, business, marketing, management.
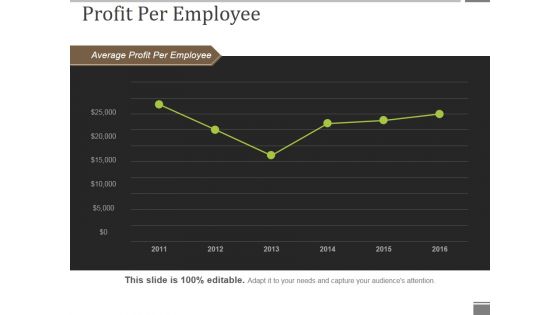
Profit Per Employee Ppt PowerPoint Presentation Show Portfolio
This is a profit per employee ppt powerpoint presentation show portfolio. This is a six stage process. The stages in this process are average profit per employee, line chart, business, marketing, success.
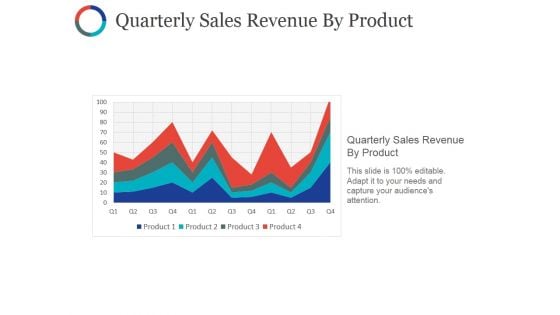
Quarterly Sales Revenue By Product Ppt PowerPoint Presentation Styles Slides
This is a quarterly sales revenue by product ppt powerpoint presentation styles slides. This is a four stage process. The stages in this process are quarterly sales revenue by product, charts, sales, business, success.
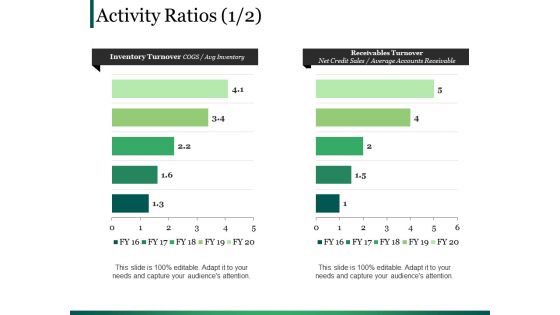
Activity Ratios Template 1 Ppt PowerPoint Presentation Portfolio Graphics
This is a activity ratios template 1 ppt powerpoint presentation portfolio graphics. This is a two stage process. The stages in this process are finance, chart graph, marketing, planning, analysis.
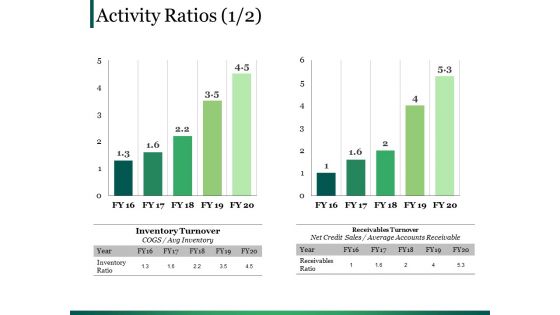
Activity Ratios Template 4 Ppt PowerPoint Presentation Portfolio Backgrounds
This is a activity ratios template 4 ppt powerpoint presentation portfolio backgrounds. This is a two stage process. The stages in this process are finance, chart graph, marketing, planning, analysis.
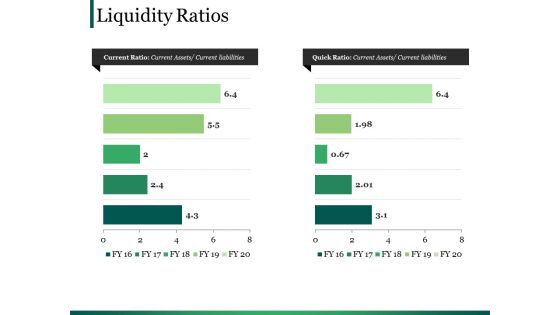
Liquidity Ratios Template Ppt PowerPoint Presentation Outline Elements
This is a liquidity ratios template ppt powerpoint presentation outline elements. This is a two stage process. The stages in this process are finance, chart graph, marketing, planning, analysis.
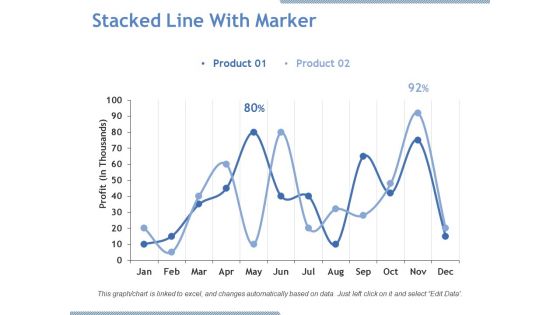
Stacked Line With Marker Ppt PowerPoint Presentation Pictures Graphics Download
This is a stacked line with marker ppt powerpoint presentation pictures graphics download. This is a two stage process. The stages in this process are product, profit, line chart, business, growth.
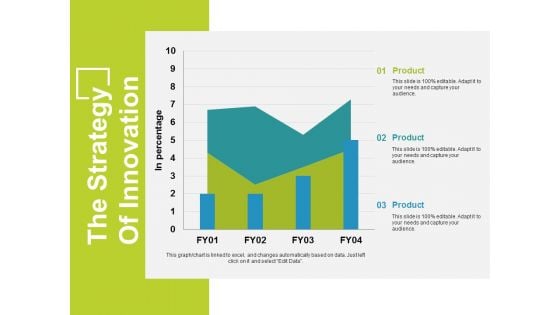
The Strategy Of Innovation Template 2 Ppt PowerPoint Presentation Professional Graphic Images
This is a the strategy of innovation template 2 ppt powerpoint presentation professional graphic images. This is a three stage process. The stages in this process are business, area chart, finance, marketing, strategy.
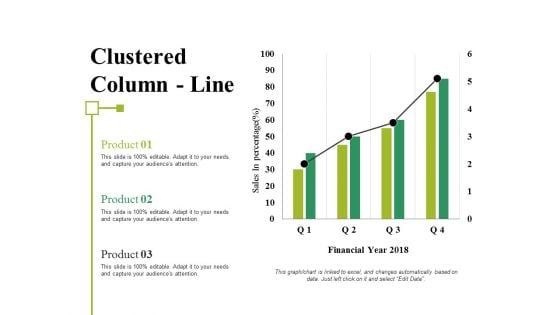
Clustered Column Line Ppt PowerPoint Presentation Inspiration Visual Aids
This is a clustered column line ppt powerpoint presentation inspiration visual aids. This is a four stage process. The stages in this process are business, marketing, strategy, planning, bar chart.
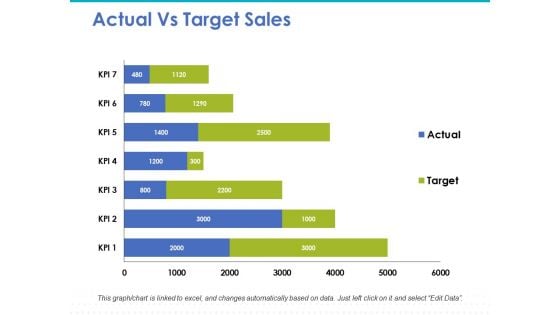
Actual Vs Target Sales Ppt PowerPoint Presentation Slides Template
This is a actual vs target sales ppt powerpoint presentation slides template. This is a seven stage process. The stages in this process are bar chart, marketing, strategy, finance, planning.
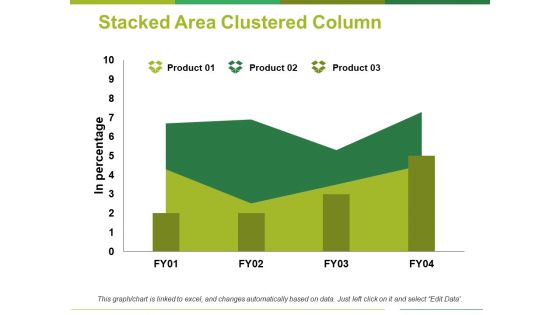
Stacked Area Clustered Column Ppt PowerPoint Presentation Professional Clipart
This is a stacked area clustered column ppt powerpoint presentation professional clipart. This is a three stage process. The stages in this process are product, in percentage, area chart.
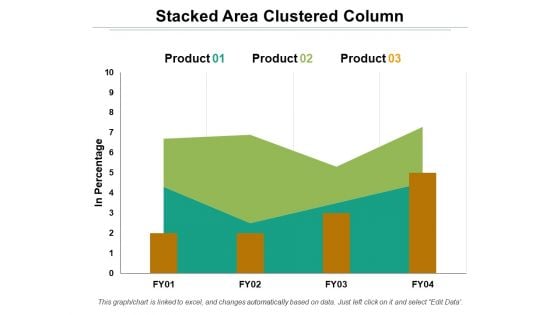
Stacked Area Clustered Column Ppt PowerPoint Presentation Layouts Templates
This is a stacked area clustered column ppt powerpoint presentation layouts templates. This is a three stage process. The stages in this process are product, in percentage, area chart.
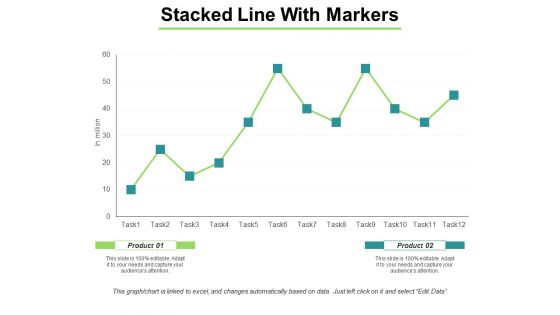
Stacked Line With Markers Ppt PowerPoint Presentation Pictures Background Designs
This is a stacked line with markers ppt powerpoint presentation pictures background designs. This is a two stage process. The stages in this process are line chart, marketing, strategy, planning, finance.
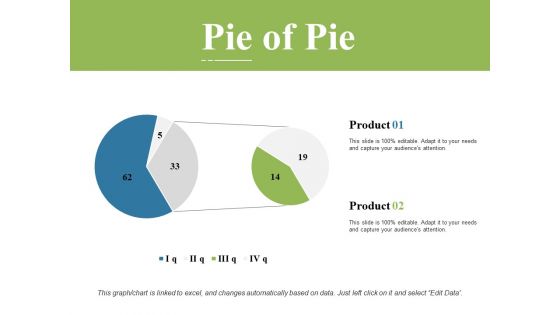
Pie Of Pie Ppt PowerPoint Presentation Styles Graphics Template
This is a pie of pie ppt powerpoint presentation styles graphics template. This is a two stage process. The stages in this process are Pie chart, finance, marketing, management, investment.
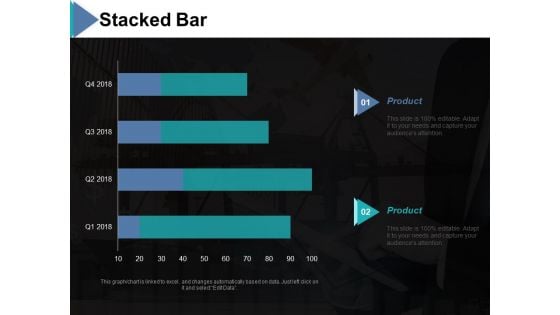
Stacked Bar Ppt PowerPoint Presentation Model Graphics
This is a stacked bar ppt powerpoint presentation model graphics. This is a two stage process. The stages in this process are stacked bar, product, chart and graph, finance, business.
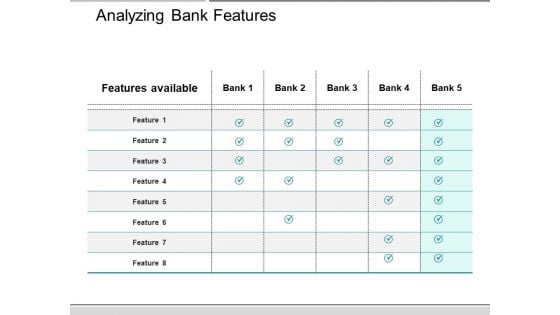
Analyzing Bank Features Ppt PowerPoint Presentation Professional Background
This is a analyzing bank features ppt powerpoint presentation professional background. This is a six stage process. The stages in this process are comparison chart, comparison table, comparison matrix.
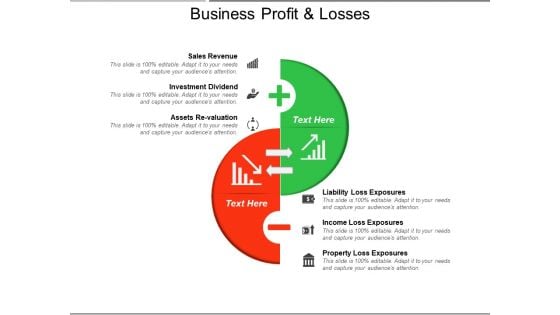
Business Profit And Losses Ppt PowerPoint Presentation Summary Outline
This is a business profit and losses ppt powerpoint presentation summary outline. This is a two stage process. The stages in this process are comparison chart, comparison table, comparison matrix.
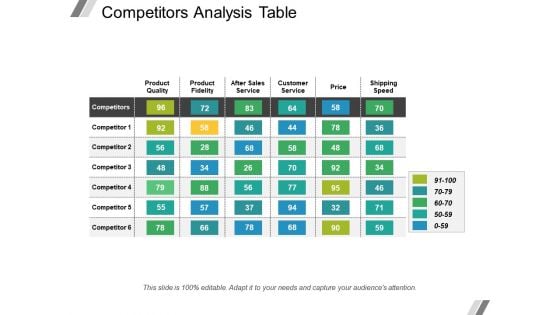
Competitors Analysis Table Ppt PowerPoint Presentation Layouts Example Introduction
This is a competitors analysis table ppt powerpoint presentation layouts example introduction. This is a seven stage process. The stages in this process are comparison chart, comparison table, comparison matrix.
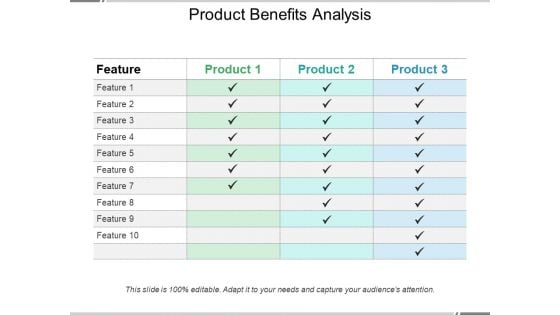
Product Benefits Analysis Ppt PowerPoint Presentation Summary Background
This is a product benefits analysis ppt powerpoint presentation summary background. This is a four stage process. The stages in this process are comparison chart, comparison table, comparison matrix.
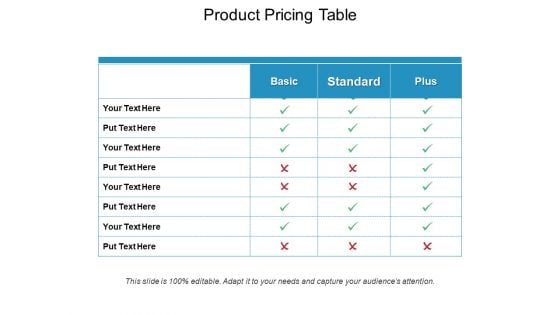
Product Pricing Table Ppt PowerPoint Presentation File Deck
This is a product pricing table ppt powerpoint presentation file deck. This is a four stage process. The stages in this process are comparison chart, comparison table, comparison matrix.
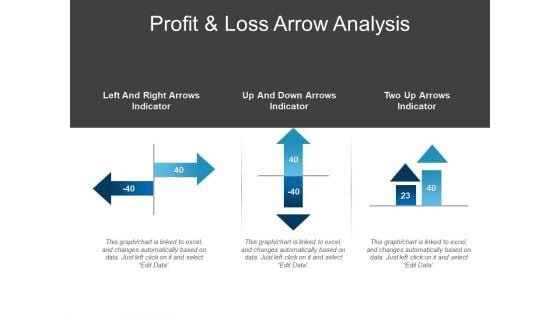
Profit And Loss Arrow Analysis Ppt PowerPoint Presentation Infographic Template Model
This is a profit and loss arrow analysis ppt powerpoint presentation infographic template model. This is a three stage process. The stages in this process are comparison chart, comparison table, comparison matrix.
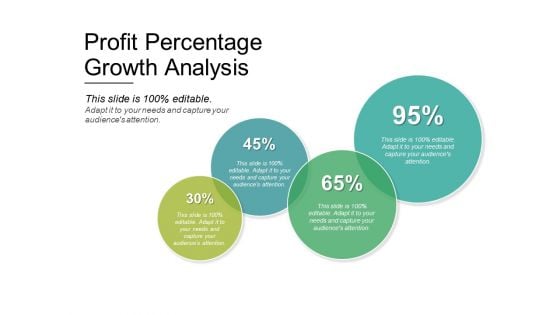
Profit Percentage Growth Analysis Ppt PowerPoint Presentation Layouts Graphics Tutorials
This is a profit percentage growth analysis ppt powerpoint presentation layouts graphics tutorials. This is a four stage process. The stages in this process are comparison chart, comparison table, comparison matrix.
Service Marketing Example Ppt PowerPoint Presentation Styles Example File
This is a service marketing example ppt powerpoint presentation styles example file. This is a two stage process. The stages in this process are comparison chart, comparison table, comparison matrix.
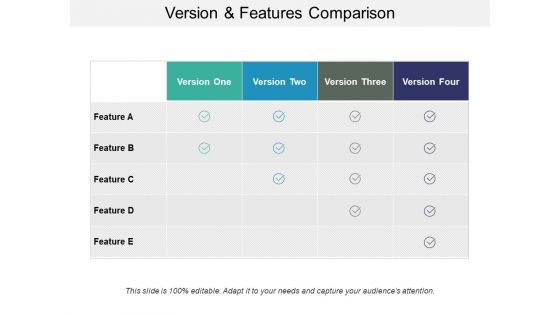
Version And Features Comparison Ppt PowerPoint Presentation Portfolio Example Topics
This is a version and features comparison ppt powerpoint presentation portfolio example topics. This is a five stage process. The stages in this process are comparison chart, comparison table, comparison matrix.
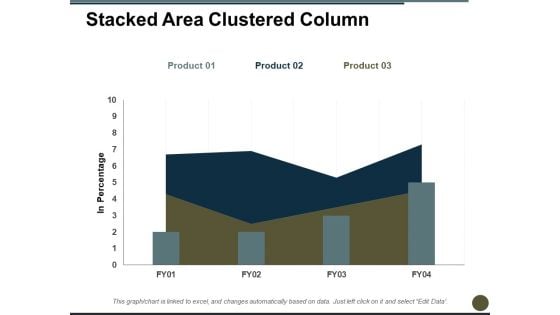
Stacked Area Clustered Column Ppt PowerPoint Presentation Professional Graphics
This is a stacked area clustered column ppt powerpoint presentation professional graphics. This is a three stage process. The stages in this process are in percentage, bar chart, product, growth, year.
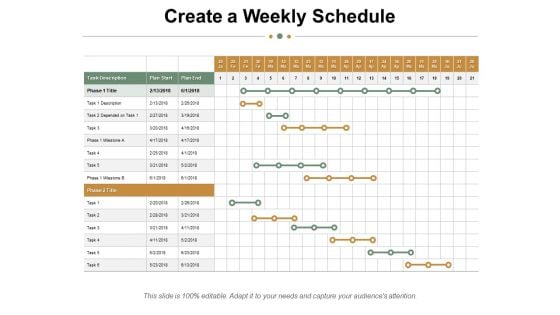
Create A Weekly Schedule Ppt PowerPoint Presentation Styles Background Image
This is a create a weekly schedule ppt powerpoint presentation styles background image. This is a four stage process. The stages in this process are table, chart, task description, plan start, plan end.
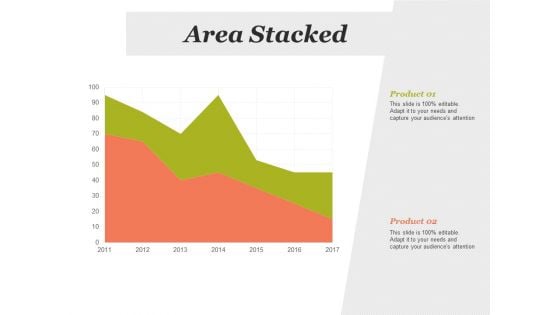
Area Stacked Analysis Ppt PowerPoint Presentation Inspiration Slideshow
This is a area stacked analysis ppt powerpoint presentation inspiration slideshow. This is a two stage process. The stages in this process are area chart, finance, marketing, strategy, business.
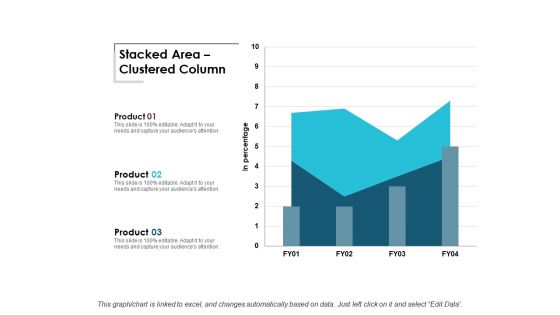
Stacked Area Clustered Column Ppt Powerpoint Presentation Infographic Template Background Images
This is a stacked area clustered column ppt powerpoint presentation infographic template background images. This is a three stage process. The stages in this process are area chart, finance, marketing, management, investment.
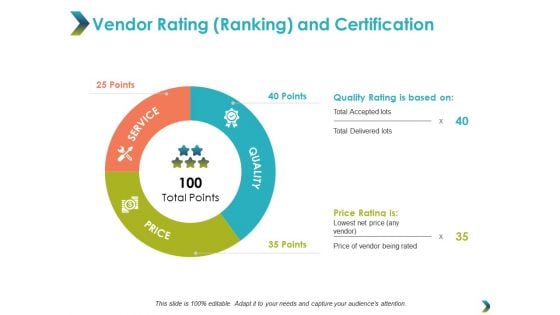
Vendor Rating Ranking And Certification Ppt Powerpoint Presentation Model Background Designs
This is a vendor rating ranking and certification ppt powerpoint presentation model background designs. This is a three stage process. The stages in this process are donut chart, finance, marketing, business, analysis.
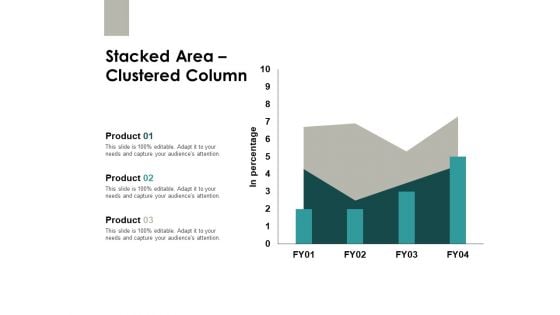
Stacked Area Clustered Column Finance Ppt PowerPoint Presentation Slides Images
This is a stacked area clustered column finance ppt powerpoint presentation slides images. This is a three stage process. The stages in this process are area chart, finance, marketing, analysis, investment.
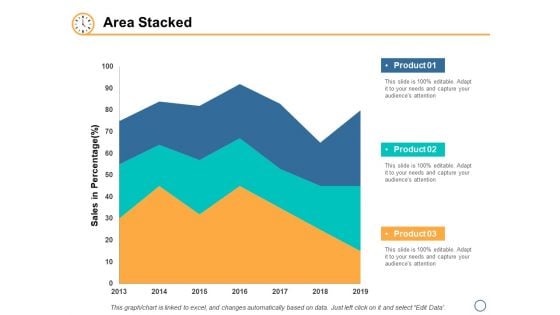
Area Stacked Finance Ppt PowerPoint Presentation Inspiration Graphics Download
This is a area stacked finance ppt powerpoint presentation inspiration graphics download. This is a three stage process. The stages in this process are area chart, finance, marketing, analysis, investment.
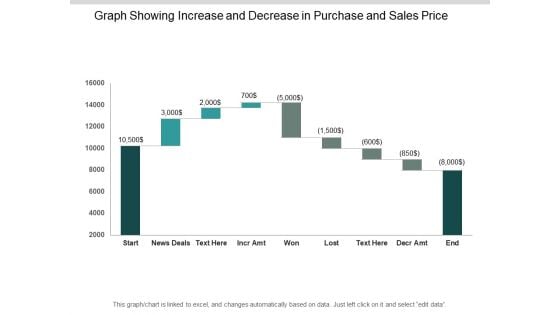
Graph Showing Increase And Decrease In Purchase And Sales Price Ppt PowerPoint Presentation Outline Gallery
This is a graph showing increase and decrease in purchase and sales price ppt powerpoint presentation outline gallery. This is a nine stage process. The stages in this process are sales waterfall, waterfall chart, business.
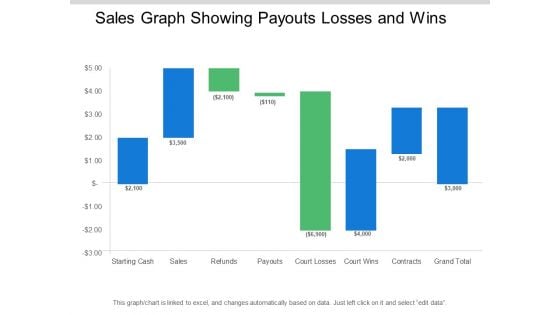
Sales Graph Showing Payouts Losses And Wins Ppt PowerPoint Presentation Pictures Designs Download
This is a sales graph showing payouts losses and wins ppt powerpoint presentation pictures designs download. This is a eight stage process. The stages in this process are sales waterfall, waterfall chart, business.
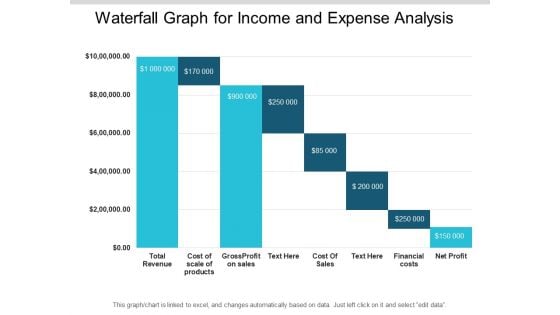
Waterfall Graph For Income And Expense Analysis Ppt PowerPoint Presentation File Deck
This is a waterfall graph for income and expense analysis ppt powerpoint presentation file deck. This is a eight stage process. The stages in this process are sales waterfall, waterfall chart, business.
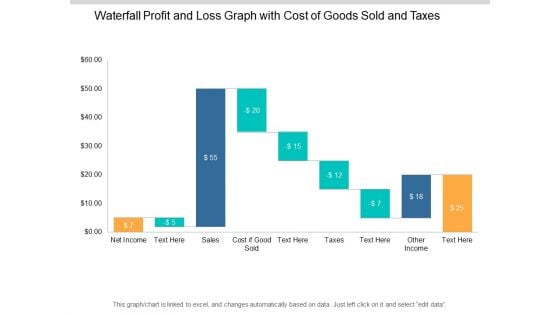
Waterfall Profit And Loss Graph With Cost Of Goods Sold And Taxes Ppt PowerPoint Presentation Show Slideshow
This is a waterfall profit and loss graph with cost of goods sold and taxes ppt powerpoint presentation show slideshow. This is a nine stage process. The stages in this process are sales waterfall, waterfall chart, business.

Algorithm Graph Pattern Matching Ppt PowerPoint Presentation Inspiration Background Images
This is a algorithm graph pattern matching ppt powerpoint presentation inspiration background images. This is a two stage process. The stages in this process are graph theory, chart theory, business.
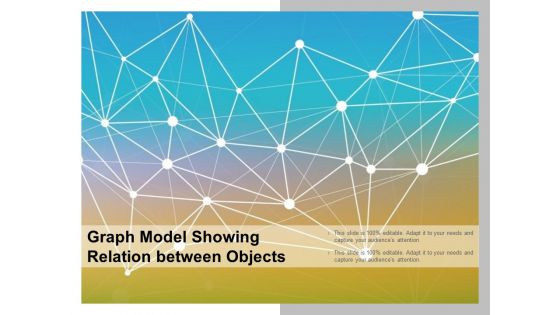
Graph Model Showing Relation Between Objects Ppt PowerPoint Presentation Summary Graphics Tutorials
This is a graph model showing relation between objects ppt powerpoint presentation summary graphics tutorials. This is a two stage process. The stages in this process are graph theory, chart theory, business.
Graph Pattern For Network Analysis Ppt PowerPoint Presentation Infographics Graphics Template
This is a graph pattern for network analysis ppt powerpoint presentation infographics graphics template. This is a two stage process. The stages in this process are graph theory, chart theory, business.
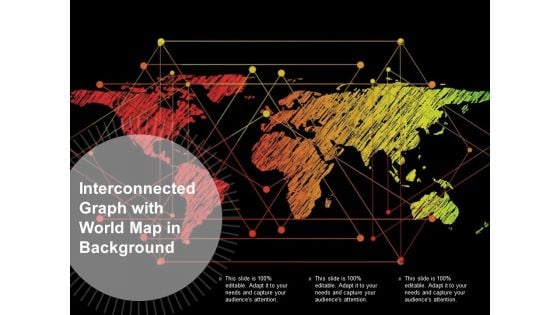
Interconnected Graph With World Map In Background Ppt PowerPoint Presentation Infographics Slide
This is a interconnected graph with world map in background ppt powerpoint presentation infographics slide. This is a three stage process. The stages in this process are graph theory, chart theory, business.
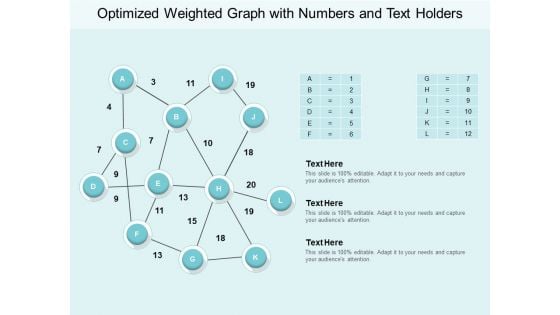
Optimized Weighted Graph With Numbers And Text Holders Ppt PowerPoint Presentation Outline Picture
This is a optimized weighted graph with numbers and text holders ppt powerpoint presentation outline picture. This is a three stage process. The stages in this process are graph theory, chart theory, business.
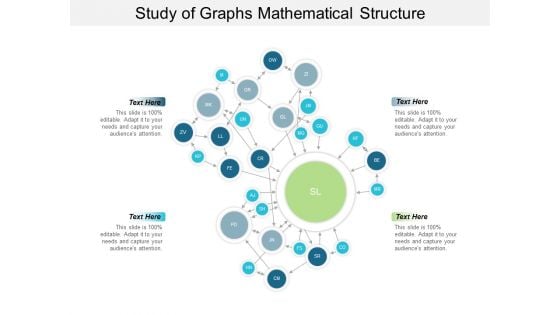
Study Of Graphs Mathematical Structure Ppt PowerPoint Presentation Gallery Background
This is a study of graphs mathematical structure ppt powerpoint presentation gallery background. This is a four stage process. The stages in this process are graph theory, chart theory, business.
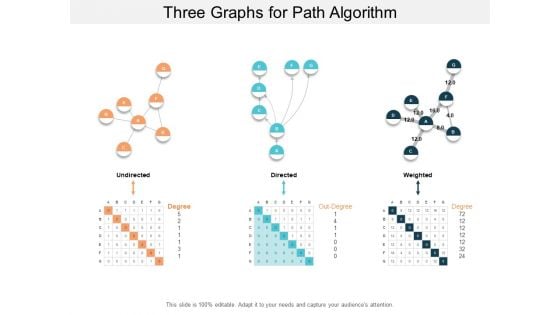
Three Graphs For Path Algorithm Ppt PowerPoint Presentation Infographic Template Templates
This is a three graphs for path algorithm ppt powerpoint presentation infographic template templates. This is a three stage process. The stages in this process are graph theory, chart theory, business.
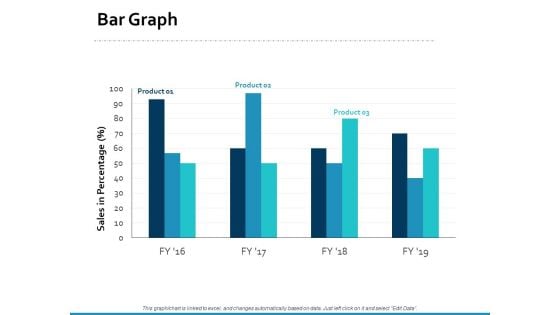
Bar Graph Percentage Product Ppt PowerPoint Presentation Styles Good
This is a bar graph percentage product ppt powerpoint presentation styles good. This is a three stage process. The stages in this process are area chart, finance, marketing, management, investment.
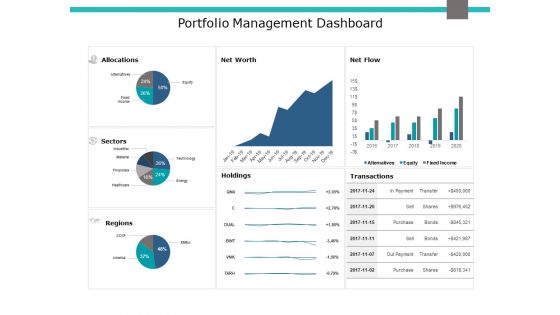
Portfolio Management Dashboard Ppt PowerPoint Presentation Gallery Example Introduction
This is a portfolio management dashboard ppt powerpoint presentation gallery example introduction. This is a three stage process. The stages in this process are area chart, finance, marketing, management, investment.
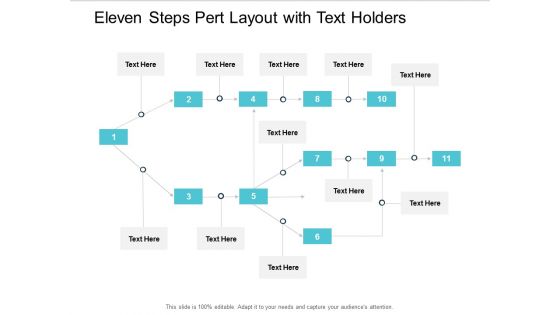
Eleven Steps Pert Layout With Text Holders Ppt Powerpoint Presentation Ideas Background Image
This is a eleven steps pert layout with text holders ppt powerpoint presentation ideas background image. This is a eleven stage process. The stages in this process are pert chart, program evaluation and review technique, pert graph.
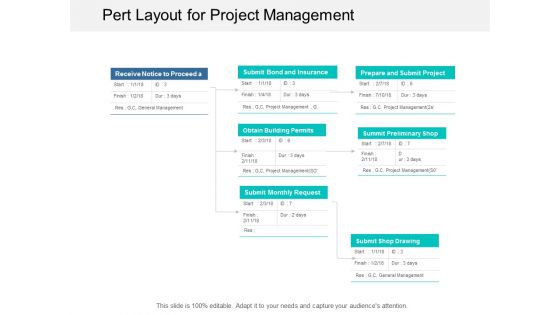
Pert Layout For Project Management Ppt Powerpoint Presentation Professional Smartart
This is a pert layout for project management ppt powerpoint presentation professional smartart. This is a three stage process. The stages in this process are pert chart, program evaluation and review technique, pert graph.
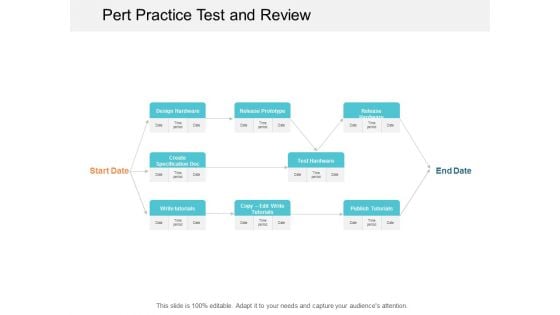
Pert Practice Test And Review Ppt Powerpoint Presentation Layouts Template
This is a pert practice test and review ppt powerpoint presentation layouts template. This is a two stage process. The stages in this process are pert chart, program evaluation and review technique, pert graph.


 Continue with Email

 Home
Home


