Policy Icon
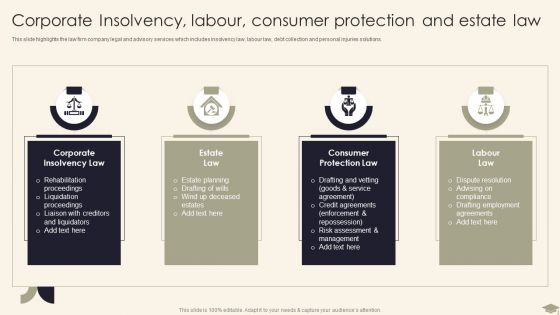
Legal Advisory Company Description Corporate Insolvency Labour Consumer Diagrams PDF
This slide highlights the law firm company legal and advisory services which includes insolvency law, labour law, debt collection and personal injuries solutions.This is a Legal Advisory Company Description Corporate Insolvency Labour Consumer Diagrams PDF template with various stages. Focus and dispense information on four stages using this creative set, that comes with editable features. It contains large content boxes to add your information on topics like Corporate Insolvency, Consumer Protection, Assessment And Management. You can also showcase facts, figures, and other relevant content using this PPT layout. Grab it now.
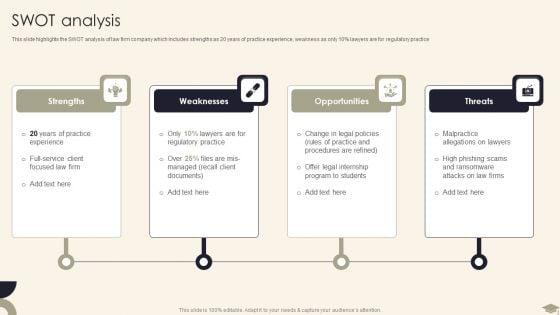
Legal Advisory Company Description SWOT Analysis Diagrams PDF
This slide highlights the SWOT analysis of law firm company which includes strengths as 20 years of practice experience, weakness as only 10persent lawyers are for regulatory practice.This is a Legal Advisory Company Description SWOT Analysis Diagrams PDF template with various stages. Focus and dispense information on four stages using this creative set, that comes with editable features. It contains large content boxes to add your information on topics like Practice Experience, Program To Students, Malpractice Allegations. You can also showcase facts, figures, and other relevant content using this PPT layout. Grab it now.
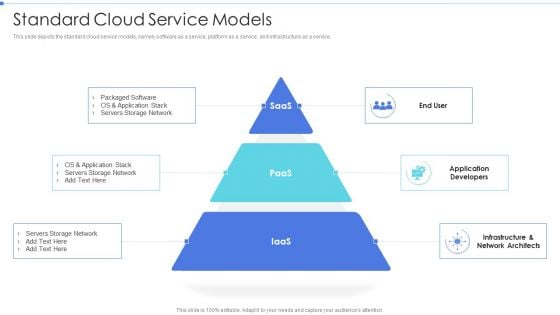
Cloud Based Service Models Standard Cloud Service Models Diagrams PDF
This slide depicts the standard cloud service models, namely software as a service, platform as a service, and infrastructure as a service.Presenting Cloud Based Service Models Standard Cloud Service Models Diagrams PDF to provide visual cues and insights. Share and navigate important information on three stages that need your due attention. This template can be used to pitch topics like Servers Storage, Application Stack, Packaged Software. In addtion, this PPT design contains high resolution images, graphics, etc, that are easily editable and available for immediate download.
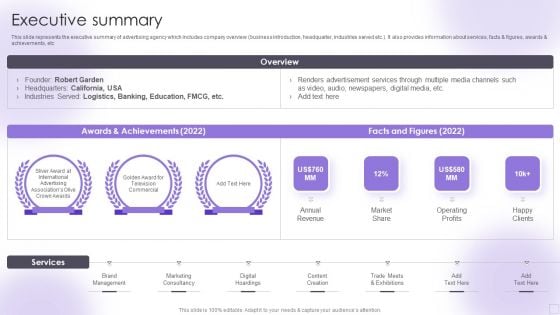
Advertising Services Company Profile Executive Summary Diagrams PDF
This slide represents the executive summary of advertising agency which includes company overview business introduction, headquarter, industries served etc.. It also provides information about services, facts and figures, awards and achievements, etc. Presenting Advertising Services Company Profile Executive Summary Diagrams PDF to provide visual cues and insights. Share and navigate important information on three stages that need your due attention. This template can be used to pitch topics like Brand Management, Marketing Consultancy, Digital Hoardings, Content Creation. In addtion, this PPT design contains high resolution images, graphics, etc, that are easily editable and available for immediate download.

Technological Factors Evaluation On Business Environment Diagrams PDF
This slide focuses on the impact of technological factors on business environment which shows advantages, disadvantages and barriers to implementation such as reduces travel costs, expenses technology, employee resist to adapt new technologies, etc. Persuade your audience using this Technological Factors Evaluation On Business Environment Diagrams PDF. This PPT design covers three stages, thus making it a great tool to use. It also caters to a variety of topics including Advantages, Disadvantages, Barriers To Implementation. Download this PPT design now to present a convincing pitch that not only emphasizes the topic but also showcases your presentation skills.

Digitalization Of Operative Enterprises Change Drivers Why Converge Diagrams PDF
This slide covers the change drivers which are driving the IT OT convergence growth such as new edge to cloud architectures and new industrial connectivity protocols. This is a Digitalization Of Operative Enterprises Change Drivers Why Converge Diagrams PDF template with various stages. Focus and dispense information on four stages using this creative set, that comes with editable features. It contains large content boxes to add your information on topics like Market Share, Industrial Connectivity Protocols. You can also showcase facts, figures, and other relevant content using this PPT layout. Grab it now.
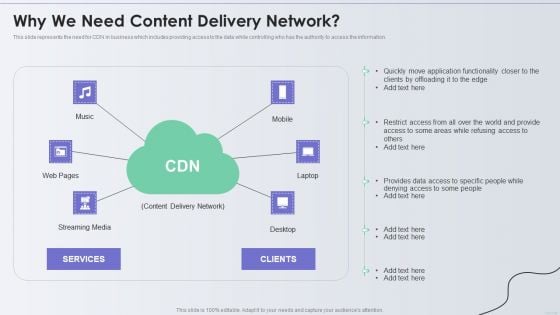
Distribution Network Why We Need Content Delivery Network Diagrams PDF
This slide represents the need for CDN in business which includes providing access to the data while controlling who has the authority to access the information. Presenting Distribution Network Why We Need Content Delivery Network Diagrams PDF to provide visual cues and insights. Share and navigate important information on six stages that need your due attention. This template can be used to pitch topics like Application, Services, Content Delivery Network. In addtion, this PPT design contains high resolution images, graphics, etc, that are easily editable and available for immediate download.
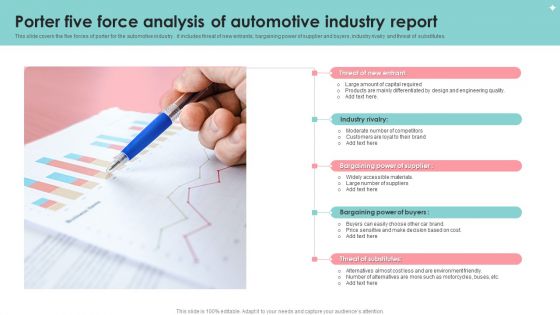
Porter Five Force Analysis Of Automotive Industry Report Diagrams PDF
This slide covers the five forces of porter for the automotive industry . it includes threat of new entrants, bargaining power of supplier and buyers, industry rivalry and threat of substitutes. Persuade your audience using this Porter Five Force Analysis Of Automotive Industry Report Diagrams PDF. This PPT design covers five stages, thus making it a great tool to use. It also caters to a variety of topics including Industry Rivalry, Customers, Materials. Download this PPT design now to present a convincing pitch that not only emphasizes the topic but also showcases your presentation skills.
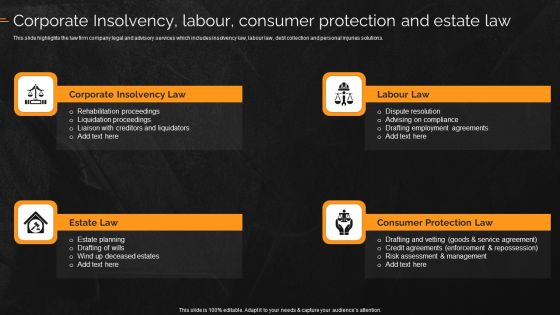
Corporate Insolvency Labour Consumer Protection And Estate Law Diagrams PDF
This slide highlights the law firm company legal and advisory services which includes insolvency law, labour law, debt collection and personal injuries solutions. This is a Corporate Insolvency Labour Consumer Protection And Estate Law Diagrams PDF template with various stages. Focus and dispense information on four stages using this creative set, that comes with editable features. It contains large content boxes to add your information on topics like Corporate Insolvency Law, Consumer Protection Law, Estate Law. You can also showcase facts, figures, and other relevant content using this PPT layout. Grab it now.
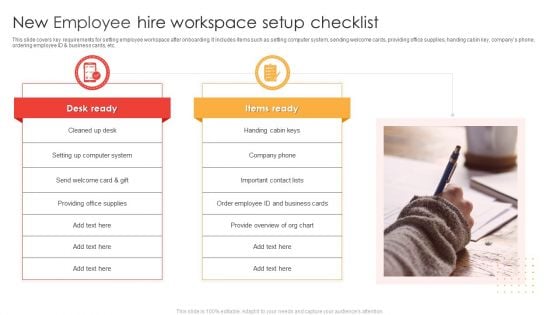
New Employee Hire Workspace Setup Checklist Ppt Model Diagrams PDF
This slide covers key requirements for setting employee workspace after onboarding. It includes items such as setting computer system, sending welcome cards, providing office supplies, handing cabin key, companys phone, ordering employee ID and business cards, etc. Persuade your audience using this New Employee Hire Workspace Setup Checklist Ppt Model Diagrams PDF. This PPT design covers two stages, thus making it a great tool to use. It also caters to a variety of topics including Cleaned Up Desk, Desk Ready, Items Ready. Download this PPT design now to present a convincing pitch that not only emphasizes the topic but also showcases your presentation skills.
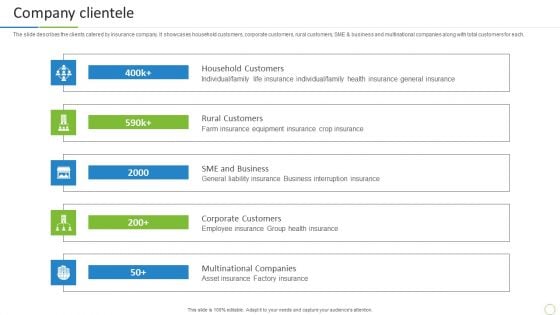
Property And Casualties Insurance Business Profile Company Clientele Diagrams PDF
The slide describes the clients catered by insurance company. It showcases household customers, corporate customers, rural customers, SME and business and multinational companies along with total customers for each. This is a Property And Casualties Insurance Business Profile Company Clientele Diagrams PDF template with various stages. Focus and dispense information on five stages using this creative set, that comes with editable features. It contains large content boxes to add your information on topics like Rural Customers, Household Customers, Sme And Business. You can also showcase facts, figures, and other relevant content using this PPT layout. Grab it now.
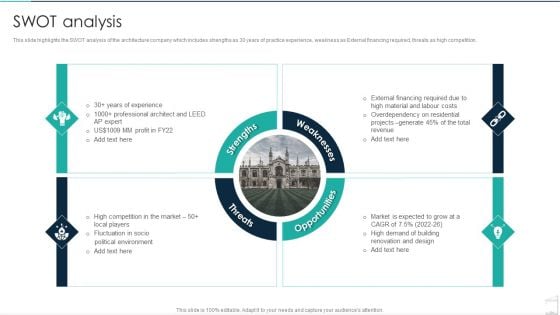
Commercial Construction And Architecture Firm Swot Analysis Diagrams PDF
This slide highlights the SWOT analysis of the architecture company which includes strengths as 30 years of practice experience, weakness as External financing required, threats as high competition. Presenting Commercial Construction And Architecture Firm Swot Analysis Diagrams PDF to provide visual cues and insights. Share and navigate important information on four stages that need your due attention. This template can be used to pitch topics like Strengths, Weaknesses, Opportunities, Threats. In addtion, this PPT design contains high resolution images, graphics, etc, that are easily editable and available for immediate download.
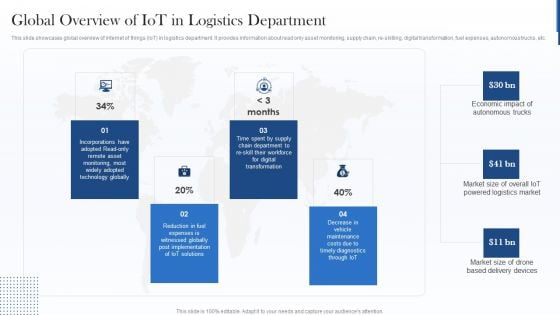
Global Overview Of Iot In Logistics Department Diagrams PDF
This slide showcases global overview of internet of things IoT in logistics department. It provides information about read only asset monitoring, supply chain, re skilling, digital transformation, fuel expenses, autonomous trucks, etc. Presenting Global Overview Of Iot In Logistics Department Diagrams PDF to provide visual cues and insights. Share and navigate important information on four stages that need your due attention. This template can be used to pitch topics like Supply, Technology Globally, Economic. In addtion, this PPT design contains high resolution images, graphics, etc, that are easily editable and available for immediate download.
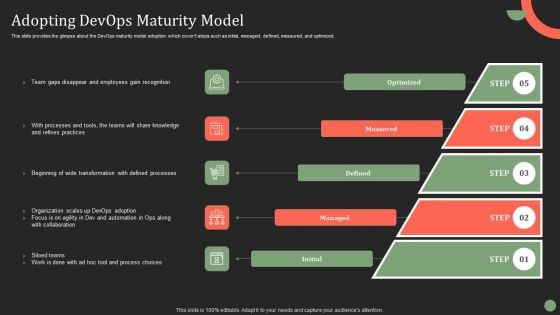
Adopting Devops Maturity Model Ppt PowerPoint Presentation Diagram PDF
This slide provides the glimpse about the DevOps maturity model adoption which cover 5 steps such as initial, managed, defined, measured, and optimized. Find a pre designed and impeccable Adopting Devops Maturity Model Ppt PowerPoint Presentation Diagram PDF. The templates can ace your presentation without additional effort. You can download these easy to edit presentation templates to make your presentation stand out from others. So, what are you waiting for Download the template from Slidegeeks today and give a unique touch to your presentation.
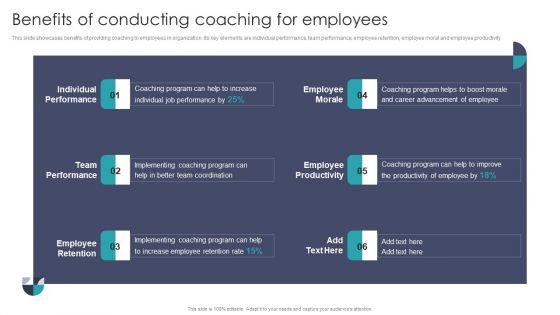
Benefits Of Conducting Coaching For Employees Diagrams PDF
This slide showcases benefits of providing coaching to employees in organization. Its key elements are individual performance, team performance, employee retention, employee moral and employee productivity. Boost your pitch with our creative Benefits Of Conducting Coaching For Employees Diagrams PDF. Deliver an awe inspiring pitch that will mesmerize everyone. Using these presentation templates you will surely catch everyones attention. You can browse the ppts collection on our website. We have researchers who are experts at creating the right content for the templates. So you do not have to invest time in any additional work. Just grab the template now and use them.
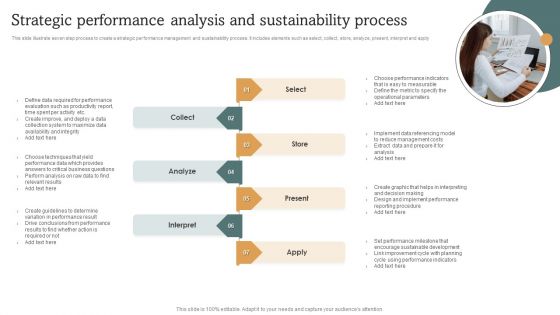
Strategic Performance Analysis And Sustainability Process Diagrams PDF
This slide illustrate seven step process to create a strategic performance management and sustainability process. It includes elements such as select, collect, store, analyze, present, interpret and apply. Persuade your audience using this Strategic Performance Analysis And Sustainability Process Diagrams PDF. This PPT design covers seven stages, thus making it a great tool to use. It also caters to a variety of topics including Analyze, Reduce Management Costs, Metric. Download this PPT design now to present a convincing pitch that not only emphasizes the topic but also showcases your presentation skills.
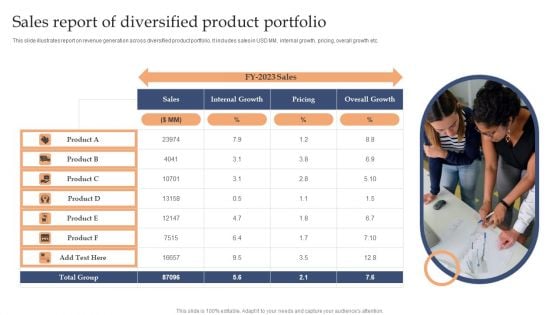
Sales Report Of Diversified Product Portfolio Diagrams PDF
This slide illustrates report on revenue generation across diversified product portfolio. It includes sales in USD MM, internal growth, pricing, overall growth etc.Persuade your audience using this Sales Report Of Diversified Product Portfolio Diagrams PDF. This PPT design covers one stage, thus making it a great tool to use. It also caters to a variety of topics including Internal Growth, Overall Growth, Total Group. Download this PPT design now to present a convincing pitch that not only emphasizes the topic but also showcases your presentation skills.
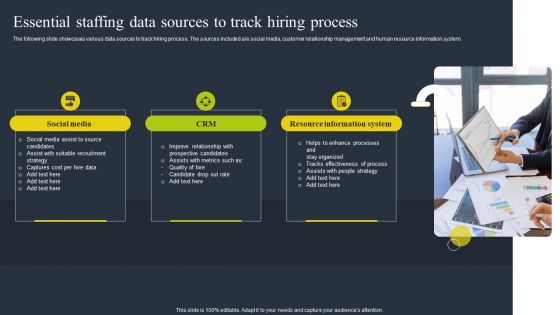
Essential Staffing Data Sources To Track Hiring Process Diagrams PDF
The following slide showcases various data sources to track hiring process. The sources included are social media, customer relationship management and human resource information system. Persuade your audience using this Essential Staffing Data Sources To Track Hiring Process Diagrams PDF. This PPT design covers three stages, thus making it a great tool to use. It also caters to a variety of topics including Social Media, CRM, Resource Information System. Download this PPT design now to present a convincing pitch that not only emphasizes the topic but also showcases your presentation skills.
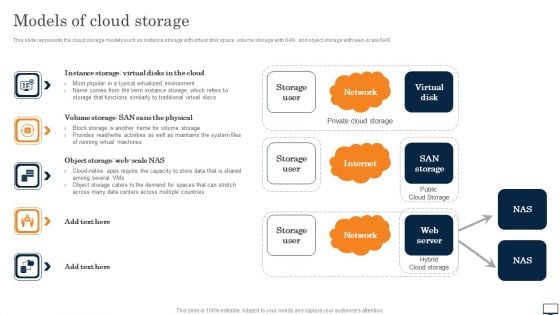
Models Of Cloud Storage Ppt PowerPoint Presentation Diagram Lists PDF
This slide represents the cloud storage models such as instance storage with virtual disk space, volume storage with SAN, and object storage with web scale NAS. The best PPT templates are a great way to save time, energy, and resources. Slidegeeks have 100 percent editable powerpoint slides making them incredibly versatile. With these quality presentation templates, you can create a captivating and memorable presentation by combining visually appealing slides and effectively communicating your message. Download Models Of Cloud Storage Ppt PowerPoint Presentation Diagram Lists PDF from Slidegeeks and deliver a wonderful presentation.
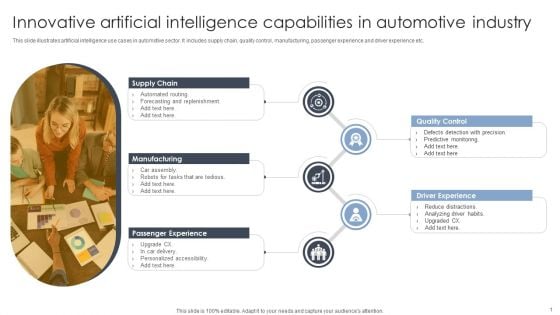
Innovative Artificial Intelligence Capabilities In Automotive Industry Diagrams PDF
This slide illustrates artificial intelligence use cases in automotive sector. It includes supply chain, quality control, manufacturing, passenger experience and driver experience etc. Persuade your audience using this Innovative Artificial Intelligence Capabilities In Automotive Industry Diagrams PDF. This PPT design covers Five stages, thus making it a great tool to use. It also caters to a variety of topics including Supply Chain, Quality Control, Manufacturing. Download this PPT design now to present a convincing pitch that not only emphasizes the topic but also showcases your presentation skills.
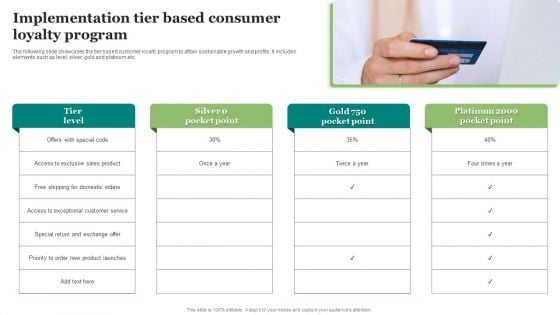
Implementation Tier Based Consumer Loyalty Program Diagrams PDF
The following slide showcases the tier based customer loyalty program to attain sustainable growth and profits. It includes elements such as level, silver, gold and platinum etc. Persuade your audience using this Implementation Tier Based Consumer Loyalty Program Diagrams PDF. This PPT design covers Four stages, thus making it a great tool to use. It also caters to a variety of topics including Implementation Tier, Based Consumer, Loyalty Program. Download this PPT design now to present a convincing pitch that not only emphasizes the topic but also showcases your presentation skills.
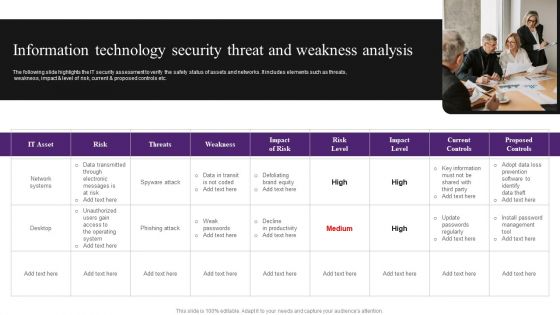
Information Technology Security Threat And Weakness Analysis Diagrams PDF
The following slide highlights the IT security assessment to verify the safety status of assets and networks. It includes elements such as threats, weakness, impact and level of risk, current and proposed controls etc. Persuade your audience using this Information Technology Security Threat And Weakness Analysis Diagrams PDF. This PPT design covers one stages, thus making it a great tool to use. It also caters to a variety of topics including Risk, Network Systems, Data. Download this PPT design now to present a convincing pitch that not only emphasizes the topic but also showcases your presentation skills.
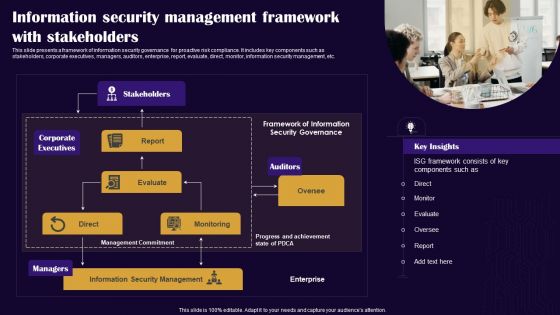
Information Security Management Framework With Stakeholders Diagrams PDF
This slide presents a framework of information security governance for proactive risk compliance. It includes key components such as stakeholders, corporate executives, managers, auditors, enterprise, report, evaluate, direct, monitor, information security management, etc. Persuade your audience using this Information Security Management Framework With Stakeholders Diagrams PDF. This PPT design covers one stages, thus making it a great tool to use. It also caters to a variety of topics including Stakeholders, Auditors, Corporate Executives. Download this PPT design now to present a convincing pitch that not only emphasizes the topic but also showcases your presentation skills.
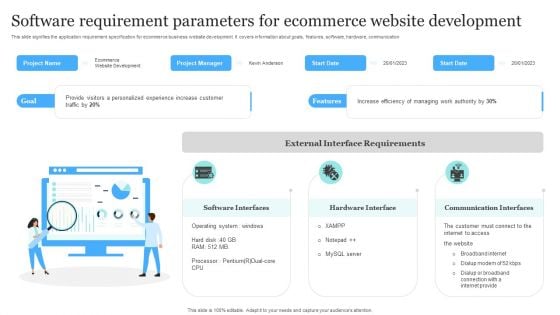
Software Requirement Parameters For Ecommerce Website Development Diagrams PDF
This slide signifies the application requirement specification for ecommerce business website development. It covers information about goals, features, software, hardware, communication.Persuade your audience using this Software Requirement Parameters For Ecommerce Website Development Diagrams PDF. This PPT design covers three stages, thus making it a great tool to use. It also caters to a variety of topics including Software Interfaces, Hardware Interface, Communication Interfaces. Download this PPT design now to present a convincing pitch that not only emphasizes the topic but also showcases your presentation skills.
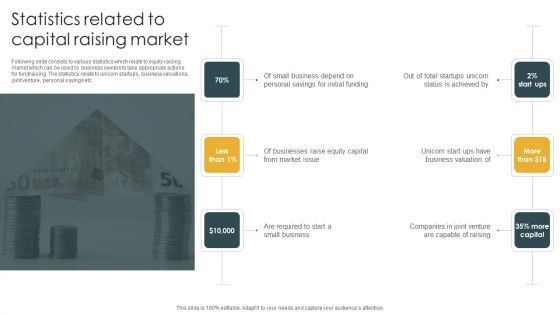
Statistics Related To Capital Raising Market Diagrams PDF
Following slide consists to various statistics which relate to equity raising market which can be used by business owners to take appropriate actions for fundraising. The statistics relate to unicorn startups, business valuations, joint venture, personal savings etc. Persuade your audience using this Statistics Related To Capital Raising Market Diagrams PDF. This PPT design covers six stages, thus making it a great tool to use. It also caters to a variety of topics including Businesses Raise, Equity Capital, Market. Download this PPT design now to present a convincing pitch that not only emphasizes the topic but also showcases your presentation skills.
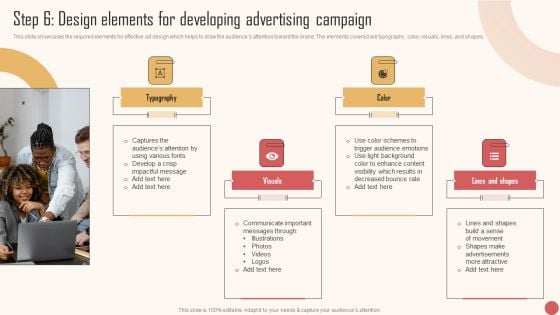
Step 6 Design Elements For Developing Advertising Campaign Diagrams PDF
This slide showcases the required elements for effective ad design which helps to draw the audiences attention toward the brand. The elements covered are typography, color, visuals, lines, and shapes. Boost your pitch with our creative Step 6 Design Elements For Developing Advertising Campaign Diagrams PDF. Deliver an awe-inspiring pitch that will mesmerize everyone. Using these presentation templates you will surely catch everyones attention. You can browse the ppts collection on our website. We have researchers who are experts at creating the right content for the templates. So you do not have to invest time in any additional work. Just grab the template now and use them.
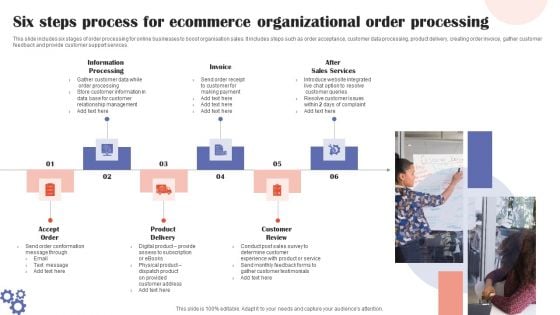
Six Steps Process For Ecommerce Organizational Order Processing Diagrams PDF
This slide includes six stages of order processing for online businesses to boost organisation sales. It includes steps such as order acceptance, customer data processing, product delivery, creating order invoice, gather customer feedback and provide customer support services. Persuade your audience using this Six Steps Process For Ecommerce Organizational Order Processing Diagrams PDF. This PPT design covers six stages, thus making it a great tool to use. It also caters to a variety of topics including Customer Review, Product Delivery, After Sales Services. Download this PPT design now to present a convincing pitch that not only emphasizes the topic but also showcases your presentation skills.
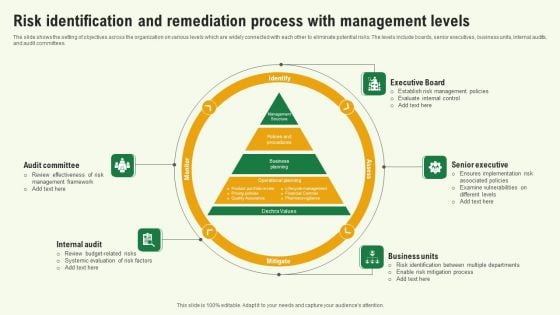
Risk Identification And Remediation Process With Management Levels Diagrams PDF
The slide shows the setting of objectives across the organization on various levels which are widely connected with each other to eliminate potential risks. The levels include boards, senior executives, business units, internal audits, and audit committees. Persuade your audience using this Risk Identification And Remediation Process With Management Levels Diagrams PDF. This PPT design covers five stages, thus making it a great tool to use. It also caters to a variety of topics including Business Units, Senior Executive, Executive Board. Download this PPT design now to present a convincing pitch that not only emphasizes the topic but also showcases your presentation skills.
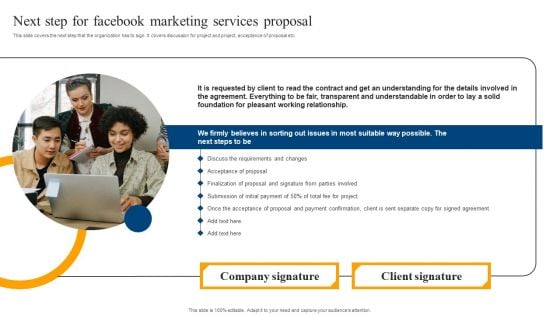
Next Step For Facebook Marketing Services Proposal Diagrams PDF
This slide covers the next step that the organization has to sign. It covers discussion for project and project, acceptance of proposal etc. Elevate your presentations with our intuitive Next Step For Facebook Marketing Services Proposal Diagrams PDF template. Whether you are delivering a pitch, sharing data, or presenting ideas, our visually-stunning single-slide PPT template is the perfect tool to captivate your audience. With 100 percent editable features and a user-friendly interface, creating professional presentations has never been easier. Download now and leave a lasting impression.
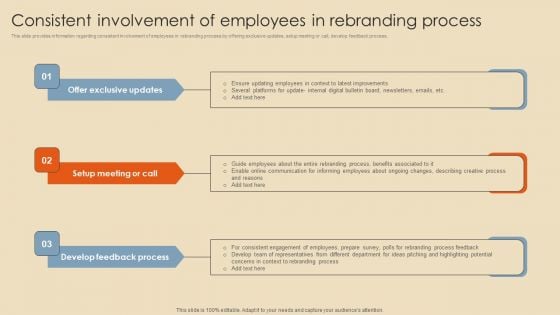
Consistent Involvement Of Employees In Rebranding Process Diagrams PDF
This slide provides information regarding consistent involvement of employees in rebranding process by offering exclusive updates, setup meeting or call, develop feedback process. Find a pre designed and impeccable Consistent Involvement Of Employees In Rebranding Process Diagrams PDF. The templates can ace your presentation without additional effort. You can download these easy to edit presentation templates to make your presentation stand out from others. So, what are you waiting for Download the template from Slidegeeks today and give a unique touch to your presentation.
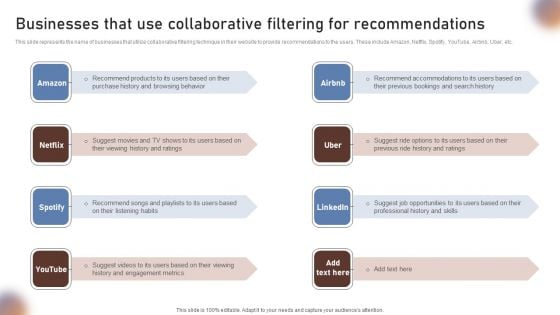
Businesses That Use Collaborative Filtering For Recommendations Diagrams PDF
This slide represents the name of businesses that utilize collaborative filtering technique in their website to provide recommendations to the users. These include Amazon, Netflix, Spotify, YouTube, Airbnb, Uber, etc. Slidegeeks is one of the best resources for PowerPoint templates. You can download easily and regulate Businesses That Use Collaborative Filtering For Recommendations Diagrams PDF for your personal presentations from our wonderful collection. A few clicks is all it takes to discover and get the most relevant and appropriate templates. Use our Templates to add a unique zing and appeal to your presentation and meetings. All the slides are easy to edit and you can use them even for advertisement purposes.
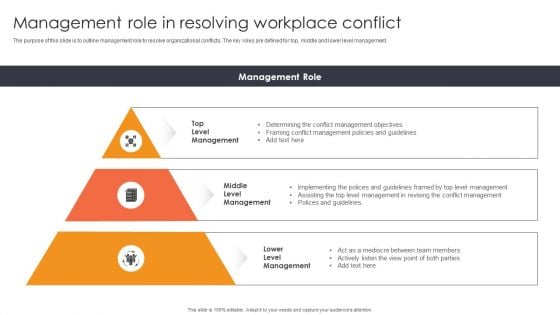
Management Role In Resolving Workplace Conflict Ppt Diagrams PDF
The purpose of this slide is to outline management role to resolve organizational conflicts. The key roles are defined for top, middle and lower level management. The best PPT templates are a great way to save time, energy, and resources. Slidegeeks have 100 percent editable powerpoint slides making them incredibly versatile. With these quality presentation templates, you can create a captivating and memorable presentation by combining visually appealing slides and effectively communicating your message. Download Management Role In Resolving Workplace Conflict Ppt Diagrams PDF from Slidegeeks and deliver a wonderful presentation.
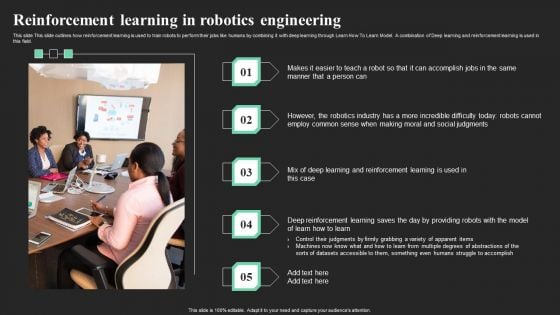
Reinforcement Learning In Robotics Engineering Ppt Show Diagrams PDF
This slide This slide outlines how reinforcement learning is used to train robots to perform their jobs like humans by combining it with deep learning through Learn How To Learn Model. A combination of Deep learning and reinforcement learning is used in this field. The best PPT templates are a great way to save time, energy, and resources. Slidegeeks have 100 percent editable powerpoint slides making them incredibly versatile. With these quality presentation templates, you can create a captivating and memorable presentation by combining visually appealing slides and effectively communicating your message. Download Reinforcement Learning In Robotics Engineering Ppt Show Diagrams PDF from Slidegeeks and deliver a wonderful presentation.
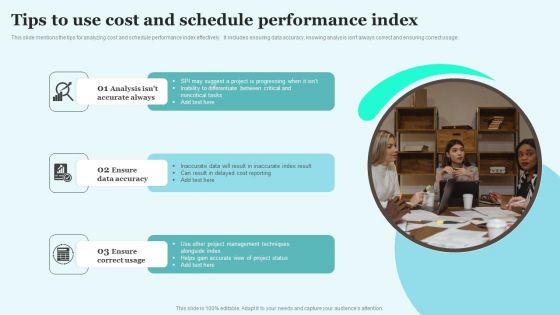
Tips To Use Cost And Schedule Performance Index Diagrams PDF
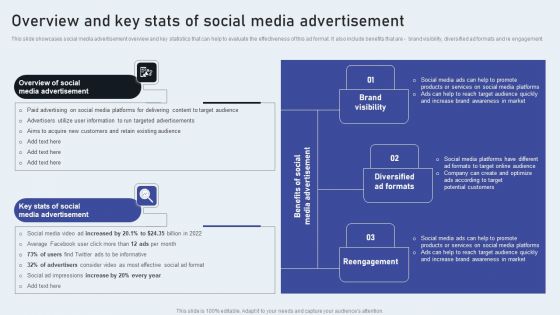
Overview And Key Stats Of Social Media Advertisement Diagrams PDF
This slide showcases social media advertisement overview and key statistics that can help to evaluate the effectiveness of this ad format. It also include benefits that are - brand visibility, diversified ad formats and re engagement. If your project calls for a presentation, then Slidegeeks is your go-to partner because we have professionally designed, easy-to-edit templates that are perfect for any presentation. After downloading, you can easily edit Overview And Key Stats Of Social Media Advertisement Diagrams PDF and make the changes accordingly. You can rearrange slides or fill them with different images. Check out all the handy templates
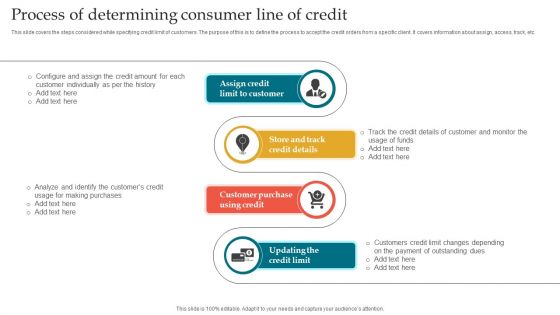
Process Of Determining Consumer Line Of Credit Diagrams PDF
This slide covers the steps considered while specifying credit limit of customers. The purpose of this is to define the process to accept the credit orders from a specific client. It covers information about assign, access, track, etc. Persuade your audience using this Process Of Determining Consumer Line Of Credit Diagrams PDF. This PPT design covers four stages, thus making it a great tool to use. It also caters to a variety of topics including Customer Purchase Using Credit, Updating The Credit Limit, Making Purchases. Download this PPT design now to present a convincing pitch that not only emphasizes the topic but also showcases your presentation skills.
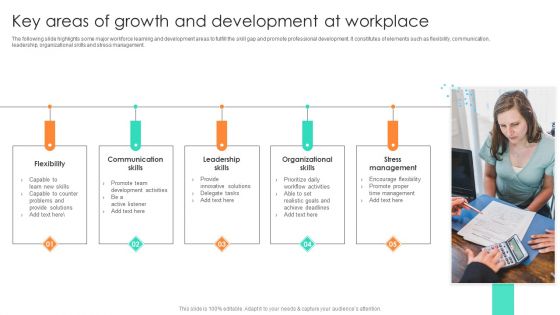
Key Areas Of Growth And Development At Workplace Diagrams PDF
The following slide highlights some major workforce learning and development areas to fulfill the skill gap and promote professional development. It constitutes of elements such as flexibility, communication, leadership, organizational skills and stress management. Persuade your audience using this Key Areas Of Growth And Development At Workplace Diagrams PDF. This PPT design covers five stages, thus making it a great tool to use. It also caters to a variety of topics including Communication Skills, Leadership Skills, Organizational Skills. Download this PPT design now to present a convincing pitch that not only emphasizes the topic but also showcases your presentation skills.
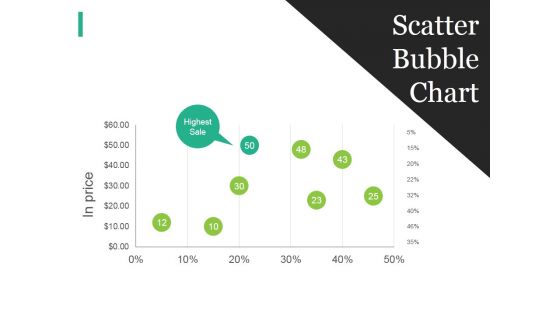
Scatter Bubble Chart Ppt PowerPoint Presentation Summary Mockup
This is a scatter bubble chart ppt powerpoint presentation summary mockup. This is a five stage process. The stages in this process are business, strategy, marketing, analysis, scatter bubble chart.

Radar Chart Template 1 Ppt PowerPoint Presentation Infographics Designs
This is a radar chart template 1 ppt powerpoint presentation infographics designs. This is a two stage process. The stages in this process are business, strategy, analysis, pretention, radar chart.
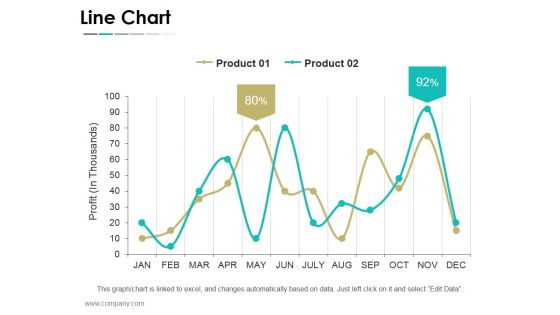
Line Chart Ppt PowerPoint Presentation File Graphics Template
This is a line chart ppt powerpoint presentation file graphics template. This is a twelve stage process. The stages in this process are business, strategy, marketing, success, line chart.
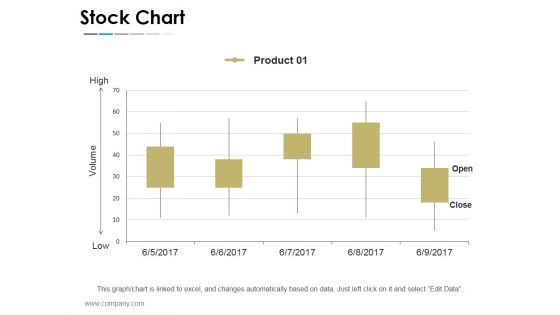
Stock Chart Ppt PowerPoint Presentation Summary Graphic Images
This is a stock chart ppt powerpoint presentation summary graphic images. This is a five stage process. The stages in this process are business, strategy, marketing, success, stock chart.
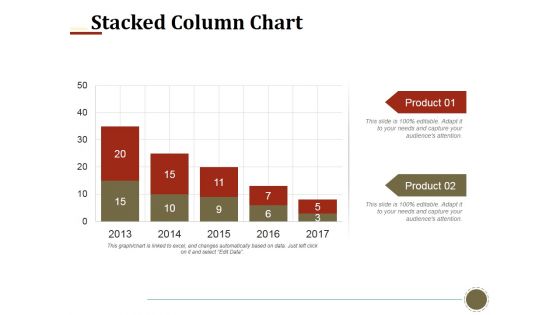
Stacked Column Chart Ppt PowerPoint Presentation Infographics Smartart
This is a stacked column chart ppt powerpoint presentation infographics smartart. This is a two stage process. The stages in this process are stacked column chart, business, finance, marketing, strategy.
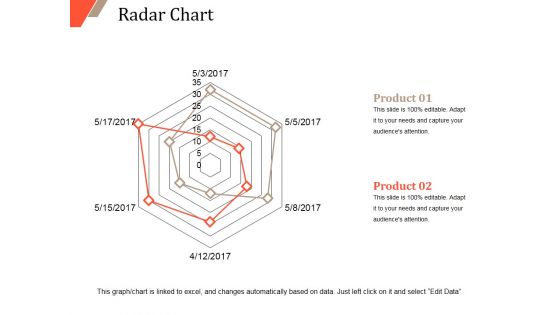
Radar Chart Ppt PowerPoint Presentation Portfolio Design Templates
This is a radar chart ppt powerpoint presentation portfolio design templates. This is a two stage process. The stages in this process are radar chart, product, finance, marketing, strategy, business.
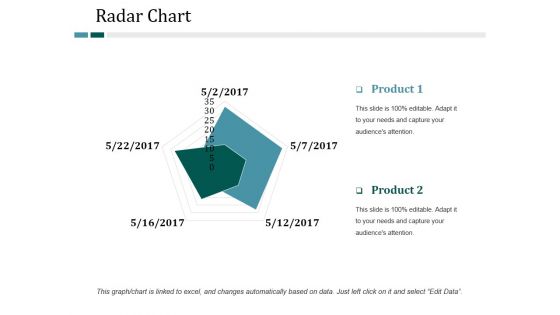
Radar Chart Ppt PowerPoint Presentation Infographic Template Backgrounds
This is a radar chart ppt powerpoint presentation infographic template backgrounds. This is a two stage process. The stages in this process are radar chart, finance, marketing, strategy, business.
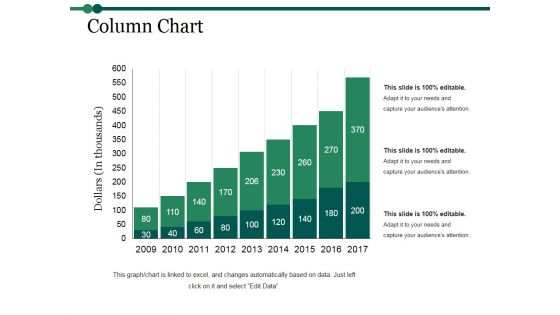
Column Chart Ppt PowerPoint Presentation Inspiration Graphics Example
This is a column chart ppt powerpoint presentation inspiration graphics example. This is a nine stage process. The stages in this process are column chart, finance, marketing, strategy, analysis, business.

Column Chart Ppt PowerPoint Presentation Infographic Template Slides
This is a column chart ppt powerpoint presentation infographic template slides. This is a two stage process. The stages in this process are column chart, finance, marketing, strategy, business.
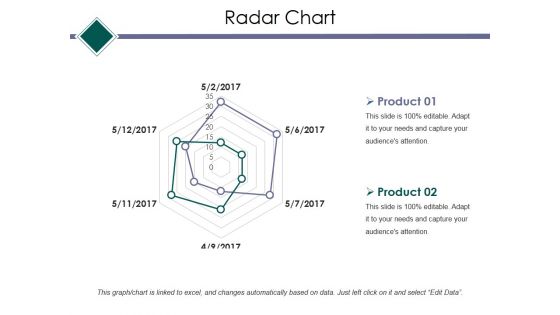
Radar Chart Ppt PowerPoint Presentation Infographic Template Example Topics
This is a radar chart ppt powerpoint presentation infographic template example topics. This is a two stage process. The stages in this process are radar chart, finance, marketing, strategy, business.
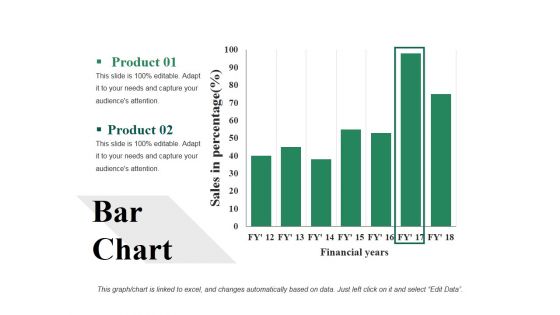
Bar Chart Ppt PowerPoint Presentation Visual Aids Backgrounds
This is a bar chart ppt powerpoint presentation visual aids backgrounds. This is a two stage process. The stages in this process are bar chart, analysis, strategy, finance, business.
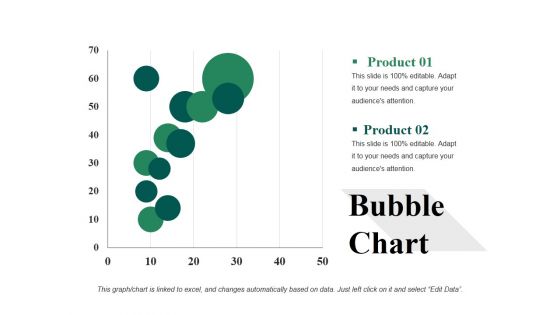
Bubble Chart Ppt PowerPoint Presentation Infographic Template Example 2015
This is a bubble chart ppt powerpoint presentation infographic template example 2015. This is a two stage process. The stages in this process are analysis, strategy, finance, business, bubble chart.

Clustered Chart Ppt PowerPoint Presentation Gallery Background Images
This is a clustered chart ppt powerpoint presentation gallery background images. This is a two stage process. The stages in this process are clustered chart, analysis, strategy, finance, business.
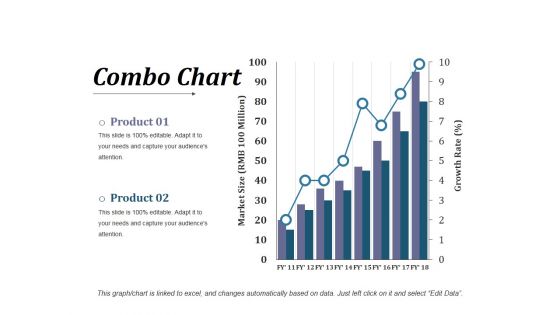
Combo Chart Ppt PowerPoint Presentation Infographic Template Visuals
This is a combo chart ppt powerpoint presentation infographic template visuals. This is a three stage process. The stages in this process are business, finance, strategy, analysis, combo chart.
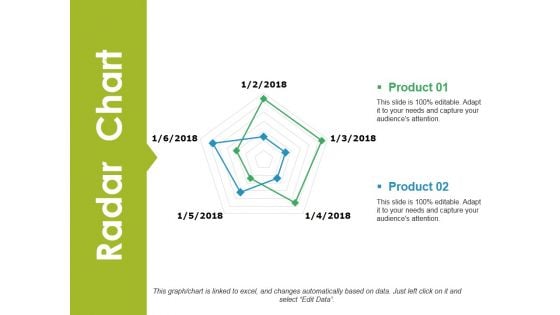
Radar Chart Ppt PowerPoint Presentation Infographic Template Tips
This is a radar chart ppt powerpoint presentation infographic template tips. This is a two stage process. The stages in this process are radar chart, business, finance, analysis, strategy.
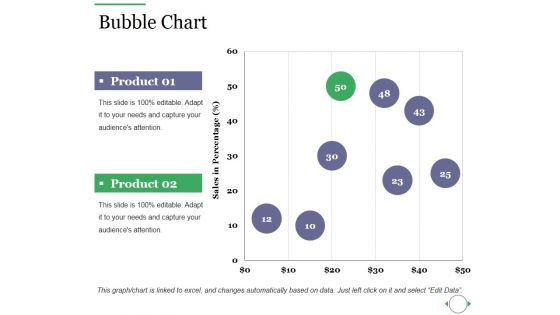
Bubble Chart Ppt PowerPoint Presentation Layouts Graphic Images
This is a bubble chart ppt powerpoint presentation layouts graphic images. This is a two stage process. The stages in this process are bubble chart, finance, marketing, strategy, business, analysis.
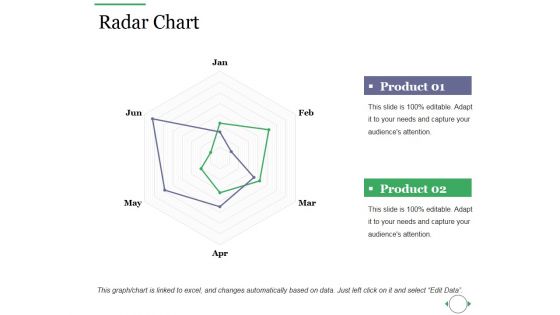
Radar Chart Ppt PowerPoint Presentation Outline Background Images
This is a radar chart ppt powerpoint presentation outline background images. This is a two stage process. The stages in this process are radar chart, finance, marketing, strategy, business.
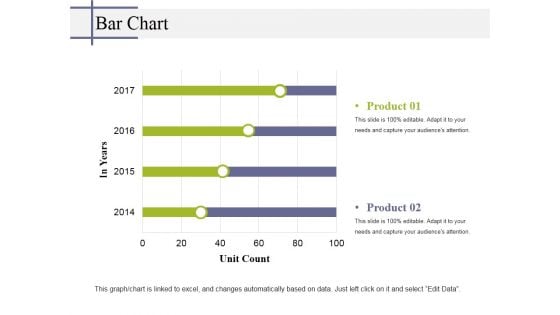
Bar Chart Ppt PowerPoint Presentation Infographic Template Tips
This is a bar chart ppt powerpoint presentation infographic template tips. This is a two stage process. The stages in this process are bar chart, finance, marketing, strategy, business.
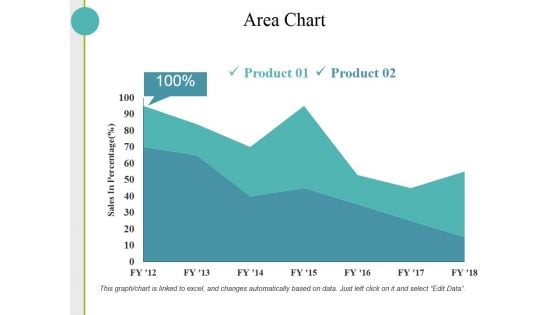
Area Chart Ppt PowerPoint Presentation Slides Visual Aids
This is a area chart ppt powerpoint presentation slides visual aids. This is a two stage process. The stages in this process are area chart, finance, marketing, strategy, business.
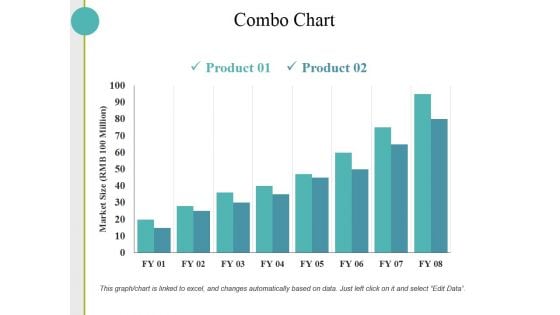
Combo Chart Ppt PowerPoint Presentation Layouts Design Templates
This is a combo chart ppt powerpoint presentation layouts design templates. This is a two stage process. The stages in this process are combo chart, finance, marketing, strategy, analysis, business.
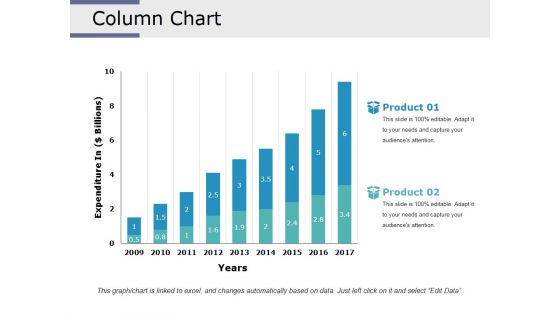
Column Chart Ppt PowerPoint Presentation Infographic Template Designs Download
This is a column chart ppt powerpoint presentation infographic template designs download. This is a two stage process. The stages in this process are column chart, analysis, finance, marketing, strategy, business.
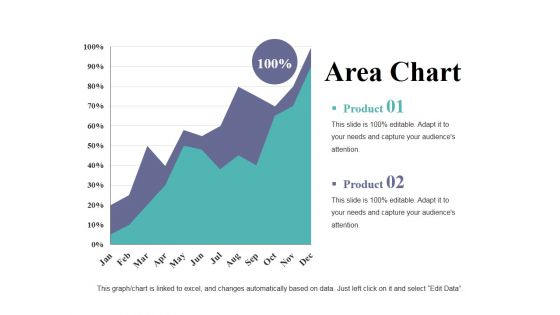
Area Chart Ppt PowerPoint Presentation Professional Graphic Images
This is a area chart ppt powerpoint presentation professional graphic images. This is a two stage process. The stages in this process are area chart, growth, strategy, business, finance, analysis.
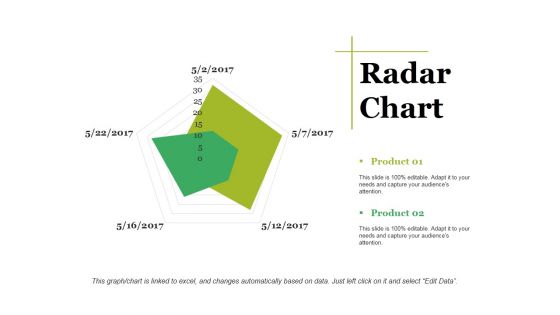
Radar Chart Ppt PowerPoint Presentation Visual Aids Background Images
This is a radar chart ppt powerpoint presentation visual aids background images. This is a two stage process. The stages in this process are radar chart, finance, marketing, strategy, business.

 Home
Home