Policy Icon
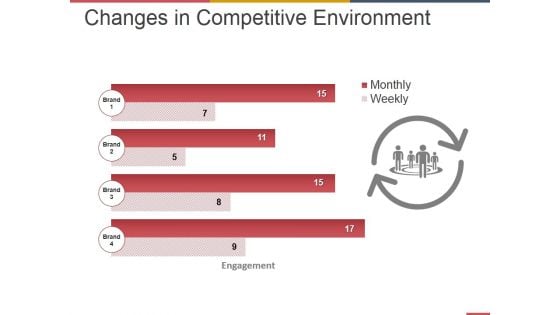
Changes In Competitive Environment Template 2 Ppt PowerPoint Presentation Pictures Ideas
This is a changes in competitive environment template 2 ppt powerpoint presentation pictures ideas. This is a four stage process. The stages in this process are business, strategy, marketing, analysis, engagement, monthly weekly.
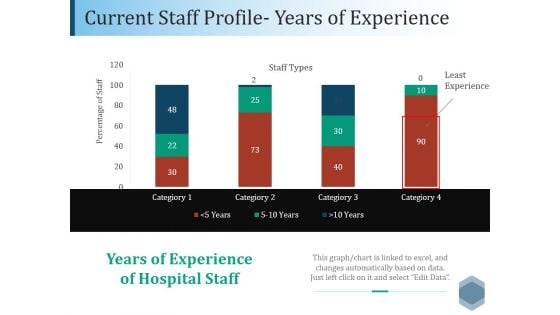
Current Staff Profile Years Of Experience Ppt PowerPoint Presentation File Graphics Tutorials
This is a current staff profile years of experience ppt powerpoint presentation file graphics tutorials. This is a four stage process. The stages in this process are business, marketing, strategy, finance, bar.
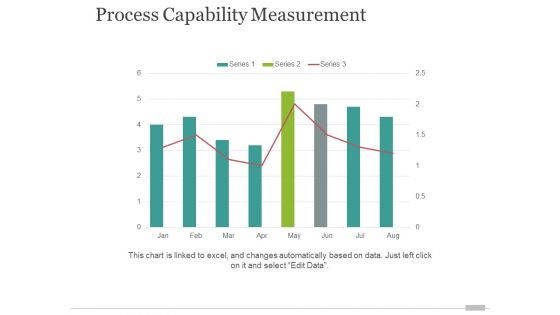
Process Capability Measurement Template 2 Ppt PowerPoint Presentation Gallery Graphics Example
This is a process capability measurement template 2 ppt powerpoint presentation gallery graphics example. This is a eight stage process. The stages in this process are finance, analysis, business, strategy, marketing.
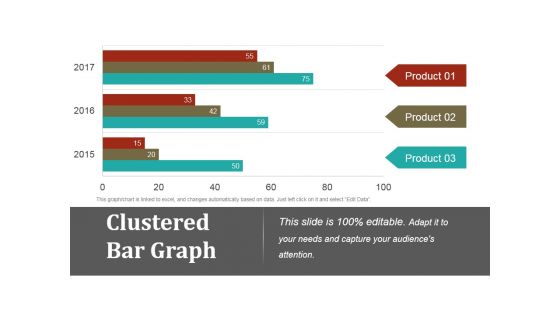
Clustered Bar Graph Ppt PowerPoint Presentation Gallery Graphics Example
This is a clustered bar graph ppt powerpoint presentation gallery graphics example. This is a three stage process. The stages in this process are clustered bar graph, finance, marketing, strategy, business.
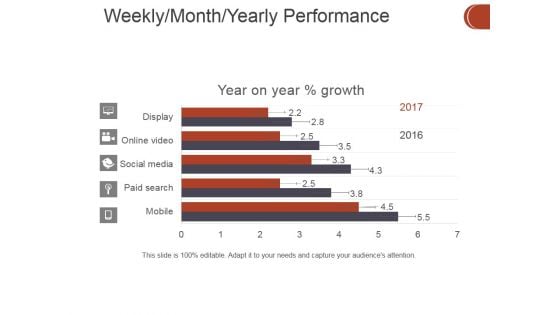
Weekly Month Yearly Performance Ppt PowerPoint Presentation Ideas Maker
This is a weekly month yearly performance ppt powerpoint presentation ideas maker. This is a five stage process. The stages in this process are business, finance, marketing, strategy, analysis, investment.
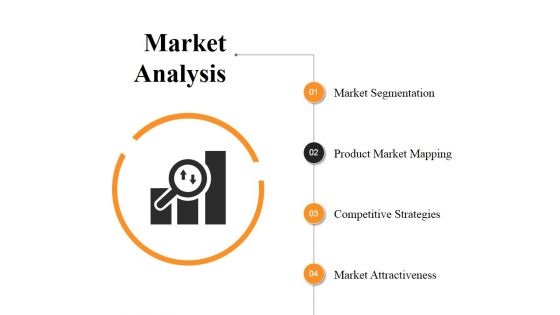
Market Analysis Ppt PowerPoint Presentation Show Design Inspiration
This is a market analysis ppt powerpoint presentation show design inspiration. This is a four stage process. The stages in this process are market segmentation, product market mapping, competitive strategies, market attractiveness.
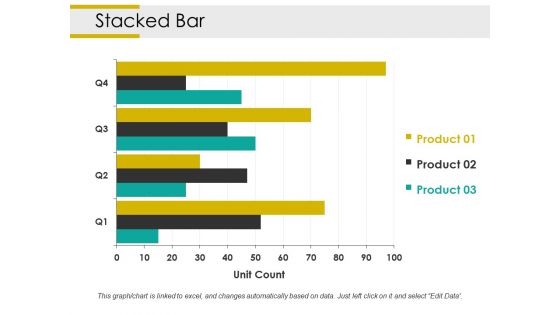
Stacked Bar Ppt PowerPoint Presentation Styles Slide Portrait
This is a stacked bar ppt powerpoint presentation styles slide portrait. This is a three stage process. The stages in this process are unit count, business, marketing, strategy, graph, finance.
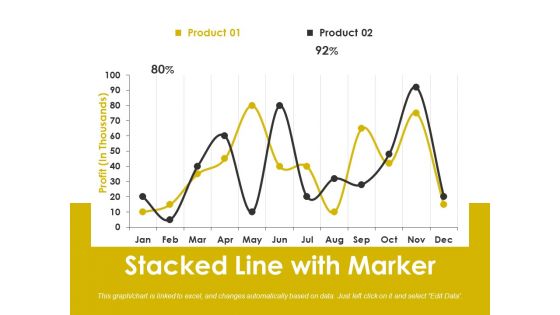
Stacked Line With Marker Ppt PowerPoint Presentation Slides File Formats
This is a stacked line with marker ppt powerpoint presentation slides file formats. This is a two stage process. The stages in this process are business, marketing, strategy, graph, finance, percentage.
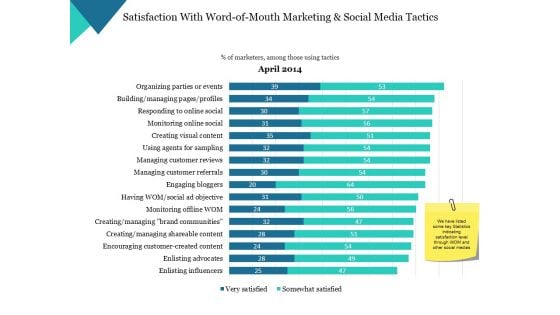
Satisfaction With Word Of Mouth Marketing And Social Media Tactics Ppt PowerPoint Presentation Styles Examples
This is a satisfaction with word of mouth marketing and social media tactics ppt powerpoint presentation styles examples. This is a one stage process. The stages in this process are business, marketing, finance, strategy, graph.
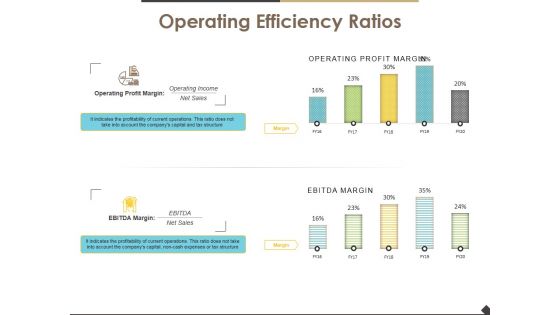
Operating Efficiency Ratios Template 1 Ppt PowerPoint Presentation Layouts Introduction
This is a operating efficiency ratios template 1 ppt powerpoint presentation layouts introduction. This is a two stage process. The stages in this process are operating efficiency ratios, finance, marketing, strategy, business.
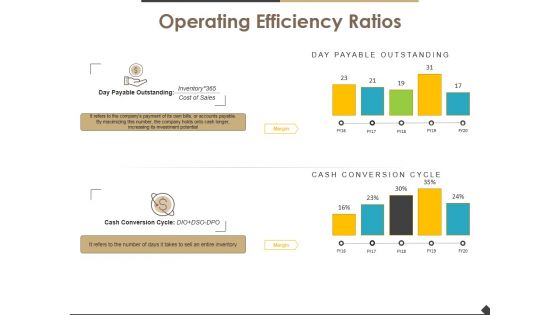
Operating Efficiency Ratios Template 2 Ppt PowerPoint Presentation Infographic Template Guide
This is a operating efficiency ratios template 2 ppt powerpoint presentation infographic template guide. This is a two stage process. The stages in this process are operating efficiency ratios, finance, marketing, strategy, business.
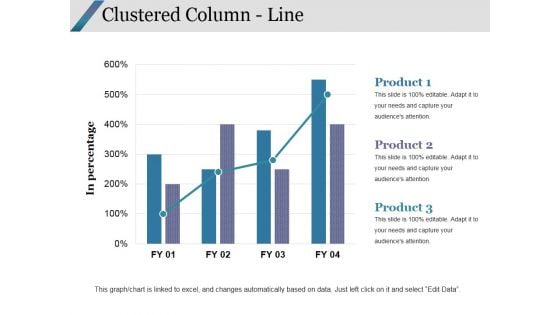
Clustered Column Line Ppt PowerPoint Presentation Portfolio Good
This is a clustered column line ppt powerpoint presentation portfolio good. This is a three stage process. The stages in this process are clustered column line, finance, marketing, strategy, analysis, business.
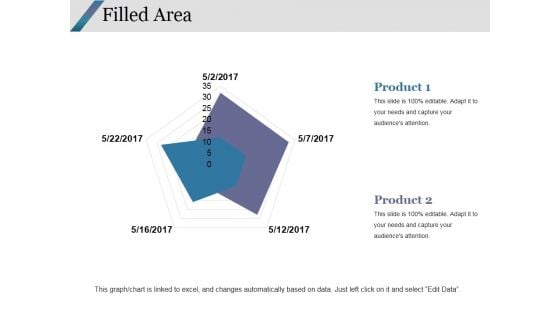
Filled Area Ppt PowerPoint Presentation Infographics Graphics Design
This is a filled area ppt powerpoint presentation infographics graphics design. This is a two stage process. The stages in this process are filled area, finance, marketing, strategy, analysis.
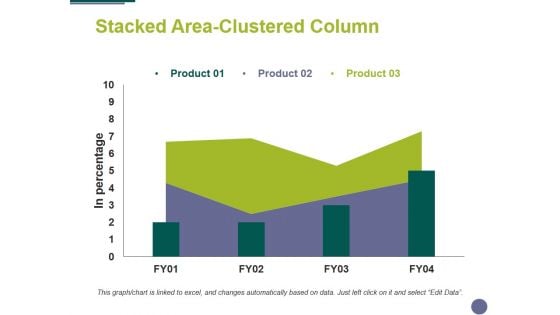
Stacked Area Clustered Column Ppt PowerPoint Presentation Ideas Objects
This is a stacked area clustered column ppt powerpoint presentation ideas objects. This is a three stage process. The stages in this process are finance, marketing, analysis, business, strategy.
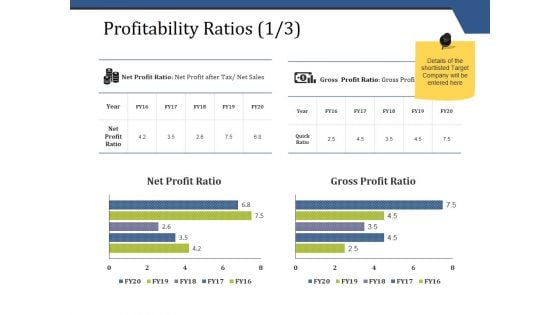
Profitability Ratios Template 1 Ppt PowerPoint Presentation Infographics Mockup
This is a profitability ratios template 1 ppt powerpoint presentation infographics mockup. This is a two stage process. The stages in this process are business, finance, marketing, strategy, analysis.
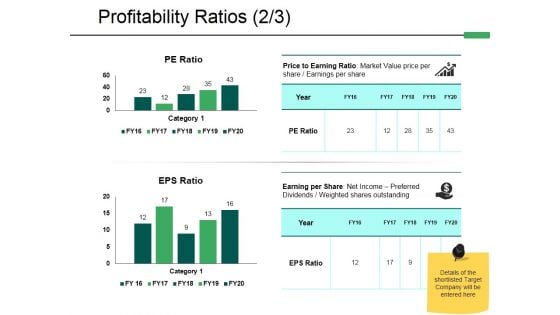
Profitability Ratios Template 2 Ppt PowerPoint Presentation File Graphics
This is a profitability ratios template 2 ppt powerpoint presentation file graphics. This is a two stage process. The stages in this process are finance, analysis, compere, strategy, business.
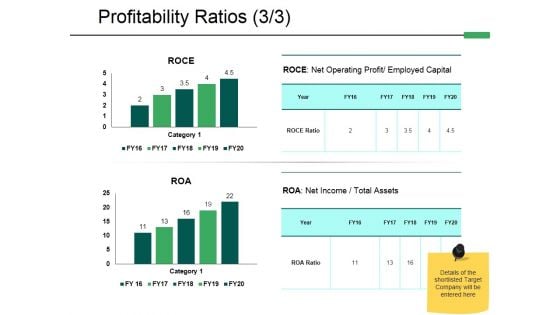
Profitability Ratios Template 3 Ppt PowerPoint Presentation Styles Introduction
This is a profitability ratios template 3 ppt powerpoint presentation styles introduction. This is a two stage process. The stages in this process are finance, analysis, compere, strategy, business.
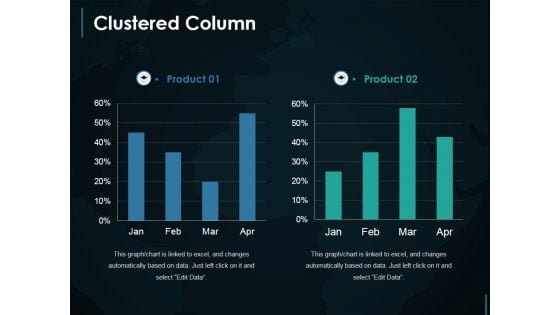
Clustered Column Ppt PowerPoint Presentation Layouts Deck
This is a clustered column ppt powerpoint presentation layouts deck. This is a two stage process. The stages in this process are clustered column, finance, marketing, strategy, investment, business.
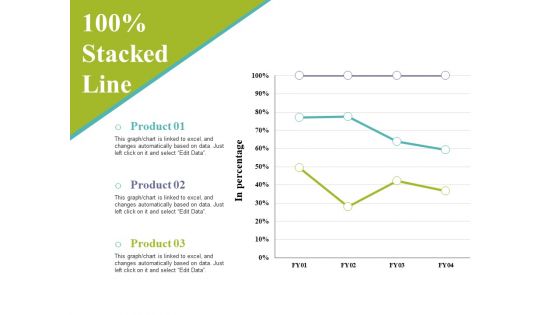
Stacked Line Ppt PowerPoint Presentation Layouts Sample
This is a stacked line ppt powerpoint presentation layouts sample. This is a three stage process. The stages in this process are in percentage, business, marketing, finance, graph, strategy.
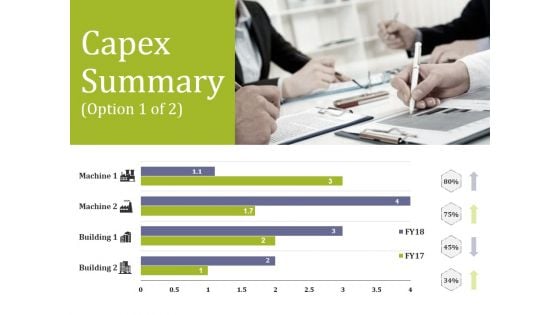
Capex Summary Template 1 Ppt PowerPoint Presentation Professional Mockup
This is a capex summary template 1 ppt powerpoint presentation professional mockup. This is a four stage process. The stages in this process are finance, analysis, business, marketing, strategy.
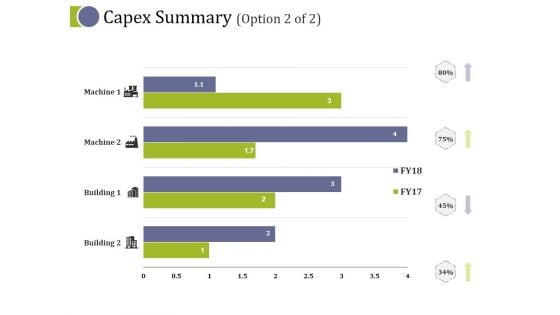
Capex Summary Template 2 Ppt PowerPoint Presentation Layouts Layout Ideas
This is a capex summary template 2 ppt powerpoint presentation layouts layout ideas. This is a four stage process. The stages in this process are finance, analysis, business, marketing, strategy.
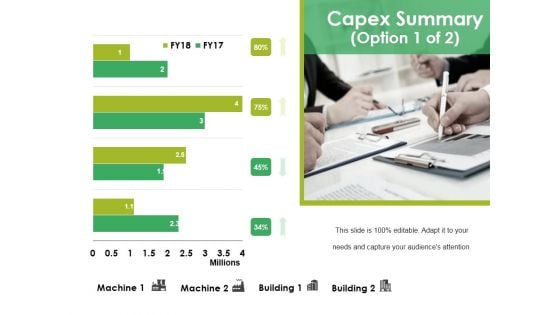
Capex Summary Template 1 Ppt PowerPoint Presentation Infographics Mockup
This is a capex summary template 1 ppt powerpoint presentation infographics mockup. This is a four stage process. The stages in this process are finance, marketing, business, analysis, strategy.
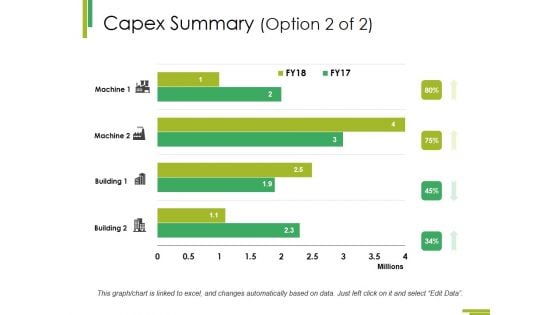
Capex Summary Template 2 Ppt PowerPoint Presentation Inspiration Samples
This is a capex summary template 2 ppt powerpoint presentation inspiration samples. This is a four stage process. The stages in this process are finance, marketing, business, analysis, strategy.
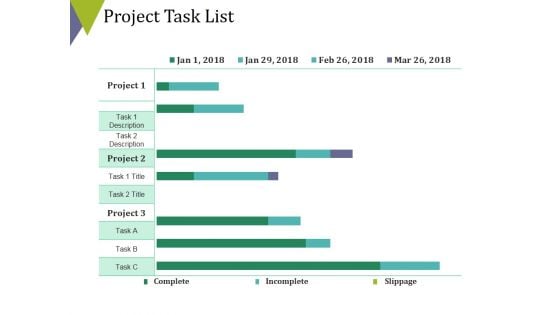
Project Task List Template 2 Ppt PowerPoint Presentation Infographics Brochure
This is a project task list template 2 ppt powerpoint presentation infographics brochure. This is a three stage process. The stages in this process are finance, business, marketing, analysis, strategy.
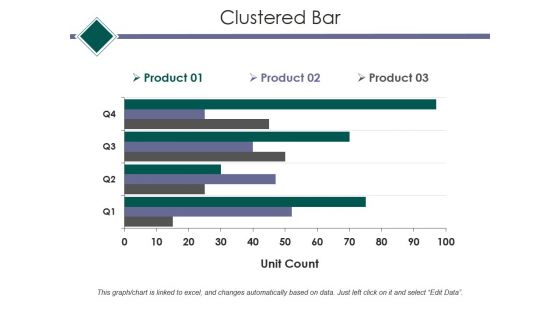
Clustered Bar Ppt PowerPoint Presentation Outline Graphics Design
This is a clustered bar ppt powerpoint presentation outline graphics design. This is a three stage process. The stages in this process are clustered bar, finance, marketing, strategy, analysis, business.
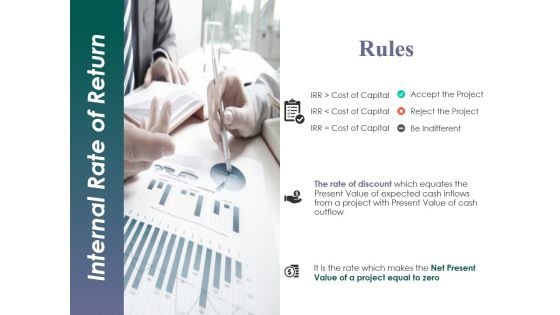
Internal Rate Of Return Template 1 Ppt PowerPoint Presentation Inspiration Skills
This is a internal rate of return template 1 ppt powerpoint presentation inspiration skills. This is a one stage process. The stages in this process are business, finance, marketing, strategy, analysis.
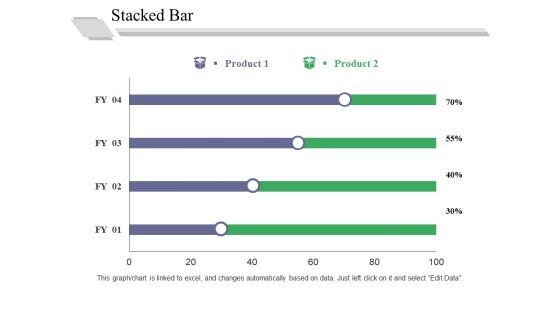
Stacked Bar Template 1 Ppt PowerPoint Presentation Outline Good
This is a stacked bar template 1 ppt powerpoint presentation outline good. This is a two stage process. The stages in this process are in percentage, business, marketing, graph, strategy.
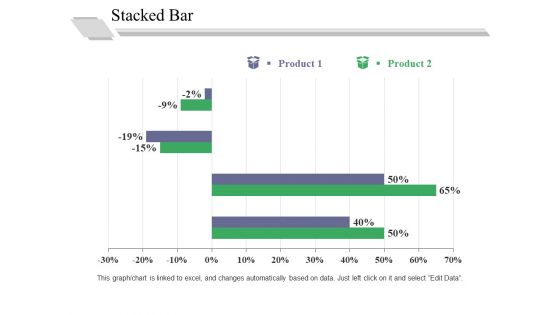
Stacked Bar Template 2 Ppt PowerPoint Presentation Professional Graphics Pictures
This is a stacked bar template 2 ppt powerpoint presentation professional graphics pictures. This is a two stage process. The stages in this process are in percentage, business, marketing, graph, strategy.
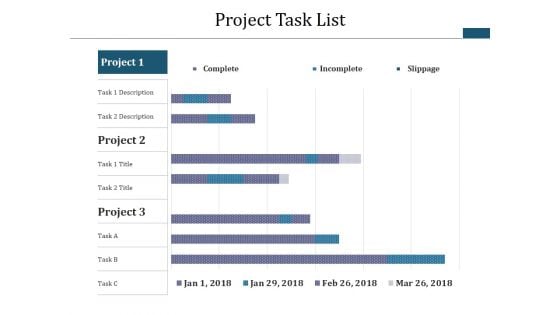
Project Task List Template 2 Ppt PowerPoint Presentation Infographics Example Topics
This is a project task list template 2 ppt powerpoint presentation infographics example topics. This is a three stage process. The stages in this process are business, analysis, strategy, finance, marketing.
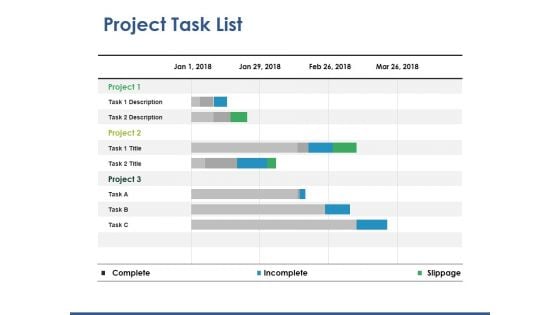
Project Task List Template 2 Ppt PowerPoint Presentation Slides Tips
This is a project task list template 2 ppt powerpoint presentation slides tips. This is a three stage process. The stages in this process are business, finance, marketing, analysis, strategy.
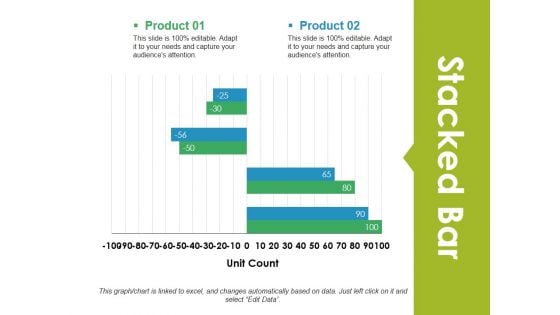
Stacked Bar Ppt PowerPoint Presentation Visual Aids Gallery
This is a stacked bar ppt powerpoint presentation visual aids gallery. This is a two stage process. The stages in this process are stacked bar, analysis, finance, marketing, strategy.
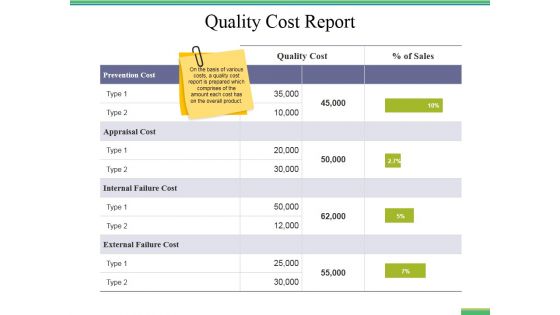
Quality Cost Report Ppt PowerPoint Presentation Styles Infographic Template
This is a quality cost report ppt powerpoint presentation styles infographic template. This is a five stage process. The stages in this process are business, finance, marketing, strategy, bar graph, analysis.
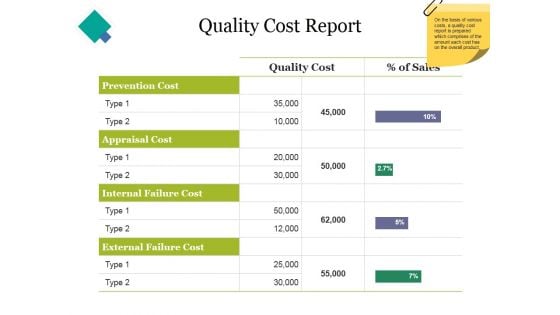
Quality Cost Report Ppt PowerPoint Presentation Styles Graphics Example
This is a quality cost report ppt powerpoint presentation styles graphics example. This is a five stage process. The stages in this process are finance, business, analysis, marketing, strategy.
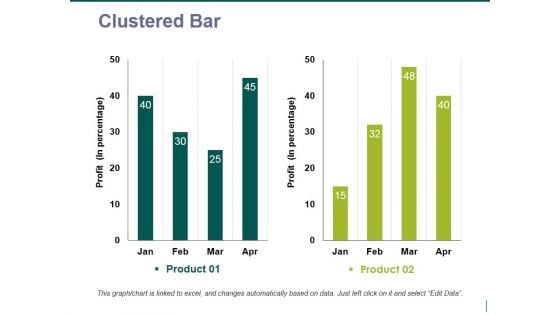
clustered bar ppt powerpoint presentation model display
This is a clustered bar ppt powerpoint presentation model display. This is a two stage process. The stages in this process are clustered bar, finance, marketing, strategy, analysis, business.
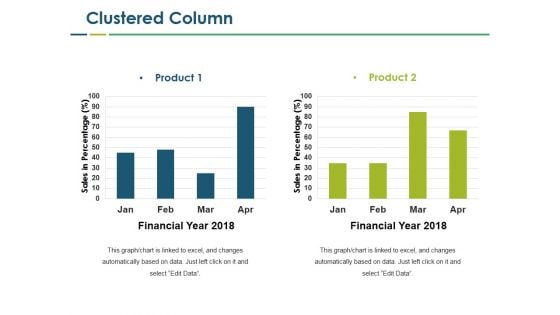
Clustered Column Ppt PowerPoint Presentation Slides Microsoft
This is a clustered column ppt powerpoint presentation slides microsoft. This is a two stage process. The stages in this process are clustered column, finance, marketing, strategy, analysis, business.
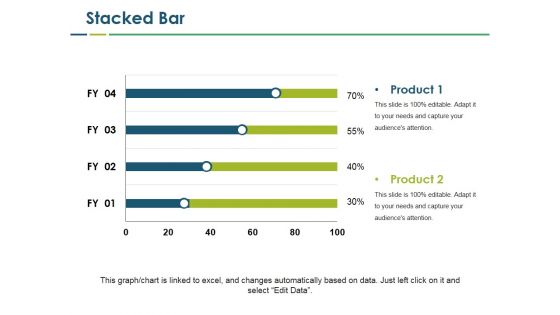
Stacked Bar Ppt PowerPoint Presentation Professional Clipart Images
This is a stacked bar ppt powerpoint presentation professional clipart images. This is a two stage process. The stages in this process are stacked bar, finance, marketing, strategy, business.
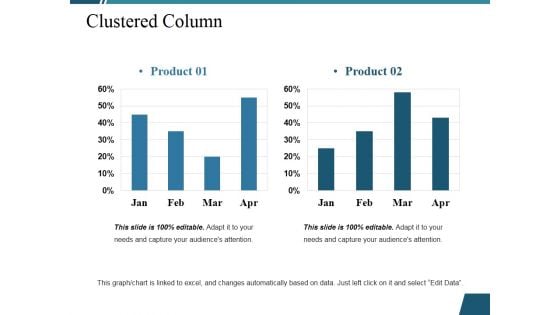
Clustered Column Ppt PowerPoint Presentation Infographic Template Slide Portrait
This is a clustered column ppt powerpoint presentation infographic template slide portrait. This is a two stage process. The stages in this process are clustered column, finance, marketing, strategy, analysis, business.
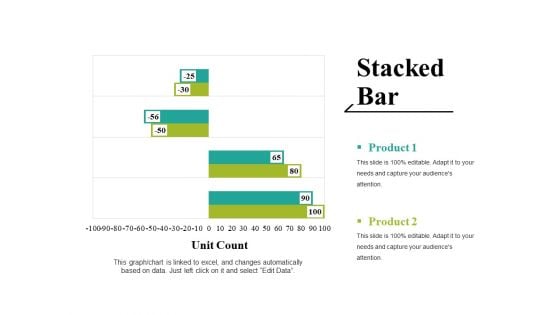
Stacked Bar Ppt PowerPoint Presentation Ideas Graphics Tutorials
This is a stacked bar ppt powerpoint presentation ideas graphics tutorials. This is a two stage process. The stages in this process are unit count, graph, business, marketing, strategy.
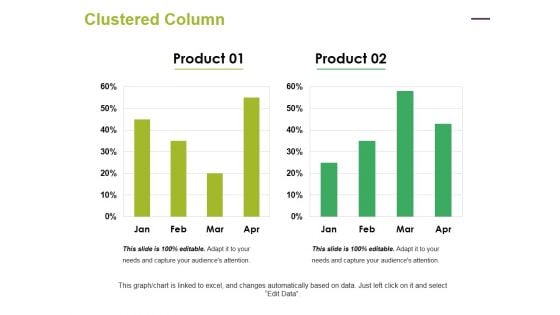
Clustered Column Ppt PowerPoint Presentation Summary Clipart
This is a clustered column ppt powerpoint presentation summary clipart. This is a two stage process. The stages in this process are clustered column, finance, marketing, strategy, analysis, business.
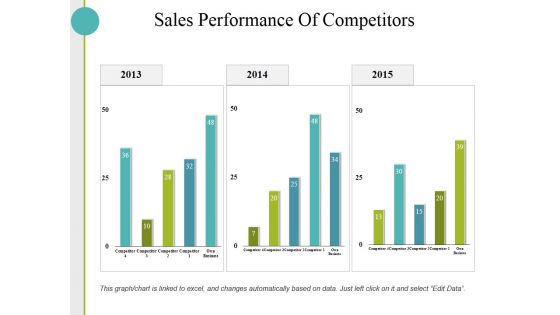
Sales Performance Of Competitors Ppt PowerPoint Presentation Show Graphics Download
This is a sales performance of competitors ppt powerpoint presentation show graphics download. This is a three stage process. The stages in this process are business, finance, marketing, strategy, sales.
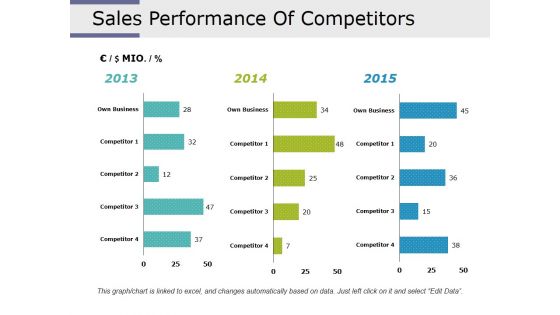
Sales Performance Of Competitors Ppt PowerPoint Presentation Styles Picture
This is a sales performance of competitors ppt powerpoint presentation styles picture. This is a three stage process. The stages in this process are business, finance, analysis, marketing, strategy.
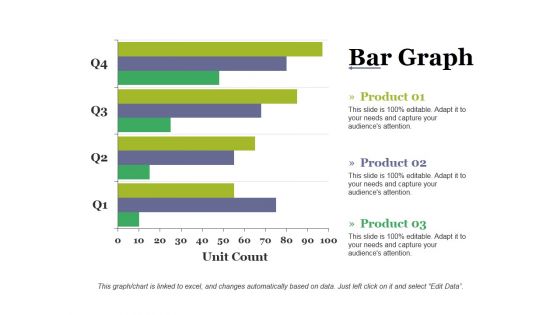
Bar Graph Template 2 Ppt PowerPoint Presentation Inspiration Backgrounds
This is a bar graph template 2 ppt powerpoint presentation inspiration backgrounds. This is a four stage process. The stages in this process are bar graph, finance, analysis, marketing, strategy.
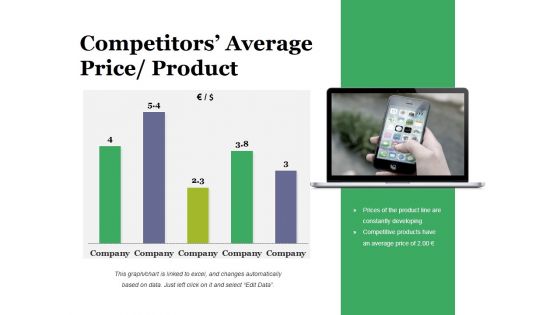
Competitors Average Price Product Ppt PowerPoint Presentation Styles Ideas
This is a competitors average price product ppt powerpoint presentation styles ideas. This is a five stage process. The stages in this process are business, bar graph, finance, marketing, strategy, analysis.
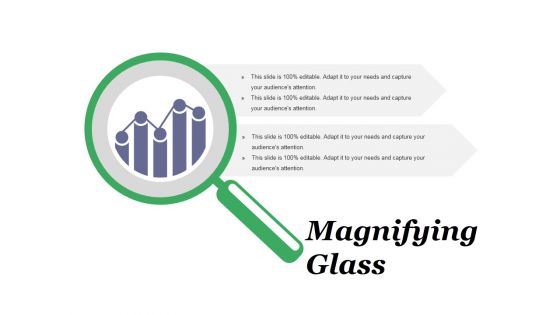
Magnifying Glass Ppt PowerPoint Presentation Infographic Template Example File
This is a magnifying glass ppt powerpoint presentation infographic template example file. This is a two stage process. The stages in this process are magnifying glass, gears, technology, marketing, strategy, business.
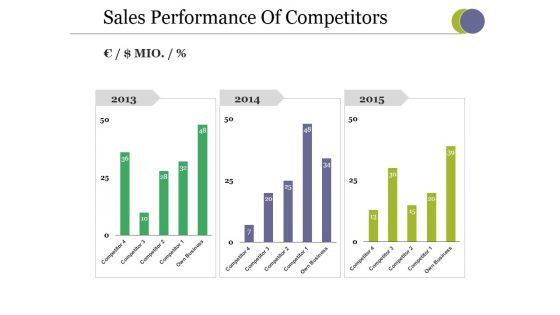
Sales Performance Of Competitors Ppt PowerPoint Presentation Pictures Gallery
This is a sales performance of competitors ppt powerpoint presentation pictures gallery. This is a three stage process. The stages in this process are business, finance, analysis, marketing, strategy.
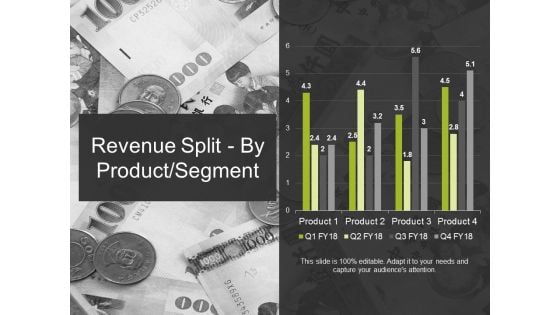
Revenue Split By Product Segment Template 2 Ppt PowerPoint Presentation Ideas Graphic Images
This is a revenue split by product segment template 2 ppt powerpoint presentation ideas graphic images. This is a four stage process. The stages in this process are business, marketing, finance, graph, strategy.
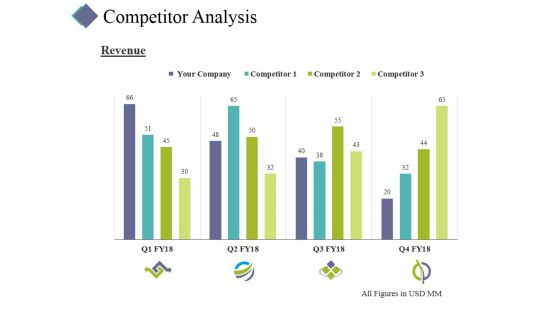
Competitor Analysis Template 1 Ppt PowerPoint Presentation Portfolio Inspiration
This is a competitor analysis template 1 ppt powerpoint presentation portfolio inspiration. This is a four stage process. The stages in this process are competitor, finance, marketing, strategy, analysis, business.
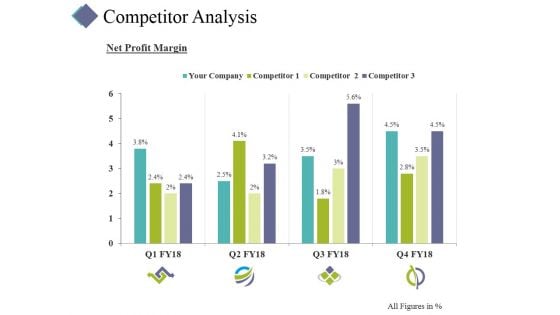
Competitor Analysis Template 4 Ppt PowerPoint Presentation Graphics
This is a competitor analysis template 4 ppt powerpoint presentation graphics. This is a four stage process. The stages in this process are competitor, finance, marketing, strategy, analysis, business.
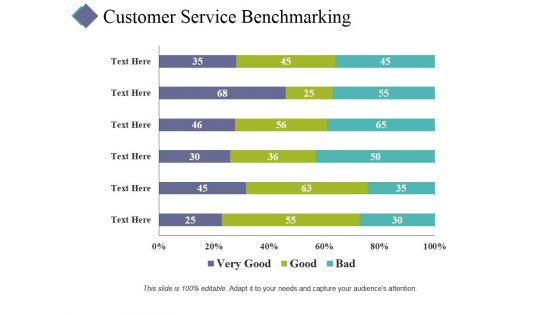
Customer Service Benchmarking Template 1 Ppt PowerPoint Presentation Infographic Template Shapes
This is a customer service benchmarking template 1 ppt powerpoint presentation infographic template shapes. This is a three stage process. The stages in this process are business, finance, marketing, strategy, analysis.
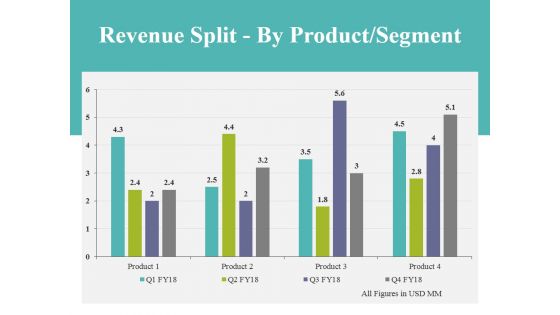
Revenue Split By Product Segment Template 2 Ppt PowerPoint Presentation Styles Guidelines
This is a revenue split by product segment template 2 ppt powerpoint presentation styles guidelines. This is a four stage process. The stages in this process are business, finance, analysis, marketing, strategy.
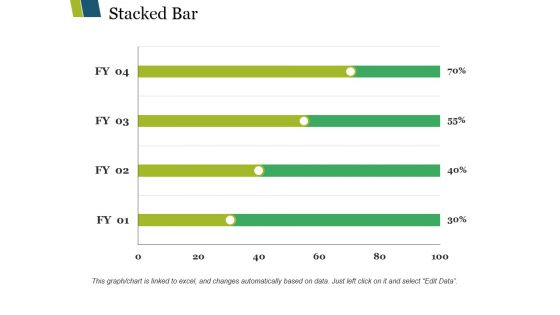
Stacked Bar Ppt PowerPoint Presentation Layouts Show
This is a stacked bar ppt powerpoint presentation layouts show. This is a four stage process. The stages in this process are stacked bar, finance, analysis, marketing, strategy, business.
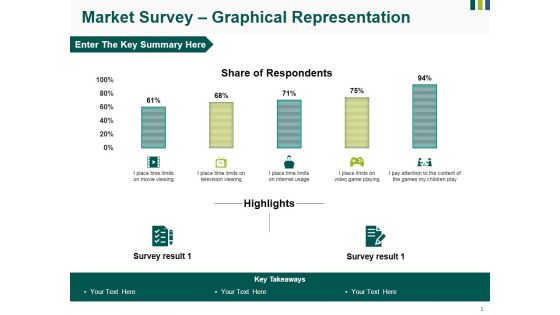
Market Survey Graphical Representation Ppt PowerPoint Presentation Gallery Pictures
This is a market survey graphical representation ppt powerpoint presentation gallery pictures. This is a five stage process. The stages in this process are business, marketing, finance, shares of market, growth strategy.
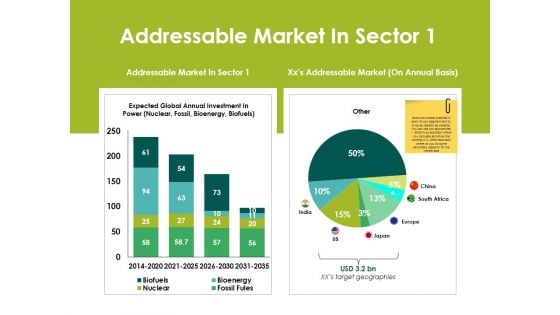
Addressable Market In Sector Ppt PowerPoint Presentation Layouts Designs
This is a addressable market in sector ppt powerpoint presentation layouts designs. This is a two stage process. The stages in this process are business, finance, marketing, strategy, investment.
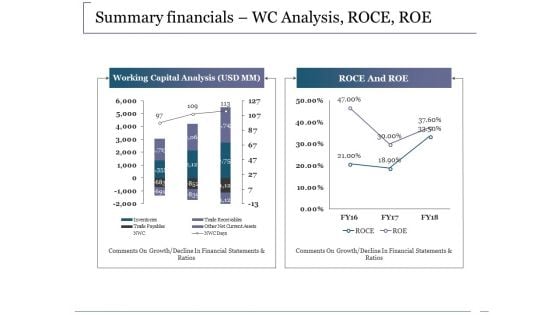
Summary Financials Wc Analysis Roce Roe Ppt PowerPoint Presentation Summary Picture
This is a summary financials wc analysis roce roe ppt powerpoint presentation summary picture. This is a two stage process. The stages in this process are business, marketing, working capital analysis, roce and roe, strategy.
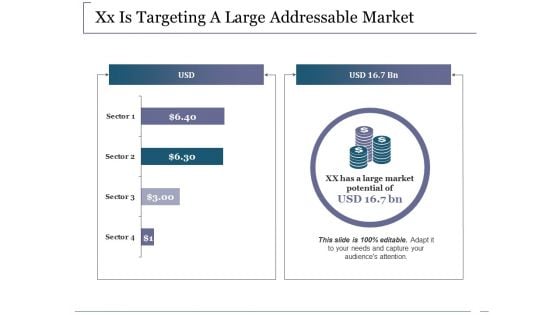
Xx Is Targeting A Large Addressable Market Ppt PowerPoint Presentation Portfolio File Formats
This is a xx is targeting a large addressable market ppt powerpoint presentation portfolio file formats. This is a two stage process. The stages in this process are usd, business, marketing, finance, graph, strategy.
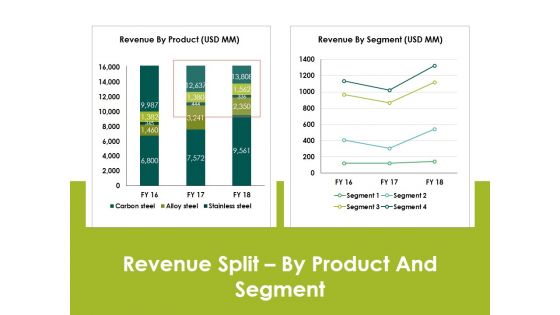
Revenue Splitby Product And Segment Ppt PowerPoint Presentation Styles Example File
This is a revenue splitby product and segment ppt powerpoint presentation styles example file. This is a two stage process. The stages in this process are revenue by product, revenue by segment, finance, strategy, business.
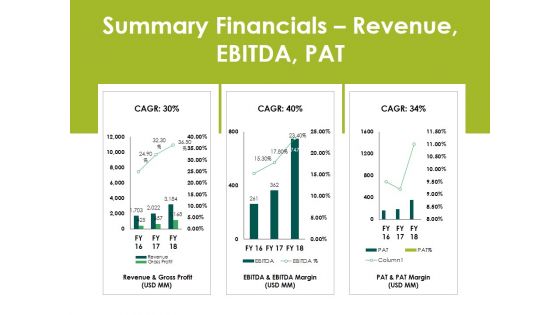
Summary Financials Revenue Ebitda Pat Ppt PowerPoint Presentation Infographics Ideas
This is a summary financials revenue ebitda pat ppt powerpoint presentation infographics ideas. This is a three stage process. The stages in this process are business, finance, analysis, marketing, strategy.
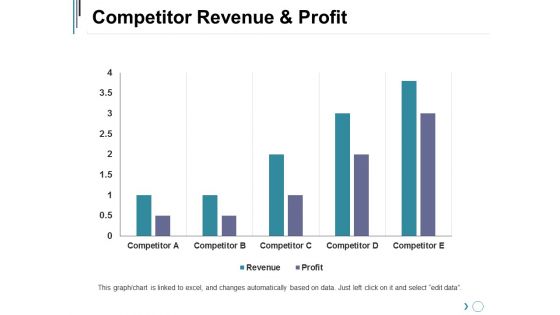
Competitor Revenue And Profit Ppt PowerPoint Presentation Professional Graphics Pictures
This is a competitor revenue and profit ppt powerpoint presentation professional graphics pictures. This is a five stage process. The stages in this process are business, marketing, strategy, graph, finance.
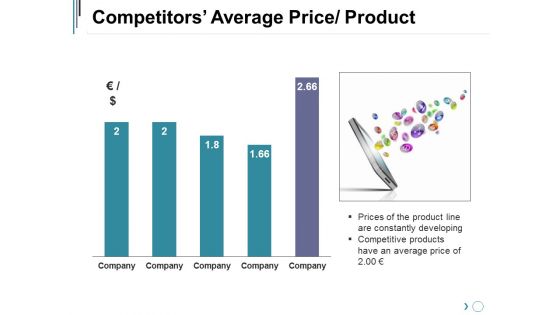
Competitors Average Price Product Ppt PowerPoint Presentation Summary Deck
This is a competitors average price product ppt powerpoint presentation summary deck. This is a five stage process. The stages in this process are business, marketing, strategy, graph, finance.
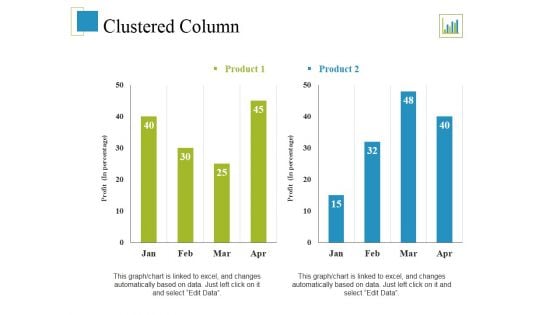
Clustered Column Ppt PowerPoint Presentation Summary Template
This is a clustered column ppt powerpoint presentation summary template. This is a two stage process. The stages in this process are clustered column, finance, marketing, analysis, strategy, business.
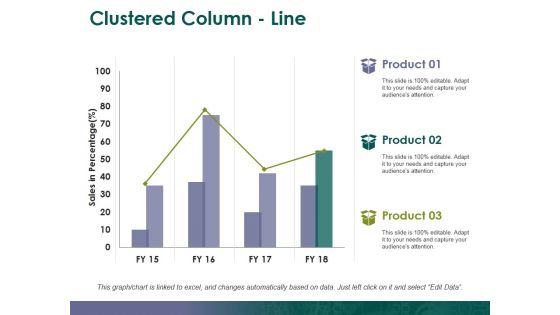
Clustered Column Line Ppt PowerPoint Presentation Summary Slide
This is a clustered column line ppt powerpoint presentation summary slide. This is a three stage process. The stages in this process are clustered column, finance, analysis, strategy, business.
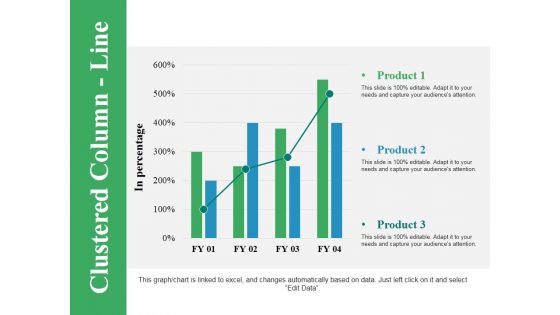
Clustered Column Line Ppt PowerPoint Presentation Pictures Model
This is a clustered column line ppt powerpoint presentation pictures model. This is a three stage process. The stages in this process are bar graph, finance, marketing, strategy, business.
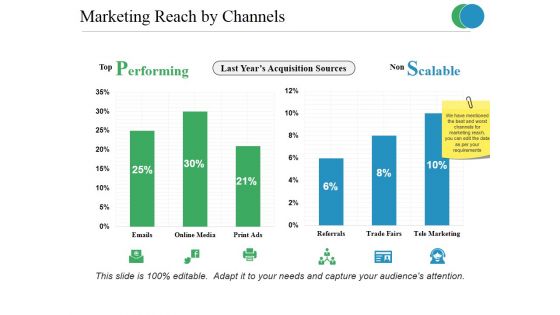
Marketing Reach By Channels Ppt PowerPoint Presentation Infographic Template Background
This is a marketing reach by channels ppt powerpoint presentation infographic template background. This is a two stage process. The stages in this process are performing, scalable, finance, marketing, strategy, business.
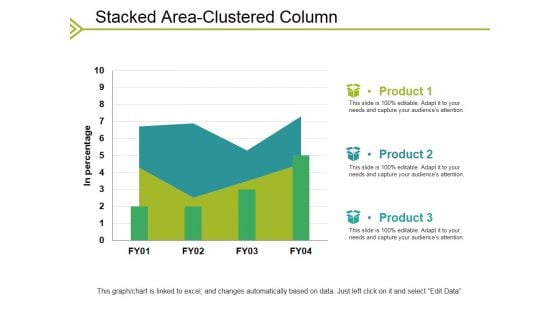
Stacked Area Clustered Column Ppt PowerPoint Presentation Gallery Images
This is a stacked area clustered column ppt powerpoint presentation gallery images. This is a three stage process. The stages in this process are business, in percentage, marketing, strategy, graph.
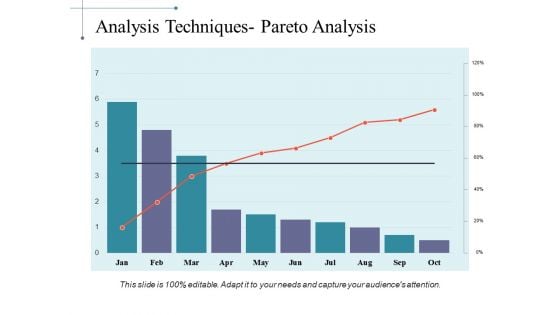
Analysis Techniques Pareto Analysis Ppt PowerPoint Presentation Layouts Ideas
This is a analysis techniques pareto analysis ppt powerpoint presentation layouts ideas. This is a ten stage process. The stages in this process are business, marketing, strategy, finance, analysis.
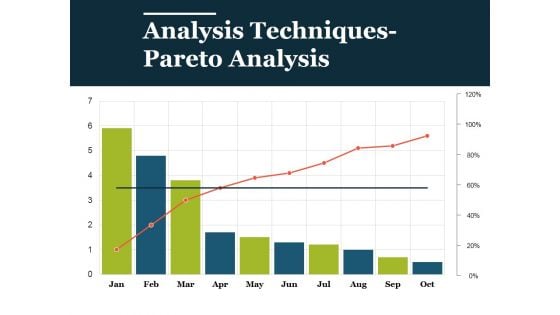
Analysis Techniques Pareto Analysis Ppt PowerPoint Presentation Summary Design Templates
This is a analysis techniques pareto analysis ppt powerpoint presentation summary design templates. This is a ten stage process. The stages in this process are analysis, business, marketing, finance, strategy.
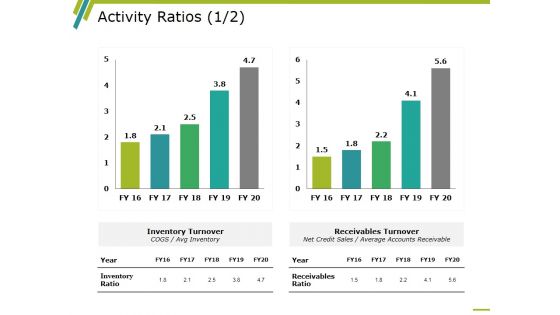
Activity Ratios Template 1 Ppt PowerPoint Presentation Slides Example Topics
This is a activity ratios template 1 ppt powerpoint presentation slides example topics. This is a two stage process. The stages in this process are business, finance, strategy, marketing, analysis.
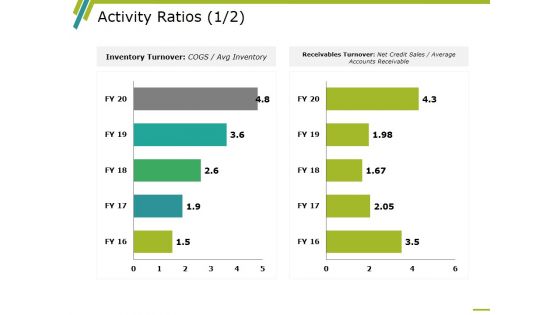
Activity Ratios Template 2 Ppt PowerPoint Presentation Summary Background Images
This is a activity ratios template 2 ppt powerpoint presentation summary background images. This is a two stage process. The stages in this process are business, finance, strategy, marketing, analysis.
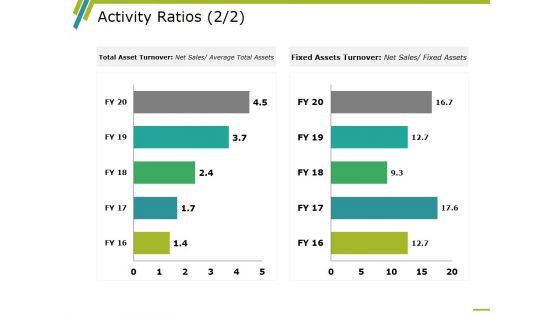
Activity Ratios Template 3 Ppt PowerPoint Presentation Professional Graphic Tips
This is a activity ratios template 3 ppt powerpoint presentation professional graphic tips. This is a two stage process. The stages in this process are business, finance, marketing, strategy, analysis.
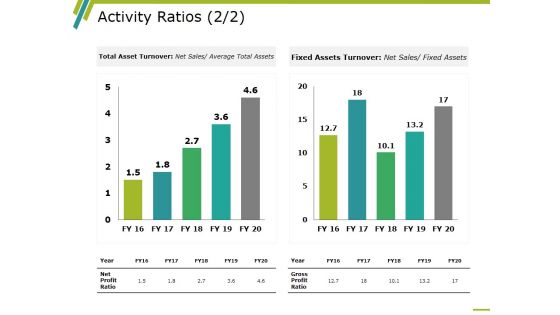
Activity Ratios Template 4 Ppt PowerPoint Presentation Gallery Slides
This is a activity ratios template 4 ppt powerpoint presentation gallery slides. This is a two stage process. The stages in this process are business, finance, marketing, strategy, analysis.
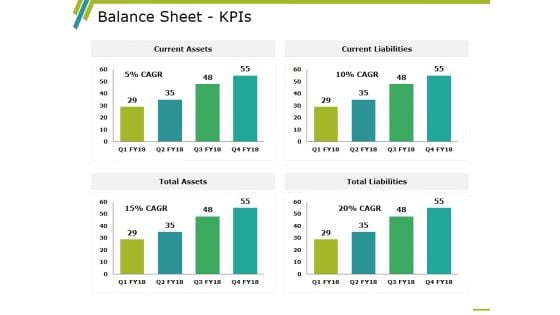
Balance Sheet Kpis Template 3 Ppt PowerPoint Presentation Infographic Template Demonstration
This is a balance sheet kpis template 3 ppt powerpoint presentation infographic template demonstration. This is a four stage process. The stages in this process are balance sheet, finance, marketing, strategy, analysis.
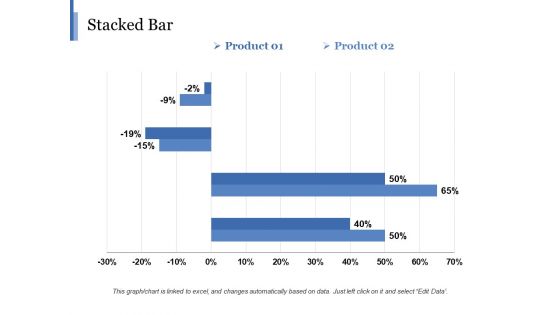
Stacked Bar Template 2 Ppt PowerPoint Presentation Gallery Background
This is a stacked bar template 2 ppt powerpoint presentation gallery background. This is a two stage process. The stages in this process are business, marketing, finance, graph, strategy, percentage.
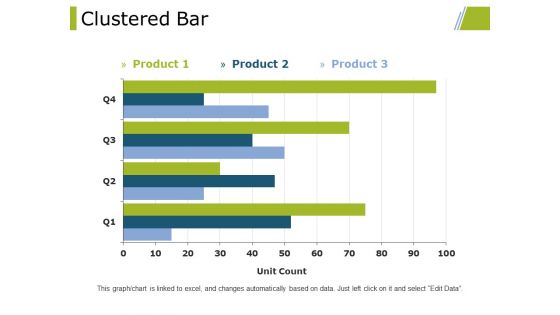
Clustered Bar Ppt PowerPoint Presentation Professional Designs Download
This is a clustered bar ppt powerpoint presentation professional designs download. This is a three stage process. The stages in this process are clustered bar, finance, marketing, strategy, business.
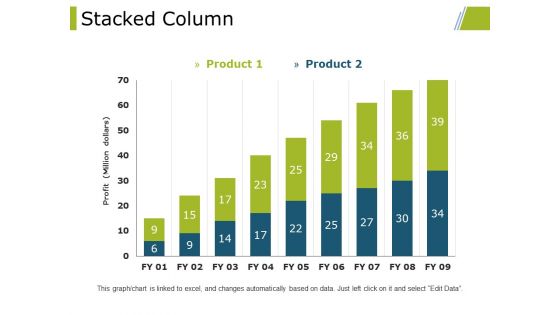
Stacked Column Ppt PowerPoint Presentation Styles Graphic Images
This is a stacked column ppt powerpoint presentation styles graphic images. This is a two stage process. The stages in this process are stacked column, finance, marketing, strategy, business.
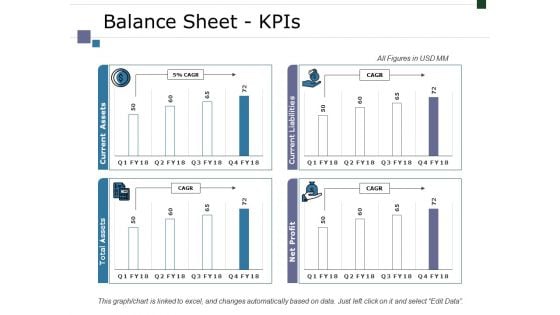
Balance Sheet Kpis Ppt PowerPoint Presentation Infographic Template Designs
This is a balance sheet kpis ppt powerpoint presentation infographic template designs. This is a four stage process. The stages in this process are business, marketing, finance, graph, strategy.
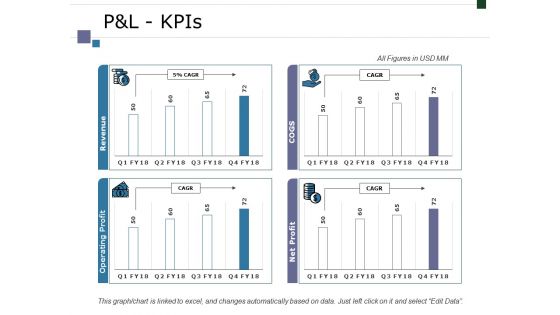
Pandl Kpis Ppt PowerPoint Presentation Infographic Template Graphics Tutorials
This is a pandl kpis ppt powerpoint presentation infographic template graphics tutorials. This is a four stage process. The stages in this process are business, marketing, finance, graph, strategy.
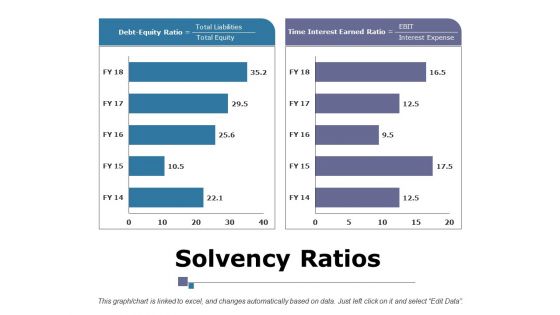
Solvency Ratios Ppt PowerPoint Presentation Summary Layouts
This is a solvency ratios ppt powerpoint presentation summary layouts. This is a two stage process. The stages in this process are business, marketing, strategy, debt equity ratio, time interest earned ratio, finance.
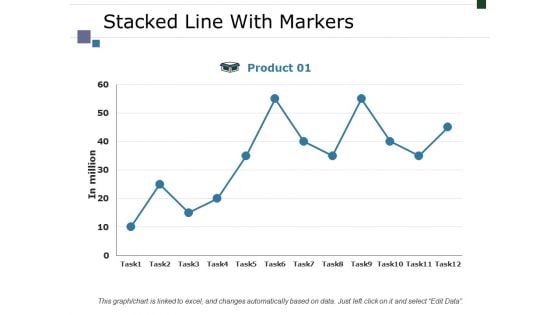
Stacked Line With Markers Ppt PowerPoint Presentation Layouts Display
This is a stacked line with markers ppt powerpoint presentation layouts display. This is a one stage process. The stages in this process are business, marketing, strategy, in million, finance.
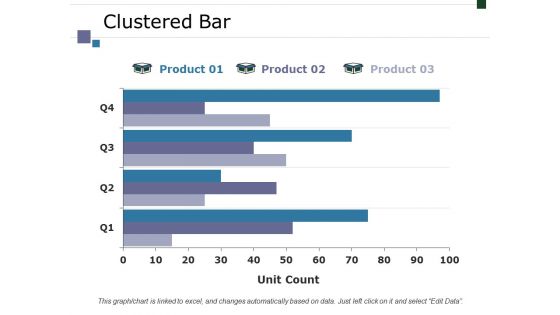
Clustered Bar Ppt PowerPoint Presentation Styles Graphics
This is a clustered bar ppt powerpoint presentation styles graphics. This is a three stage process. The stages in this process are business, marketing, finance, graph, strategy, unit count.
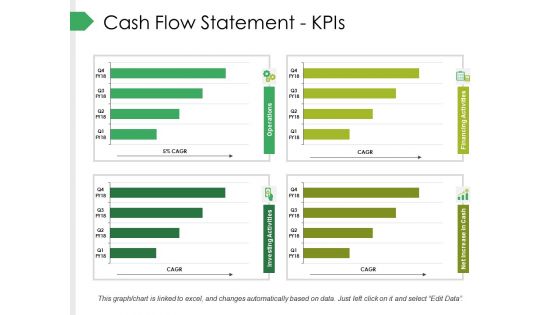
Cash Flow Statement Kpis Ppt PowerPoint Presentation Pictures Graphics
This is a cash flow statement kpis ppt powerpoint presentation pictures graphics. This is a four stage process. The stages in this process are business, marketing, graph, finance, strategy.
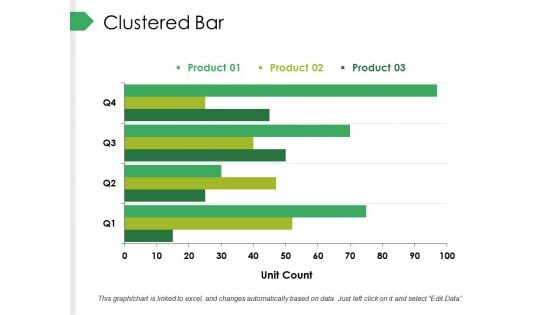
Clustered Bar Ppt PowerPoint Presentation Pictures Clipart Images
This is a clustered bar ppt powerpoint presentation pictures clipart images. This is a three stage process. The stages in this process are business, marketing, graph, finance, strategy, unit count.
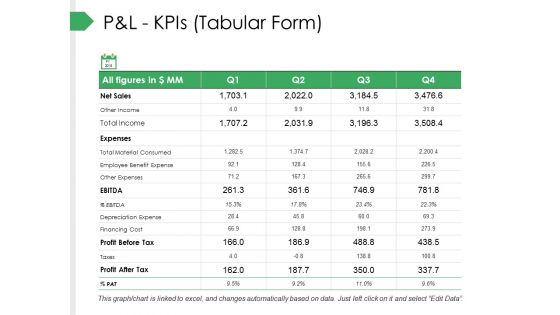
P And L Kpis Tabular Form Ppt PowerPoint Presentation Pictures Gallery
This is a p and l kpis tabular form ppt powerpoint presentation pictures gallery. This is a four stage process. The stages in this process are business, marketing, graph, strategy, finance.
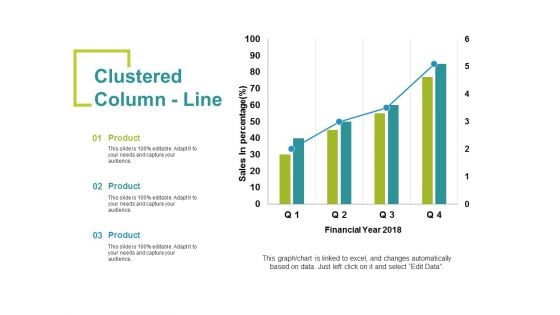
Clustered Column Line Ppt PowerPoint Presentation Summary Example Topics
This is a clustered column line ppt powerpoint presentation summary example topics. This is a four stage process. The stages in this process are clustered column line, growth, marketing, strategy, business.
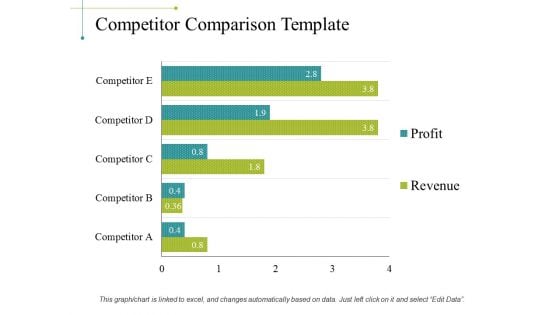
Competitor Comparison Template 1 Ppt PowerPoint Presentation Infographic Template Mockup
This is a competitor comparison template 1 ppt powerpoint presentation infographic template mockup. This is a five stage process. The stages in this process are business, marketing, graph, finance, strategy.
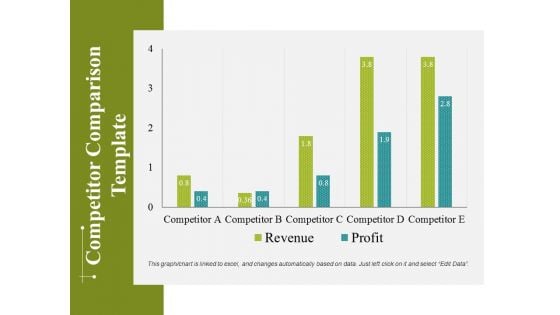
Competitor Comparison Template 2 Ppt PowerPoint Presentation Infographics Objects
This is a competitor comparison template 2 ppt powerpoint presentation infographics objects. This is a five stage process. The stages in this process are business, marketing, graph, finance, strategy.

Competitor Market Share And Sales Revenues Ppt PowerPoint Presentation Summary Influencers
This is a competitor market share and sales revenues ppt powerpoint presentation summary influencers. This is a four stage process. The stages in this process are business, marketing, graph, finance, strategy.
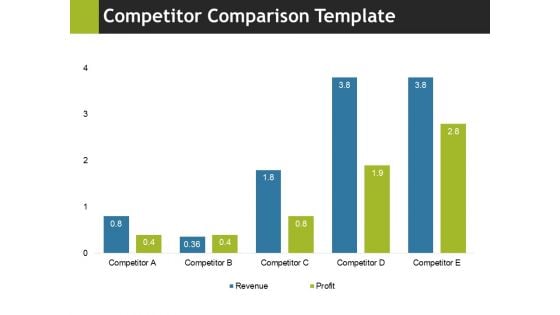
Competitor Comparison Template 1 Ppt PowerPoint Presentation Layouts Slide Portrait
This is a competitor comparison template 1 ppt powerpoint presentation layouts slide portrait. This is a four stage process. The stages in this process are business, marketing, graph, finance, strategy.
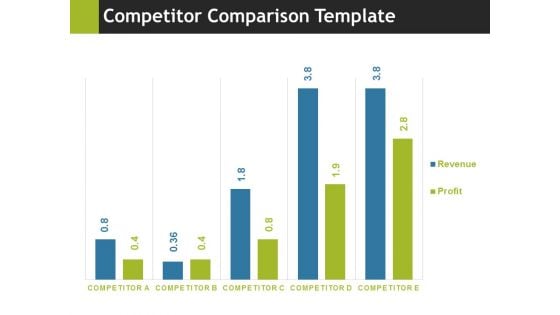
Competitor Comparison Template 2 Ppt PowerPoint Presentation Inspiration Images
This is a competitor comparison template 2 ppt powerpoint presentation inspiration images. This is a five stage process. The stages in this process are business, marketing, graph, finance, strategy.
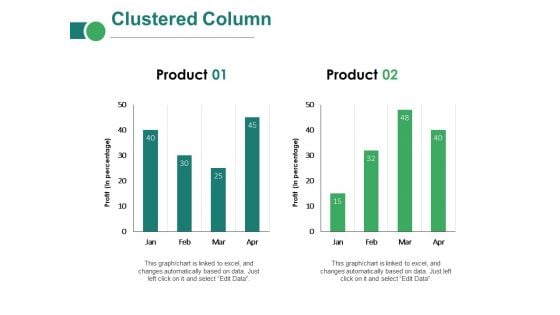
Clustered Column Ppt PowerPoint Presentation Inspiration Introduction
This is a clustered column ppt powerpoint presentation inspiration introduction. This is a two stage process. The stages in this process are business, marketing, in percentage, finance, graph, strategy.
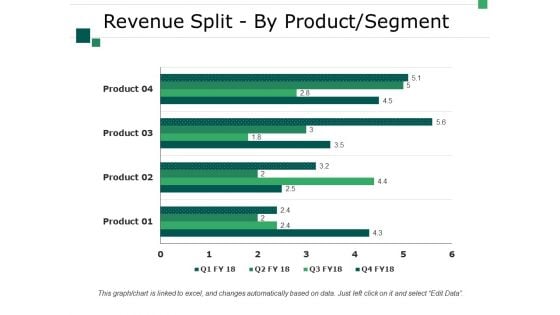
Revenue Split By Product Segment Template 2 Ppt PowerPoint Presentation Summary Good
This is a revenue split by product segment template 2 ppt powerpoint presentation summary good. This is a four stage process. The stages in this process are business, marketing, finance, strategy, graph.
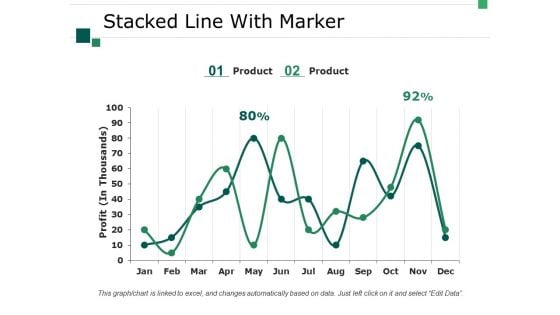
Stacked Line With Marker Ppt PowerPoint Presentation Professional Designs Download
This is a stacked line with marker ppt powerpoint presentation professional designs download. This is a two stage process. The stages in this process are business, marketing, strategy, graph, profit.
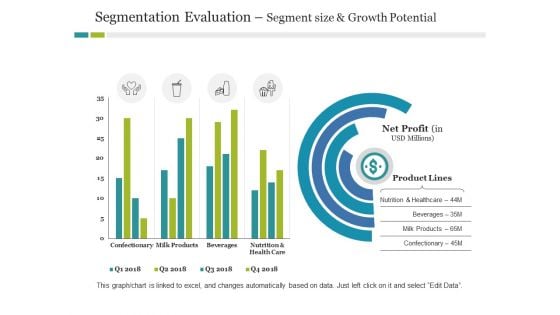
Segmentation Evaluation Segment Size And Growth Potential Ppt PowerPoint Presentation Infographic Template Outline
This is a segmentation evaluation segment size and growth potential ppt powerpoint presentation infographic template outline. This is a two stage process. The stages in this process are business, product lines, finance, marketing, strategy.
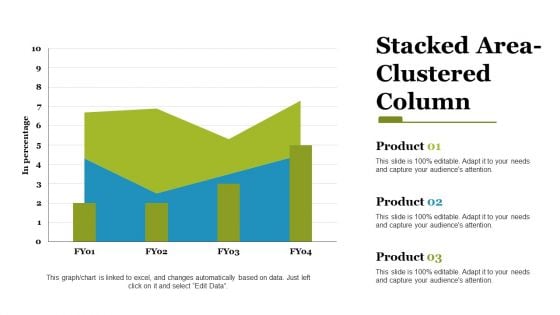
stacked area clustered column ppt powerpoint presentation styles files
This is a stacked area clustered column ppt powerpoint presentation styles files. This is a three stage process. The stages in this process are stacked area, clustered column, finance, marketing, strategy, business.
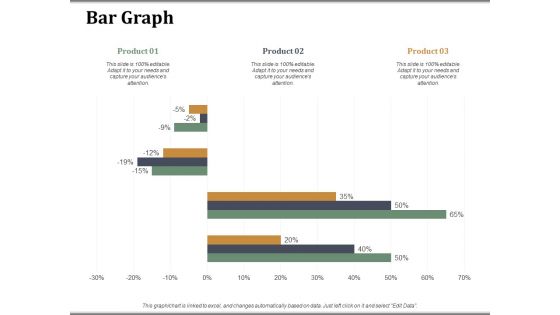
Bar Graph Companys Business Model Canvas Ppt PowerPoint Presentation Visual Aids Model
This is a bar graph companys business model canvas ppt powerpoint presentation visual aids model. This is a three stage process. The stages in this process are bar graph, finance, marketing, strategy, analysis, business.
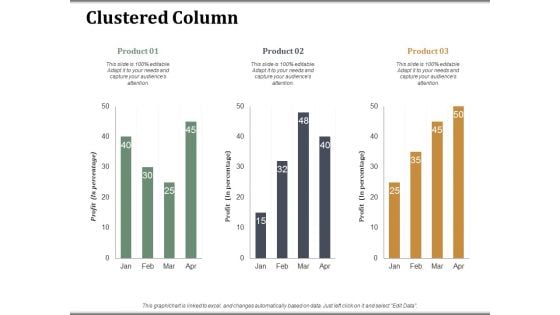
Clustered Column Companys Business Model Canvas Ppt PowerPoint Presentation Slides Topics
This is a clustered column companys business model canvas ppt powerpoint presentation slides topics. This is a three stage process. The stages in this process are clustered column, finance, marketing, strategy, analysis, investment.
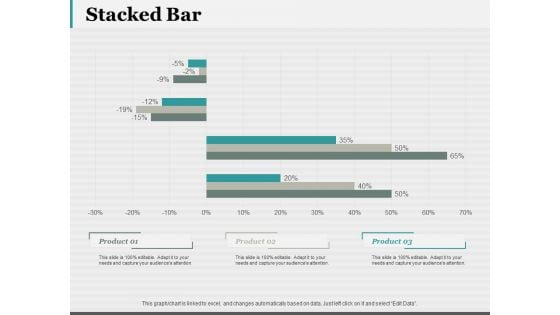
Stacked Bar 7 QC Tools Ppt PowerPoint Presentation Portfolio Smartart
This is a stacked bar 7 qc tools ppt powerpoint presentation portfolio smartart. This is a three stage process. The stages in this process are stacked bar, finance, marketing, strategy, business.
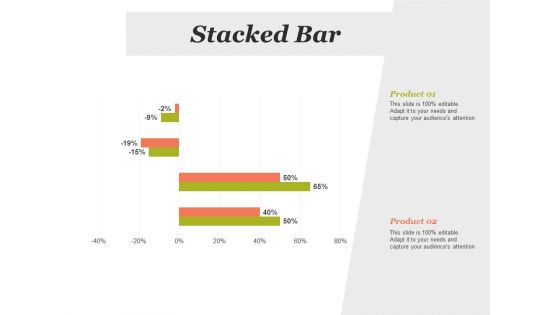
Stacked Bar Financial Analysis Ppt PowerPoint Presentation Infographic Template Slides
This is a stacked bar financial analysis ppt powerpoint presentation infographic template slides. This is a two stage process. The stages in this process are stacked bar, finance, marketing, strategy, analysis.
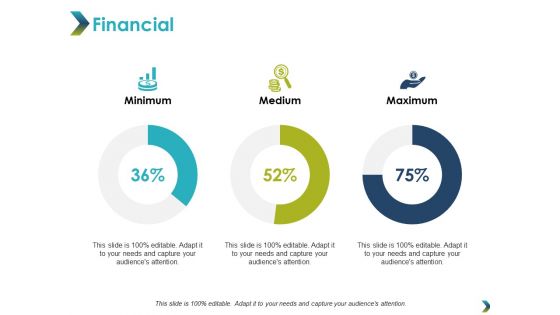
Financial Minimum Maximum Ppt PowerPoint Presentation Infographic Template Picture
This is a financial minimum maximum ppt powerpoint presentation infographic template picture. This is a three stage process. The stages in this process are financial, minimum, maximum, marketing, strategy.
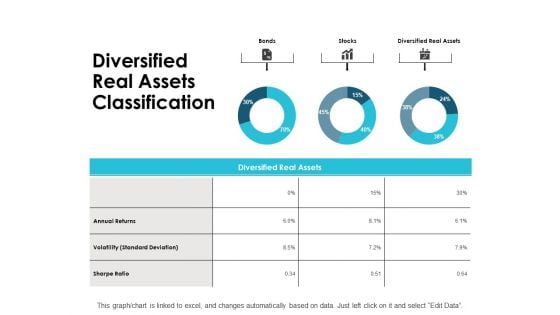
Diversified Real Assets Classification Ppt PowerPoint Presentation Ideas Graphics
This is a diversified real assets classification ppt powerpoint presentation ideas graphics. This is a three stage process. The stages in this process are management, marketing, business, strategy, finance.
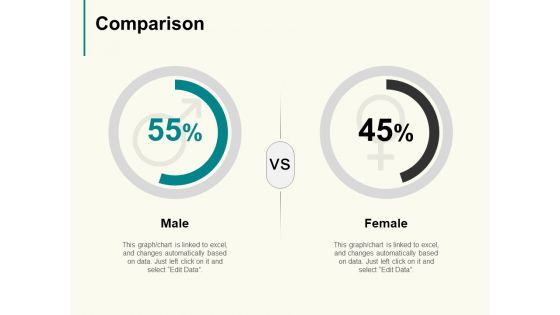
Comparison Male Female Marketing Ppt PowerPoint Presentation Outline Structure
This is a comparison male female marketing ppt powerpoint presentation outline structure. This is a two stage process. The stages in this process are comparison, male, female, marketing, strategy.
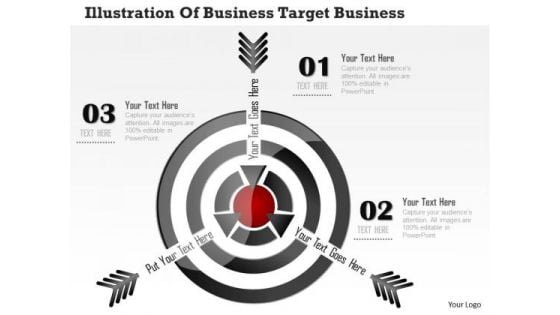
Consulting Slides Illustration Of Business Target Business Presentation
This diagram displays business target with arrows. This diagram may used to depict goal. Use this diagram, in your presentations to express view on growth, success and achievements. This diagram may also be used to display different business strategies. Create eye-catching presentations using this diagram.
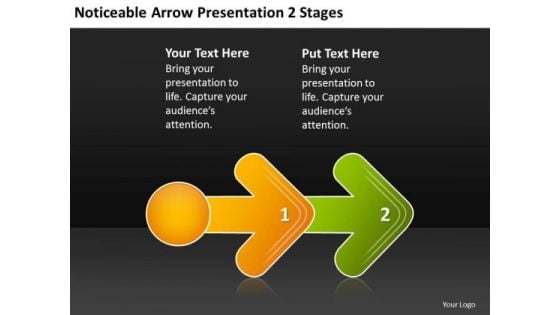
Noticeable Arrow Presentation 2 Stages Creating Flowchart PowerPoint Slides
We present our noticeable arrow presentation 2 stages creating flowchart PowerPoint Slides.Download our Arrows PowerPoint Templates because you can asked to strive to give true form to your great dream. Use our Symbol PowerPoint Templates because Our Template designs are State of the Art. Download and present our Leadership PowerPoint Templates because you are the star of your enlightened team. Download our Process and Flows PowerPoint Templates because clarity of thought has been the key to your growth. Present our Business PowerPoint Templates because everybody knows The world over it is a priority for many. Along with it there are so many oppurtunities waiting to be utilised.Use these PowerPoint slides for presentations relating to Abstract, Arrow, Arrows, Business, Chart, Design, Development, Diagram, Direction, Element, Flow, Flowchart, Graph, Linear, Management, Model, Motion, Organization, Plan, Process, Program, Section, Segment, Set, Sign, Solution, Strategy, Symbol, Technology. The prominent colors used in the PowerPoint template are White, Green, Yellow. Customers tell us our noticeable arrow presentation 2 stages creating flowchart PowerPoint Slides are Fancy. The feedback we get is that our Development PowerPoint templates and PPT Slides are Sparkling. Professionals tell us our noticeable arrow presentation 2 stages creating flowchart PowerPoint Slides are Awesome. People tell us our Development PowerPoint templates and PPT Slides are Versatile. Customers tell us our noticeable arrow presentation 2 stages creating flowchart PowerPoint Slides will make the presenter look like a pro even if they are not computer savvy. Professionals tell us our Development PowerPoint templates and PPT Slides are Stylish. Restore faith with our Noticeable Arrow Presentation 2 Stages Creating Flowchart PowerPoint Slides. Download without worries with our money back guaranteee.
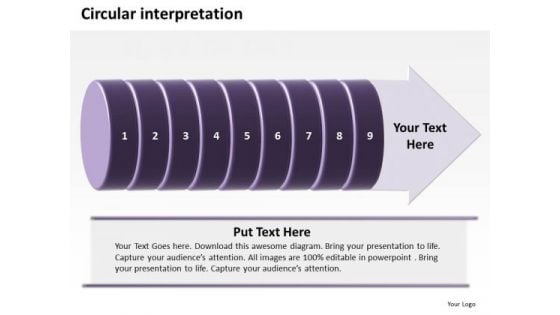
Ppt Circular Interpretation Of 9 Create PowerPoint Macro Involved Procedure Templates
PPT circular interpretation of 9 create powerpoint macro involved procedure Templates-The Business PowerPoint Diagram shows Circular interpretation of 5 steps involved in procedure of Business. It Signifies elaborating, enlargement, evolution, evolvement, evolving, expansion, flowering, hike, improvement, increase, increasing, making progress etc.-PPT circular interpretation of 9 create powerpoint macro involved procedure Templates-Affiliate, Affiliation, Arrow, Business, Chart, Circular, Commerce, Concept, Contribution, Cycle, Development, Diagram, Idea, Informative, Internet, Join, Making, Manage, Management, Market, Marketing, Member, Money, Network, Partner, Partnership, Pay, Paying, Performance, Plans, Process, Productive, Productivity, Profit, Profitable, Project, Recruit, Recruiting, Recruitment, Refer, Referral, Referring, Revenue, Sales, Socialize, Steps, Strategy With our Ppt Circular Interpretation Of 9 Create PowerPoint Macro Involved Procedure Templates you won't have to feel your way. They will strike a chord straightaway.
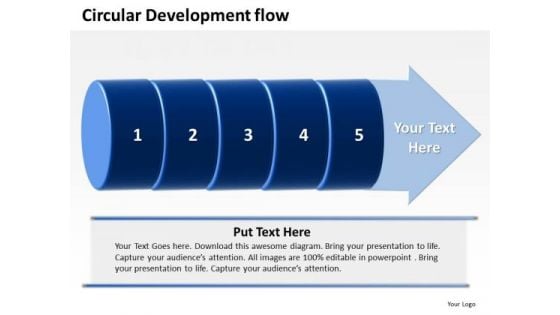
Ppt PowerPoint Presentation Circular Flow Of 5 Steps Involved Development Templates
PPT powerpoint presentation circular flow of 5 steps involved development Templates-The Business PowerPoint Diagram shows Circular flow of 5 steps involved in development of Business. It includes adding to, addition, adulthood, advance, advancement, advancing, augmentation, augmenting, boost, buildup, chrysalis etc.-PPT powerpoint presentation circular flow of 5 steps involved development Templates-Affiliate, Affiliation, Arrow, Business, Chart, Circular, Commerce, Concept, Contribution, Cycle, Development, Diagram, Idea, Informative, Internet, Join, Making, Manage, Management, Market, Marketing, Member, Money, Network, Partner, Partnership, Pay, Paying, Performance, Plans, Process, Productive, Productivity, Profit, Profitable, Project, Recruit, Recruiting, Recruitment, Refer, Referral, Referring, Revenue, Sales, Socialize, Steps, Strategy Our Ppt PowerPoint Presentation Circular Flow Of 5 Steps Involved Development Templates offer an affordable advantage. Get the edge at no extra expense.
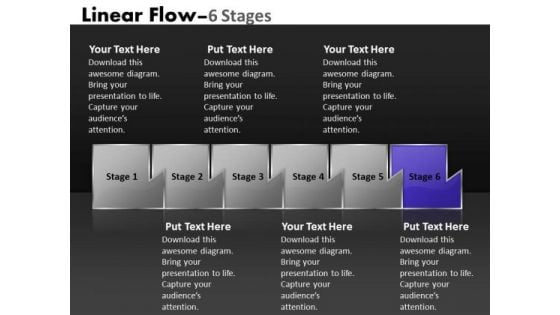
PowerPoint Template Illustration Of Six Sequential Steps Process Image
We present our PowerPoint template illustration of six sequential steps Process Image. Use our Business PowerPoint Templates because, Leadership Template: - Show them the way, be Captain of the ship and lead them to new shores. Use our Shapes PowerPoint Templates because; motivate your team to cross all barriers. Use our Design PowerPoint Templates because; Use our templates to illustrate your ability. Use our Signs PowerPoint Templates because, colors generate instant reactions in our brains. Use our Process and Flows PowerPoint Templates because; educate your team and the attention you have paid. Use these PowerPoint slides for presentations relating to Abstract, Algorithm, Arrow, Business, Chart, Connection, Design, Development, Diagram, Direction, Element, Flow, Graph, Linear, Linear Diagram, Management, Organization, Plan, Process, Section, Segment, Set, Sign, Solution, Strategy, Symbol, Vector. The prominent colors used in the PowerPoint template are Blue, Gray, and Black Address them in your charismatic style. Boost your aura with our PowerPoint Template Illustration Of Six Sequential Steps Process Image.
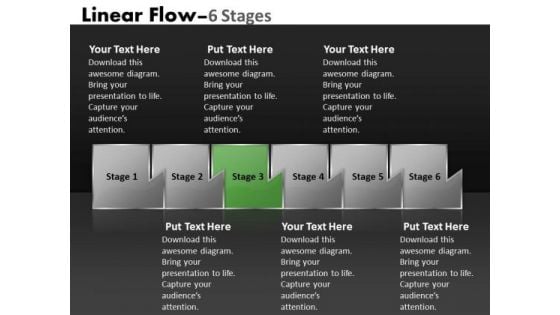
PowerPoint Template Illustration Of Six Sequential Steps Route Design
We present our PowerPoint template illustration of six sequential steps route design. Use our Business PowerPoint Templates because, you as the Champion your team shall anoint. Use our Shapes PowerPoint Templates because; Break it all down to Key Result Areas. Use our Design PowerPoint Templates because, you have the moves to sway the market. Use our Signs PowerPoint Templates because, to achieve sure shot success they need to come together at the right time, place and manner. Use our Process and Flows PowerPoint Templates because, you have some hits, you had some misses. Use these PowerPoint slides for presentations relating to Abstract, Algorithm, Arrow, Business, Chart, Connection, Design, Development, Diagram, Direction, Element, Flow, Graph, Linear, Linear Diagram, Management, Organization, Plan, Process, Section, Segment, Set, Sign, Solution, Strategy, Symbol, Vector. The prominent colors used in the PowerPoint template are Green, Gray, and Black Charge your account with our PowerPoint Template Illustration Of Six Sequential Steps Route Design. Earn the interest of your audience.
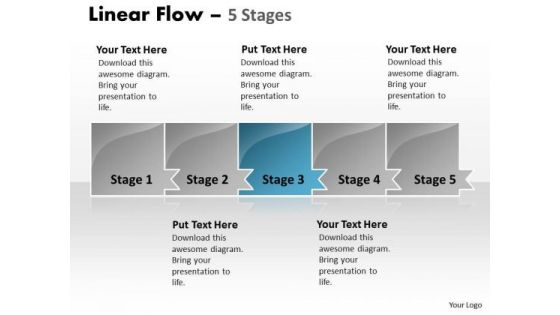
PowerPoint Template Marketing Process Horizontal Create Macro Design
We present our PowerPoint template marketing Process horizontal create macro design. Use our Business PowerPoint Templates because, the core of any organization is the people who work for it. Use our Shapes PowerPoint Templates because, you know your business and have a vision for it. Use our Design PowerPoint Templates because, organize your thoughts and illuminate your ideas accordingly. Use our Signs PowerPoint Templates because; Raise your Company stocks at the Opening Bell. Use our Process and Flows PowerPoint Templates because, you know your business and have a vision for it. Use these PowerPoint slides for presentations relating to Abstract, Algorithm, Arrow, Business, Chart, Connection, Design, Development, Diagram, Direction, Element, Flow, Graph, Linear, Linear Diagram, Management, Organization, Plan, Process, Section, Segment, Set, Sign, Solution, Strategy, Symbol, Vector. The prominent colors used in the PowerPoint template are Blue, Gray, and Black Be colorful and convincing with our PowerPoint Template Marketing Process Horizontal Create Macro Design. Dont pass up this opportunity to shine.
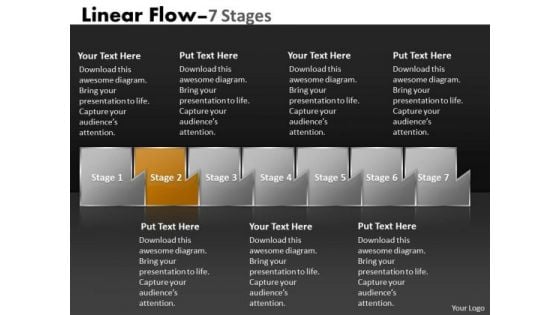
PowerPoint Template Multicolored Sequential Strip Marketing Flow Graphic
We present our PowerPoint template multicolored sequential strip marketing flow Graphic. Use our Business PowerPoint Templates because, to take it along a sure fire road to good profit. Use our Shapes PowerPoint Templates because, Sales & Marketing funnel: - You have the product you need. Use our Design PowerPoint Templates because, and watch them strengthen your companys sinews. Use our Signs PowerPoint Templates because; enlighten them with your brilliant understanding of mental health. Use our Process and Flows PowerPoint Templates because; Use our templates to emphasize your views. Use these PowerPoint slides for presentations relating to Abstract, Algorithm, Arrow, Business, Chart, Connection, Design, Development, Diagram, Direction, Element, Flow, Graph, Linear, Linear Diagram, Management, Organization, Plan, Process, Section, Segment, Set, Sign, Solution, Strategy, Symbol, Vector. The prominent colors used in the PowerPoint template are Brown, Gray, and Black Our PowerPoint Template Multicolored Sequential Strip Marketing Flow Graphic will give you the right feeling. You will be sure you have made the right choice.
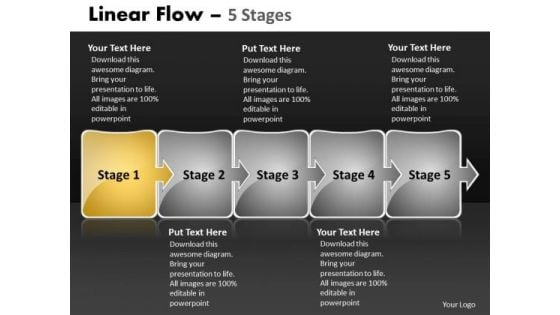
Ppt Background Trade Procedure In Five Horizontal Stages 2 Design
We present our PPT Background trade procedure in five Horizontal stages 2 design. Use our Business PowerPoint Templates because, an occasion for gifting and giving. Use our Shapes PowerPoint Templates because, coincidentally it always points to the top. Use our Design PowerPoint Templates because, Saves your time a prized possession, an ideal aid to give an ideal presentation. Use our Arrows PowerPoint Templates because, to go for Gold and not just silver. Use our Process and Flows PowerPoint Templates because; now put it up there for all to see. Use these PowerPoint slides for presentations relating to abstract, algorithm, arrow, business, chart, connection, design, development, diagram, direction, element, flow, graph, linear, linear diagram, management, organization, plan, process, section, segment, set, sign, solution, strategy, symbol, vector. The prominent colors used in the PowerPoint template are Yellow, Gray, and White Be the expert you truly are. Use our Ppt Background Trade Procedure In Five Horizontal Stages 2 Design to affirm your erudition.

Incident Response Techniques Deployement Best Practices For Cybersecurity Incident Management Diagrams PDF
This slide represents the best practices to be adopted by the organizations which aim to minimize impact of cyber security incidents on business operations and prevent them from happening again. It includes best practices such as create cyber incident management plan etc. If you are looking for a format to display your unique thoughts, then the professionally designed Incident Response Techniques Deployement Best Practices For Cybersecurity Incident Management Diagrams PDF is the one for you. You can use it as a Google Slides template or a PowerPoint template. Incorporate impressive visuals, symbols, images, and other charts. Modify or reorganize the text boxes as you desire. Experiment with shade schemes and font pairings. Alter, share or cooperate with other people on your work. Download Incident Response Techniques Deployement Best Practices For Cybersecurity Incident Management Diagrams PDF and find out how to give a successful presentation. Present a perfect display to your team and make your presentation unforgettable.
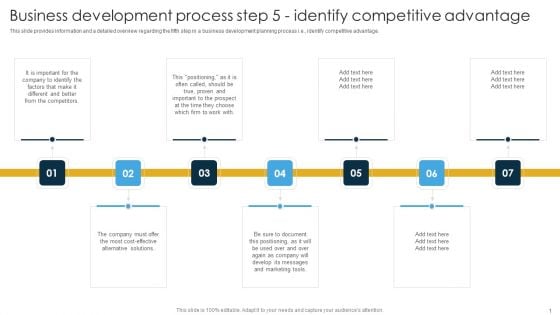
Business Development Process Step 5 Identify Competitive Advantage Ppt PowerPoint Presentation File Diagrams PDF
This slide provides information and a detailed overview regarding the fifth step in a business development planning process i.e., identify competitive advantage. If you are looking for a format to display your unique thoughts, then the professionally designed Business Development Process Step 5 Identify Competitive Advantage Ppt PowerPoint Presentation File Diagrams PDF is the one for you. You can use it as a Google Slides template or a PowerPoint template. Incorporate impressive visuals, symbols, images, and other charts. Modify or reorganize the text boxes as you desire. Experiment with shade schemes and font pairings. Alter, share or cooperate with other people on your work. Download Business Development Process Step 5 Identify Competitive Advantage Ppt PowerPoint Presentation File Diagrams PDF and find out how to give a successful presentation. Present a perfect display to your team and make your presentation unforgettable.
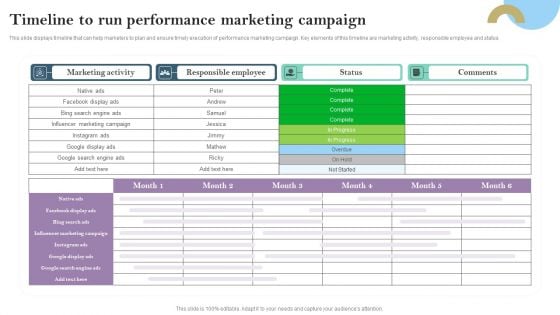
Timeline To Run Performance Marketing Campaign Ppt PowerPoint Presentation Diagram Templates PDF
This slide displays timeline that can help marketers to plan and ensure timely execution of performance marketing campaign. Key elements of this timeline are marketing activity, responsible employee and status If you are looking for a format to display your unique thoughts, then the professionally designed Timeline To Run Performance Marketing Campaign Ppt PowerPoint Presentation Diagram Templates PDF is the one for you. You can use it as a Google Slides template or a PowerPoint template. Incorporate impressive visuals, symbols, images, and other charts. Modify or reorganize the text boxes as you desire. Experiment with shade schemes and font pairings. Alter, share or cooperate with other people on your work. Download Timeline To Run Performance Marketing Campaign Ppt PowerPoint Presentation Diagram Templates PDF and find out how to give a successful presentation. Present a perfect display to your team and make your presentation unforgettable.
Business Diagram Post It Notes With Safety Pins Slide Presentation Template
This business plan power point template has been designed with graphic of post it note and safety pins. This PPT contains the concept of safety and business information sharing. This power point template may be used for various business information and safety related presentations.
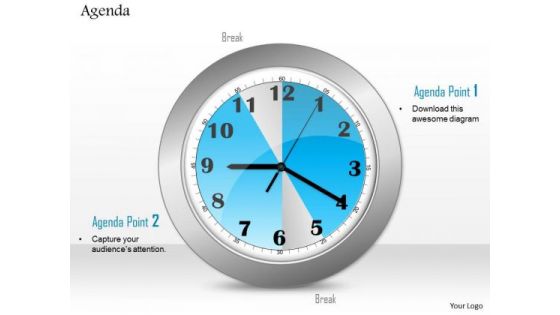
Business Diagram Clock Graphic To Show Points Of Agenda Presentation Template
This image slide displays clock graphic to show points of agenda. This image has been wonderfully crafted with graphic of clock and text spaces. Discuss various agendas and time management in your presentations using this image slide. You may edit this image slide according to your requirements. Use this image in business, planning and process related presentations. Make interesting presentations using this image slide.

Business Diagram Tablet In Human Hands To Show Topic Of Agenda Presentation Template
This image slide displays tablet in human hands depict agenda. This image has been crafted with graphic of tablet and human hands. Discuss various agendas in your presentations using this image slide. You may edit this image slide according to your requirements. Use this image in business, technology, planning and process related presentations. This image slide will enhance the quality of your presentations.
Ppt Homogenous Way To Prevent Banking Losses Stage 3 PowerPoint Templates
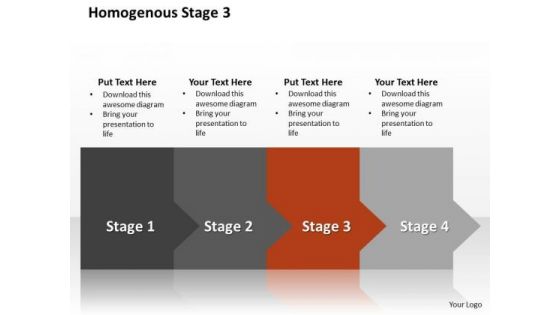
PPT homogenous way to prevent banking losses stage 3 PowerPoint Templates-The theme of this PowerPoint template is linear arrows. Use them to illustrate a stepwise process or a phase structure. You can easily change its colors-PPT homogenous way to prevent banking losses stage 3 PowerPoint Templates-Arrow, Bank, Benefit, Business, Calculate, Calculation, Capitalist, Communication, Company, Concern, Connection, Data, Diagram, Digital, Drawing, Earnings, Economic, Finance, Financial, Flow, Forecast, Gain, Goal, Graph, Growth, Illustration, Increase, Information, Interest, Investing, Management, Market, Money, Move, Network, Objective, Plan, Process, Profit, Progress, Report, Rise, Risk, Shares, Statistics, Stock, System, Technology Making plans with our Ppt Homogenous Way To Prevent Banking Losses Stage 3 PowerPoint Templates entails success. They ensure automatic returns.
Implement Content Marketing Describing Business Performance Administration Goals Structure Pdf
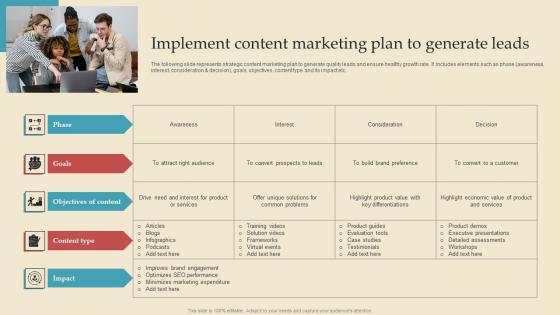
The following slide represents strategic content marketing plan to generate quality leads and ensure healthy growth rate. It includes elements such as phase awareness, interest, consideration and decision, goals, objectives, content type and its impact etc. Do you know about Slidesgeeks Implement Content Marketing Describing Business Performance Administration Goals Structure Pdf These are perfect for delivering any kind od presentation. Using it, create PowerPoint presentations that communicate your ideas and engage audiences. Save time and effort by using our pre designed presentation templates that are perfect for a wide range of topic. Our vast selection of designs covers a range of styles, from creative to business, and are all highly customizable and easy to edit. Download as a PowerPoint template or use them as Google Slides themes. The following slide represents strategic content marketing plan to generate quality leads and ensure healthy growth rate. It includes elements such as phase awareness, interest, consideration and decision, goals, objectives, content type and its impact etc.
Project Stakeholders Management Stakeholder Engagement Annual Timeline Ppt Powerpoint
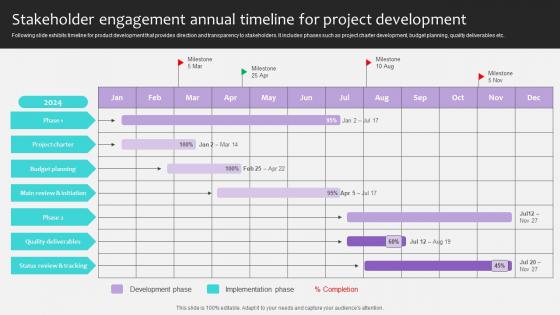
Following slide exhibits timeline for product development that provides direction and transparency to stakeholders. It includes phases such as project charter development, budget planning, quality deliverables etc. Do you know about Slidesgeeks Project Stakeholders Management Stakeholder Engagement Annual Timeline Ppt Powerpoint These are perfect for delivering any kind od presentation. Using it, create PowerPoint presentations that communicate your ideas and engage audiences. Save time and effort by using our pre-designed presentation templates that are perfect for a wide range of topic. Our vast selection of designs covers a range of styles, from creative to business, and are all highly customizable and easy to edit. Download as a PowerPoint template or use them as Google Slides themes. Following slide exhibits timeline for product development that provides direction and transparency to stakeholders. It includes phases such as project charter development, budget planning, quality deliverables etc..
Identifying Business Competitors To How To Conduct Competitive Assessment Themes Pdf
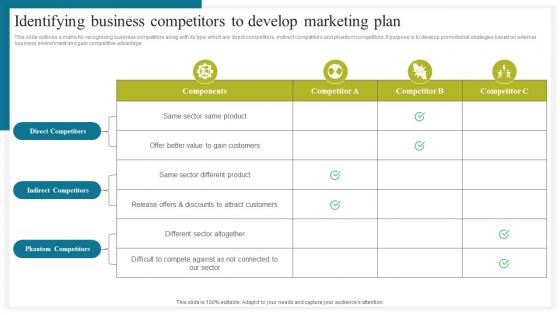
This slide outlines a matrix for recognizing business competitors along with its type which are direct competitors, indirect competitors and phantom competitors. It purpose is to develop promotional strategies based on external business environment and gain competitive advantage. This Identifying Business Competitors To How To Conduct Competitive Assessment Themes Pdf from Slidegeeks makes it easy to present information on your topic with precision. It provides customization options, so you can make changes to the colors, design, graphics, or any other component to create a unique layout. It is also available for immediate download, so you can begin using it right away. Slidegeeks has done good research to ensure that you have everything you need to make your presentation stand out. Make a name out there for a brilliant performance. This slide outlines a matrix for recognizing business competitors along with its type which are direct competitors, indirect competitors and phantom competitors. It purpose is to develop promotional strategies based on external business environment and gain competitive advantage.
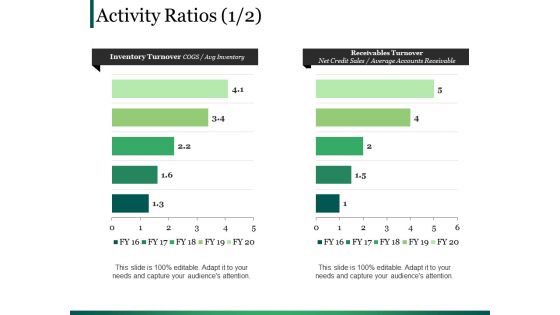
Activity Ratios Template 1 Ppt PowerPoint Presentation Portfolio Graphics
This is a activity ratios template 1 ppt powerpoint presentation portfolio graphics. This is a two stage process. The stages in this process are finance, chart graph, marketing, planning, analysis.

 Home
Home