Portfolio Comparison
Strategic Sales Plan Project Goals Deliverables And Target Ppt PowerPoint Presentation Icon Gridlines PDF
The following slide highlights a sales plan overview to optimize online sales and generate more revenue. It includes elements such as objective, target, strategy, tools and key deliverables etc.Pitch your topic with ease and precision using this Strategic Sales Plan Project Goals Deliverables And Target Ppt PowerPoint Presentation Icon Gridlines PDF. This layout presents information on Ensure Competitive, Positioning Focus, Brand Promotion. It is also available for immediate download and adjustment. So, changes can be made in the color, design, graphics or any other component to create a unique layout.
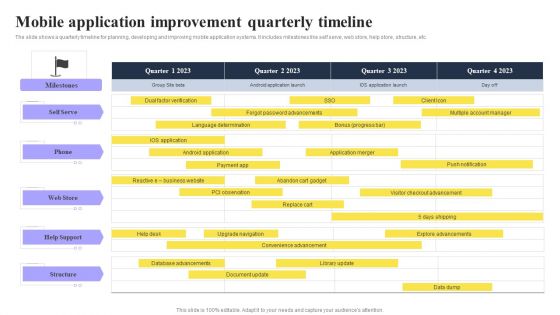
Mobile Application Improvement Quarterly Timeline Ppt PowerPoint Presentation Outline Clipart Images PDF
The slide shows a quarterly timeline for planning, developing and improving mobile application systems. It includes milestones like self serve, web store, help store, structure, etc.Pitch your topic with ease and precision using this Mobile Application Improvement Quarterly Timeline Ppt PowerPoint Presentation Outline Clipart Images PDF. This layout presents information on Language Determination, Forgot Advancements, Checkout Advancement. It is also available for immediate download and adjustment. So, changes can be made in the color, design, graphics or any other component to create a unique layout.
Product Release Plan Quarterly Timeline Ppt PowerPoint Presentation Icon Graphic Tips PDF
The slide shows a quarterly release plan timeline of an information and technology product for a year. It includes activities like client feedback, safety improvements, web performance up gradation, etc.Pitch your topic with ease and precision using this Product Release Plan Quarterly Timeline Ppt PowerPoint Presentation Icon Graphic Tips PDF. This layout presents information on Performance Advancement, Reporting Analytics, Safety Improvements. It is also available for immediate download and adjustment. So, changes can be made in the color, design, graphics or any other component to create a unique layout.
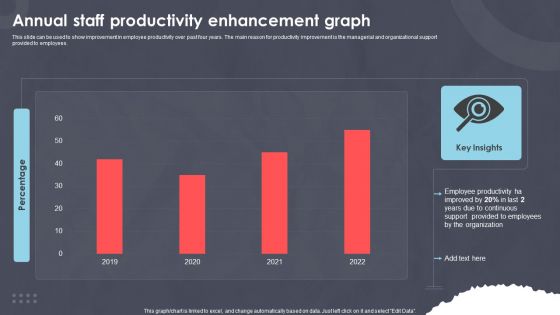
Annual Staff Productivity Enhancement Graph Ppt PowerPoint Presentation Styles Aids PDF
This slide can be used to show improvement in employee productivity over past four years. The main reason for productivity improvement is the managerial and organizational support provided to employees. Pitch your topic with ease and precision using this Annual Staff Productivity Enhancement Graph Ppt PowerPoint Presentation Styles Aids PDF. This layout presents information on Employee Productivity, Improved Last, Due Continuous. It is also available for immediate download and adjustment. So, changes can be made in the color, design, graphics or any other component to create a unique layout.
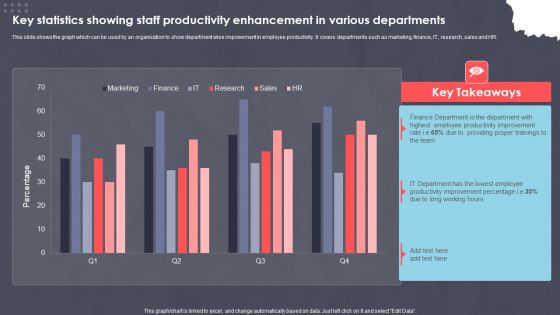
Key Statistics Showing Staff Productivity Enhancement In Various Departments Ppt PowerPoint Presentation Slides Portrait PDF
This slide shows the graph which can be used by an organization to show department wise improvement in employee productivity. It covers departments such as marketing, finance, IT, research, sales and HR. Pitch your topic with ease and precision using this Key Statistics Showing Staff Productivity Enhancement In Various Departments Ppt PowerPoint Presentation Slides Portrait PDF. This layout presents information on XXXXXXXXXXXXXXXXXXXXXXXXX. It is also available for immediate download and adjustment. So, changes can be made in the color, design, graphics or any other component to create a unique layout.
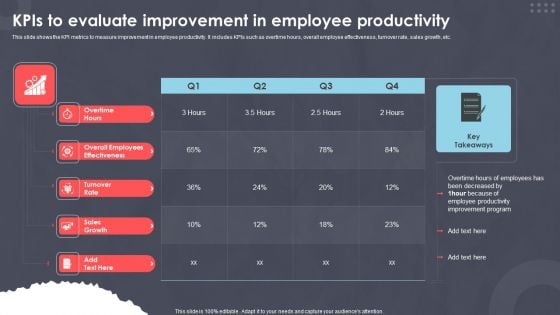
Kpis To Evaluate Improvement In Employee Productivity Ppt PowerPoint Presentation Ideas Styles PDF
This slide shows the KPI metrics to measure improvement in employee productivity. It includes KPIs such as overtime hours, overall employee effectiveness, turnover rate, sales growth, etc.Pitch your topic with ease and precision using this Kpis To Evaluate Improvement In Employee Productivity Ppt PowerPoint Presentation Ideas Styles PDF. This layout presents information on Been Decreased, Employee Productivity, Improvement Program. It is also available for immediate download and adjustment. So, changes can be made in the color, design, graphics or any other component to create a unique layout.
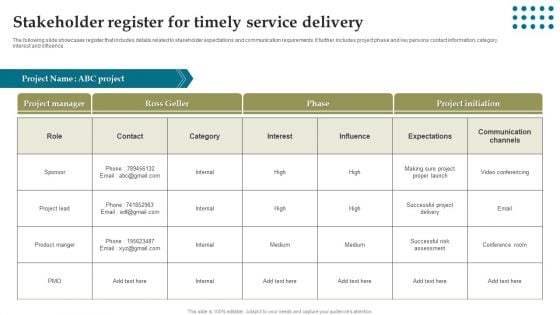
Stakeholder Register For Timely Service Delivery Ppt Styles Guide PDF
The following slide showcases register that includes details related to stakeholder expectations and communication requirements. It further includes project phase and key persons contact information, category, interest and influence. Pitch your topic with ease and precision using this Stakeholder Register For Timely Service Delivery Ppt Styles Guide PDF. This layout presents information on Project Manager, Project Initiation, Communication Channels. It is also available for immediate download and adjustment. So, changes can be made in the color, design, graphics or any other component to create a unique layout.

5S Lean Production Strategies Audit Sheet For Safety Ppt Infographics Graphics Template PDF
This slide defines the 5s lean safety audit sheet for an organization. It includes information related observations, remarks and suggestions along with the scores. Pitch your topic with ease and precision using this 5S Lean Production Strategies Audit Sheet For Safety Ppt Infographics Graphics Template PDF. This layout presents information on Remarks And Suggestion, Safety Equipment, Extinguishers Available. It is also available for immediate download and adjustment. So, changes can be made in the color, design, graphics or any other component to create a unique layout.
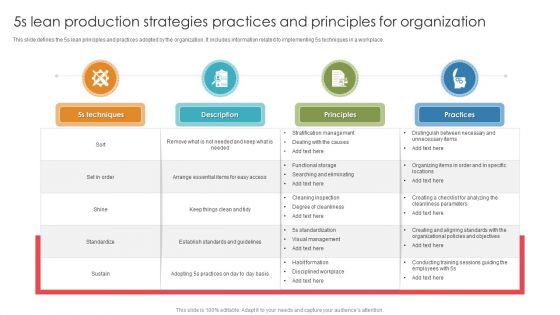
5S Lean Production Strategies Practices And Principles For Organization Ppt Infographic Template Display PDF
This slide defines the 5s lean principles and practices adopted by the organization. It includes information related to implementing 5s techniques in a workplace. Pitch your topic with ease and precision using this 5S Lean Production Strategies Practices And Principles For Organization Ppt Infographic Template Display PDF. This layout presents information on 5s Techniques, Principles, Practices. It is also available for immediate download and adjustment. So, changes can be made in the color, design, graphics or any other component to create a unique layout.
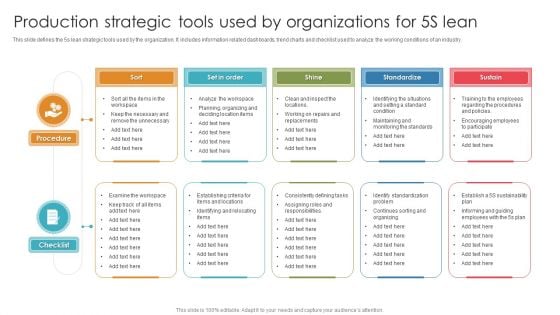
Production Strategic Tools Used By Organizations For 5S Lean Ppt Infographics Microsoft PDF
This slide defines the 5s lean strategic tools used by the organization. It includes information related dashboards, trend charts and checklist used to analyze the working conditions of an industry. Pitch your topic with ease and precision using this Production Strategic Tools Used By Organizations For 5S Lean Ppt Infographics Microsoft PDF. This layout presents information on Procedure, Checklist, Standardize. It is also available for immediate download and adjustment. So, changes can be made in the color, design, graphics or any other component to create a unique layout.
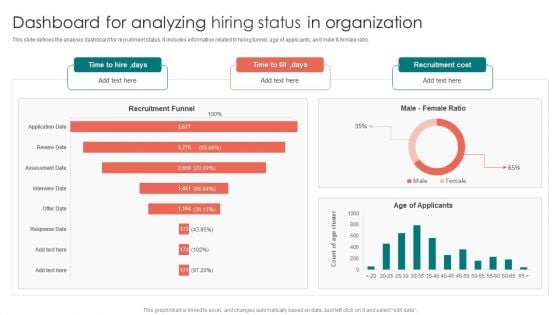
Dashboard For Analyzing Hiring Status In Organization Ppt PowerPoint Presentation Gallery Images PDF
This slide defines the analysis dashboard for recruitment status. It includes information related to hiring funnel, age of applicants, and male and female ratio. Pitch your topic with ease and precision using this Dashboard For Analyzing Hiring Status In Organization Ppt PowerPoint Presentation Gallery Images PDF. This layout presents information on Recruitment Funnel, Time To Hire, Age Applicants. It is also available for immediate download and adjustment. So, changes can be made in the color, design, graphics or any other component to create a unique layout.
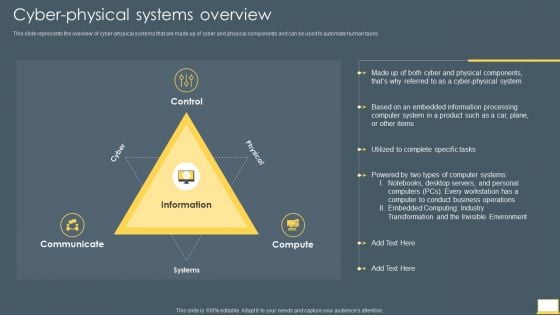
Cyber Intelligent Computing System Cyber Physical Systems Overview Professional PDF
This slide represents the overview of cyber physical systems that are made up of cyber and physical components and can be used to automate human tasks. Presenting Cyber Intelligent Computing System Cyber Physical Systems Overview Professional PDF to provide visual cues and insights. Share and navigate important information on three stages that need your due attention. This template can be used to pitch topics like Communicate, Information, Systems. In addtion, this PPT design contains high resolution images, graphics, etc, that are easily editable and available for immediate download.
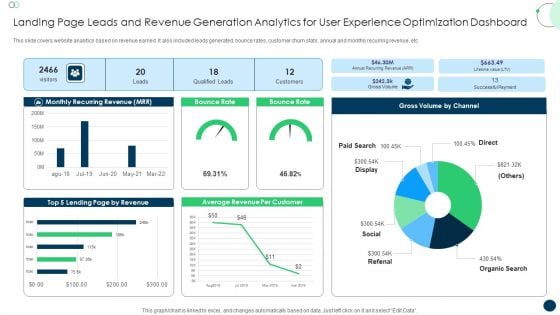
Landing Page Leads And Revenue Generation Analytics For User Experience Optimization Dashboard Formats PDF
This slide covers website analytics based on revenue earned. It also included leads generated, bounce rates, customer churn stats, annual and monthly recurring revenue, etc. Pitch your topic with ease and precision using this Landing Page Leads And Revenue Generation Analytics For User Experience Optimization Dashboard Formats PDF. This layout presents information on Monthly Recurring Revenue, Bounce Rate, Gross Volume. It is also available for immediate download and adjustment. So, changes can be made in the color, design, graphics or any other component to create a unique layout.
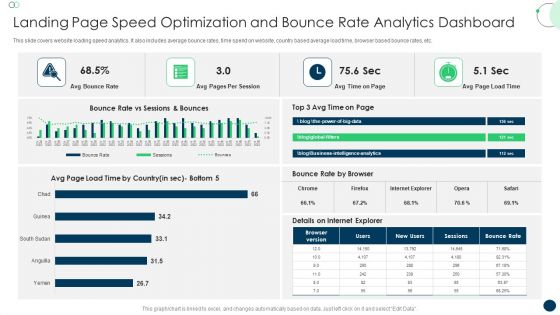
Landing Page Speed Optimization And Bounce Rate Analytics Dashboard Topics PDF
This slide covers website loading speed analytics. It also includes average bounce rates, time spend on website, country based average load time, browser based bounce rates, etc. Pitch your topic with ease and precision using this Landing Page Speed Optimization And Bounce Rate Analytics Dashboard Topics PDF. This layout presents information on Avg Bounce Rate, Avg Pages, Per Session. It is also available for immediate download and adjustment. So, changes can be made in the color, design, graphics or any other component to create a unique layout.
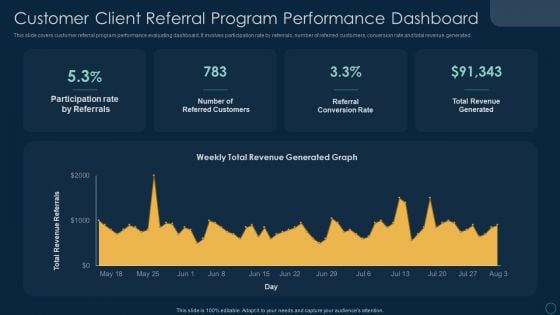
Customer Client Referral Program Performance Dashboard Ppt File Visual Aids PDF
This slide covers customer referral program performance evaluating dashboard. It involves participation rate by referrals, number of referred customers, conversion rate and total revenue generated. Pitch your topic with ease and precision using this Customer Client Referral Program Performance Dashboard Ppt File Visual Aids PDF. This layout presents information on Participation Rate Referrals, Number Referred Customers, Referral Conversion Rate. It is also available for immediate download and adjustment. So, changes can be made in the color, design, graphics or any other component to create a unique layout.

Four Techniques For Profitable Youtube Marketing Ppt Outline Format Ideas PDF
This slide covers different ways to increase revenue through YouTube advertising strategy. It includes techniques such as selecting YouTube ad format wisely, using YouTube targeting options, setting up video remarketing, driving action with interactive links, etc. Pitch your topic with ease and precision using this Four Techniques For Profitable Youtube Marketing Ppt Outline Format Ideas PDF. This layout presents information on Action Steps, Techniques, Video Remarketing. It is also available for immediate download and adjustment. So, changes can be made in the color, design, graphics or any other component to create a unique layout.
Youtube Video Marketing Analytics Dashboard Ppt Icon Portrait PDF
This slide covers dashboard illustrating performance of ad campaigns on YouTube. It includes elements such as total gained subscribers, likes, dislikes, daily active users, views, campaign performance, traffic sources by views, etc. Pitch your topic with ease and precision using this Youtube Video Marketing Analytics Dashboard Ppt Icon Portrait PDF. This layout presents information on Average Vies, Per Week, Campaigns, Traffic Sources. It is also available for immediate download and adjustment. So, changes can be made in the color, design, graphics or any other component to create a unique layout.
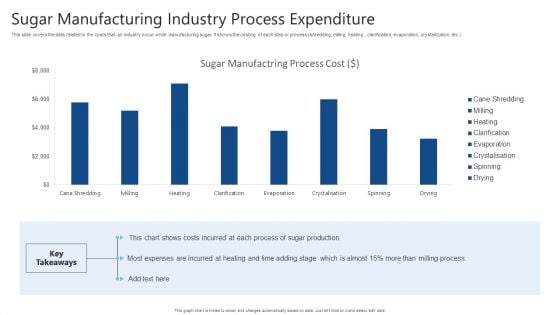
Sugar Manufacturing Industry Process Expenditure Ppt Infographic Template Information PDF
This slide covers the data related to the costs that an industry occur while manufacturing sugar. It shows the costing of each step or process shredding, milling, heating, clarification, evaporation, crystallization, etc. Pitch your topic with ease and precision using this Sugar Manufacturing Industry Process Expenditure Ppt Infographic Template Information PDF. This layout presents information on Sugar Manufactring Process, Cost, Sugar Production. It is also available for immediate download and adjustment. So, changes can be made in the color, design, graphics or any other component to create a unique layout.
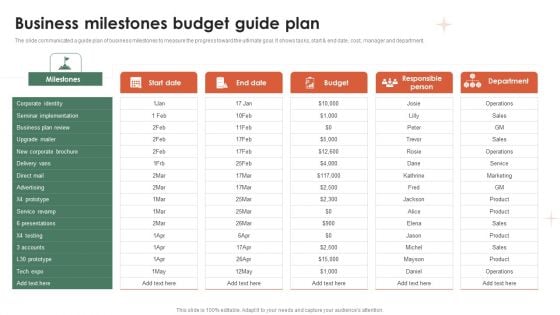
Business Milestones Budget Guide Plan Ppt Infographics Pictures PDF
The slide communicated a guide plan of business milestones to measure the progress toward the ultimate goal. It shows tasks, start and end date, cost, manager and department. Pitch your topic with ease and precision using this Business Milestones Budget Guide Plan Ppt Infographics Pictures PDF. This layout presents information on Corporate Identity, Seminar Implementation, Business Plan Review. It is also available for immediate download and adjustment. So, changes can be made in the color, design, graphics or any other component to create a unique layout.
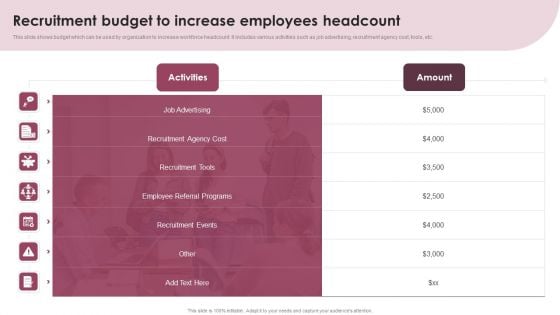
Recruitment Budget To Increase Employees Headcount Ppt File Example PDF
This slide shows budget which can be used by organization to increase workforce headcount. It includes various activities such as job advertising, recruitment agency cost, tools, etc. Pitch your topic with ease and precision using this Recruitment Budget To Increase Employees Headcount Ppt File Example PDF. This layout presents information on Job Advertising, Recruitment Agency Cost, Recruitment Tools. It is also available for immediate download and adjustment. So, changes can be made in the color, design, graphics or any other component to create a unique layout.
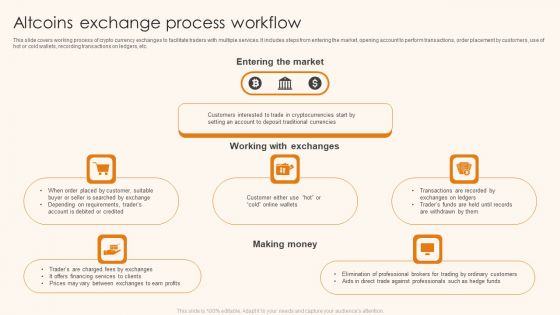
Altcoins Exchange Process Workflow Ppt Inspiration Ideas PDF
This slide covers working process of crypto currency exchanges to facilitate traders with multiple services. It includes steps from entering the market, opening account to perform transactions, order placement by customers, use of hot or cold wallets, recording transactions on ledgers, etc. Pitch your topic with ease and precision using this Altcoins Exchange Process Workflow Ppt Inspiration Ideas PDF. This layout presents information on Entering Market, Working Exchanges, Making Money. It is also available for immediate download and adjustment. So, changes can be made in the color, design, graphics or any other component to create a unique layout.
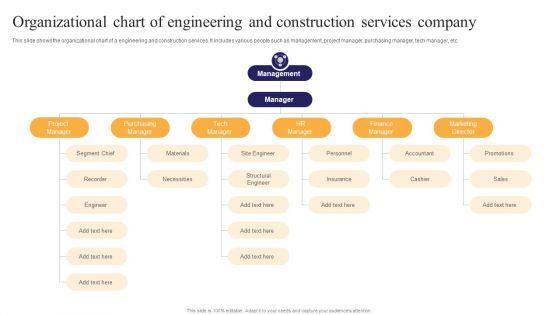
Organizational Chart Of Engineering And Construction Services Company Ppt PowerPoint Presentation Professional Demonstration PDF
This slide shows the organizational chart of a engineering and construction services. It includes various people such as management, project manager, purchasing manager, tech manager, etc. Pitch your topic with ease and precision using this Organizational Chart Of Engineering And Construction Services Company Ppt PowerPoint Presentation Professional Demonstration PDF. This layout presents information on Purchasing Manager, Structural Engineer, Finance Manager. It is also available for immediate download and adjustment. So, changes can be made in the color, design, graphics or any other component to create a unique layout.
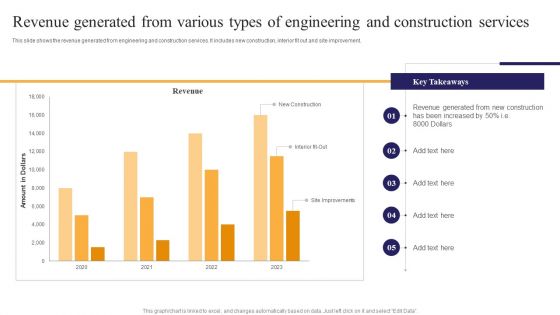
Revenue Generated From Various Types Of Engineering And Construction Services Ppt PowerPoint Presentation File Guide PDF
This slide shows the revenue generated from engineering and construction services. It includes new construction, interior fit out and site improvement. Pitch your topic with ease and precision using this Revenue Generated From Various Types Of Engineering And Construction Services Ppt PowerPoint Presentation File Guide PDF. This layout presents information on Revenue Generated, New Construction, Been Increased. It is also available for immediate download and adjustment. So, changes can be made in the color, design, graphics or any other component to create a unique layout.
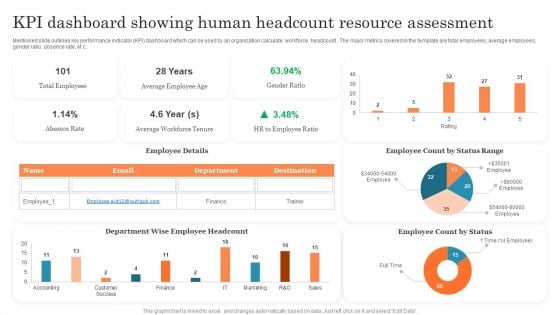
KPI Dashboard Showing Human Headcount Resource Assessment Ppt PowerPoint Presentation Outline PDF
Mentioned slide outlines key performance indicator KPI dashboard which can be used by an organization calculate workforce headcount . The major metrics covered in the template are total employees, average employees, gender ratio, absence rate, etc. Pitch your topic with ease and precision using this KPI Dashboard Showing Human Headcount Resource Assessment Ppt PowerPoint Presentation Outline PDF. This layout presents information on Total Employees, Average Employee, Employee Count. It is also available for immediate download and adjustment. So, changes can be made in the color, design, graphics or any other component to create a unique layout.
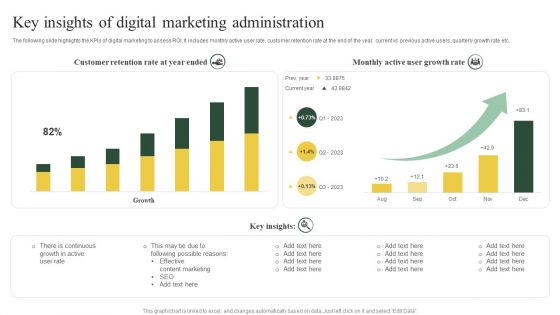
Key Insights Of Digital Marketing Administration Ppt PowerPoint Presentation Styles Graphics Template PDF
The following slide highlights the KPIs of digital marketing to assess ROI. It includes monthly active user rate, customer retention rate at the end of the year, current vs previous active users, quarterly growth rate etc.Pitch your topic with ease and precision using this Key Insights Of Digital Marketing Administration Ppt PowerPoint Presentation Styles Graphics Template PDF. This layout presents information on Possible Reasons, Content Marketing, Growth Rate. It is also available for immediate download and adjustment. So, changes can be made in the color, design, graphics or any other component to create a unique layout.
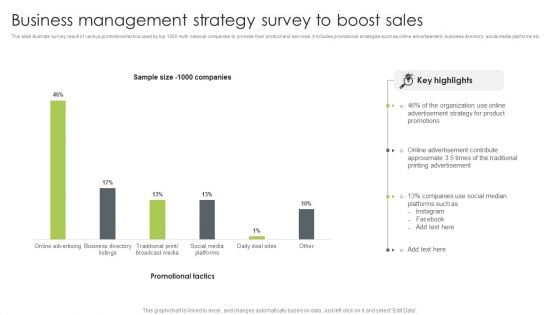
Business Management Strategy Survey To Boost Sales Summary PDF
This slide illustrate survey result of various promotional tactics used by top 1000 multi national companies to promote their product and services. it includes promotional strategies such as online advertisement, business directory, social media platforms etc. Pitch your topic with ease and precision using this Business Management Strategy Survey To Boost Sales Summary PDF. This layout presents information on Advertisement Strategy, Organization, Social Median. It is also available for immediate download and adjustment. So, changes can be made in the color, design, graphics or any other component to create a unique layout.

Customer Acquisition Plan Infographics PDF
This slide illustrate various inbound and outbound marketing strategies tools to attract new customer. It includes techniques such as search engine optimization, email marketing, copywriting, content marketing and conversion rate optimization. Pitch your topic with ease and precision using this Customer Acquisition Plan Infographics PDF. This layout presents information on Marketing Strategy, Price, Customer Acquisition Plan. It is also available for immediate download and adjustment. So, changes can be made in the color, design, graphics or any other component to create a unique layout.
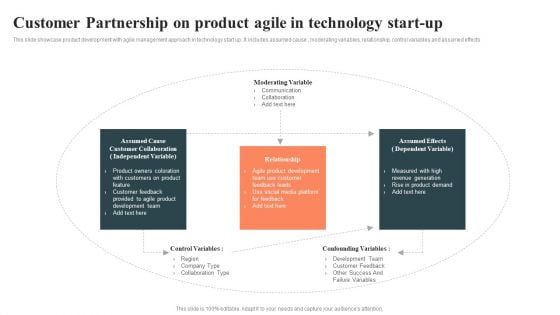
Customer Partnership On Product Agile In Technology Start Up Clipart PDF
This slide showcase product development with agile management approach in technology start up. It includes assumed cause , moderating variables, relationship, control variables and assumed effects. Pitch your topic with ease and precision using this Customer Partnership On Product Agile In Technology Start Up Clipart PDF. This layout presents information on Communication, Social Media Platform, Agile Product Development. It is also available for immediate download and adjustment. So, changes can be made in the color, design, graphics or any other component to create a unique layout.
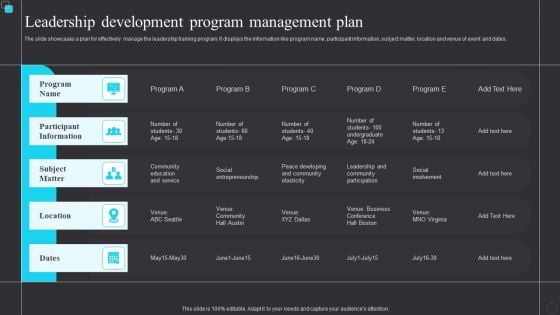
Leadership Development Program Management Plan Professional PDF
The slide showcases a plan for effectively manage the leadership training program. It displays the information like program name, participant information, subject matter, location and venue of event and dates. Pitch your topic with ease and precision using this Leadership Development Program Management Plan Professional PDF. This layout presents information on Location, Participant Information, Social Entrepreneurship. It is also available for immediate download and adjustment. So, changes can be made in the color, design, graphics or any other component to create a unique layout.
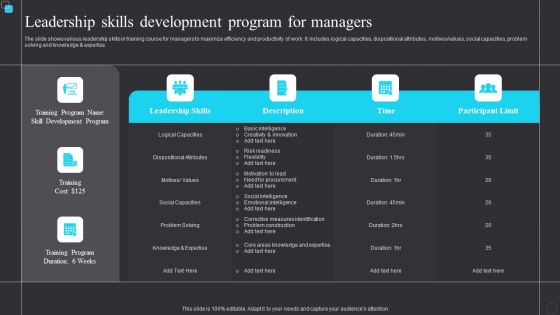
Leadership Skills Development Program For Managers Diagrams PDF
The slide shows various leadership skills in training course for managers to maximize efficiency and productivity of work. It includes logical capacities, dispositional attributes, motives or values, social capacities, problem solving and knowledge and expertize. Pitch your topic with ease and precision using this Leadership Skills Development Program For Managers Diagrams PDF. This layout presents information on Training Cost, Risk Readiness, Corrective Measures Identification. It is also available for immediate download and adjustment. So, changes can be made in the color, design, graphics or any other component to create a unique layout.
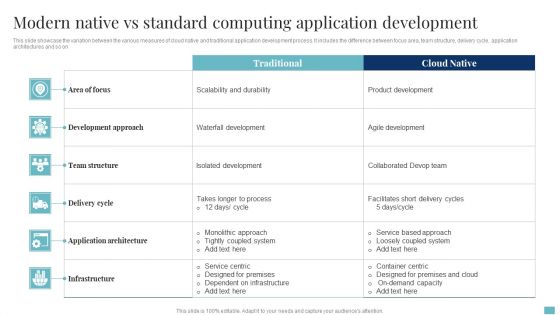
Modern Native Vs Standard Computing Application Development Infographics PDF
This slide showcase the variation between the various measures of cloud native and traditional application development process. It includes the difference between focus area, team structure, delivery cycle, application architectures and so on. Pitch your topic with ease and precision using this Modern Native Vs Standard Computing Application Development Infographics PDF. This layout presents information on Development Approach, Application Architecture, Team Structure. It is also available for immediate download and adjustment. So, changes can be made in the color, design, graphics or any other component to create a unique layout.
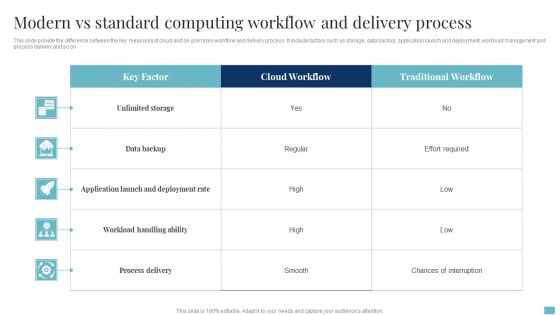
Modern Vs Standard Computing Workflow And Delivery Process Slides PDF
This slide provide the difference between the key measures of cloud and on-premises workflow and delivery process. It include factors such as storage, data backup, application launch and deployment, workload management and process delivery and so on. Pitch your topic with ease and precision using this Modern Vs Standard Computing Workflow And Delivery Process Slides PDF. This layout presents information on Data Backup, Workload Handling Ability, Process Delivery. It is also available for immediate download and adjustment. So, changes can be made in the color, design, graphics or any other component to create a unique layout.
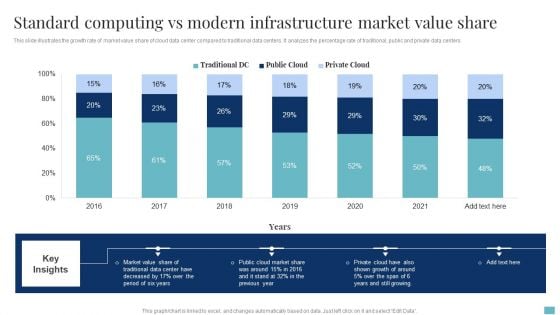
Standard Computing Vs Modern Infrastructure Market Value Share Brochure PDF
This slide illustrates the growth rate of market value share of cloud data center compared to traditional data centers. It analyzes the percentage rate of traditional, public and private data centers. Pitch your topic with ease and precision using this Standard Computing Vs Modern Infrastructure Market Value Share Brochure PDF. This layout presents information on Cloud Market Share, Market Value Share, Growth. It is also available for immediate download and adjustment. So, changes can be made in the color, design, graphics or any other component to create a unique layout.
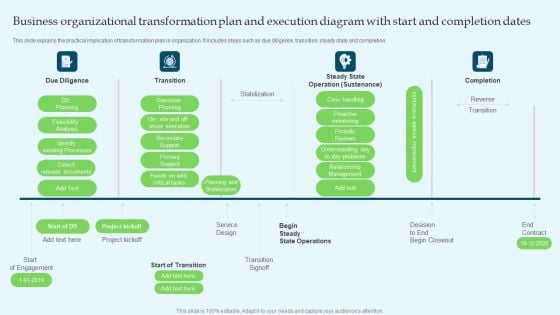
Business Organizational Transformation Plan And Execution Diagram With Start And Completion Dates Ideas PDF
This slide explains the practical implication of transformation plan in organization. It includes steps such as due diligence, transition, steady state and completion. Pitch your topic with ease and precision using this Business Organizational Transformation Plan And Execution Diagram With Start And Completion Dates Ideas PDF. This layout presents information on Feasibility Analysis, Existing Processes, Relevant Documents. It is also available for immediate download and adjustment. So, changes can be made in the color, design, graphics or any other component to create a unique layout.
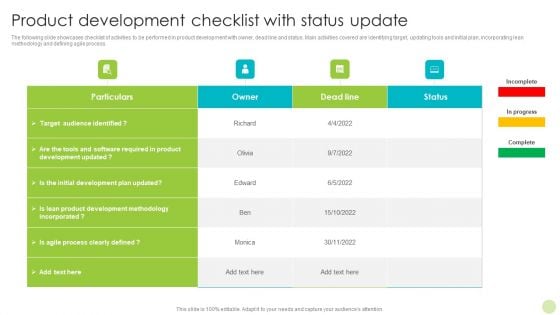
Product Development Checklist With Status Update Portrait PDF
The following slide showcases checklist of activities to be performed in product development with owner, dead line and status. Main activities covered are identifying target, updating tools and initial plan, incorporating lean methodology and defining agile process. Pitch your topic with ease and precision using this Product Development Checklist With Status Update Portrait PDF. This layout presents information on Product Development Methodology, Development Plan, Software Required. It is also available for immediate download and adjustment. So, changes can be made in the color, design, graphics or any other component to create a unique layout.
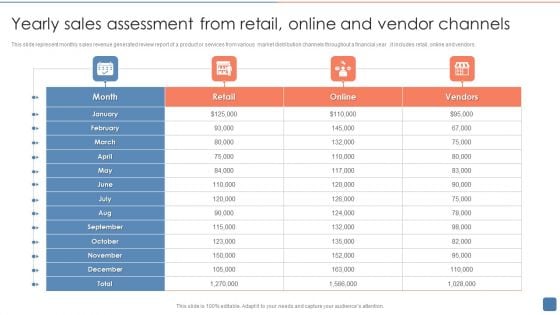
Yearly Sales Assessment From Retail Online And Vendor Channels Summary PDF
This slide represent monthly sales revenue generated review report of a product or services from various market distribution channels throughout a financial year .it includes retail, online and vendors. Pitch your topic with ease and precision using this Yearly Sales Assessment From Retail Online And Vendor Channels Summary PDF. This layout presents information on Retail, Yearly Sales Assessment, Online And Vendor Channels. It is also available for immediate download and adjustment. So, changes can be made in the color, design, graphics or any other component to create a unique layout.
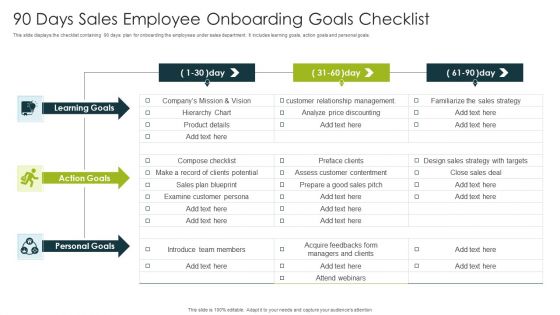
90 Days Sales Employee Onboarding Goals Checklist Ppt Pictures Master Slide PDF
This slide displays the checklist containing 90 days plan for onboarding the employees under sales department. It includes learning goals, action goals and personal goals. Pitch your topic with ease and precision using this 90 Days Sales Employee Onboarding Goals Checklist Ppt Pictures Master Slide PDF. This layout presents information on Learning Goals, Action Goals, Personal Goals. It is also available for immediate download and adjustment. So, changes can be made in the color, design, graphics or any other component to create a unique layout.
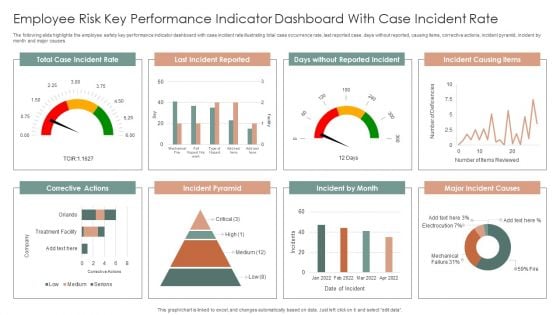
Employee Risk Key Performance Indicator Dashboard With Case Incident Rate Ppt Professional Information PDF
The following slide highlights the employee safety key performance indicator dashboard with case incident rate illustrating total case occurrence rate, last reported case, days without reported, causing items, corrective actions, incident pyramid, incident by month and major causes. Pitch your topic with ease and precision using this Employee Risk Key Performance Indicator Dashboard With Case Incident Rate Ppt Professional Information PDF. This layout presents information on Total Case, Incident Rate, Last Incident Reported, Incident Causing Items. It is also available for immediate download and adjustment. So, changes can be made in the color, design, graphics or any other component to create a unique layout.

Patient Health And Risk Key Performance Indicator Dashboard Ppt Infographic Template Summary PDF
The following slide highlights the patient health and safety key performance indicator dashboard illustrating admission by department, admission by cost, patient satisfaction, total patients, operations cost, patient density, total staff, waiting time, treatment satisfaction and treatment confidence. Pitch your topic with ease and precision using this Patient Health And Risk Key Performance Indicator Dashboard Ppt Infographic Template Summary PDF. This layout presents information on Admission By Department, Admission Vs Cost, Patient Satisfaction. It is also available for immediate download and adjustment. So, changes can be made in the color, design, graphics or any other component to create a unique layout.
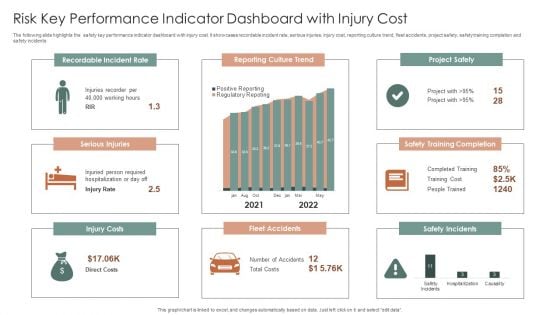
Risk Key Performance Indicator Dashboard With Injury Cost Ppt Summary Brochure PDF
The following slide highlights the safety key performance indicator dashboard with injury cost. It showcases recordable incident rate, serious injuries, injury cost, reporting culture trend, fleet accidents, project safety, safety training completion and safety incidents. Pitch your topic with ease and precision using this Risk Key Performance Indicator Dashboard With Injury Cost Ppt Summary Brochure PDF. This layout presents information on Recordable Incident Rate, Reporting Culture Trend, Project Safety. It is also available for immediate download and adjustment. So, changes can be made in the color, design, graphics or any other component to create a unique layout.
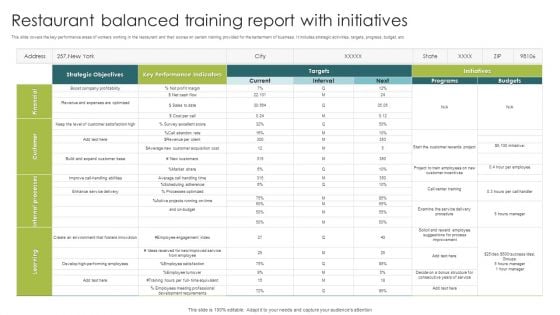
Restaurant Balanced Training Report With Initiatives Ppt Professional Tips PDF
This slide covers the key performance areas of workers working in the restaurant and their scores on certain training provided for the betterment of business. It includes strategic activities, targets, progress, budget, etc. Pitch your topic with ease and precision using this Restaurant Balanced Training Report With Initiatives Ppt Professional Tips PDF. This layout presents information on Key Performance Indicators, Target, Strategic Objectives. It is also available for immediate download and adjustment. So, changes can be made in the color, design, graphics or any other component to create a unique layout.
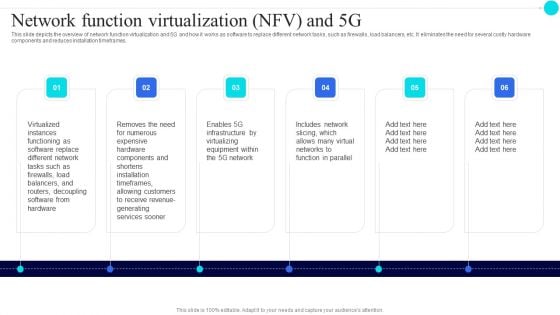
Network Function Virtualization Nfv And 5G 5G Functional Architecture Clipart PDF
This slide depicts the overview of network function virtualization and 5G and how it works as software to replace different network tasks, such as firewalls, load balancers, etc. It eliminates the need for several costly hardware components and reduces installation timeframes.Presenting Network Function Virtualization Nfv And 5G 5G Functional Architecture Clipart PDF to provide visual cues and insights. Share and navigate important information on six stages that need your due attention. This template can be used to pitch topics like Allowing Customers, Expensive Hardware, Function Parallel. In addtion, this PPT design contains high resolution images, graphics, etc, that are easily editable and available for immediate download.

Timeline To Implement 5G Architecture 5G Functional Architecture Background PDF
This slide represents the timeline for implementing 5G architecture, including the steps to be performed, such as massive MIMO selection, coverage enhancement, synchronization configuration, NSA and SA strategy, and 5G network deployment strategy in initial stage.Presenting Timeline To Implement 5G Architecture 5G Functional Architecture Background PDF to provide visual cues and insights. Share and navigate important information on five stages that need your due attention. This template can be used to pitch topics like Planning Considerations, Deployment Architecture, Functional Components. In addtion, this PPT design contains high resolution images, graphics, etc, that are easily editable and available for immediate download.
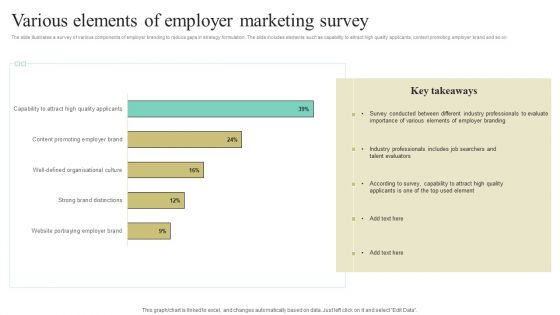
Various Elements Of Employer Marketing Survey Ppt Summary Example PDF
The slide illustrates a survey of various components of employer branding to reduce gaps in strategy formulation. The slide includes elements such as capability to attract high quality applicants, content promoting employer brand and so on. Showcasing this set of slides titled Various Elements Of Employer Marketing Survey Ppt Summary Example PDF. The topics addressed in these templates are Employer Branding, Talent Evaluators, According To Survey. All the content presented in this PPT design is completely editable. Download it and make adjustments in color, background, font etc. as per your unique business setting.
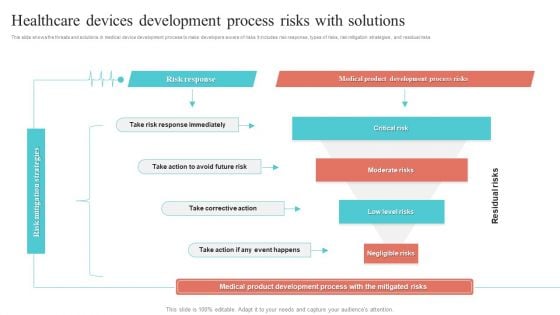
Healthcare Devices Development Process Risks With Solutions Ppt Summary Pictures PDF
This slide shows the threats and solutions in medical device development process to make developers aware of risks. It includes risk response, types of risks, risk mitigation strategies , and residual risks. Pitch your topic with ease and precision using this Healthcare Devices Development Process Risks With Solutions Ppt Summary Pictures PDF. This layout presents information on Critical Risk, Moderate Risks, Low Level Risks. It is also available for immediate download and adjustment. So, changes can be made in the color, design, graphics or any other component to create a unique layout.
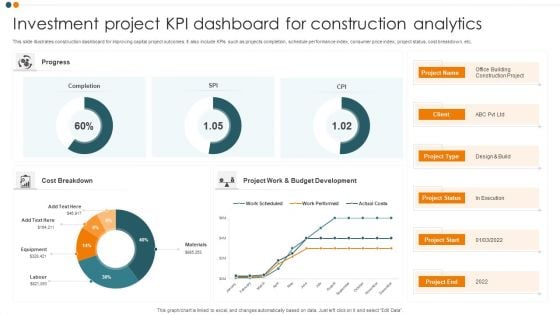
Investment Project KPI Dashboard For Construction Analytics Background PDF
This slide illustrates construction dashboard for improving capital project outcomes. It also include KPIs such as projects completion, schedule performance index, consumer price index, project status, cost breakdown, etc. Pitch your topic with ease and precision using this Investment Project KPI Dashboard For Construction Analytics Background PDF. This layout presents information on Cost Breakdown, Completion, Progress. It is also available for immediate download and adjustment. So, changes can be made in the color, design, graphics or any other component to create a unique layout.
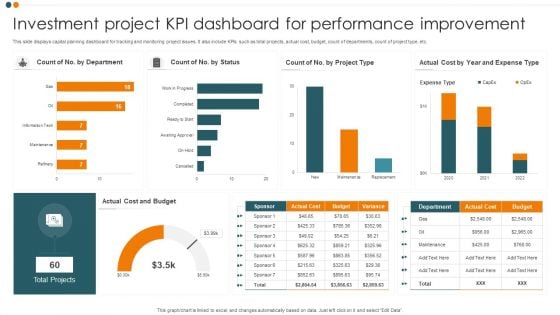
Investment Project KPI Dashboard For Performance Improvement Guidelines PDF
This slide displays capital planning dashboard for tracking and monitoring project issues. It also include KPIs such as total projects, actual cost, budget, count of departments, count of project type, etc. Pitch your topic with ease and precision using this Investment Project KPI Dashboard For Performance Improvement Guidelines PDF. This layout presents information on Cost And Budget, Total Projects, Expense Type. It is also available for immediate download and adjustment. So, changes can be made in the color, design, graphics or any other component to create a unique layout.
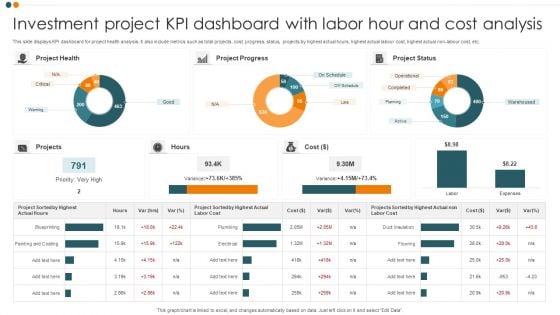
Investment Project KPI Dashboard With Labor Hour And Cost Analysis Portrait PDF
This slide displays KPI dashboard for project health analysis. It also include metrics such as total projects, cost, progress, status, projects by highest actual hours, highest actual labour cost, highest actual non-labour cost, etc. Pitch your topic with ease and precision using this Investment Project KPI Dashboard With Labor Hour And Cost Analysis Portrait PDF. This layout presents information on Project Health, Project Progress, Project Status. It is also available for immediate download and adjustment. So, changes can be made in the color, design, graphics or any other component to create a unique layout.
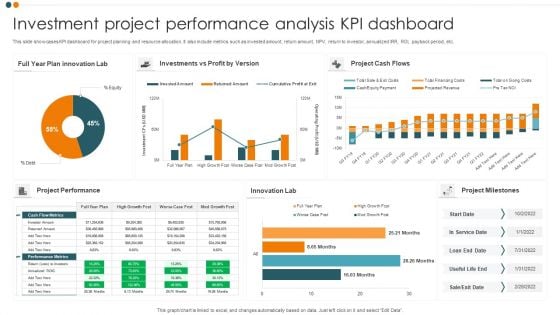
Investment Project Performance Analysis KPI Dashboard Professional PDF
This slide showcases KPI dashboard for project planning and resource allocation. It also include metrics such as invested amount, return amount, NPV, return to investor, annualized IRR, ROI, payback period, etc. Pitch your topic with ease and precision using this Investment Project Performance Analysis KPI Dashboard Professional PDF. This layout presents information on Project Cash Flows, Project Performance, Innovation Lab. It is also available for immediate download and adjustment. So, changes can be made in the color, design, graphics or any other component to create a unique layout.
Monthly Project Investment Expense Tracking KPI Dashboard Themes PDF
This slide showcases KPI dashboard for analysing the variance between billed and budgeted expenses. It also include metrics such as project budget, potential, billed, cost, margin billed vs. budget labour cost, hours details by resources, etc. Pitch your topic with ease and precision using this Monthly Project Investment Expense Tracking KPI Dashboard Themes PDF. This layout presents information on Project Summary, Sales Potential. It is also available for immediate download and adjustment. So, changes can be made in the color, design, graphics or any other component to create a unique layout.
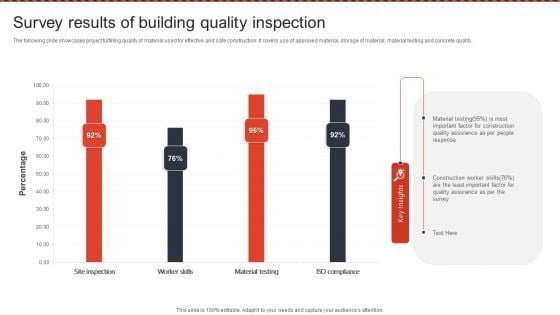
Survey Results Of Building Quality Inspection Ppt PowerPoint Presentation File Show PDF
The following slide showcases project fulfilling quality of material used for effective and safe construction. It covers use of approved material, storage of material, material testing and concrete quality. Pitch your topic with ease and precision using this Survey Results Of Building Quality Inspection Ppt PowerPoint Presentation File Show PDF. This layout presents information on Material Testing, Quality Assurance, Construction Worker Skills. It is also available for immediate download and adjustment. So, changes can be made in the color, design, graphics or any other component to create a unique layout.
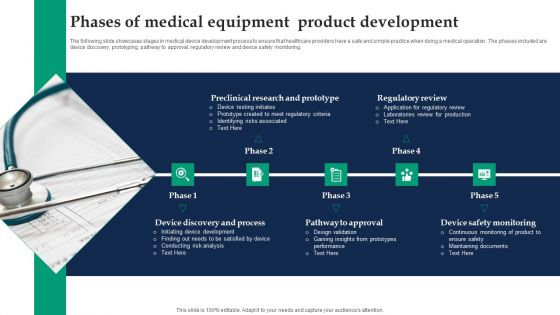
Phases Of Medical Equipment Product Development Ppt Inspiration Slide PDF
The following slide showcases stages in medical device development process to ensure that healthcare providers have a safe and simple practice when doing a medical operation. The phases included are device discovery, prototyping, pathway to approval, regulatory review and device safety monitoring. Pitch your topic with ease and precision using this Phases Of Medical Equipment Product Development Ppt Inspiration Slide PDF. This layout presents information on Pathway To Approval, Device Safety Monitoring, Regulatory Review. It is also available for immediate download and adjustment. So, changes can be made in the color, design, graphics or any other component to create a unique layout.
Business Program Success Kpis With Priority Ppt Infographic Template Icon PDF
The following slide highlights the business program success metrics with priority illustrating key headings which includes business objective, metric tool, target group, measurement description and priority. Pitch your topic with ease and precision using this Business Program Success Kpis With Priority Ppt Infographic Template Icon PDF. This layout presents information on Business Objective, Metric Tool, Target Group. It is also available for immediate download and adjustment. So, changes can be made in the color, design, graphics or any other component to create a unique layout.
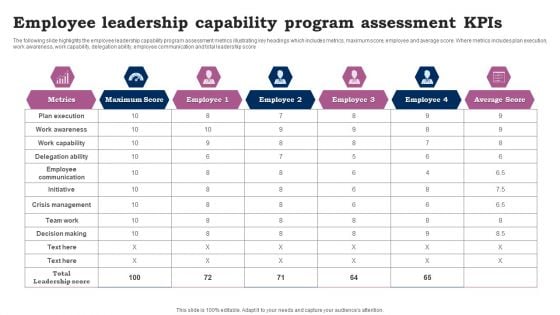
Employee Leadership Capability Program Assessment Kpis Ppt Infographic Template Topics PDF
The following slide highlights the employee leadership capability program assessment metrics illustrating key headings which includes metrics, maximum score, employee and average score. Where metrics includes plan execution, work awareness, work capability, delegation ability, employee communication and total leadership score. Pitch your topic with ease and precision using this Employee Leadership Capability Program Assessment Kpis Ppt Infographic Template Topics PDF. This layout presents information on Metrics, Plan Execution, Work Awareness. It is also available for immediate download and adjustment. So, changes can be made in the color, design, graphics or any other component to create a unique layout.
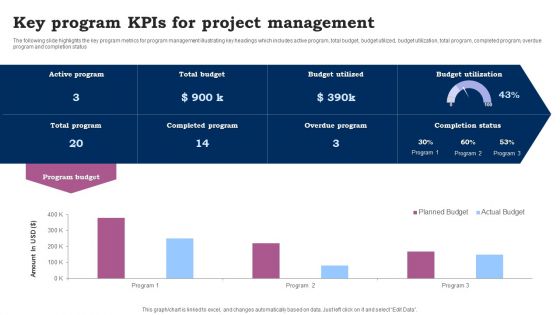
Key Program Kpis For Project Management Ppt Slides Graphic Images PDF
The following slide highlights the key program metrics for program management illustrating key headings which includes active program, total budget, budget utilized, budget utilization, total program, completed program, overdue program and completion status. Pitch your topic with ease and precision using this Key Program Kpis For Project Management Ppt Slides Graphic Images PDF. This layout presents information on Program Budget, Active Program, Total Budget. It is also available for immediate download and adjustment. So, changes can be made in the color, design, graphics or any other component to create a unique layout.
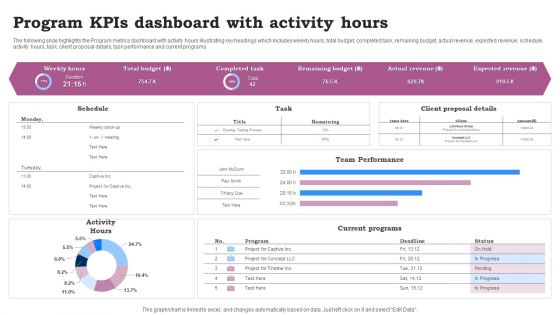
Program Kpis Dashboard With Activity Hours Ppt Infographics Clipart Images PDF
The following slide highlights the Program metrics dashboard with activity hours illustrating key headings which includes weekly hours, total budget, completed task, remaining budget, actual revenue, expected revenue, schedule, activity hours, task, client proposal details, task performance and current programs. Pitch your topic with ease and precision using this Program Kpis Dashboard With Activity Hours Ppt Infographics Clipart Images PDF. This layout presents information on Team Performance, Current Programs, Activity Hours. It is also available for immediate download and adjustment. So, changes can be made in the color, design, graphics or any other component to create a unique layout.
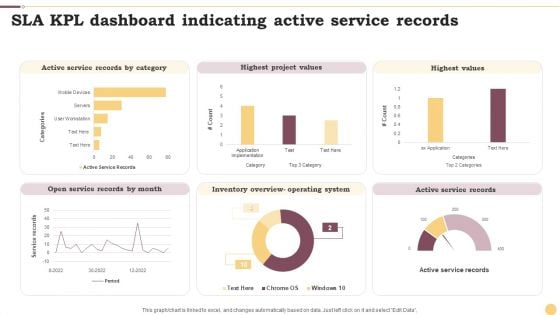
SLA KPL Dashboard Indicating Active Service Records Ppt Professional Graphics Example PDF
This graph or chart is linked to excel, and changes automatically based on data. Just left click on it and select Edit Data. Pitch your topic with ease and precision using this SLA KPL Dashboard Indicating Active Service Records Ppt Professional Graphics Example PDF. This layout presents information on Active Service Records, Highest Project Values, Highest Values. It is also available for immediate download and adjustment. So, changes can be made in the color, design, graphics or any other component to create a unique layout.
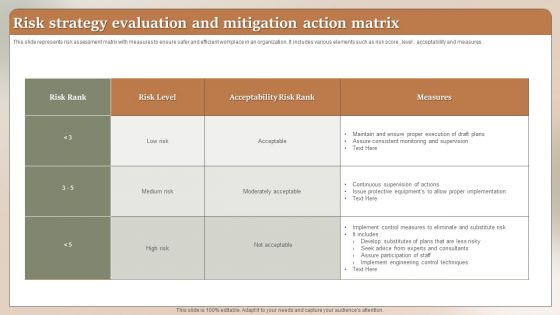
Risk Strategy Evaluation And Mitigation Action Matrix Ppt Styles Demonstration PDF
This slide represents risk assessment matrix with measures to ensure safer and efficient workplace in an organization. It includes various elements such as risk score , level , acceptability and measures. Pitch your topic with ease and precision using this Risk Strategy Evaluation And Mitigation Action Matrix Ppt Styles Demonstration PDF. This layout presents information on Risk Rank, Risk Level, Acceptability Risk Rank. It is also available for immediate download and adjustment. So, changes can be made in the color, design, graphics or any other component to create a unique layout.
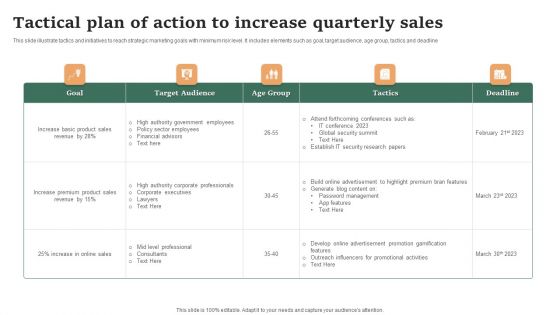
Tactical Plan Of Action To Increase Quarterly Sales Ppt Show Sample PDF
This slide illustrate tactics and initiatives to reach strategic marketing goals with minimum risk level. It includes elements such as goal, target audience, age group, tactics and deadline. Pitch your topic with ease and precision using this Tactical Plan Of Action To Increase Quarterly Sales Ppt Show Sample PDF. This layout presents information on Target Audience, Goal, Age Group. It is also available for immediate download and adjustment. So, changes can be made in the color, design, graphics or any other component to create a unique layout.
Three Months New Technical Officer Manager Plan Ppt Icon Infographics PDF
This slide shows 3 months plan for new chief technical officer to make improvements in technical side. It includes 30 60 90 days activities like getting familiar to employees, monitoring progress and making reports. Pitch your topic with ease and precision using this Three Months New Technical Officer Manager Plan Ppt Icon Infographics PDF. This layout presents information on First 30 Days, 30 60 Days,60 90 Days. It is also available for immediate download and adjustment. So, changes can be made in the color, design, graphics or any other component to create a unique layout.


 Continue with Email

 Home
Home


