Portfolio Dashboard
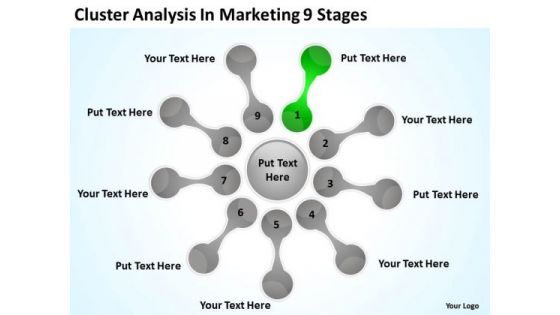
Cluster Analysis In Marketing 9 Stages Basic Business Plan Outline PowerPoint Templates
We present our cluster analysis in marketing 9 stages basic business plan outline PowerPoint templates.Present our Process and Flows PowerPoint Templates because It is Aesthetically crafted by artistic young minds. Our PowerPoint Templates and Slides are designed to display your dexterity. Download our Flow Charts PowerPoint Templates because Our PowerPoint Templates and Slides will give you great value for your money. Be assured of finding the best projection to highlight your words. Use our Marketing PowerPoint Templates because Our PowerPoint Templates and Slides will weave a web of your great ideas. They are gauranteed to attract even the most critical of your colleagues. Download our Shapes PowerPoint Templates because It will let you Set new benchmarks with our PowerPoint Templates and Slides. They will keep your prospects well above par. Use our Business PowerPoint Templates because They will Put your wonderful verbal artistry on display. Our PowerPoint Templates and Slides will provide you the necessary glam and glitter.Use these PowerPoint slides for presentations relating to Mapping, vector, chart, flow, flowchart, process, model, step, tool, blank, processdiagram, concept, topic, presentation, relate, circle, graphic, data, report, marketing, idea, circlepattern, team, management, graph, cycle, illustration, connection, processchart,direction, plans, color, text, phase, organization, control, connect, link, explanation, mapping, present. The prominent colors used in the PowerPoint template are Gray, Green, White. Our Cluster Analysis In Marketing 9 Stages Basic Business Plan Outline PowerPoint Templates create presentations that blow your audience away. With our money back guarantee you have nothing to lose.
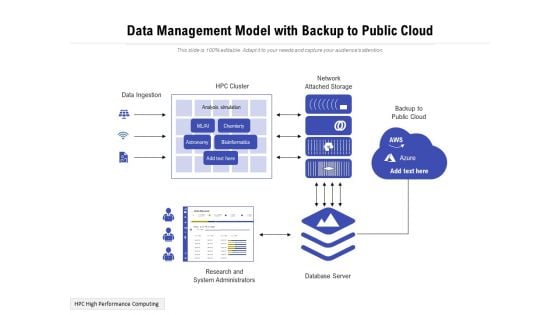
Data Management Model With Backup To Public Cloud Ppt PowerPoint Presentation Gallery Templates PDF
Presenting this set of slides with name data management model with backup to public cloud ppt powerpoint presentation gallery templates pdf. This is a one stage process. The stages in this process are data ingestion, analysis, network. This is a completely editable PowerPoint presentation and is available for immediate download. Download now and impress your audience.
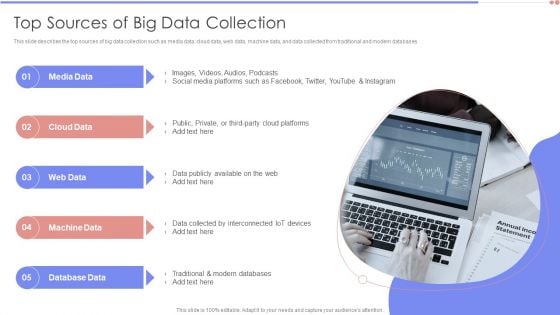
Data Analytics Management Top Sources Of Big Data Collection Sample PDF
This slide describes the top sources of big data collection such as media data, cloud data, web data, machine data, and data collected from traditional and modern databases.Presenting Data Analytics Management Top Sources Of Big Data Collection Sample PDF to provide visual cues and insights. Share and navigate important information on five stages that need your due attention. This template can be used to pitch topics like Machine Data, Database Data, Media Data. In addtion, this PPT design contains high resolution images, graphics, etc, that are easily editable and available for immediate download.
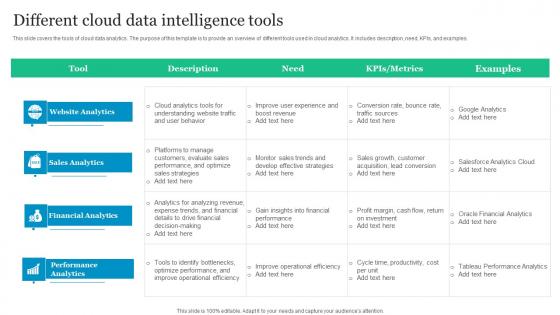
Different Cloud Data Intelligence Tools Themes Pdf
This slide covers the tools of cloud data analytics. The purpose of this template is to provide an overview of different tools used in cloud analytics. It includes description, need, KPIs, and examples. Showcasing this set of slides titled Different Cloud Data Intelligence Tools Themes Pdf. The topics addressed in these templates are Website Analytics, Sales Analytics, Financial Analytics. All the content presented in this PPT design is completely editable. Download it and make adjustments in color, background, font etc. as per your unique business setting. This slide covers the tools of cloud data analytics. The purpose of this template is to provide an overview of different tools used in cloud analytics. It includes description, need, KPIs, and examples.
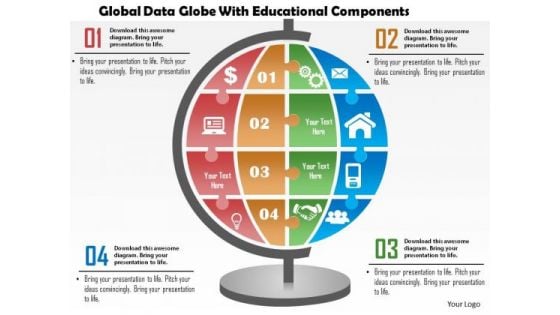
Business Diagram Global Data Globe With Educational Components Presentation Template
This business diagram has been designed with graphic of globe with icons. Use our diagram slide to organize data and to display data analysis. This diagram is suitable for global business and marketing related presentations.
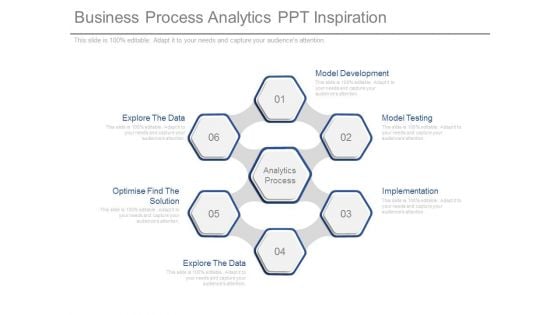
Business Process Analytics Ppt Inspiration
This is a business process analytics ppt inspiration. This is a six stage process. The stages in this process are model development, model testing, implementation, explore the data, optimise find the solution, explore the data, analytics process.
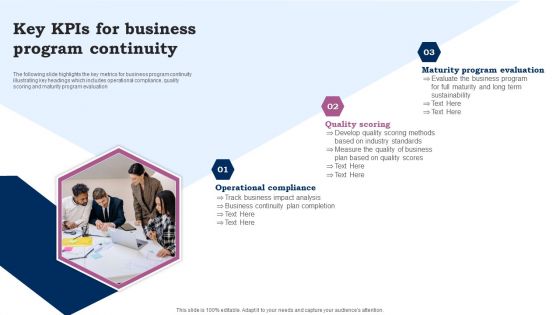
Key Kpis For Business Program Continuity Ppt Pictures Format PDF
The following slide highlights the key metrics for business program continuity illustrating key headings which includes operational compliance, quality scoring and maturity program evaluation. Persuade your audience using this Key Kpis For Business Program Continuity Ppt Pictures Format PDF. This PPT design covers three stages, thus making it a great tool to use. It also caters to a variety of topics including Operational Compliance, Quality Scoring, Maturity Program Evaluation. Download this PPT design now to present a convincing pitch that not only emphasizes the topic but also showcases your presentation skills.
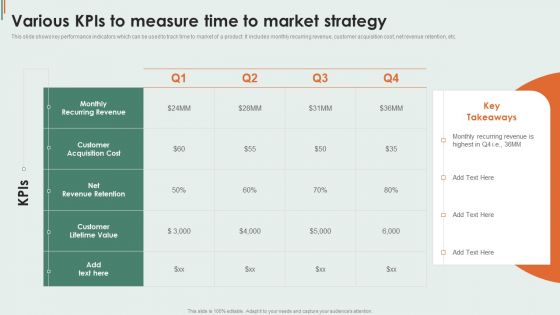
Various Kpis To Measure Time To Market Strategy Infographics PDF
This slide shows key performance indicators which can be used to track time to market of a product. It includes monthly recurring revenue, customer acquisition cost, net revenue retention, etc. Showcasing this set of slides titled Various Kpis To Measure Time To Market Strategy Infographics PDF. The topics addressed in these templates are Customer Acquisition, Customer Lifetime, Monthly Recurring. All the content presented in this PPT design is completely editable. Download it and make adjustments in color, background, font etc. as per your unique business setting.
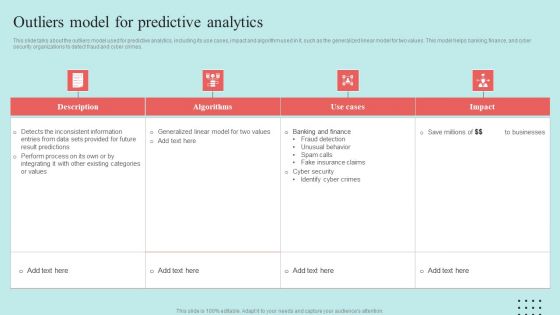
Predictive Data Model Outliers Model For Predictive Analytics Introduction PDF

Predictive Analytics For Empowering Lifecycle Of Predictive Analytics Model Brochure Pdf
This slide depicts the lifecycle of the predictive analytics model, and it includes highlighting and formulating a problem, data preparation, information exploration, transforming and choosing, making, validating, and deploying a model, and then evaluating and monitoring results. From laying roadmaps to briefing everything in detail, our templates are perfect for you. You can set the stage with your presentation slides. All you have to do is download these easy-to-edit and customizable templates. Predictive Analytics For Empowering Lifecycle Of Predictive Analytics Model Brochure Pdf will help you deliver an outstanding performance that everyone would remember and praise you for. Do download this presentation today. This slide depicts the lifecycle of the predictive analytics model, and it includes highlighting and formulating a problem, data preparation, information exploration, transforming and choosing, making, validating, and deploying a model, and then evaluating and monitoring results.
Power Point Arrows Statistical Analysis Of Process Data 2 Steps PowerPoint Templates
We present our power point arrows statistical analysis of process data 2 steps PowerPoint templates.Download and present our Business PowerPoint Templates because It is Aesthetically crafted by artistic young minds. Our PowerPoint Templates and Slides are designed to display your dexterity. Present our Arrows PowerPoint Templates because You can Rise to the occasion with our PowerPoint Templates and Slides. You will bring your audience on their feet in no time. Download and present our Circle Charts PowerPoint Templates because Our PowerPoint Templates and Slides help you pinpoint your timelines. Highlight the reasons for your deadlines with their use. Present our Shapes PowerPoint Templates because You aspire to touch the sky with glory. Let our PowerPoint Templates and Slides provide the fuel for your ascent. Present our Symbol PowerPoint Templates because You have gained great respect for your brilliant ideas. Use our PowerPoint Templates and Slides to strengthen and enhance your reputation.Use these PowerPoint slides for presentations relating to abstract, arrow, art, background, banner, blue, bright, business, circle, color, colorful, concept, conceptual, connection, creative, cycle, design, different, element, empty, flower, form, frame, graphic, green, group, idea, illustration, match, message, order, part, petal, piece, place, red, ring, shape, solution, special, speech, strategy, symbol, template, text, usable, vector, web, website. The prominent colors used in the PowerPoint template are Yellow, Brown, Black. People tell us our power point arrows statistical analysis of process data 2 steps PowerPoint templates will impress their bosses and teams. People tell us our circle PowerPoint templates and PPT Slides are designed by professionals Presenters tell us our power point arrows statistical analysis of process data 2 steps PowerPoint templates are second to none. We assure you our banner PowerPoint templates and PPT Slides will make the presenter successul in his career/life. Presenters tell us our power point arrows statistical analysis of process data 2 steps PowerPoint templates will help you be quick off the draw. Just enter your specific text and see your points hit home. Professionals tell us our background PowerPoint templates and PPT Slides will make the presenter look like a pro even if they are not computer savvy. File it down with our Power Point Arrows Statistical Analysis Of Process Data 2 Steps PowerPoint Templates. Get your thoughts into the shape you desire.
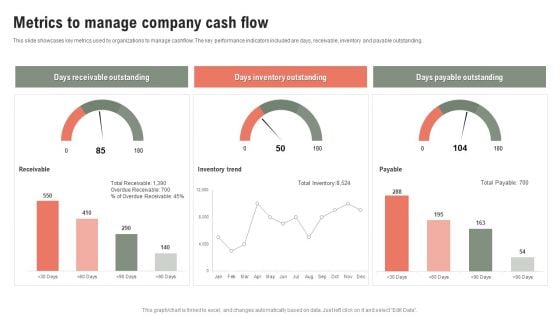
Metrics To Manage Company Cash Flow Ppt Model Gridlines PDF
This slide showcases key metrics used by organizations to manage cashflow. The key performance indicators included are days, receivable, inventory and payable outstanding. Pitch your topic with ease and precision using this Metrics To Manage Company Cash Flow Ppt Model Gridlines PDF. This layout presents information on Days Receivable Outstanding, Days Inventory Outstanding, Days Payable Outstanding. It is also available for immediate download and adjustment. So, changes can be made in the color, design, graphics or any other component to create a unique layout.
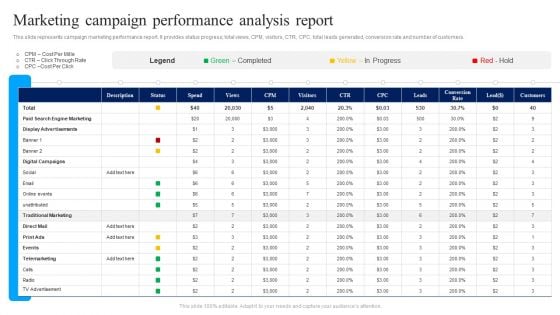
Marketing Campaign Performance Analysis Report Ppt Infographics Infographics PDF
This slide represents campaign marketing performance report. It provides status progress, total views, CPM, visitors, CTR, CPC, total leads generated, conversion rate and number of customers. Showcasing this set of slides titled Marketing Campaign Performance Analysis Report Ppt Infographics Infographics PDF. The topics addressed in these templates are Display Advertisements, Digital Campaigns, Traditional Marketing. All the content presented in this PPT design is completely editable. Download it and make adjustments in color, background, font etc. as per your unique business setting.
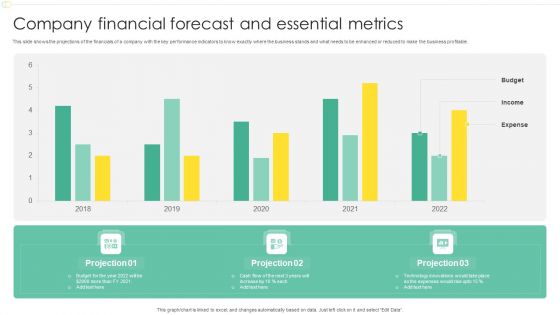
Company Financial Forecast And Essential Metrics Ppt Model Design Templates PDF
This slide shows the projections of the financials of a company with the key performance indicators to know exactly where the business stands and what needs to be enhanced or reduced to make the business profitable. Showcasing this set of slides titled Company Financial Forecast And Essential Metrics Ppt Model Design Templates PDF. The topics addressed in these templates are Budget, Income, Expense, 2018 To 2022. All the content presented in this PPT design is completely editable. Download it and make adjustments in color, background, font etc. as per your unique business setting.
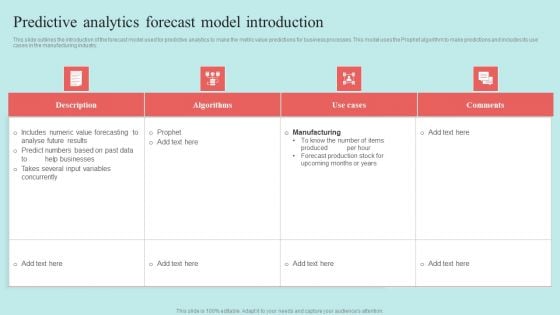
Predictive Data Model Predictive Analytics Forecast Model Introduction Themes PDF
CPU Mainframe Processes Vector Icon Ppt PowerPoint Presentation Model Outfit PDF
Presenting cpu mainframe processes vector icon ppt powerpoint presentation model outfit pdf to dispense important information. This template comprises three stages. It also presents valuable insights into the topics including cpu mainframe processes vector icon. This is a completely customizable PowerPoint theme that can be put to use immediately. So, download it and address the topic impactfully.
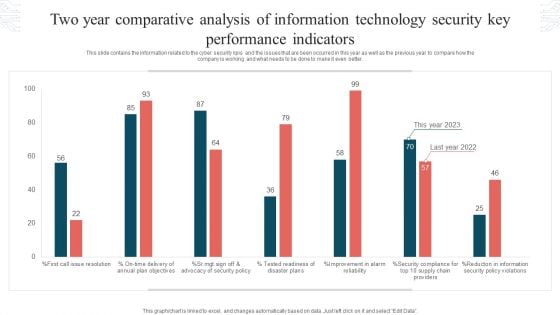
Two Year Comparative Analysis Of Information Technology Security Key Performance Indicators Graphics PDF
This slide contains the information related to the cyber security kpis and the issues that are been occurred in this year as well as the previous year to compare how the company is working and what needs to be done to make it even better. Showcasing this set of slides titled Two Year Comparative Analysis Of Information Technology Security Key Performance Indicators Graphics PDF. The topics addressed in these templates are Tested Readiness, Disaster Plans, Security Policy Violations. All the content presented in this PPT design is completely editable. Download it and make adjustments in color, background, font etc. as per your unique business setting.
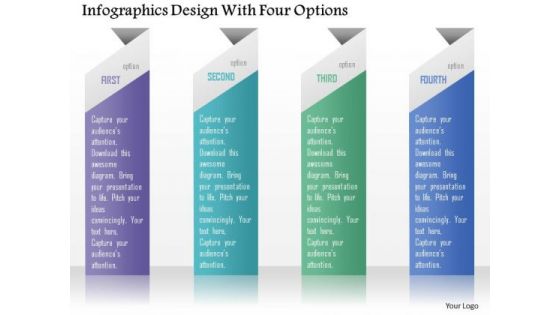
Business Diagram Infographics Design With Four Options Presentation Template
Four staged info graphics has been used to design this power point template. This PPT diagram contains the concept of data flow. Use this PPT for business and marketing data related topics in any presentation.
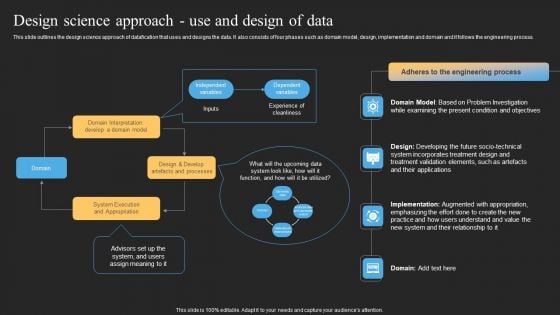
Datafy Design Science Approach Use And Design Of Data Microsoft PDF
This slide outlines the design science approach of datafication that uses and designs the data. It also consists of four phases such as domain model, design, implementation and domain and it follows the engineering process. Present like a pro with Datafy Design Science Approach Use And Design Of Data Microsoft PDF Create beautiful presentations together with your team, using our easy-to-use presentation slides. Share your ideas in real-time and make changes on the fly by downloading our templates. So whether youre in the office, on the go, or in a remote location, you can stay in sync with your team and present your ideas with confidence. With Slidegeeks presentation got a whole lot easier. Grab these presentations today.
Secondary Data Acquisition And Analysis Icon Download PDF
Pitch your topic with ease and precision using this Secondary Data Acquisition And Analysis Icon Download PDF. This layout presents information on Secondary Data, Acquisition Analysis Icon. It is also available for immediate download and adjustment. So, changes can be made in the color, design, graphics or any other component to create a unique layout.
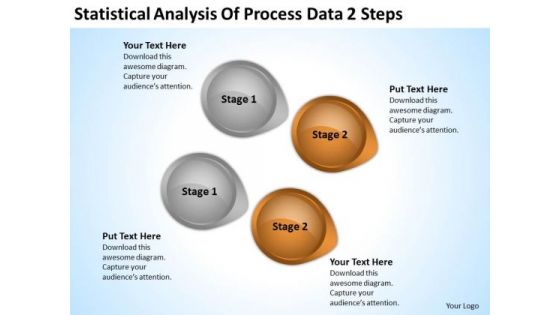
Arrow In PowerPoint Statistical Analysis Of Process Data 2 Steps Ppt Slide
We present our arrow in powerpoint statistical analysis of process data 2 steps ppt Slide.Download our Business PowerPoint Templates because Our PowerPoint Templates and Slides will weave a web of your great ideas. They are gauranteed to attract even the most critical of your colleagues. Use our Circle Charts PowerPoint Templates because Our PowerPoint Templates and Slides will let your words and thoughts hit bullseye everytime. Download our Arrows PowerPoint Templates because Our PowerPoint Templates and Slides will let you Hit the right notes. Watch your audience start singing to your tune. Download and present our Shapes PowerPoint Templates because You have the co-ordinates for your destination of success. Let our PowerPoint Templates and Slides map out your journey. Download and present our Signs PowerPoint Templates because It will let you Set new benchmarks with our PowerPoint Templates and Slides. They will keep your prospects well above par.Use these PowerPoint slides for presentations relating to 3d, abstract, analysis, arrow, background, business, button, chart, circle, circular, color, concept, conservation, cycle, development, diagram, direction, eco, ecology, energy, environment, flow, flowchart, globe, graphic, growing, growth, icon, internet, isolated, object, power, process, protection, recyclable, recycle, recycling, render, resource, saving, sign, solution, sphere, statistic, sustainable, symbol, technology, white. The prominent colors used in the PowerPoint template are Brown, Gray, Black. You can be sure our arrow in powerpoint statistical analysis of process data 2 steps ppt Slide are designed by professionals People tell us our button PowerPoint templates and PPT Slides will make the presenter look like a pro even if they are not computer savvy. You can be sure our arrow in powerpoint statistical analysis of process data 2 steps ppt Slide are designed by professionals Use our arrow PowerPoint templates and PPT Slides have awesome images to get your point across. Presenters tell us our arrow in powerpoint statistical analysis of process data 2 steps ppt Slide will make the presenter successul in his career/life. We assure you our arrow PowerPoint templates and PPT Slides are visually appealing. Get noticed immediately with our Arrow In PowerPoint Statistical Analysis Of Process Data 2 Steps Ppt Slide. Dont waste time struggling with PowerPoint. Let us do it for you.
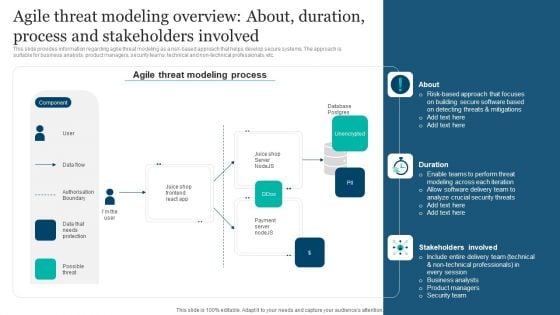
Responsible Technology Playbook Agile Threat Modeling Overview About Duration Process Elements PDF
This slide provides information regarding agile threat modeling as a risk-based approach that helps develop secure systems. The approach is suitable for business analysts, product managers, security teams, technical and non-technical professionals, etc. This modern and well-arranged Responsible Technology Playbook Agile Threat Modeling Overview About Duration Process Elements PDF provides lots of creative possibilities. It is very simple to customize and edit with the Powerpoint Software. Just drag and drop your pictures into the shapes. All facets of this template can be edited with Powerpoint, no extra software is necessary. Add your own material, put your images in the places assigned for them, adjust the colors, and then you can show your slides to the world, with an animated slide included.
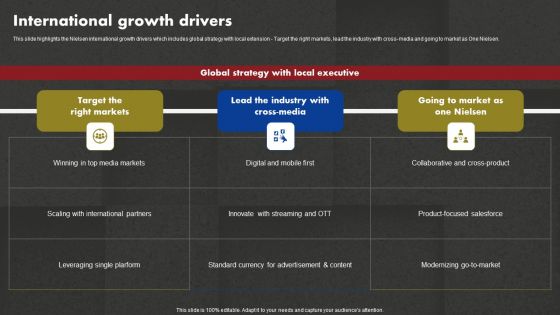
Data And Customer Analysis Company Outline International Growth Drivers Download PDF
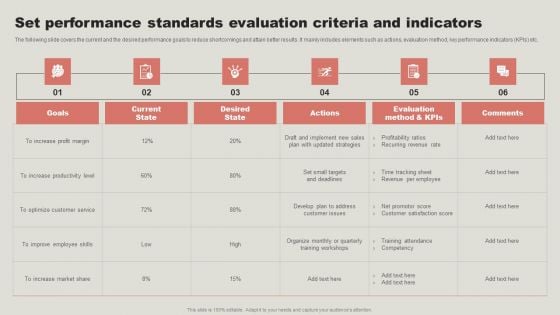
Set Performance Standards Evaluation Criteria And Indicators Brochure PDF
The following slide covers the current and the desired performance goals to reduce shortcomings and attain better results. It mainly includes elements such as actions, evaluation method, key performance indicators KPIs etc. Welcome to our selection of the Set Performance Standards Evaluation Criteria And Indicators Brochure PDF. These are designed to help you showcase your creativity and bring your sphere to life. Planning and Innovation are essential for any business that is just starting out. This collection contains the designs that you need for your everyday presentations. All of our PowerPoints are 100 percent editable, so you can customize them to suit your needs. This multi purpose template can be used in various situations. Grab these presentation templates today.

Industry Report Of Packaged Food Products Part 2 Ppt PowerPoint Presentation Complete Deck With Slides
This Industry Report Of Packaged Food Products Part 2 Ppt PowerPoint Presentation Complete Deck With Slides is designed to help you retain your audiences attention. This content-ready PowerPoint Template enables you to take your audience on a journey and share information in a way that is easier to recall. It helps you highlight the crucial parts of your work so that the audience does not get saddled with information download. This one hundred eleven slide PPT Deck comes prepared with the graphs and charts you could need to showcase your information through visuals. You only need to enter your own data in them. Download this editable PowerPoint Theme and walk into that meeting with confidence.
Real Time Data Utilization Analysis Icon Summary PDF
Persuade your audience using this Real Time Data Utilization Analysis Icon Summary PDF. This PPT design covers three stages, thus making it a great tool to use. It also caters to a variety of topics including Real Time Data Utilization, Analysis Icon. Download this PPT design now to present a convincing pitch that not only emphasizes the topic but also showcases your presentation skills.
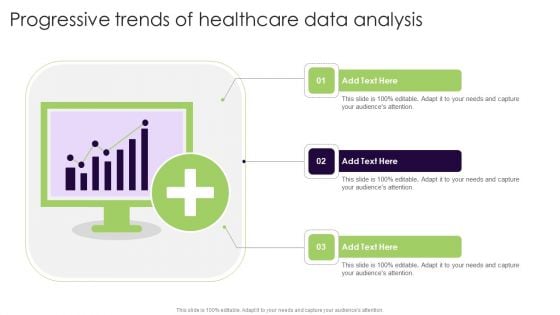
Progressive Trends Of Healthcare Data Analysis Microsoft PDF
Persuade your audience using this Progressive Trends Of Healthcare Data Analysis Microsoft PDF. This PPT design covers three stages, thus making it a great tool to use. It also caters to a variety of topics including Progressive Trends, Healthcare Data Analysis. Download this PPT design now to present a convincing pitch that not only emphasizes the topic but also showcases your presentation skills.
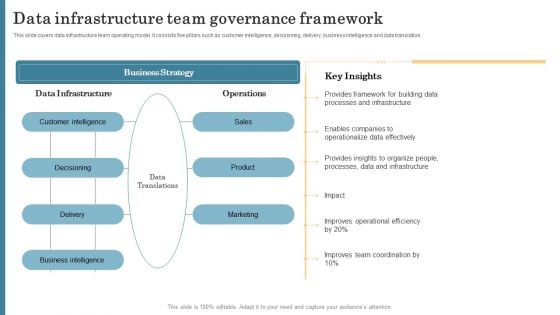
Data Infrastructure Team Governance Framework Template PDF
This slide covers data infrastructure team operating model. It consists five pillars such as customer intelligence, decisioning, delivery, business intelligence and data translation. Showcasing this set of slides titled Data Infrastructure Team Governance Framework Template PDF. The topics addressed in these templates are Data Processes And Infrastructure, Operationalize Data Effectively. All the content presented in this PPT design is completely editable. Download it and make adjustments in color, background, font etc. as per your unique business setting.
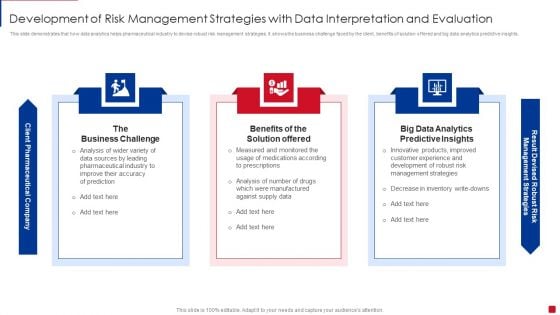
Development Of Risk Management Strategies With Data Interpretation And Evaluation Summary PDF
This slide demonstrates that how data analytics helps pharmaceutical industry to devise robust risk management strategies. It shows the business challenge faced by the client, benefits of solution offered and big data analytics predictive insights. Persuade your audience using this Development Of Risk Management Strategies With Data Interpretation And Evaluation Summary PDF. This PPT design covers three stages, thus making it a great tool to use. It also caters to a variety of topics including Business Challenge, Benefits Solution Offered, Big Data Analytics. Download this PPT design now to present a convincing pitch that not only emphasizes the topic but also showcases your presentation skills.
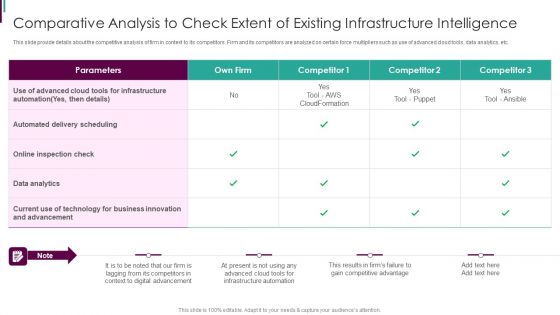
Developing Business Analytics Framework Comparative Analysis To Check Extent Designs PDF
This slide provide details about the competitive analysis of firm in context to its competitors. Firm and its competitors are analyzed on certain force multipliers such as use of advanced cloud tools, data analytics, etc. Deliver an awe inspiring pitch with this creative Developing Business Analytics Framework Comparative Analysis To Check Extent Designs PDF bundle. Topics like Infrastructure, Technology Business, Innovation Advancement can be discussed with this completely editable template. It is available for immediate download depending on the needs and requirements of the user.
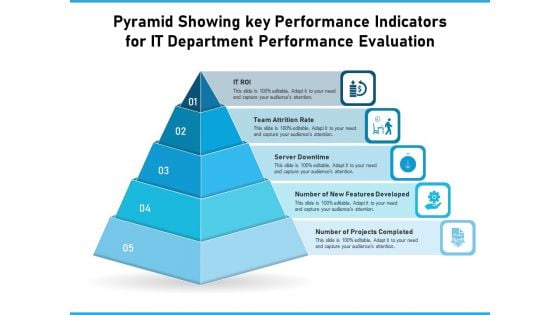
Pyramid Showing Key Performance Indicators For IT Department Performance Evaluation Ppt PowerPoint Presentation Show Graphics Design PDF
Persuade your audience using this pyramid showing key performance indicators for it department performance evaluation ppt powerpoint presentation show graphics design pdf. This PPT design covers five stages, thus making it a great tool to use. It also caters to a variety of topics including it roi, team attrition rate, server downtime, number of new features developed, number of projects completed. Download this PPT design now to present a convincing pitch that not only emphasizes the topic but also showcases your presentation skills.
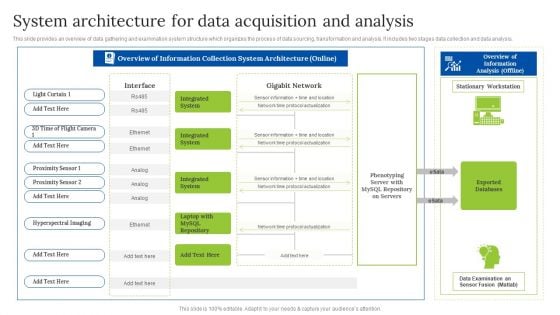
System Architecture For Data Acquisition And Analysis Professional PDF
This slide provides an overview of data gathering and examination system structure which organizes the process of data sourcing, transformation and analysis. It includes two stages data collection and data analysis.Pitch your topic with ease and precision using this System Architecture For Data Acquisition And Analysis Professional PDF. This layout presents information on Overview Of Information, Collection System, Architecture Online. It is also available for immediate download and adjustment. So, changes can be made in the color, design, graphics or any other component to create a unique layout.
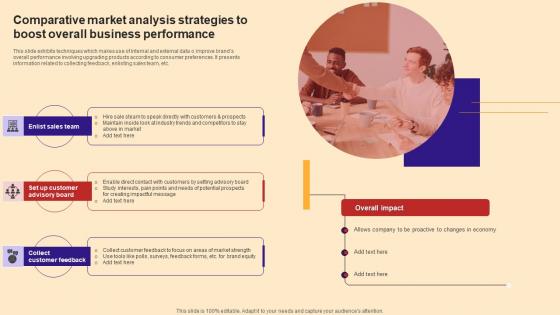
Comparative Market Analysis Strategies To Boost Overall Business Performance Mockup Pdf
This slide exhibits techniques which makes use of internal and external data o improve brands overall performance involving upgrading products according to consumer preferences. It presents information related to collecting feedback, enlisting sales team, etc.Showcasing this set of slides titled Comparative Market Analysis Strategies To Boost Overall Business Performance Mockup Pdf The topics addressed in these templates are Speak Directly, Industry Trends, Market Strength All the content presented in this PPT design is completely editable. Download it and make adjustments in color, background, font etc. as per your unique business setting. This slide exhibits techniques which makes use of internal and external data o improve brands overall performance involving upgrading products according to consumer preferences. It presents information related to collecting feedback, enlisting sales team, etc.
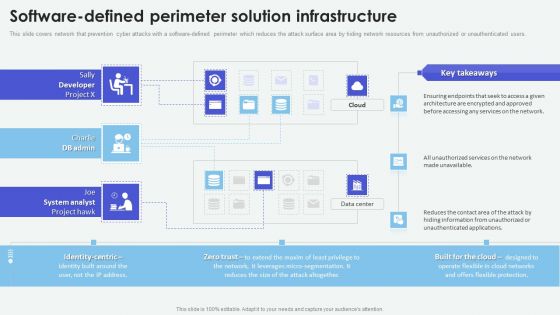
Cloud Based Computing Analysis Software Defined Perimeter Solution Infrastructure Summary PDF
This slide covers network that prevention cyber attacks with a software-defined perimeter which reduces the attack surface area by hiding network resources from unauthorized or unauthenticated users. Take your projects to the next level with our ultimate collection of Cloud Based Computing Analysis Software Defined Perimeter Solution Infrastructure Summary PDF. Slidegeeks has designed a range of layouts that are perfect for representing task or activity duration, keeping track of all your deadlines at a glance. Tailor these designs to your exact needs and give them a truly corporate look with your own brand colors theyll make your projects stand out from the rest
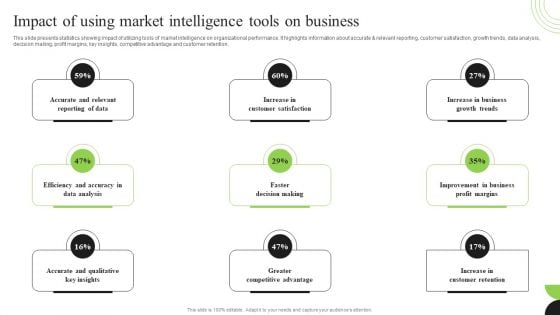
Guidebook For Executing Business Market Intelligence Impact Of Using Market Intelligence Formats PDF
This slide presents statistics showing impact of utilizing tools of market intelligence on organizational performance. It highlights information about accurate and relevant reporting, customer satisfaction, growth trends, data analysis, decision making, profit margins, key insights, competitive advantage and customer retention. This Guidebook For Executing Business Market Intelligence Impact Of Using Market Intelligence Formats PDF is perfect for any presentation, be it in front of clients or colleagues. It is a versatile and stylish solution for organizing your meetings. The product features a modern design for your presentation meetings. The adjustable and customizable slides provide unlimited possibilities for acing up your presentation. Slidegeeks has done all the homework before launching the product for you. So, do not wait, grab the presentation templates today
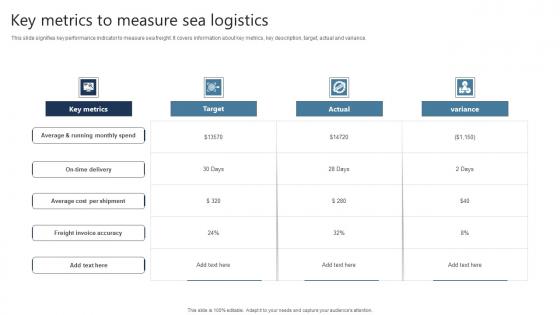
Key Metrics To Measure Sea Logistics Graphics Pdf
This slide signifies key performance indicator to measure sea freight. It covers information about key metrics, key description, target, actual and variance. Pitch your topic with ease and precision using this Key Metrics To Measure Sea Logistics Graphics Pdf This layout presents information on Freight Invoice Accuracy, Key Metrics, Target It is also available for immediate download and adjustment. So, changes can be made in the color, design, graphics or any other component to create a unique layout. This slide signifies key performance indicator to measure sea freight. It covers information about key metrics, key description, target, actual and variance.
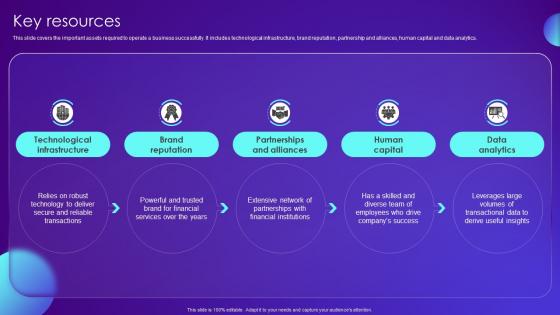
Key Resources Payment Card Services Business Model BMC SS V
This slide covers the important assets required to operate a business successfully. It includes technological infrastructure, brand reputation, partnership and alliances, human capital and data analytics. Boost your pitch with our creative Key Resources Payment Card Services Business Model BMC SS V. Deliver an awe-inspiring pitch that will mesmerize everyone. Using these presentation templates you will surely catch everyones attention. You can browse the ppts collection on our website. We have researchers who are experts at creating the right content for the templates. So you do not have to invest time in any additional work. Just grab the template now and use them. This slide covers the important assets required to operate a business successfully. It includes technological infrastructure, brand reputation, partnership and alliances, human capital and data analytics.

Market Potential Automotive Designing Company Investor Funding Pitch Deck Pictures Pdf
This slide represents the data that signifies the total addressable market, serviceable available market, and serviceable obtainable market. Are you in need of a template that can accommodate all of your creative concepts This one is crafted professionally and can be altered to fit any style. Use it with Google Slides or PowerPoint. Include striking photographs, symbols, depictions, and other visuals. Fill, move around, or remove text boxes as desired. Test out color palettes and font mixtures. Edit and save your work, or work with colleagues. DownloadMarket Potential Automotive Designing Company Investor Funding Pitch Deck Pictures Pdf and observe how to make your presentation outstanding. Give an impeccable presentation to your group and make your presentation unforgettable. This slide represents the data that signifies the total addressable market, serviceable available market, and serviceable obtainable market.
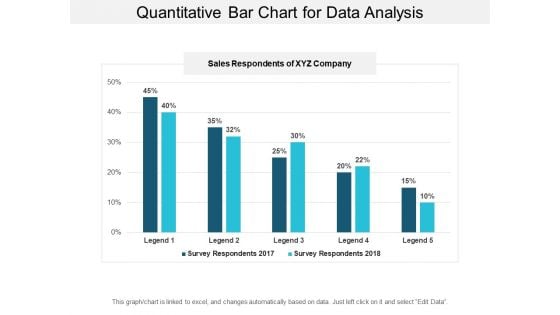
Quantitative Bar Chart For Data Analysis Ppt PowerPoint Presentation Model Graphic Tips
This is a quantitative bar chart for data analysis ppt powerpoint presentation model graphic tips. This is a two stage process. The stages in this process are financial analysis, quantitative, statistical modelling.
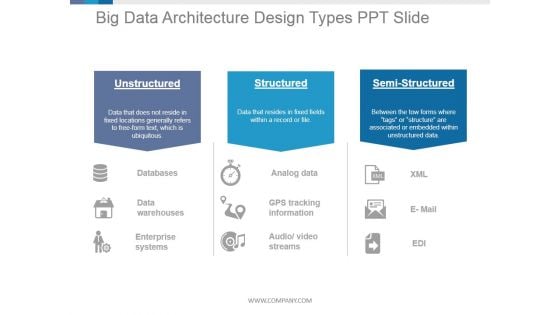
Big Data Architecture Design Types Ppt PowerPoint Presentation Rules
This is a big data architecture design types ppt powerpoint presentation rules. This is a three stage process. The stages in this process are unstructured, structured, semi structured, databases, analog data, xml.
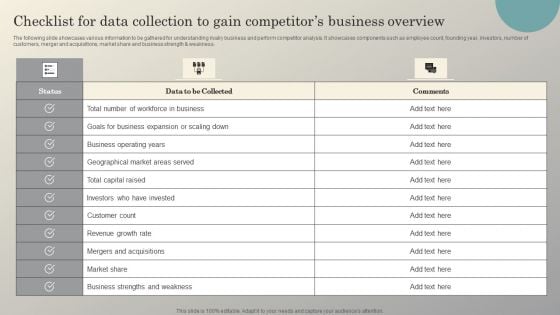
Steps To Conduct Competitor Analysis Checklist For Data Collection To Gain Competitors Ideas PDF
The following slide showcases various information to be gathered for understanding rivalry business and perform competitor analysis. It showcases components such as employee count, founding year, investors, number of customers, merger and acquisitions, market share and business strength and weakness. This Steps To Conduct Competitor Analysis Checklist For Data Collection To Gain Competitors Ideas PDF is perfect for any presentation, be it in front of clients or colleagues. It is a versatile and stylish solution for organizing your meetings. The Steps To Conduct Competitor Analysis Checklist For Data Collection To Gain Competitors Ideas PDF features a modern design for your presentation meetings. The adjustable and customizable slides provide unlimited possibilities for acing up your presentation. Slidegeeks has done all the homework before launching the product for you. So, do not wait, grab the presentation templates today
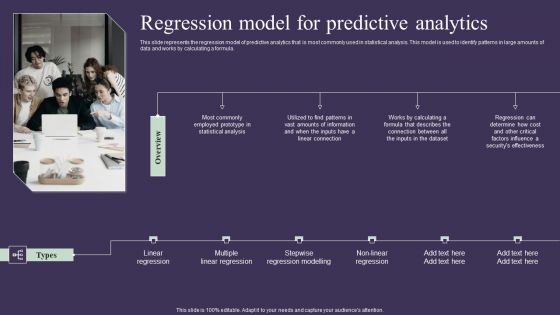
Projection Model Regression Model For Predictive Analytics Sample PDF
This slide represents the regression model of predictive analytics that is most commonly used in statistical analysis. This model is used to identify patterns in large amounts of data and works by calculating a formula. From laying roadmaps to briefing everything in detail, our templates are perfect for you. You can set the stage with your presentation slides. All you have to do is download these easy-to-edit and customizable templates. Projection Model Regression Model For Predictive Analytics Sample PDF will help you deliver an outstanding performance that everyone would remember and praise you for. Do download this presentation today.
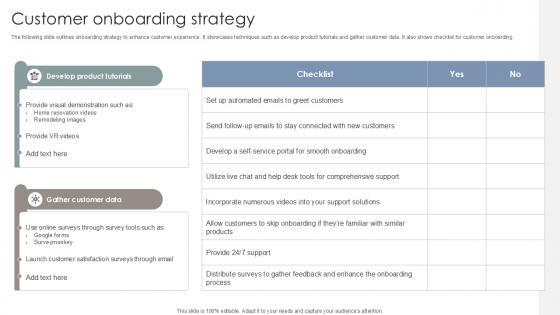
Customer Onboarding Strategy Interior Design Company Market Entry Plan PPT Sample GTM SS V
The following slide outlines onboarding strategy to enhance customer experience. It showcases techniques such as develop product tutorials and gather customer data. It also shows checklist for customer onboarding. Do you have to make sure that everyone on your team knows about any specific topic I yes, then you should give Customer Onboarding Strategy Interior Design Company Market Entry Plan PPT Sample GTM SS V a try. Our experts have put a lot of knowledge and effort into creating this impeccable Customer Onboarding Strategy Interior Design Company Market Entry Plan PPT Sample GTM SS V. You can use this template for your upcoming presentations, as the slides are perfect to represent even the tiniest detail. You can download these templates from the Slidegeeks website and these are easy to edit. So grab these today The following slide outlines onboarding strategy to enhance customer experience. It showcases techniques such as develop product tutorials and gather customer data. It also shows checklist for customer onboarding.
Business Planning Strategy To Many Process Diagram International Marketing Concepts
We present our business planning strategy to many process diagram international marketing concepts.Use our Process and Flows PowerPoint Templates because They will Put the wind in your sails. Skim smoothly over the choppy waters of the market. Download our Flow Charts PowerPoint Templates because Our PowerPoint Templates and Slides will Embellish your thoughts. They will help you illustrate the brilliance of your ideas. Present our Business PowerPoint Templates because Our PowerPoint Templates and Slides offer you the widest possible range of options. Use our Marketing PowerPoint Templates because It will Raise the bar of your Thoughts. They are programmed to take you to the next level. Download our Success PowerPoint Templates because It will Strengthen your hand with your thoughts. They have all the aces you need to win the day.Use these PowerPoint slides for presentations relating to Business, chart, circle, color, colorfull, concept, connect,connection, control, cycle, data, diagram, direction, explanation,flow, flowchart, graph, graphic, idea, illustration, information, link, management,mapping, marketing, model, organization, plan, present, presentation, process, process chart, relate, report,step, team, tool, topic, vector, work. The prominent colors used in the PowerPoint template are Green, Gray, Black. Publicize your views with our Business Planning Strategy To Many Process Diagram International Marketing Concepts. Download without worries with our money back guaranteee.
Cluster Analysis In Marketing 9 Stages Actual Business Plan Examples PowerPoint Slides
We present our cluster analysis in marketing 9 stages actual business plan examples PowerPoint Slides.Download and present our Business PowerPoint Templates because Our PowerPoint Templates and Slides are the chords of your song. String them along and provide the lilt to your views. Download and present our Flow Charts PowerPoint Templates because Our PowerPoint Templates and Slides will provide weight to your words. They will bring out the depth of your thought process. Download and present our Process and Flows PowerPoint Templates because Our PowerPoint Templates and Slides are conceived by a dedicated team. Use them and give form to your wondrous ideas. Download and present our Marketing PowerPoint Templates because Our PowerPoint Templates and Slides will give you great value for your money. Be assured of finding the best projection to highlight your words. Download and present our Shapes PowerPoint Templates because Our PowerPoint Templates and Slides will let you Illuminate the road ahead to Pinpoint the important landmarks along the way.Use these PowerPoint slides for presentations relating to Mapping, vector, chart, flow, flowchart, process, model, step, tool, blank, processdiagram, concept, topic, presentation, relate, circle, graphic, data, report, marketing, idea, circlepattern, team, management, graph, cycle, illustration, connection, processchart,direction, plans, color, text, phase, organization, control, connect, link, explanation, mapping, present. The prominent colors used in the PowerPoint template are Blue, Gray, Black. Map out your strategy with our Cluster Analysis In Marketing 9 Stages Actual Business Plan Examples PowerPoint Slides. Download without worries with our money back guaranteee.
Cluster Analysis In Marketing 9 Stages Ppt Business Plan Format PowerPoint Templates
We present our cluster analysis in marketing 9 stages ppt business plan format PowerPoint templates.Download and present our Flow Charts PowerPoint Templates because Your ideas provide food for thought. Our PowerPoint Templates and Slides will help you create a dish to tickle the most discerning palate. Present our Process and Flows PowerPoint Templates because Our PowerPoint Templates and Slides help you pinpoint your timelines. Highlight the reasons for your deadlines with their use. Download and present our Shapes PowerPoint Templates because you can Break through with our PowerPoint Templates and Slides. Bring down the mental barriers of your audience. Use our Circle Charts PowerPoint Templates because Our PowerPoint Templates and Slides will let you Hit the target. Go the full distance with ease and elan. Download our Marketing PowerPoint Templates because our PowerPoint Templates and Slides will give your ideas the shape.Use these PowerPoint slides for presentations relating to Mapping, vector, chart, flow, flowchart, process, model, step, tool, blank, processdiagram, concept, topic, presentation, relate, circle, graphic, data, report, marketing, idea, circlepattern, team, management, graph, cycle, illustration, connection, processchart,direction, plans, color, text, phase, organization, control, connect, link, explanation, mapping, present. The prominent colors used in the PowerPoint template are Blue light, White, Gray. Lean is in, fat is out. Our Cluster Analysis In Marketing 9 Stages Ppt Business Plan Format PowerPoint Templates achieve the desired look.
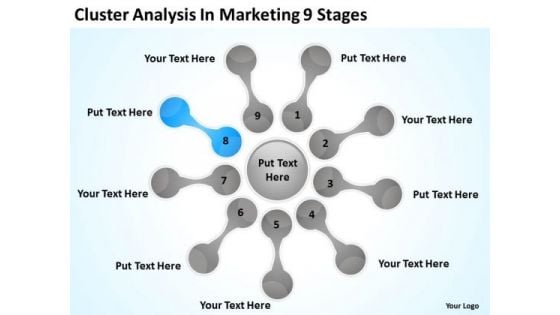
Cluster Analysis In Marketing 9 Stages Ppt Fill The Blank Business Plan PowerPoint Slides
We present our cluster analysis in marketing 9 stages ppt fill the blank business plan PowerPoint Slides.Download and present our Flow Charts PowerPoint Templates because Our PowerPoint Templates and Slides are focused like a searchlight beam. They highlight your ideas for your target audience. Use our Process and Flows PowerPoint Templates because They will Put your wonderful verbal artistry on display. Our PowerPoint Templates and Slides will provide you the necessary glam and glitter. Use our Shapes PowerPoint Templates because They will Put your wonderful verbal artistry on display. Our PowerPoint Templates and Slides will provide you the necessary glam and glitter. Use our Circle Charts PowerPoint Templates because Our PowerPoint Templates and Slides will weave a web of your great ideas. They are gauranteed to attract even the most critical of your colleagues. Use our Marketing PowerPoint Templates because These PowerPoint Templates and Slides will give the updraft to your ideas. See them soar to great heights with ease.Use these PowerPoint slides for presentations relating to Mapping, vector, chart, flow, flowchart, process, model, step, tool, blank, processdiagram, concept, topic, presentation, relate, circle, graphic, data, report, marketing, idea, circlepattern, team, management, graph, cycle, illustration, connection, processchart,direction, plans, color, text, phase, organization, control, connect, link, explanation, mapping, present. The prominent colors used in the PowerPoint template are Blue light, White, Gray. An array of colors give our Cluster Analysis In Marketing 9 Stages Ppt Fill The Blank Business Plan PowerPoint Slides an alluring blend. They make your thoughts very enticing.
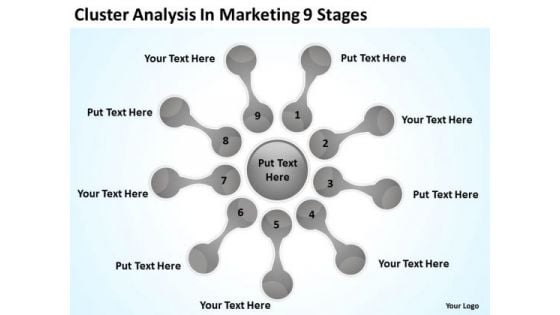
Cluster Analysis In Marketing 9 Stages Start Up Business Plan Example PowerPoint Templates
We present our cluster analysis in marketing 9 stages start up business plan example PowerPoint templates.Present our Process and Flows PowerPoint Templates because Our PowerPoint Templates and Slides come in all colours, shades and hues. They help highlight every nuance of your views. Download our Flow Charts PowerPoint Templates because Our PowerPoint Templates and Slides are the chords of your song. String them along and provide the lilt to your views. Use our Business PowerPoint Templates because You can Create a matrix with our PowerPoint Templates and Slides. Feel the strength of your ideas click into place. Download our Marketing PowerPoint Templates because You are well armed with penetrative ideas. Our PowerPoint Templates and Slides will provide the gunpowder you need. Download our Shapes PowerPoint Templates because Your audience will believe you are the cats whiskers.Use these PowerPoint slides for presentations relating to Mapping, vector, chart, flow, flowchart, process, model, step, tool, blank, processdiagram, concept, topic, presentation, relate, circle, graphic, data, report, marketing, idea, circlepattern, team, management, graph, cycle, illustration, connection, processchart,direction, plans, color, text, phase, organization, control, connect, link, explanation, mapping, present. The prominent colors used in the PowerPoint template are Gray, Black, White. Your ideas will raise the stocks. Gain equity with our Cluster Analysis In Marketing 9 Stages Start Up Business Plan Example PowerPoint Templates.
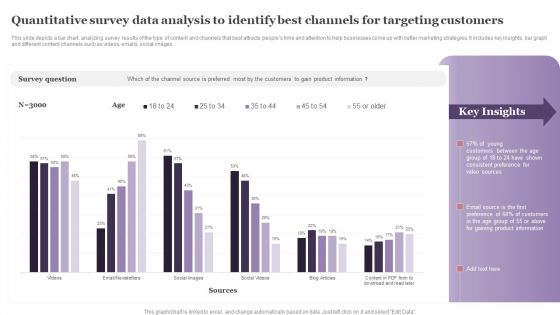
Quantitative Survey Data Analysis To Identify Best Channels For Targeting Customers Formats PDF
This slide depicts a bar chart, analyzing survey results of the type of content and channels that best attracts peoples time and attention to help businesses come up with better marketing strategies. It includes key insights, bar graph and different content channels such as videos, emails, social images. Pitch your topic with ease and precision using this Quantitative Survey Data Analysis To Identify Best Channels For Targeting Customers Formats PDF. This layout presents information on Survey Question, Young Customers, Consistent Preference. It is also available for immediate download and adjustment. So, changes can be made in the color, design, graphics or any other component to create a unique layout.
Key Performance Indicators To Track Sales Performance Ppt PowerPoint Presentation Icon Diagrams PDF
Showcasing this set of slides titled key performance indicators to track sales performance ppt powerpoint presentation icon diagrams pdf. The topics addressed in these templates are key performance indicators to track sales performance. All the content presented in this PPT design is completely editable. Download it and make adjustments in color, background, font etc. as per your unique business setting.
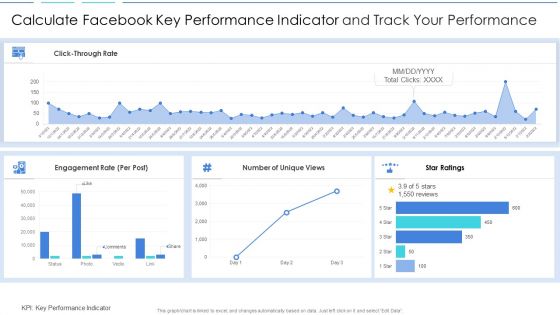
Calculate Facebook Key Performance Indicator And Track Your Performance Information PDF
Showcasing this set of slides titled calculate facebook key performance indicator and track your performance information pdf. The topics addressed in these templates are calculate facebook key performance indicator and track your performance. All the content presented in this PPT design is completely editable. Download it and make adjustments in color, background, font etc. as per your unique business setting.
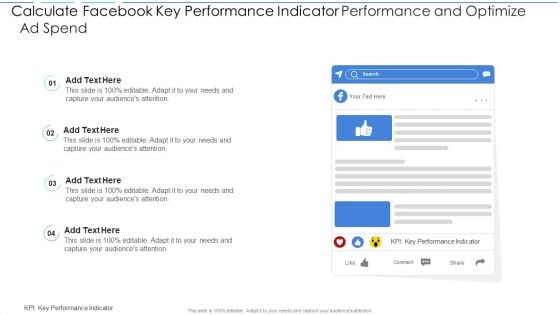
Calculate Facebook Key Performance Indicator Performance And Optimize Ad Spend Brochure PDF
Showcasing this set of slides titled calculate facebook key performance indicator performance and optimize ad spend brochure pdf. The topics addressed in these templates are calculate facebook key performance indicator performance and optimize ad spend. All the content presented in this PPT design is completely editable. Download it and make adjustments in color, background, font etc. as per your unique business setting.
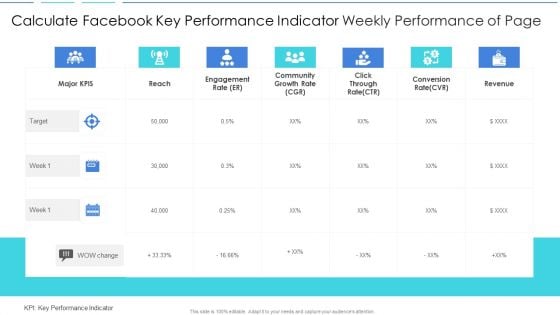
Calculate Facebook Key Performance Indicator Weekly Performance Of Page Elements PDF
Pitch your topic with ease and precision using this calculate facebook key performance indicator weekly performance of page elements pdf. This layout presents information on calculate facebook key performance indicator weekly performance of page. It is also available for immediate download and adjustment. So, changes can be made in the color, design, graphics or any other component to create a unique layout.
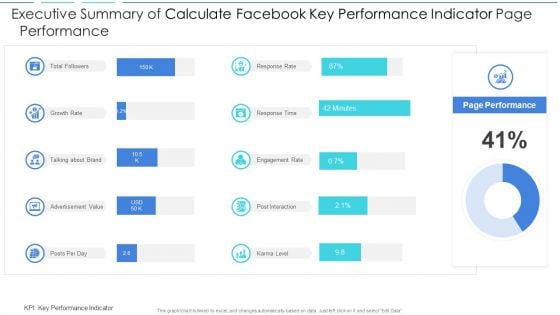
Executive Summary Of Calculate Facebook Key Performance Indicator Page Performance Download PDF
Showcasing this set of slides titled executive summary of calculate facebook key performance indicator page performance download pdf. The topics addressed in these templates are executive summary of calculate facebook key performance indicator page performance. All the content presented in this PPT design is completely editable. Download it and make adjustments in color, background, font etc. as per your unique business setting.
Icon Of Key Performance Indicators For Continuous Performance Measurement Professional PDF
Showcasing this set of slides titled Icon Of Key Performance Indicators For Continuous Performance Measurement Professional PDF The topics addressed in these templates are Icon Of Key Performance, Indicators For Continuous, Performance Measurement All the content presented in this PPT design is completely editable. Download it and make adjustments in color, background, font etc. as per your unique business setting.
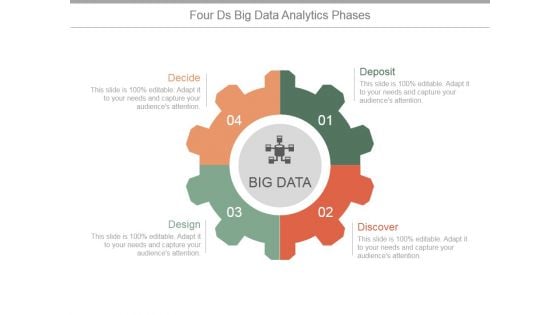
Four Ds Big Data Analytics Phases Ppt PowerPoint Presentation Shapes
This is a four ds big data analytics phases ppt powerpoint presentation shapes. This is a four stage process. The stages in this process are deposit, discover, design, decide.
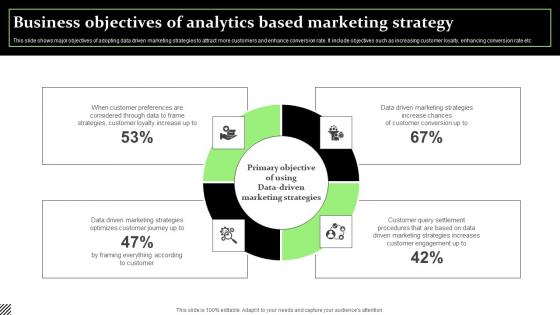
Business Objectives Of Analytics Based Marketing Strategy Formats Pdf
This slide shows major objectives of adopting data driven marketing strategies to attract more customers and enhance conversion rate. It include objectives such as increasing customer loyalty, enhancing conversion rate etc.Showcasing this set of slides titled Business Objectives Of Analytics Based Marketing Strategy Formats Pdf The topics addressed in these templates are Customer Preferences, Strategies Customer, Driven Marketing Strategies All the content presented in this PPT design is completely editable. Download it and make adjustments in color, background, font etc. as per your unique business setting. This slide shows major objectives of adopting data driven marketing strategies to attract more customers and enhance conversion rate. It include objectives such as increasing customer loyalty, enhancing conversion rate etc.
Projection Model Uses Of Predictive Analytics Credit Icons PDF
This slide describes the usage of predictive analytics in banking and other financial institutions for credit purposes. It is used to calculate the credit score of a person or organization and to ensure that borrower does not fail to return the loan. Crafting an eye-catching presentation has never been more straightforward. Let your presentation shine with this tasteful yet straightforward Projection Model Uses Of Predictive Analytics Credit Icons PDF template. It offers a minimalistic and classy look that is great for making a statement. The colors have been employed intelligently to add a bit of playfulness while still remaining professional. Construct the ideal Projection Model Uses Of Predictive Analytics Credit Icons PDF that effortlessly grabs the attention of your audience Begin now and be certain to wow your customers
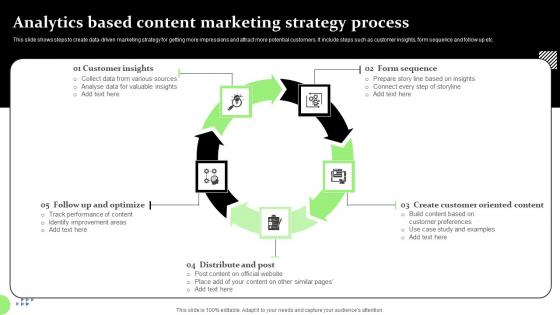
Analytics Based Content Marketing Strategy Process Professional Pdf
This slide shows steps to create data driven marketing strategy for getting more impressions and attract more potential customers. It include steps such as customer insights, form sequence and follow up etc this set of slides titled Analytics Based Content Marketing Strategy Process Professional Pdf The topics addressed in these templates are Customer Insights, Form Sequence, Customer Oriented Content All the content presented in this PPT design is completely editable. Download it and make adjustments in color, background, font etc. as per your unique business setting. This slide shows steps to create data driven marketing strategy for getting more impressions and attract more potential customers. It include steps such as customer insights, form sequence and follow up etc
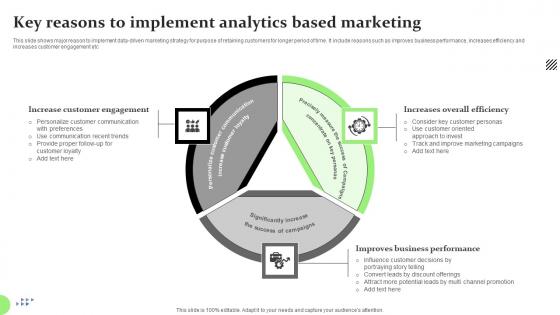
Key Reasons To Implement Analytics Based Marketing Diagrams Pdf
This slide shows major reason to implement data driven marketing strategy for purpose of retaining customers for longer period of time. It include reasons such as improves business performance, increases efficiency and increases customer engagement etc.Pitch your topic with ease and precision using this Key Reasons To Implement Analytics Based Marketing Diagrams Pdf This layout presents information on Increase Customer Engagement, Increases Overall Efficiency, Improves Business Performance It is also available for immediate download and adjustment. So, changes can be made in the color, design, graphics or any other component to create a unique layout. This slide shows major reason to implement data driven marketing strategy for purpose of retaining customers for longer period of time. It include reasons such as improves business performance, increases efficiency and increases customer engagement etc.


 Continue with Email

 Home
Home


