Portfolio Dashboard

Traditional Business Models Hindering Growth Of Organization DT SS V
This slide analyzes the key challenges faced by organizations in the digital age due to traditional business models. It includes limited market reach, e-commerce competition, lack of data utilization and innovation stagnation.Slidegeeks is here to make your presentations a breeze with Traditional Business Models Hindering Growth Of Organization DT SS V With our easy-to-use and customizable templates, you can focus on delivering your ideas rather than worrying about formatting. With a variety of designs to choose from, you are sure to find one that suits your needs. And with animations and unique photos, illustrations, and fonts, you can make your presentation pop. So whether you are giving a sales pitch or presenting to the board, make sure to check out Slidegeeks first This slide analyzes the key challenges faced by organizations in the digital age due to traditional business models. It includes limited market reach, e-commerce competition, lack of data utilization and innovation stagnation.
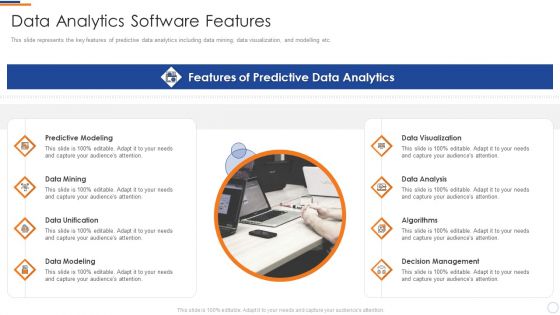
Business Intelligence And Big Transformation Toolkit Data Analytics Software Features Slides PDF
This slide represents the key features of predictive data analytics including data mining, data visualization, and modelling etc. This is a business intelligence and big transformation toolkit data analytics software features slides pdf template with various stages. Focus and dispense information on eight stages using this creative set, that comes with editable features. It contains large content boxes to add your information on topics like predictive modeling, data mining, data unification, data modeling, visualization and presentation. You can also showcase facts, figures, and other relevant content using this PPT layout. Grab it now.
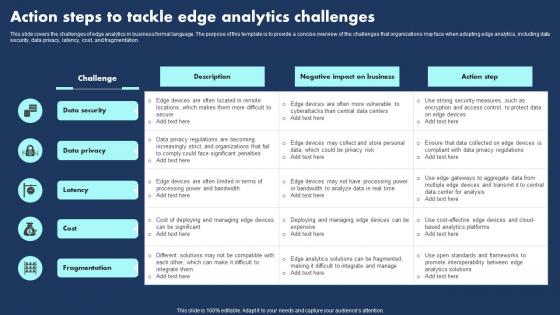
Action Steps To Tackle Edge Analytics Challenges Template Pdf
This slide covers the challenges of edge analytics in business formal language. The purpose of this template is to provide a concise overview of the challenges that organizations may face when adopting edge analytics, including data security, data privacy, latency, cost, and fragmentation.Showcasing this set of slides titled Action Steps To Tackle Edge Analytics Challenges Template Pdf The topics addressed in these templates are Processing Power Bandwidth, Integrate Manage, Promote Interoperability All the content presented in this PPT design is completely editable. Download it and make adjustments in color, background, font etc. as per your unique business setting. This slide covers the challenges of edge analytics in business formal language. The purpose of this template is to provide a concise overview of the challenges that organizations may face when adopting edge analytics, including data security, data privacy, latency, cost, and fragmentation.
Performance Tracking Metrics Of Marketing Return On Investment Graphics PDF
This slide shows various key performance indicators to measure performance of marketing ROI. It includes metrics such as unique monthly visitors, cost per lead, return on ad spend, average order value, etc. Showcasing this set of slides titled Performance Tracking Metrics Of Marketing Return On Investment Graphics PDF. The topics addressed in these templates are Cost Per Lead, Customer Lifetime Value, Unique Monthly Visitors. All the content presented in this PPT design is completely editable. Download it and make adjustments in color, background, font etc. as per your unique business setting.
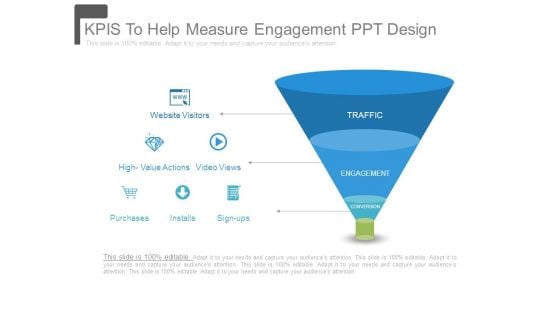
Kpis To Help Measure Engagement Ppt Design
This is a kpis to help measure engagement ppt design. This is a three stage process. The stages in this process are traffic, engagement, conversion, website visitors, high value actions, video views, purchases, installs, sign ups.
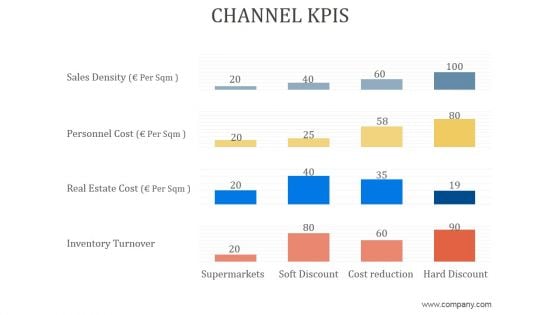
Channel Kpis Ppt PowerPoint Presentation Background Designs
This is a channel kpis ppt powerpoint presentation background designs. This is a four stage process. The stages in this process are sales density, personnel cost, real estate cost, inventory turnover, supermarkets, soft discount, cost reduction, hard discount.
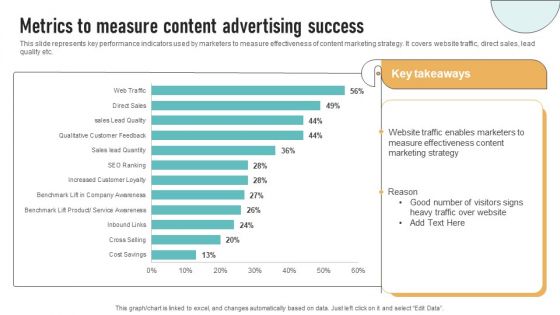
Metrics To Measure Content Advertising Success Demonstration PDF
This slide represents key performance indicators used by marketers to measure effectiveness of content marketing strategy. It covers website traffic, direct sales, lead quality etc. The Metrics To Measure Content Advertising Success Demonstration PDF is a compilation of the most recent design trends as a series of slides. It is suitable for any subject or industry presentation, containing attractive visuals and photo spots for businesses to clearly express their messages. This template contains a variety of slides for the user to input data, such as structures to contrast two elements, bullet points, and slides for written information. Slidegeeks is prepared to create an impression.
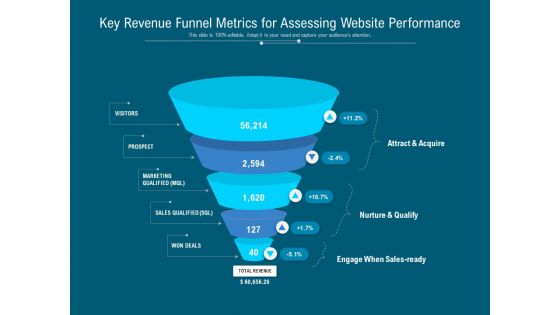
Key Revenue Funnel Metrics For Assessing Website Performance Ppt PowerPoint Presentation Infographics Master Slide PDF
Persuade your audience using this key revenue funnel metrics for assessing website performance ppt powerpoint presentation infographics master slide pdf. This PPT design covers five stages, thus making it a great tool to use. It also caters to a variety of topics including visitors, prospect, marketing qualified mql, sales qualified sql, won deals, attract and acquire, nurture and qualify, engage when sales ready. Download this PPT design now to present a convincing pitch that not only emphasizes the topic but also showcases your presentation skills.

Difference Between Data Scientist And MLOPs Engineer Introduction To MLOPs IT
This slide provide a clear understanding of the distinctions between these two roles in the context of their work, responsibilities, skill sets, and education. The purpose of this slide is to highlight the key differences between data scientest and MLOps engineer. This Difference Between Data Scientist And MLOPs Engineer Introduction To MLOPs IT is perfect for any presentation, be it in front of clients or colleagues. It is a versatile and stylish solution for organizing your meetings. The Difference Between Data Scientist And MLOPs Engineer Introduction To MLOPs IT features a modern design for your presentation meetings. The adjustable and customizable slides provide unlimited possibilities for acing up your presentation. Slidegeeks has done all the homework before launching the product for you. So, do not wait, grab the presentation templates today This slide provide a clear understanding of the distinctions between these two roles in the context of their work, responsibilities, skill sets, and education. The purpose of this slide is to highlight the key differences between data scientest and MLOps engineer.

Enhancing Digital Visibility Using SEO Content Strategy Kpis Measure Performance Content Development Background PDF
This slide shows various metrics which can be used by marketing manager to track performance of content development strategy. It includes various key performance indicators such as leads generated, open and click through rate, page views, etc. Welcome to our selection of the Enhancing Digital Visibility Using SEO Content Strategy Kpis Measure Performance Content Development Background PDF. These are designed to help you showcase your creativity and bring your sphere to life. Planning and Innovation are essential for any business that is just starting out. This collection contains the designs that you need for your everyday presentations. All of our PowerPoints are 100 percent editable, so you can customize them to suit your needs. This multi purpose template can be used in various situations. Grab these presentation templates today.
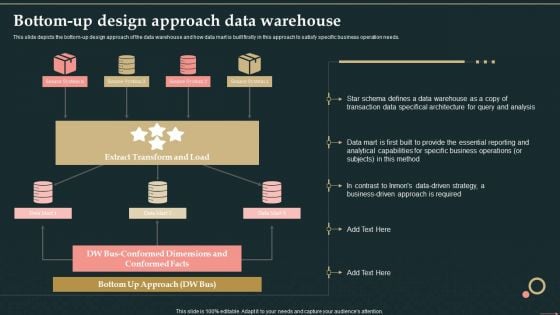
Management Information System Bottom Up Design Approach Data Warehouse Graphics PDF
This slide depicts the bottom-up design approach of the data warehouse and how data mart is built firstly in this approach to satisfy specific business operation needs.Deliver an awe inspiring pitch with this creative Management Information System Bottom Up Design Approach Data Warehouse Graphics PDF bundle. Topics like Extract Transform, Conformed Dimensions, Bottom Approach can be discussed with this completely editable template. It is available for immediate download depending on the needs and requirements of the user.
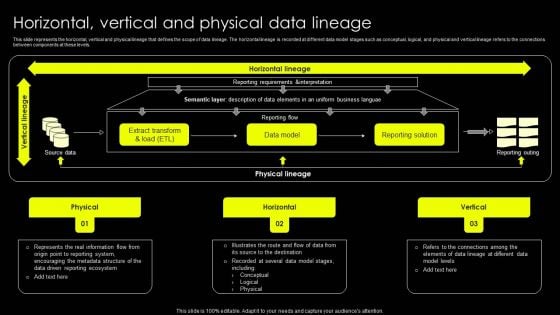
Data Lineage Implementation Horizontal Vertical And Physical Data Lineage Topics PDF
This slide represents the horizontal, vertical and physical lineage that defines the scope of data lineage. The horizontal lineage is recorded at different data model stages such as conceptual, logical, and physical and vertical lineage refers to the connections between components at these levels. Retrieve professionally designed Data Lineage Implementation Horizontal Vertical And Physical Data Lineage Topics PDF to effectively convey your message and captivate your listeners. Save time by selecting pre made slideshows that are appropriate for various topics, from business to educational purposes. These themes come in many different styles, from creative to corporate, and all of them are easily adjustable and can be edited quickly. Access them as PowerPoint templates or as Google Slides themes. You do not have to go on a hunt for the perfect presentation because Slidegeeks got you covered from everywhere.
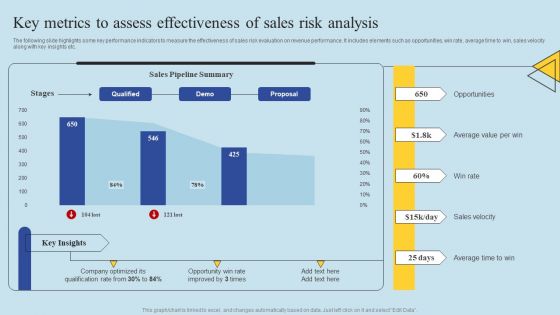
Determining Risks In Sales Administration Procedure Key Metrics To Assess Effectiveness Of Sales Pictures PDF
The following slide highlights some key performance indicators to measure the effectiveness of sales risk evaluation on revenue performance. It includes elements such as opportunities, win rate, average time to win, sales velocity along with key insights etc. This Determining Risks In Sales Administration Procedure Key Metrics To Assess Effectiveness Of Sales Pictures PDF from Slidegeeks makes it easy to present information on your topic with precision. It provides customization options, so you can make changes to the colors, design, graphics, or any other component to create a unique layout. It is also available for immediate download, so you can begin using it right away. Slidegeeks has done good research to ensure that you have everything you need to make your presentation stand out. Make a name out there for a brilliant performance.
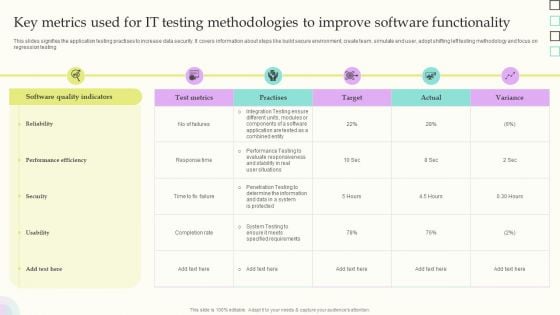
Key Metrics Used For IT Testing Methodologies To Improve Software Functionality Slides PDF
This slides signifies the application testing practises to increase data security. It covers information about steps like build secure environment, create team, simulate end user, adopt shifting left testing methodology and focus on regression testing. Showcasing this set of slides titled Key Metrics Used For IT Testing Methodologies To Improve Software Functionality Slides PDF. The topics addressed in these templates are Software Quality Indicators, Reliability, Performance Efficiency. All the content presented in this PPT design is completely editable. Download it and make adjustments in color, background, font etc. as per your unique business setting.
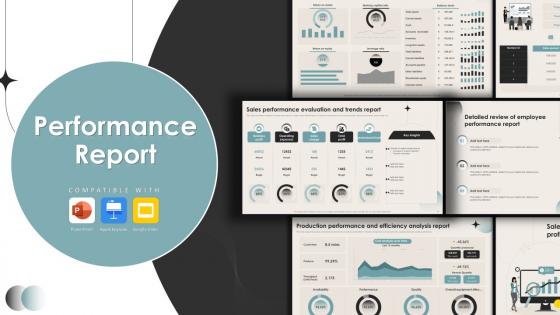
Performance Report Powerpoint Ppt Template Bundles
This Marketing, Sales, Production, Project, Construction-slide Performance Report Powerpoint Ppt Template Bundles is your content ready tool to impress the stakeholders with your business planning and its manner of execution. Showcase your ideas and how you plan to make them real in detail with this PPT Template Bundle. The slides have the conceptual bandwidth to present the crucial aspects of your plan, such as funding, marketing, resource allocation, timeline, roadmap, and more. When you present your plans with this PPT Layout, the stakeholders are sure to come on board because you will be able to present a succinct, thought-out, winning project. Download this Complete Deck now to take control into your hands. The 100 percent customizable offer is just too good to be resisted. Performance report showcases the outcome of activity or individual work over a specific period for informed decision making. It may compare the result with the desired standard or target. The purpose of this template is to enable teams to identify areas of improvement and make strategic decisions. It consists of financial, marketing, sales, Production, Construction plan and project performance evaluation and strategic review reports for evaluating efficiency and alignment with organizational goals.
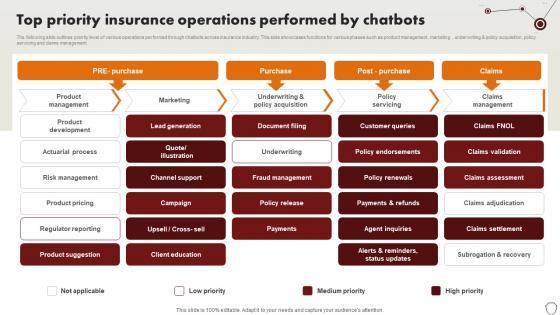
Technology Trends In Online Insurance Top Priority Insurance Operations Performed By Chatbots
The following slide outlines priority level of various operations performed through chatbots across insurance industry. This slide showcases functions for various phases such as product management, marketing , underwriting and policy acquisition, policy servicing and claims management. Retrieve professionally designed Technology Trends In Online Insurance Top Priority Insurance Operations Performed By Chatbots to effectively convey your message and captivate your listeners. Save time by selecting pre-made slideshows that are appropriate for various topics, from business to educational purposes. These themes come in many different styles, from creative to corporate, and all of them are easily adjustable and can be edited quickly. Access them as PowerPoint templates or as Google Slides themes. You do not have to go on a hunt for the perfect presentation because Slidegeeks got you covered from everywhere. The following slide outlines priority level of various operations performed through chatbots across insurance industry. This slide showcases functions for various phases such as product management, marketing , underwriting and policy acquisition, policy servicing and claims management.
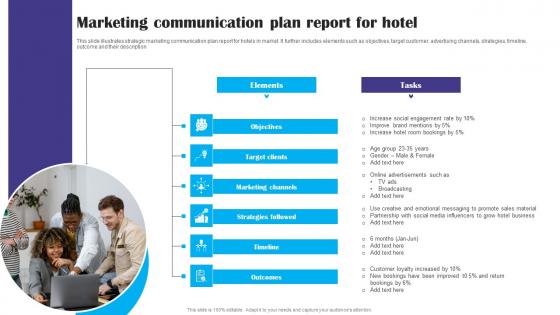
Marketing Communication Plan Report For Hotel Ppt Gallery Format Ideas pdf
This slide illustrates strategic marketing communication plan report for hotels in market. It further includes elements such as objectives, target customer, advertising channels, strategies, timeline, outcome and their description. Showcasing this set of slides titled Marketing Communication Plan Report For Hotel Ppt Gallery Format Ideas pdf. The topics addressed in these templates are Target Customer, Advertising Channels, Strategies. All the content presented in this PPT design is completely editable. Download it and make adjustments in color, background, font etc. as per your unique business setting. This slide illustrates strategic marketing communication plan report for hotels in market. It further includes elements such as objectives, target customer, advertising channels, strategies, timeline, outcome and their description.
Big Data Analysis Icon For TCM For Technical Analysis Background PDF
Showcasing this set of slides titled Big Data Analysis Icon For TCM For Technical Analysis Background PDF. The topics addressed in these templates are Technical Analysis, Analysis Icon. All the content presented in this PPT design is completely editable. Download it and make adjustments in color, background, font etc. as per your unique business setting.
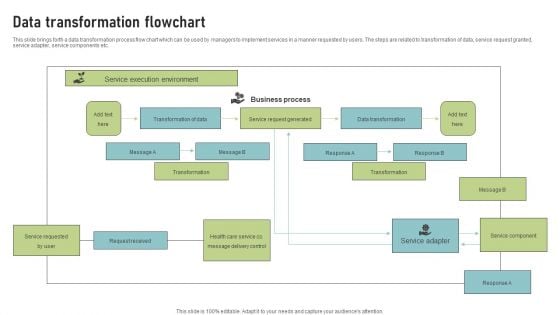
Data Transformation Flowchart Themes PDF
This slide brings forth a data transformation process flow chart which can be used by managers to implement services in a manner requested by users. The steps are related to transformation of data, service request granted, service adapter, service components etc. Persuade your audience using this Data Transformation Flowchart Themes PDF. This PPT design covers One stages, thus making it a great tool to use. It also caters to a variety of topics including Service Execution Environment, Business Process, Data Transformation. Download this PPT design now to present a convincing pitch that not only emphasizes the topic but also showcases your presentation skills.
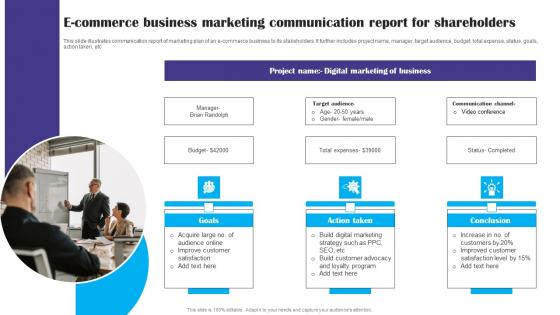
E Commerce Business Marketing Communication Report For Shareholders Ppt Slides Download pdf
This slide illustrates communication report of marketing plan of an e-commerce business to its stakeholders. It further includes project name, manager, target audience, budget, total expense, status, goals, action taken, etc. Showcasing this set of slides titled E Commerce Business Marketing Communication Report For Shareholders Ppt Slides Download pdf. The topics addressed in these templates are Target Audience, Budget, Total Expense. All the content presented in this PPT design is completely editable. Download it and make adjustments in color, background, font etc. as per your unique business setting. This slide illustrates communication report of marketing plan of an e-commerce business to its stakeholders. It further includes project name, manager, target audience, budget, total expense, status, goals, action taken, etc.
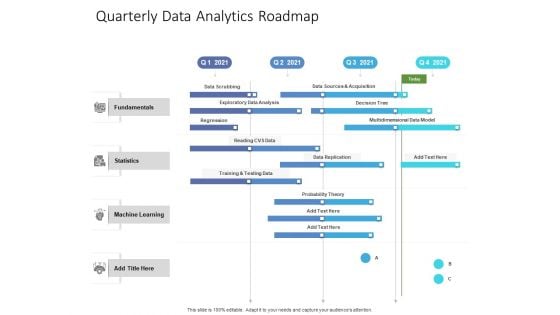
Quarterly Data Analytics Roadmap Pictures
Introducing our quarterly data analytics roadmap pictures. This PPT presentation is Google Slides compatible, therefore, you can share it easily with the collaborators for measuring the progress. Also, the presentation is available in both standard screen and widescreen aspect ratios. So edit the template design by modifying the font size, font type, color, and shapes as per your requirements. As this PPT design is fully editable it can be presented in PDF, JPG and PNG formats.
Data Quality Project Lifecycle Management Icon Information PDF
This slide covers data science lifecycle process model. It involves stages such as business understanding, data acquisition, modelling, deployment and customer acceptance.Pitch your topic with ease and precision using this Data Quality Project Lifecycle Management Icon Information PDF. This layout presents information on Data Quality, Project Lifecycle, Management Icon. It is also available for immediate download and adjustment. So, changes can be made in the color, design, graphics or any other component to create a unique layout.
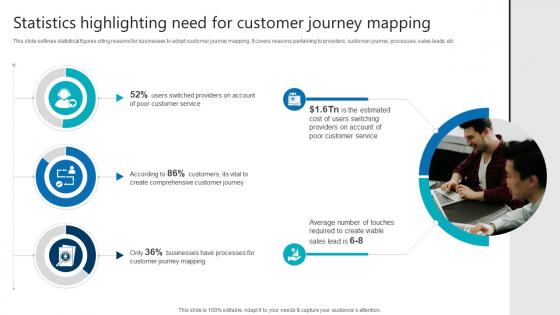
Statistics Highlighting Need For Customer Journey Mapping Product Analytics Implementation Data Analytics V
This slide outlines statistical figures citing reasons for businesses to adopt customer journey mapping. It covers reasons pertaining to providers, customer journey, processes, sales leads, etc Crafting an eye-catching presentation has never been more straightforward. Let your presentation shine with this tasteful yet straightforward Statistics Highlighting Need For Customer Journey Mapping Product Analytics Implementation Data Analytics V template. It offers a minimalistic and classy look that is great for making a statement. The colors have been employed intelligently to add a bit of playfulness while still remaining professional. Construct the ideal Statistics Highlighting Need For Customer Journey Mapping Product Analytics Implementation Data Analytics V that effortlessly grabs the attention of your audience Begin now and be certain to wow your customers This slide outlines statistical figures citing reasons for businesses to adopt customer journey mapping. It covers reasons pertaining to providers, customer journey, processes, sales leads, etc
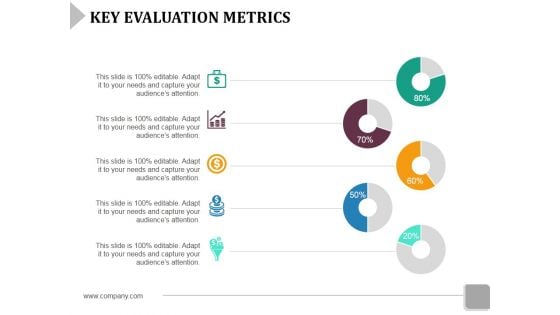
Key Evaluation Metrics Ppt PowerPoint Presentation File Design Ideas
This is a key evaluation metrics ppt powerpoint presentation file design ideas. This is a five stage process. The stages in this process are business, icons, strategy, marketing, finance.
Key Sales Performance Metrics Ppt PowerPoint Presentation Icon Design Templates
This is a key sales performance metrics ppt powerpoint presentation icon design templates. This is a four stage process. The stages in this process are campaigns to drive traffic, visitors, trials, closed deals, business.
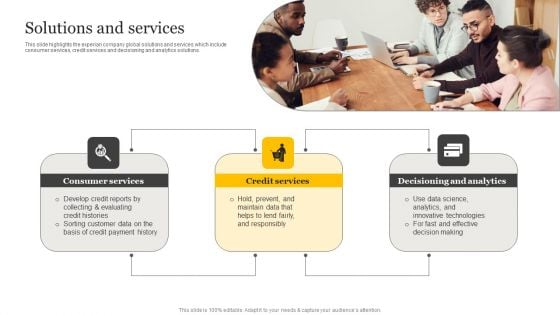
Customer Credit Reporting Company Outline Solutions And Services Elements PDF
This slide highlights the experian company global solutions and services which include consumer services, credit services and decisioning and analytics solutions. The Customer Credit Reporting Company Outline Solutions And Services Elements PDF is a compilation of the most recent design trends as a series of slides. It is suitable for any subject or industry presentation, containing attractive visuals and photo spots for businesses to clearly express their messages. This template contains a variety of slides for the user to input data, such as structures to contrast two elements, bullet points, and slides for written information. Slidegeeks is prepared to create an impression.
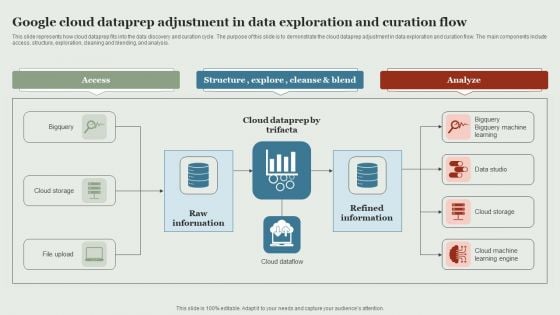
Google Cloud Service Models Google Cloud Dataprep Adjustment In Data Exploration And Curation Slides PDF
This slide represents how cloud dataprep fits into the data discovery and curation cycle. The purpose of this slide is to demonstrate the cloud dataprep adjustment in data exploration and curation flow. The main components include access, structure, exploration, cleaning and blending, and analysis. Formulating a presentation can take up a lot of effort and time, so the content and message should always be the primary focus. The visuals of the PowerPoint can enhance the presenters message, so our Google Cloud Service Models Google Cloud Dataprep Adjustment In Data Exploration And Curation Slides PDF was created to help save time. Instead of worrying about the design, the presenter can concentrate on the message while our designers work on creating the ideal templates for whatever situation is needed. Slidegeeks has experts for everything from amazing designs to valuable content, we have put everything into Google Cloud Service Models Google Cloud Dataprep Adjustment In Data Exploration And Curation Slides PDF
Business Diagram Five Staged Infographics With Stand Design PowerPoint Template
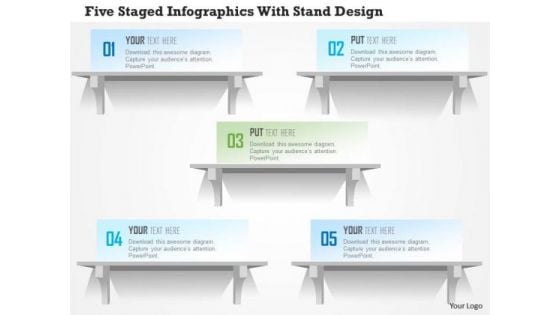
Five staged info graphics with stand has been used to craft this power point template. This PPT contains the concept of data flow. Use this PPT slide for your sales and business data related presentations.
How To Avoid Data Swamp In A Data Lake Data Lake Creation With Hadoop Cluster Guidelines PDF
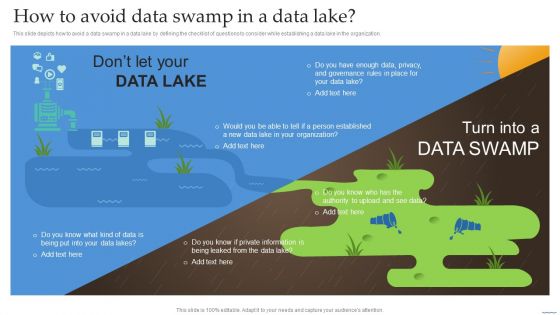
This slide depicts how to avoid a data swamp in a data lake by defining the checklist of questions to consider while establishing a data lake in the organization. If your project calls for a presentation, then Slidegeeks is your go-to partner because we have professionally designed, easy-to-edit templates that are perfect for any presentation. After downloading, you can easily edit How To Avoid Data Swamp In A Data Lake Data Lake Creation With Hadoop Cluster Guidelines PDF and make the changes accordingly. You can rearrange slides or fill them with different images. Check out all the handy templates.
Market Leader Ppt PowerPoint Presentation Icon Maker
This is a market leader ppt powerpoint presentation icon maker. This is a three stage process. The stages in this process are market leader, agenda, planning, business, management.
Pie Chart Data Comparisons 5 Stages Ppt Designing Business Plan PowerPoint Templates
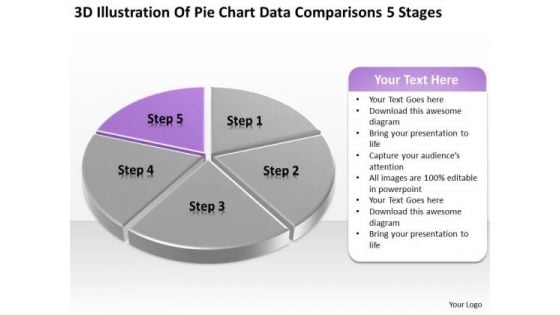
We present our pie chart data comparisons 5 stages ppt designing business plan PowerPoint templates.Use our Marketing PowerPoint Templates because Our PowerPoint Templates and Slides are innately eco-friendly. Their high recall value negate the need for paper handouts. Download our Finance PowerPoint Templates because Our PowerPoint Templates and Slides are truly out of this world. Even the MIB duo has been keeping tabs on our team. Use our Business PowerPoint Templates because You should Bet on your luck with our PowerPoint Templates and Slides. Be assured that you will hit the jackpot. Present our Sales PowerPoint Templates because Our PowerPoint Templates and Slides are created with admirable insight. Use them and give your group a sense of your logical mind. Present our Success PowerPoint Templates because Our PowerPoint Templates and Slides are focused like a searchlight beam. They highlight your ideas for your target audience.Use these PowerPoint slides for presentations relating to Analysis, Analyzing, Brands, Business, Chart, Colorful, Commerce, Compare, Comparison, Data, Economical, Finance, Financial, Grow, Growth, Market, Market Share, Marketing, Measure, Pen, Pie, Pie Chart, Presentation, Profit, Revenue, Sales, Sales Chat, Sales Increase, Share, Statistical, Success, Successful. The prominent colors used in the PowerPoint template are Purple, Gray, White. Make instructive presentations with our Pie Chart Data Comparisons 5 Stages Ppt Designing Business Plan PowerPoint Templates. Dont waste time struggling with PowerPoint. Let us do it for you.
Agenda Data Driven Personalized Marketing Promotion Approach Enhance Brand Image Rules PDF
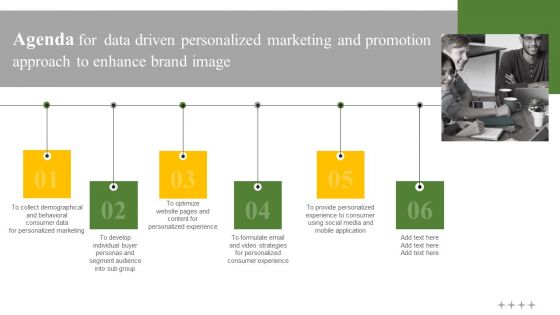
Find a pre designed and impeccable Agenda Data Driven Personalized Marketing Promotion Approach Enhance Brand Image Rules PDF. The templates can ace your presentation without additional effort. You can download these easy to edit presentation templates to make your presentation stand out from others. So, what are you waiting for Download the template from Slidegeeks today and give a unique touch to your presentation.
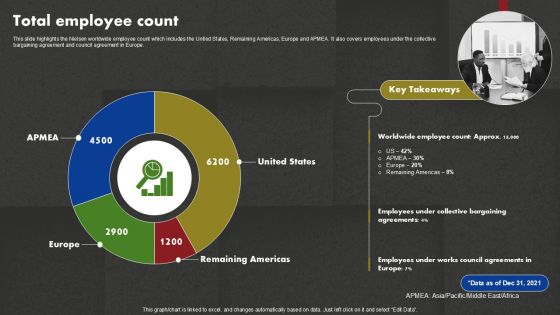
Data And Customer Analysis Company Outline Total Employee Count Designs PDF
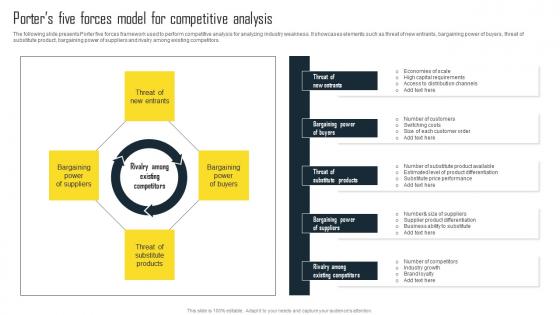
Porters Five Forces Model For Competitive Efficient Plan For Conducting Competitor Infographics Pdf
The following slide presents Porter five forces framework used to perform competitive analysis for analyzing industry weakness. It showcases elements such as threat of new entrants, bargaining power of buyers, threat of substitute product, bargaining power of suppliers and rivalry among existing competitors. From laying roadmaps to briefing everything in detail, our templates are perfect for you. You can set the stage with your presentation slides. All you have to do is download these easy-to-edit and customizable templates. Porters Five Forces Model For Competitive Efficient Plan For Conducting Competitor Infographics Pdf will help you deliver an outstanding performance that everyone would remember and praise you for. Do download this presentation today. The following slide presents Porter five forces framework used to perform competitive analysis for analyzing industry weakness. It showcases elements such as threat of new entrants, bargaining power of buyers, threat of substitute product, bargaining power of suppliers and rivalry among existing competitors.
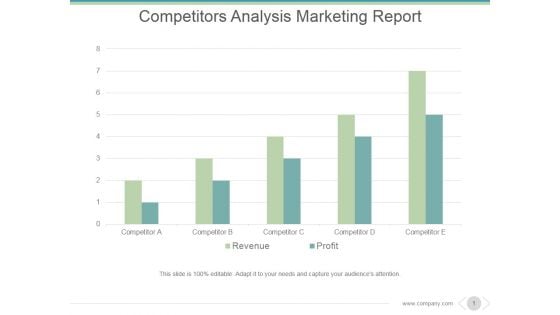
Competitors Analysis Marketing Report Ppt PowerPoint Presentation Tips
This is a competitors analysis marketing report ppt powerpoint presentation tips. This is a five stage process. The stages in this process are competitor, revenue, profit.

Data Structure IT Our Mission Vision Goal Designs PDF
This Data Structure IT Our Mission Vision Goal Designs PDF is perfect for any presentation, be it in front of clients or colleagues. It is a versatile and stylish solution for organizing your meetings. The Data Structure IT Our Mission Vision Goal Designs PDF features a modern design for your presentation meetings. The adjustable and customizable slides provide unlimited possibilities for acing up your presentation. Slidegeeks has done all the homework before launching the product for you. So, donot wait, grab the presentation templates today

Business Diagram Five Staged Text Box In Compass Style Diagram Presentation Template
This Power Point template slide has been designed with graphic of five staged text boxes. This PPT slide contains the compass style diagram. This PPT slide can display data analysis. Use this PPT slide for your business presentations.
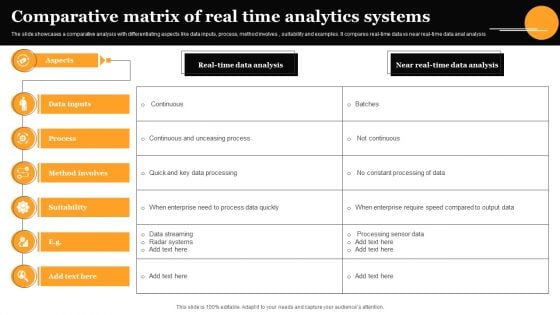
Comparative Matrix Of Real Time Analytics Systems Background PDF
The slide showcases a comparative analysis with differentiating aspects like data inputs, process, method involves , suitability and examples. It compares real-time data vs near real-time data anal analysis. Showcasing this set of slides titled Comparative Matrix Of Real Time Analytics Systems Background PDF. The topics addressed in these templates are Data Inputs, Process, Method Involves. All the content presented in this PPT design is completely editable. Download it and make adjustments in color, background, font etc. as per your unique business setting.
Risk Based Data Quality Improvement Model Ppt PowerPoint Presentation Icon Layout PDF
Showcasing this set of slides titled risk based data quality improvement model ppt powerpoint presentation icon layout pdf. The topics addressed in these templates are data exploration and profiling, organizational maturity assessment, data quality assessment . All the content presented in this PPT design is completely editable. Download it and make adjustments in color, background, font etc. as per your unique business setting.
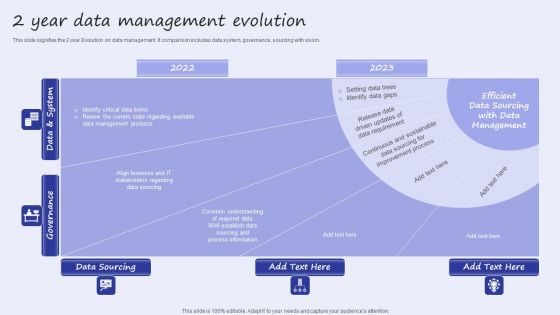
2 Year Data Management Evolution Infographics PDF
This slide signifies the 2 year Evolution on data management. It comparison includes data system, governance, sourcing with vision. Showcasing this set of slides titled 2 Year Data Management Evolution Infographics PDF. The topics addressed in these templates are Data Sourcing, Governance, Data System. All the content presented in this PPT design is completely editable. Download it and make adjustments in color, background, font etc. as per your unique business setting.

Detailed Guide For Talent Acquisition Key Metrics For Measuring Talent Sourcing Brochure PDF
Mentioned slide provides insights into various key performance indicators which can be used by business to evaluate sourcing strategies performance. It includes key metrics such as number of applications received, selected applicants, conversion rate, etc. Get a simple yet stunning designed Detailed Guide For Talent Acquisition Key Metrics For Measuring Talent Sourcing Brochure PDF. It is the best one to establish the tone in your meetings. It is an excellent way to make your presentations highly effective. So, download this PPT today from Slidegeeks and see the positive impacts. Our easy to edit Detailed Guide For Talent Acquisition Key Metrics For Measuring Talent Sourcing Brochure PDF can be your go to option for all upcoming conferences and meetings. So, what are you waiting for Grab this template today.
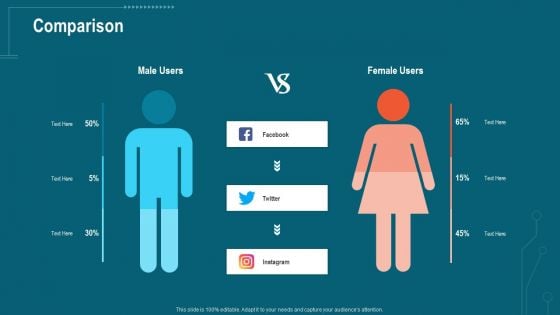
Companys Data Safety Recognition Comparison Ppt Summary Designs Download PDF
Presenting companys data safety recognition comparison ppt summary designs download pdf to provide visual cues and insights. Share and navigate important information on two stages that need your due attention. This template can be used to pitch topic like comparison. In addition, this PPT design contains high-resolution images, graphics, etc, that are easily editable and available for immediate download.
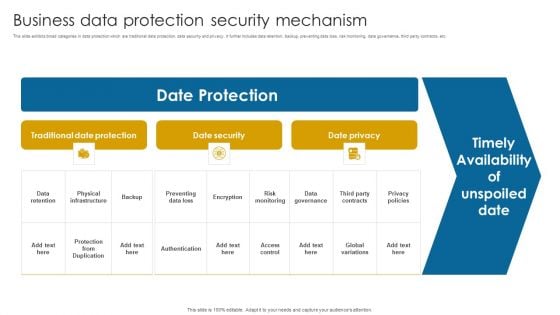
Business Data Protection Security Mechanism Portrait PDF
This slide exhibits broad categories in data protection which are traditional data protection, data security and privacy. It further includes data retention, backup, preventing data loss, risk monitoring, data governance, third party contracts, etc.Showcasing this set of slides titled Business Data Protection Security Mechanism Portrait PDF. The topics addressed in these templates are Data Retention, Physical Infrastructure, Date Security. All the content presented in this PPT design is completely editable. Download it and make adjustments in color, background, font etc. as per your unique business setting.
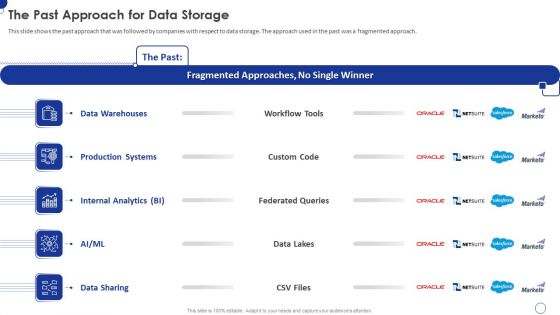
Fivetran Investor Fundraising Elevator Pitch Deck The Past Approach For Data Storage Infographics PDF
This slide shows the past approach that was followed by companies with respect to data storage. The approach used in the past was a fragmented approach. Presenting fivetran investor fundraising elevator pitch deck the past approach for data storage infographics pdf to provide visual cues and insights. Share and navigate important information on five stages that need your due attention. This template can be used to pitch topics like data sharing, internal analytics, production systems, data warehouses. In addtion, this PPT design contains high resolution images, graphics, etc, that are easily editable and available for immediate download.
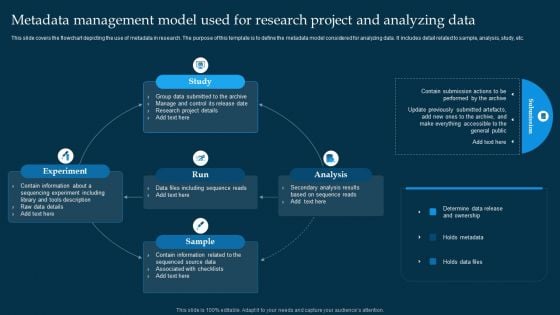
Metadata Management Model Used For Research Project And Analyzing Data Designs PDF
This slide covers the flowchart depicting the use of metadata in research. The purpose of this template is to define the metadata model considered for analyzing data. It includes detail related to sample, analysis, study, etc. Presenting Metadata Management Model Used For Research Project And Analyzing Data Designs PDF to dispense important information. This template comprises five stages. It also presents valuable insights into the topics including Study, Analysis, Sample, Run, Experiment. This is a completely customizable PowerPoint theme that can be put to use immediately. So, download it and address the topic impactfully.
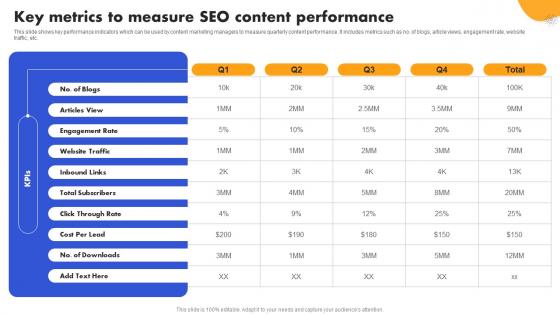
SEO Strategy To Improve ROI Key Metrics To Measure SEO Content Strategy SS V
This slide shows key performance indicators which can be used by content marketing managers to measure quarterly content performance. It includes metrics such as no. of blogs, article views, engagement rate, website traffic, etc. Coming up with a presentation necessitates that the majority of the effort goes into the content and the message you intend to convey. The visuals of a PowerPoint presentation can only be effective if it supplements and supports the story that is being told. Keeping this in mind our experts created SEO Strategy To Improve ROI Key Metrics To Measure SEO Content Strategy SS V to reduce the time that goes into designing the presentation. This way, you can concentrate on the message while our designers take care of providing you with the right template for the situation. This slide shows key performance indicators which can be used by content marketing managers to measure quarterly content performance. It includes metrics such as no. of blogs, article views, engagement rate, website traffic, etc.
Network Structure Technology Model Vector Showing Data Architecture Icon Ppt Visual Aids Backgrounds PDF
Showcasing this set of slides titled network structure technology model vector showing data architecture icon ppt visual aids backgrounds pdf. The topics addressed in these templates are network structure technology model vector showing data architecture icon. All the content presented in this PPT design is completely editable. Download it and make adjustments in color, background, font etc. as per your unique business setting.
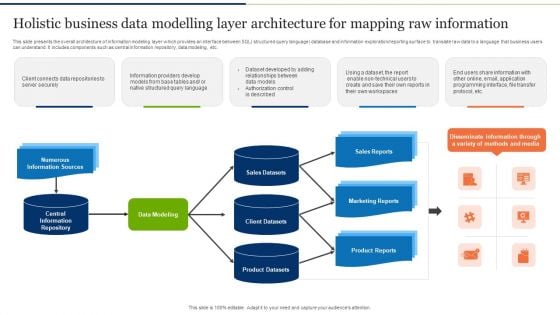
Holistic Business Data Modelling Layer Architecture For Mapping Raw Information Slides PDF
Pitch your topic with ease and precision using this Holistic Business Data Modelling Layer Architecture For Mapping Raw Information Slides PDF. This layout presents information on Data Modelling, Layer Architecture, Mapping Raw Information. It is also available for immediate download and adjustment. So, changes can be made in the color, design, graphics or any other component to create a unique layout.

Information Science RACI Matrix For Data Science Ppt PowerPoint Presentation Slides Model PDF
This slide represents the RACI matrix for data science and tasks performed by data analysts, data engineers, data scientists, data architects, and business analysts.Deliver an awe inspiring pitch with this creative Information Science RACI Matrix For Data Science Ppt PowerPoint Presentation Slides Model PDF bundle. Topics like Data Collection, Data Cleaning, Exploratory Analysis can be discussed with this completely editable template. It is available for immediate download depending on the needs and requirements of the user.
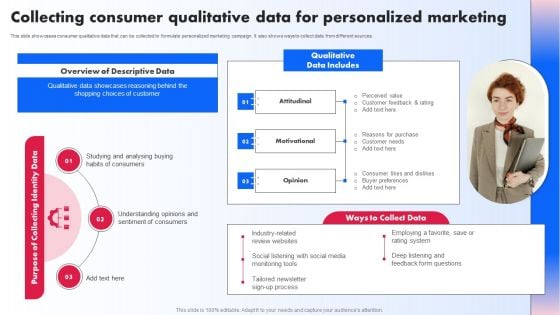
Collecting Consumer Qualitative Data For Personalized Marketing Ppt PowerPoint Presentation Diagram Graph Charts PDF
This slide showcases consumer qualitative data that can be collected to formulate personalized marketing campaign. It also shows ways to collect data from different sources Do you have an important presentation coming up Are you looking for something that will make your presentation stand out from the rest Look no further than Collecting Consumer Qualitative Data For Personalized Marketing Ppt PowerPoint Presentation Diagram Graph Charts PDF. With our professional designs, you can trust that your presentation will pop and make delivering it a smooth process. And with Slidegeeks, you can trust that your presentation will be unique and memorable. So why wait Grab Collecting Consumer Qualitative Data For Personalized Marketing Ppt PowerPoint Presentation Diagram Graph Charts PDF today and make your presentation stand out from the rest.
Business Diagram Exponentially Growing Big Data With Icons Surrounding Cloud Ppt Slide
This slide contains the graphic of clouds and icons. This diagram has been designed with concept of big data growth. This diagram displays the exponential growth of data analysis. Use this diagram slide for your data technology related presentations.
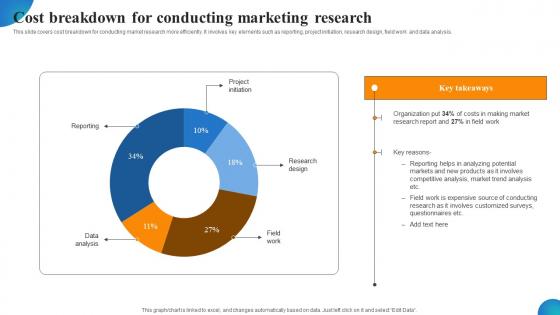
Cost Breakdown For Conducting Marketing Research MDSS For Enhanced Summary Pdf
This slide covers cost breakdown for conducting market research more efficiently. It involves key elements such as reporting, project initiation, research design, field work and data analysis. Want to ace your presentation in front of a live audience Our Cost Breakdown For Conducting Marketing Research MDSS For Enhanced Summary Pdf can help you do that by engaging all the users towards you. Slidegeeks experts have put their efforts and expertise into creating these impeccable powerpoint presentations so that you can communicate your ideas clearly. Moreover, all the templates are customizable, and easy-to-edit and downloadable. Use these for both personal and commercial use. This slide covers cost breakdown for conducting market research more efficiently. It involves key elements such as reporting, project initiation, research design, field work and data analysis.

Effective Data Arrangement For Data Accessibility And Processing Readiness Best Practices In Data Preparation Portrait PDF
This slide shows some of the best practices in data preparation that must be followed by the company in order to elevate true value of data as well as analysis and to ensure that raw data is ready for data processing. Presenting effective data arrangement for data accessibility and processing readiness best practices in data preparation portrait pdf to provide visual cues and insights. Share and navigate important information on four stages that need your due attention. This template can be used to pitch topics like identify outliers, deal with missing values, check assumptions about how the data is distributed, back up and document everything. In addtion, this PPT design contains high resolution images, graphics, etc, that are easily editable and available for immediate download.
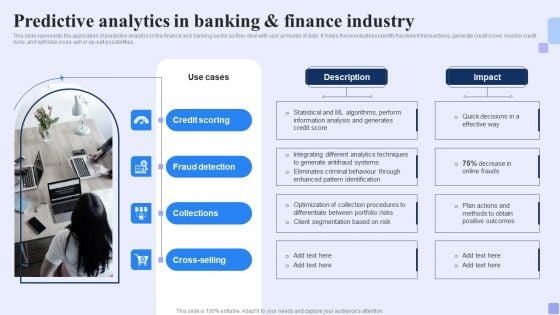
Predictive Analytics In Banking And Finance Industry Forward Looking Analysis IT Diagrams PDF
This slide represents the application of predictive analytics in the finance and banking sector as they deal with vast amounts of data. It helps these industries identify fraudulent transactions, generate credit score, monitor credit risks, and optimize cross-sell or up-sell possibilities.Coming up with a presentation necessitates that the majority of the effort goes into the content and the message you intend to convey. The visuals of a PowerPoint presentation can only be effective if it supplements and supports the story that is being told. Keeping this in mind our experts created Predictive Analytics In Banking And Finance Industry Forward Looking Analysis IT Diagrams PDF to reduce the time that goes into designing the presentation. This way, you can concentrate on the message while our designers take care of providing you with the right template for the situation.
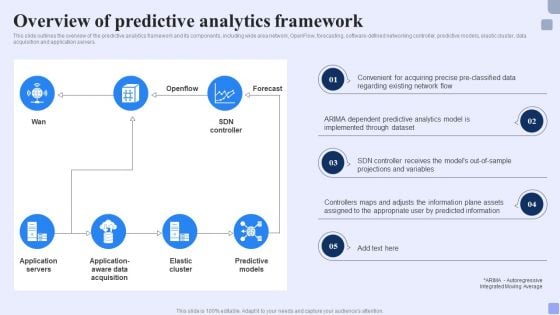
Overview Of Predictive Analytics Framework Forward Looking Analysis IT Topics PDF
This slide outlines the overview of the predictive analytics framework and its components, including wide area network, OpenFlow, forecasting, software-defined networking controller, predictive models, elastic cluster, data acquisition and application servers.If your project calls for a presentation, then Slidegeeks is your go-to partner because we have professionally designed, easy-to-edit templates that are perfect for any presentation. After downloading, you can easily edit Overview Of Predictive Analytics Framework Forward Looking Analysis IT Topics PDF and make the changes accordingly. You can rearrange slides or fill them with different images. Check out all the handy templates
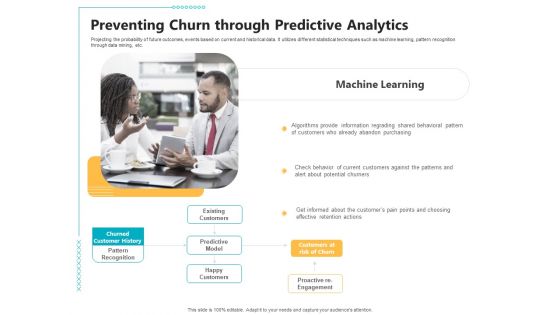
Controlling Customer Retention Preventing Churn Through Predictive Analytics Ppt Model Format PDF
Projecting the probability of future outcomes, events based on current and historical data. It utilizes different statistical techniques such as machine learning, pattern recognition through data mining, etc. This is a controlling customer retention preventing churn through predictive analytics ppt model format pdf template with various stages. Focus and dispense information on one stages using this creative set, that comes with editable features. It contains large content boxes to add your information on topics like preventing churn through predictive analytics. You can also showcase facts, figures, and other relevant content using this PPT layout. Grab it now.
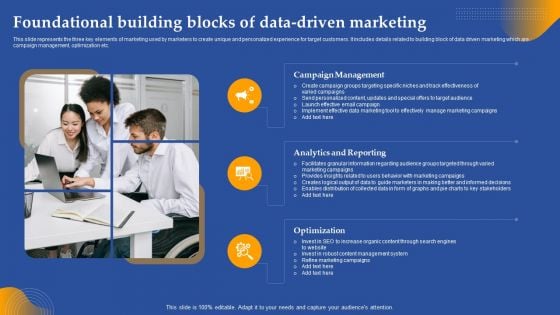
Foundational Building Blocks Of Data Driven Marketing Ppt File Guide PDF
This slide represents the three key elements of marketing used by marketers to create unique and personalized experience for target customers. It includes details related to building block of data driven marketing which are campaign management, optimization etc. Coming up with a presentation necessitates that the majority of the effort goes into the content and the message you intend to convey. The visuals of a PowerPoint presentation can only be effective if it supplements and supports the story that is being told. Keeping this in mind our experts created Foundational Building Blocks Of Data Driven Marketing Ppt File Guide PDF to reduce the time that goes into designing the presentation. This way, you can concentrate on the message while our designers take care of providing you with the right template for the situation.
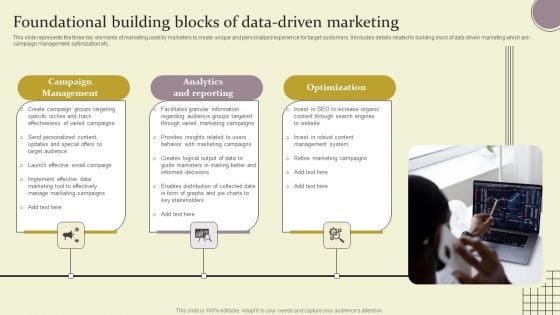
Foundational Building Blocks Of Data Driven Marketing Ppt Infographic Template Graphics PDF
This slide represents the three key elements of marketing used by marketers to create unique and personalized experience for target customers. It includes details related to building block of data driven marketing which are campaign management, optimization etc. Coming up with a presentation necessitates that the majority of the effort goes into the content and the message you intend to convey. The visuals of a PowerPoint presentation can only be effective if it supplements and supports the story that is being told. Keeping this in mind our experts created Foundational Building Blocks Of Data Driven Marketing Ppt Infographic Template Graphics PDF to reduce the time that goes into designing the presentation. This way, you can concentrate on the message while our designers take care of providing you with the right template for the situation.
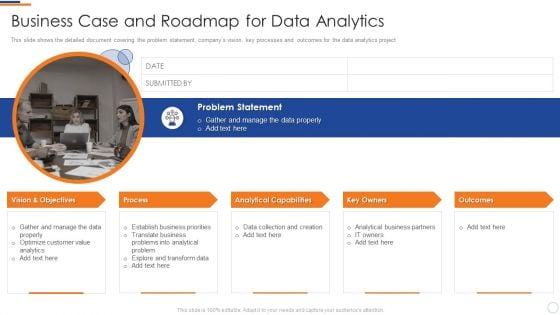
Business Intelligence And Big Data Analytics Business Case And Roadmap For Data Analytics Designs PDF
This slide shows the detailed document covering the problem statement, companys vision, key processes and outcomes for the data analytics project. Presenting business intelligence and big data analytics business case and roadmap for data analytics designs pdf to provide visual cues and insights. Share and navigate important information on one stages that need your due attention. This template can be used to pitch topics like problem statement, vision and objectives, process, analytical capabilities, key owners. In addtion, this PPT design contains high resolution images, graphics, etc, that are easily editable and available for immediate download.
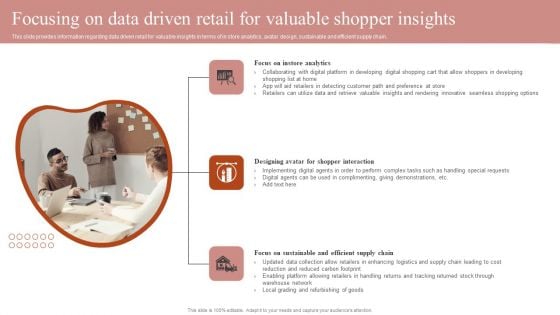
Remodeling Experiential Departmental Store Ecosystem Focusing On Data Driven Retail Valuable Structure PDF
This slide provides information regarding data driven retail for valuable insights in terms of in store analytics, avatar design, sustainable and efficient supply chain. Find a pre designed and impeccable Remodeling Experiential Departmental Store Ecosystem Focusing On Data Driven Retail Valuable Structure PDF. The templates can ace your presentation without additional effort. You can download these easy to edit presentation templates to make your presentation stand out from others. So, what are you waiting for Download the template from Slidegeeks today and give a unique touch to your presentation.


 Continue with Email

 Home
Home


