Portfolio Dashboard
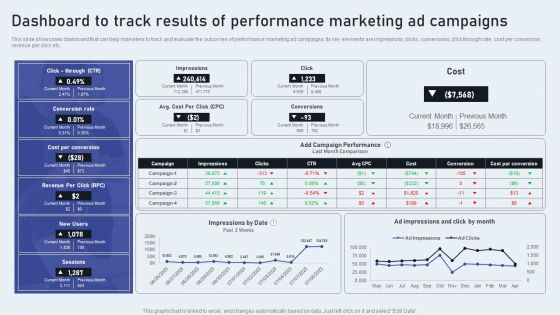
Dashboard To Track Results Of Performance Marketing Ad Campaigns Formats PDF
This slide showcases dashboard that can help marketers to track and evaluate the outcomes of performance marketing ad campaigns. Its key elements are impressions, clicks, conversions, click through rate, cost per conversion, revenue per click etc. Retrieve professionally designed Dashboard To Track Results Of Performance Marketing Ad Campaigns Formats PDF to effectively convey your message and captivate your listeners. Save time by selecting pre-made slideshows that are appropriate for various topics, from business to educational purposes. These themes come in many different styles, from creative to corporate, and all of them are easily adjustable and can be edited quickly. Access them as PowerPoint templates or as Google Slides themes. You do not have to go on a hunt for the perfect presentation because Slidegeeks got you covered from everywhere.
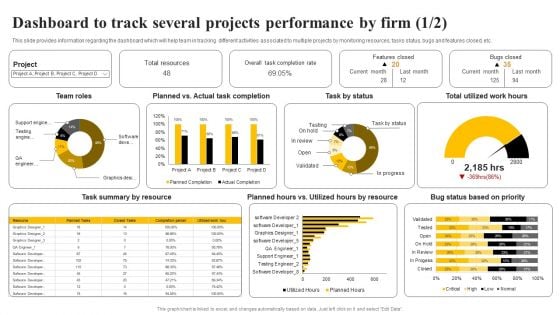
Organizational Plan Overview Dashboard To Track Several Projects Performance By Firm Pictures PDF
This slide provides information regarding the dashboard which will help team in tracking different activities associated to multiple projects by monitoring resources, tasks status, bugs and features closed, etc. This Organizational Plan Overview Dashboard To Track Several Projects Performance By Firm Pictures PDF from Slidegeeks makes it easy to present information on your topic with precision. It provides customization options, so you can make changes to the colors, design, graphics, or any other component to create a unique layout. It is also available for immediate download, so you can begin using it right away. Slidegeeks has done good research to ensure that you have everything you need to make your presentation stand out. Make a name out there for a brilliant performance.
Inclusive Workplace Training Program Dei Tracking And Reporting Analysis Dashboard DTE SS V
The purpose of this slide is to highlight real-time metrics for effective evaluation and optimization of diversity, equity, and inclusion initiatives. Get a simple yet stunning designed Inclusive Workplace Training Program Dei Tracking And Reporting Analysis Dashboard DTE SS V. It is the best one to establish the tone in your meetings. It is an excellent way to make your presentations highly effective. So, download this PPT today from Slidegeeks and see the positive impacts. Our easy-to-edit Inclusive Workplace Training Program Dei Tracking And Reporting Analysis Dashboard DTE SS V can be your go-to option for all upcoming conferences and meetings. So, what are you waiting for Grab this template today. The purpose of this slide is to highlight real-time metrics for effective evaluation and optimization of diversity, equity, and inclusion initiatives.
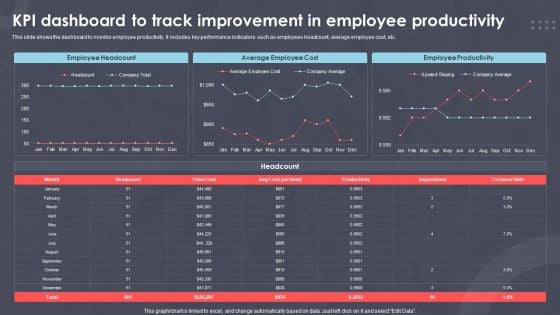
Kpi Dashboard To Track Improvement In Employee Productivity Ppt PowerPoint Presentation Outline Samples PDF
This slide shows the dashboard to monitor employee productivity. It includes key performance indicators such as employees headcount, average employee cost, etc.Showcasing this set of slides titled XXXXXXXXX. The topics addressed in these templates are Employee Headcount, Average Employee, Employee Productivity. All the content presented in this PPT design is completely editable. Download it and make adjustments in color, background, font etc. as per your unique business setting.
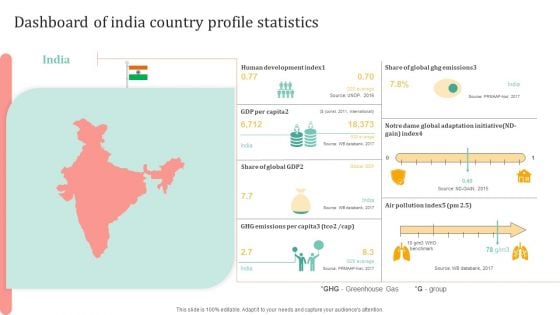
Dashboard Of India Country Profile Statistics Ppt Ideas Format Ideas PDF
Persuade your audience using this Dashboard Of India Country Profile Statistics Ppt Ideas Format Ideas PDF. This PPT design covers one stages, thus making it a great tool to use. It also caters to a variety of topics including Human Development Index, Global Ghg Emissions, GDP Per Capita. Download this PPT design now to present a convincing pitch that not only emphasizes the topic but also showcases your presentation skills.
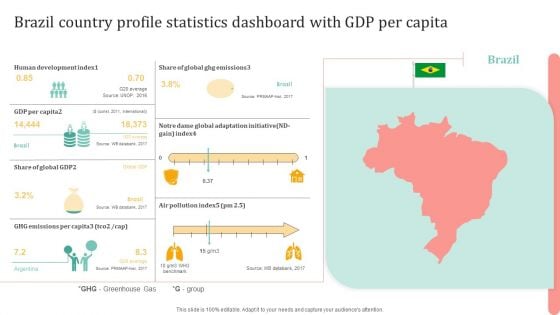
Brazil Country Profile Statistics Dashboard With GDP Per Capita Mockup PDF
Persuade your audience using this Brazil Country Profile Statistics Dashboard With GDP Per Capita Mockup PDF. This PPT design covers one stages, thus making it a great tool to use. It also caters to a variety of topics including Global Ghg Emissions, Human Development Index, GDP Per Capita. Download this PPT design now to present a convincing pitch that not only emphasizes the topic but also showcases your presentation skills.
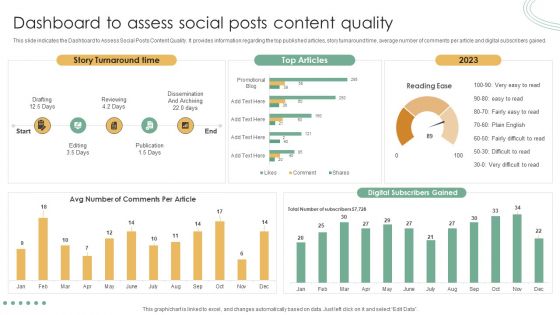
Online Marketing Techniques Assessment Approach Dashboard To Assess Social Posts Content Quality Information PDF
Take your projects to the next level with our ultimate collection of Online Marketing Techniques Assessment Approach Dashboard To Assess Social Posts Content Quality Information PDF. Slidegeeks has designed a range of layouts that are perfect for representing task or activity duration, keeping track of all your deadlines at a glance. Tailor these designs to your exact needs and give them a truly corporate look with your own brand colors they will make your projects stand out from the rest.
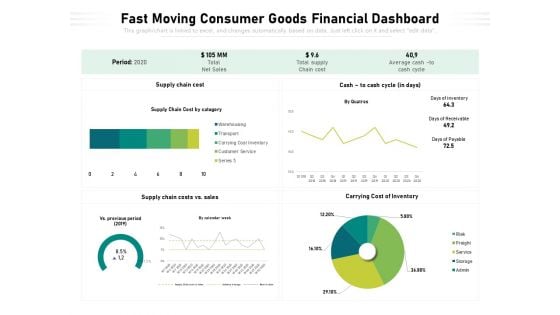
Fast Moving Consumer Goods Financial Dashboard Ppt PowerPoint Presentation Infographic Template Guide PDF
Showcasing this set of slides titled fast moving consumer goods financial dashboard ppt powerpoint presentation infographic template guide pdf. The topics addressed in these templates are supply chain cost, cash to cash cycle in days, supply chain costs vs sales. All the content presented in this PPT design is completely editable. Download it and make adjustments in color, background, font etc. as per your unique business setting.
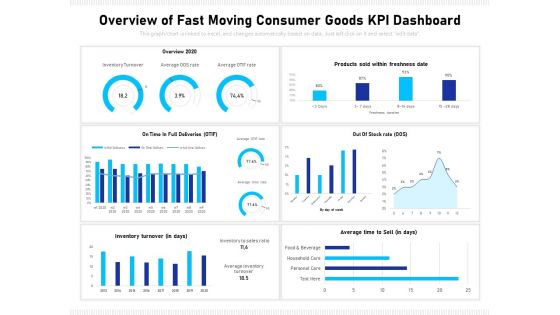
Overview Of Fast Moving Consumer Goods Kpi Dashboard Ppt PowerPoint Presentation Show Visual Aids PDF
Showcasing this set of slides titled overview of fast moving consumer goods kpi dashboard ppt powerpoint presentation show visual aids pdf. The topics addressed in these templates are overview 2020, on time in full deliveries otif, out of stock rate oos, inventory turnover in days, average time to sell in days. All the content presented in this PPT design is completely editable. Download it and make adjustments in color, background, font etc. as per your unique business setting.
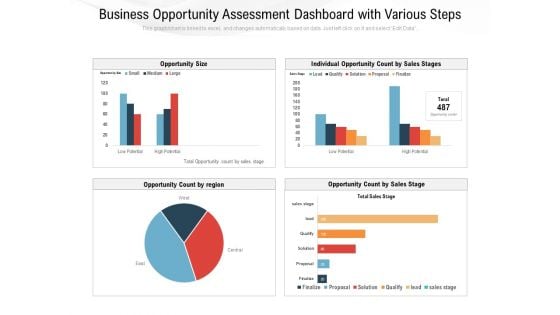
Business Opportunity Assessment Dashboard With Various Ppt PowerPoint Presentation Professional Graphics Download PDF
Pitch your topic with ease and precision using this business opportunity assessment dashboard with various ppt powerpoint presentation professional graphics download pdf. This layout presents information on opportunity size, individual opportunity count by sales stages, opportunity count by region, opportunity count by sales stage. It is also available for immediate download and adjustment. So, changes can be made in the color, design, graphics or any other component to create a unique layout.
CRM System Competitive Dashboard With Sales Pipeline Ppt PowerPoint Presentation Icon Outfit PDF
Showcasing this set of slides titled crm system competitive dashboard with sales pipeline ppt powerpoint presentation icon outfit pdf. The topics addressed in these templates are sales forecast by competitor, win loss report, open opportunity revenue by competitor, sales pipeline by sales rep, competitor. All the content presented in this PPT design is completely editable. Download it and make adjustments in color, background, font etc. as per your unique business setting.
CRM System Dashboard With Sales Pipeline Ppt PowerPoint Presentation Gallery Icons PDF
Pitch your topic with ease and precision using this crm system dashboard with sales pipeline ppt powerpoint presentation gallery icons pdf. This layout presents information on margin by sale rep, deal size vs discount, sale activity by sales rep, margin by sale rep, sales pipeline by sales rep, neglected accounts. It is also available for immediate download and adjustment. So, changes can be made in the color, design, graphics or any other component to create a unique layout.

Dashboard For Business Investment Management Ppt PowerPoint Presentation Inspiration Images PDF
Showcasing this set of slides titled dashboard for business investment management ppt powerpoint presentation inspiration images pdf. The topics addressed in these templates are total invested amount, number of investments, rate of return, total investment by assets class. All the content presented in this PPT design is completely editable. Download it and make adjustments in color, background, font etc. as per your unique business setting.
Dashboard Showing Procurement Cycle Time Ppt PowerPoint Presentation Icon Example Topics PDF
Pitch your topic with ease and precision using this dashboard showing procurement cycle time ppt powerpoint presentation icon example topics pdf. This layout presents information on top suppliers by partner status, rate of contract compliance by supplier category, avg procurement cycle supplier classification. It is also available for immediate download and adjustment. So, changes can be made in the color, design, graphics or any other component to create a unique layout.
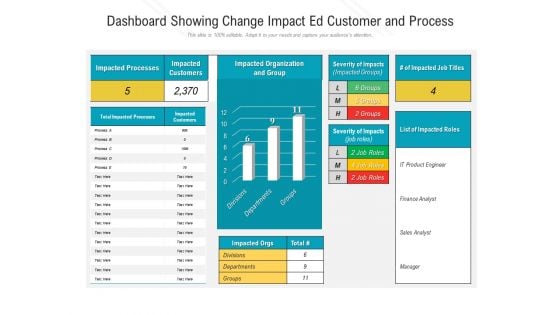
Dashboard Showing Change Impact Ed Customer And Process Ppt Professional Example PDF
Showcasing this set of slides titled dashboard showing change impact ed customer and process ppt professional example pdf. The topics addressed in these templates are impacted processes, impacted customers, impacted organization and group, severity of impacts impacted groups, total impacted processes. All the content presented in this PPT design is completely editable. Download it and make adjustments in colour, background, font etc. as per your unique business setting.

Economic Facts And Insights Analysis Dashboard Ppt PowerPoint Presentation Inspiration Slide Download PDF
Showcasing this set of slides titled economic facts and insights analysis dashboard ppt powerpoint presentation inspiration slide download pdf. The topics addressed in these templates are current working capital, cash conversion cycle in days last, current quick stats, vendor payment error rate last, 12 months currnet budget variance. All the content presented in this PPT design is completely editable. Download it and make adjustments in color, background, font etc. as per your unique business setting.
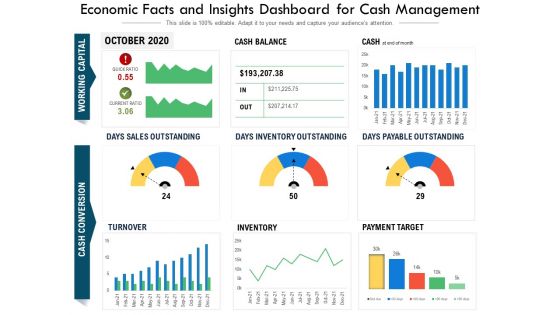
Economic Facts And Insights Dashboard For Cash Management Ppt PowerPoint Presentation Outline Guide PDF
Pitch your topic with ease and precision using this economic facts and insights dashboard for cash management ppt powerpoint presentation outline guide pdf. This layout presents information on days sales outstanding, days inventory outstanding, days payable outstanding, accounts payable by payment target, inventory, ar turnover vs ap turnover. It is also available for immediate download and adjustment. So, changes can be made in the color, design, graphics or any other component to create a unique layout.
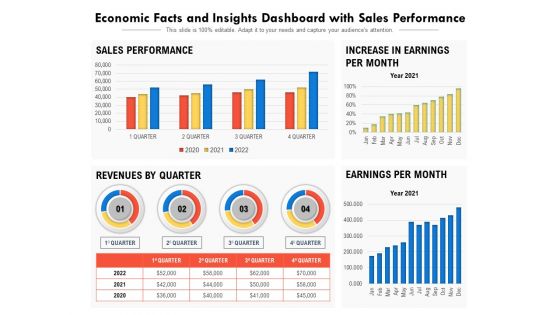
Economic Facts And Insights Dashboard With Sales Performance Ppt PowerPoint Presentation Show Gallery PDF
Showcasing this set of slides titled economic facts and insights dashboard with sales performance ppt powerpoint presentation show gallery pdf. The topics addressed in these templates are sales performance, increase in earnings per month, revenues by quarter, earnings per month. All the content presented in this PPT design is completely editable. Download it and make adjustments in color, background, font etc. as per your unique business setting.
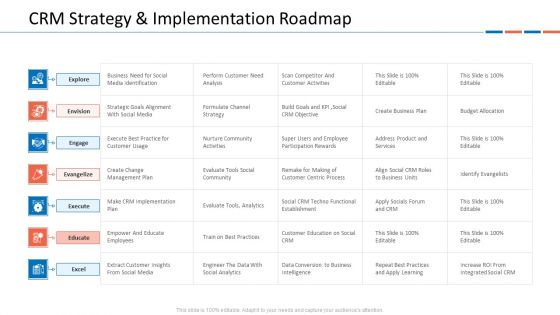
Customer Relationship Management Dashboard CRM Strategy And Implementation Roadmap Brochure PDF
Presenting customer relationship management dashboard crm strategy and implementation roadmap brochure pdf to provide visual cues and insights. Share and navigate important information on seven stages that need your due attention. This template can be used to pitch topics like business need for social media identification, strategic goals alignment with social media, execute best practice for customer usage. In addtion, this PPT design contains high resolution images, graphics, etc, that are easily editable and available for immediate download.
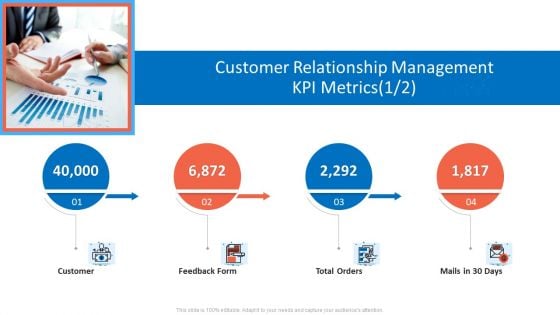
Customer Relationship Management Dashboard Customer Relationship Management KPI Metrics Form Elements PDF
Presenting customer relationship management dashboard customer relationship management kpi metrics form elements pdf to provide visual cues and insights. Share and navigate important information on four stages that need your due attention. This template can be used to pitch topics like customer, feedback form, total orders, mails in 30 days. In addtion, this PPT design contains high resolution images, graphics, etc, that are easily editable and available for immediate download.
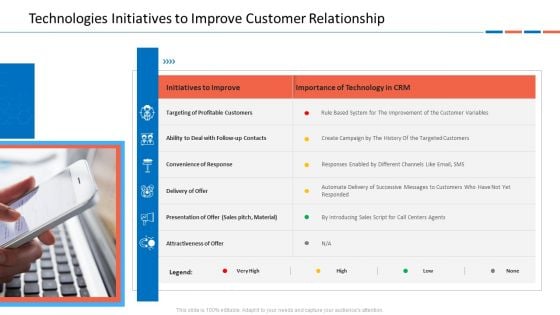
Customer Relationship Management Dashboard Technologies Initiatives To Improve Customer Relationship Clipart PDF
Presenting customer relationship management dashboard technologies initiatives to improve customer relationship clipart pdf to provide visual cues and insights. Share and navigate important information on six stages that need your due attention. This template can be used to pitch topics like attractiveness of offer, targeting of profitable customers, ability to deal with follow up contacts. In addtion, this PPT design contains high resolution images, graphics, etc, that are easily editable and available for immediate download.
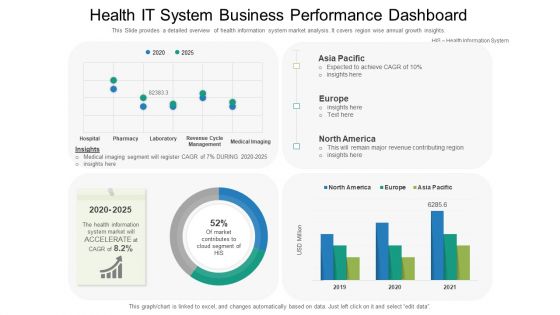
Health IT System Business Performance Dashboard Ppt Summary File Formats PDF
This Slide provides a detailed overview of health information system market analysis. It covers region wise annual growth insights. Showcasing this set of slides titled health it system business performance dashboard ppt summary file formats pdf. The topics addressed in these templates are market contributes, cloud segment, revenue contributing. All the content presented in this PPT design is completely editable. Download it and make adjustments in color, background, font etc. as per your unique business setting.
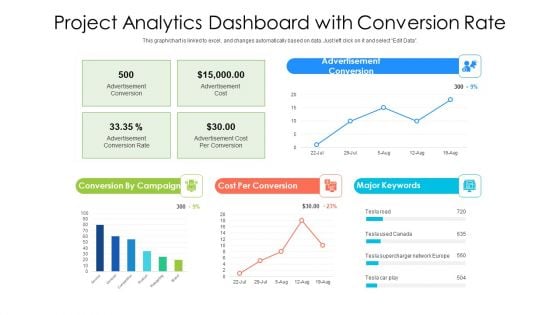
Project Analytics Dashboard With Conversion Rate Ppt PowerPoint Presentation File Deck PDF
Pitch your topic with ease and precision using this project analytics dashboard with conversion rate ppt powerpoint presentation gallery graphics template pdf. This layout presents information on cost per conversion, supercharger network, advertisement conversion, conversion by campaign. It is also available for immediate download and adjustment. So, changes can be made in the color, design, graphics or any other component to create a unique layout.
SEO Audit Report Dashboard With Site Audit And Backlink Audit Ppt Icon Sample PDF
Presenting seo audit report dashboard with site audit and backlink audit ppt icon sample pdf to provide visual cues and insights. Share and navigate important information on six stages that need your due attention. This template can be used to pitch topics like social media tracker, brand monitoring, backlink audit, site audit, position tracking. In addtion, this PPT design contains high resolution images, graphics, etc, that are easily editable and available for immediate download.
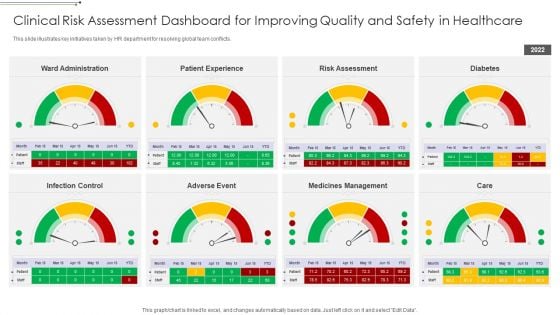
Clinical Risk Assessment Dashboard For Improving Quality And Safety In Healthcare Brochure PDF
This slide illustrates key initiatives taken by HR department for resolving global team conflicts. Pitch your topic with ease and precision using this Clinical Risk Assessment Dashboard For Improving Quality And Safety In Healthcare Brochure PDF This layout presents information on Ward Administration, Patient Experience, Risk Assessment It is also available for immediate download and adjustment. So, changes can be made in the color, design, graphics or any other component to create a unique layout.
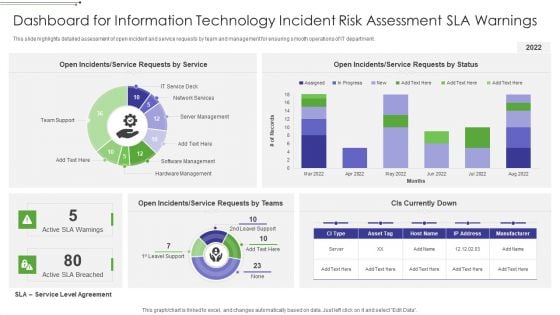
Dashboard For Information Technology Incident Risk Assessment SLA Warnings Sample PDF
This slide highlights detailed assessment of open incident and service requests by team and management for ensuring smooth operations of IT department.Showcasing this set of slides titled Dashboard For Information Technology Incident Risk Assessment SLA Warnings Sample PDF The topics addressed in these templates are Open Incidents, Requests By Service, Open Incidents All the content presented in this PPT design is completely editable. Download it and make adjustments in color, background, font etc. as per your unique business setting.
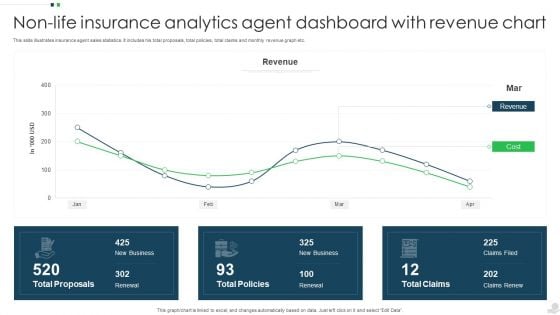
Non Life Insurance Analytics Agent Dashboard With Revenue Chart Infographics PDF
This slide illustrates insurance agent sales statistics. It includes his total proposals, total policies, total claims and monthly revenue graph etc. Showcasing this set of slides titled Non Life Insurance Analytics Agent Dashboard With Revenue Chart Infographics PDF. The topics addressed in these templates are Revenue, Cost, Total Proposals. All the content presented in this PPT design is completely editable. Download it and make adjustments in color, background, font etc. as per your unique business setting.
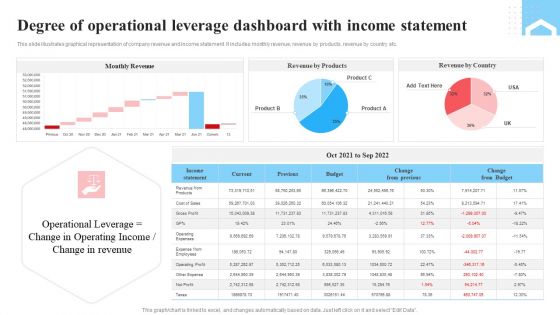
Degree Of Operational Leverage Dashboard With Income Statement Ppt Infographics Layout PDF
This slide illustrates graphical representation of company revenue and income statement. It includes monthly revenue, revenue by products, revenue by country etc. Pitch your topic with ease and precision using this Degree Of Operational Leverage Dashboard With Income Statement Ppt Infographics Layout PDF. This layout presents information on Monthly Revenue, Income Statement, Product. It is also available for immediate download and adjustment. So, changes can be made in the color, design, graphics or any other component to create a unique layout.
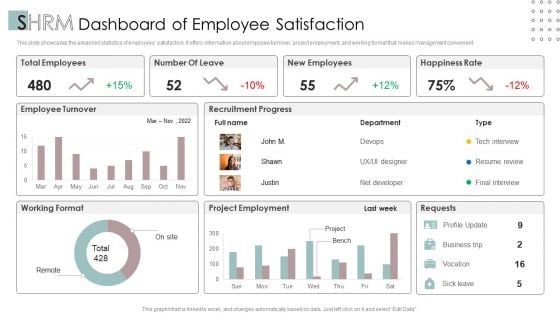
SHRM Dashboard Of Employee Satisfaction Ppt PowerPoint Presentation Styles Example File PDF
This slide showcases the advanced statistics of employees satisfaction. It offers information about employee turnover, project employment, and working format that makes management convenient.Pitch your topic with ease and precision using this SHRM Dashboard Of Employee Satisfaction Ppt PowerPoint Presentation Styles Example File PDF. This layout presents information on Total Employees, Happiness Rate, Project Employment. It is also available for immediate download and adjustment. So, changes can be made in the color, design, graphics or any other component to create a unique layout.
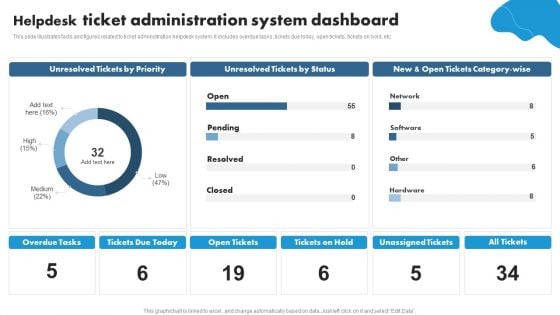
Helpdesk Ticket Administration System Dashboard Ppt PowerPoint Presentation Styles Topics PDF
This slide illustrates facts and figures related to ticket administration helpdesk system. It includes overdue tasks, tickets due today, open tickets, tickets on hold, etc.Showcasing this set of slides titled Helpdesk Ticket Administration System Dashboard Ppt PowerPoint Presentation Styles Topics PDF. The topics addressed in these templates are Unresolved Tickets, Tickets Status, Open Tickets. All the content presented in this PPT design is completely editable. Download it and make adjustments in color, background, font etc. as per your unique business setting.
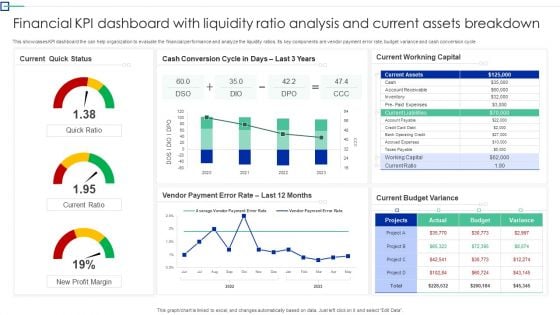
Financial KPI Dashboard With Liquidity Ratio Analysis And Current Assets Breakdown Ideas PDF
This showcases KPI dashboard the can help organization to evaluate the financial performance and analyze the liquidity ratios. Its key components are vendor payment error rate, budget variance and cash conversion cycle. Showcasing this set of slides titled. The topics addressed in these templates are Quick Status, Workning Capital, Budget Variance. All the content presented in this PPT design is completely editable. Download it and make adjustments in color, background, font etc. as per your unique business setting.
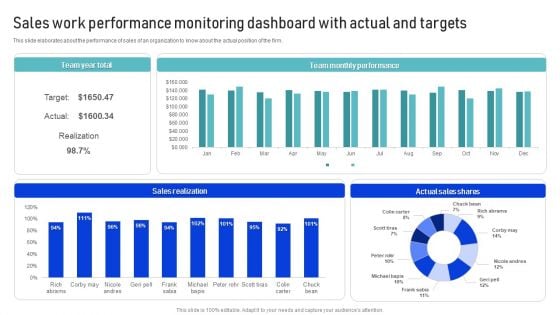
Sales Work Performance Monitoring Dashboard With Actual And Targets Introduction PDF
This slide elaborates about the performance of sales of an organization to know about the actual position of the firm. Showcasing this set of slides titled Sales Work Performance Monitoring Dashboard With Actual And Targets Introduction PDF. The topics addressed in these templates are Sales Realization, Team Monthly, Performance. All the content presented in this PPT design is completely editable. Download it and make adjustments in color, background, font etc. as per your unique business setting.
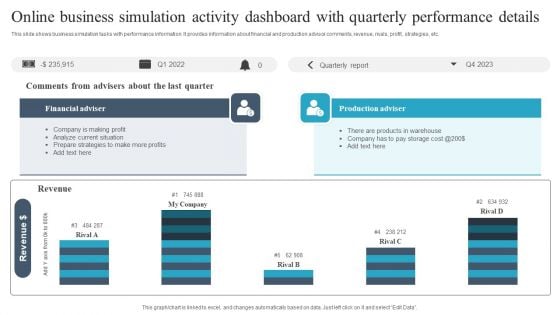
Online Business Simulation Activity Dashboard With Quarterly Performance Details Guidelines PDF
This slide shows business simulation tasks with performance information. It provides information about financial and production advisor comments, revenue, rivals, profit, strategies, etc. Pitch your topic with ease and precision using this Online Business Simulation Activity Dashboard With Quarterly Performance Details Guidelines PDF. This layout presents information on Financial Adviser, Production Adviser, Revenue. It is also available for immediate download and adjustment. So, changes can be made in the color, design, graphics or any other component to create a unique layout.
Progress Summary Dashboard For Tracking Project Health And Timeline Icons PDF
The following slide showcases business progress report for work completion status. It presents information related to task status, health, testing, budget, etc. Showcasing this set of slides titled Progress Summary Dashboard For Tracking Project Health And Timeline Icons PDF. The topics addressed in these templates are Project Progress, Budget, Project Timeline. All the content presented in this PPT design is completely editable. Download it and make adjustments in color, background, font etc. as per your unique business setting.
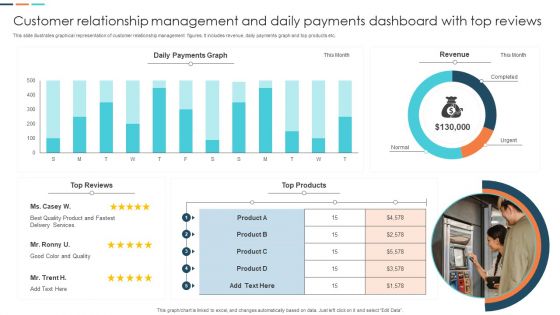
Customer Relationship Management And Daily Payments Dashboard With Top Reviews Professional PDF
This slide illustrates graphical representation of customer relationship management figures. It includes revenue, daily payments graph and top products etc. Showcasing this set of slides titled Customer Relationship Management And Daily Payments Dashboard With Top Reviews Professional PDF. The topics addressed in these templates are Quality Product, Services, Revenue. All the content presented in this PPT design is completely editable. Download it and make adjustments in color, background, font etc. as per your unique business setting.
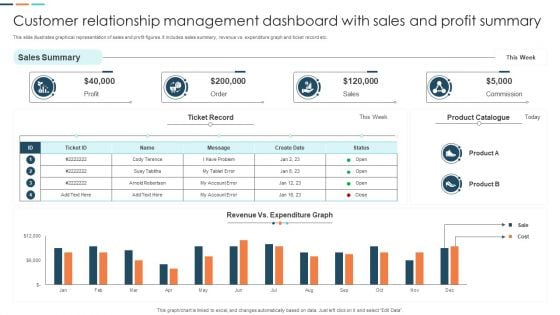
Customer Relationship Management Dashboard With Sales And Profit Summary Microsoft PDF
This slide illustrates graphical representation of sales and profit figures. It includes sales summary, revenue vs. expenditure graph and ticket record etc. Showcasing this set of slides titled Customer Relationship Management Dashboard With Sales And Profit Summary Microsoft PDF. The topics addressed in these templates are Product Catalogue, Sales, Profit. All the content presented in this PPT design is completely editable. Download it and make adjustments in color, background, font etc. as per your unique business setting.
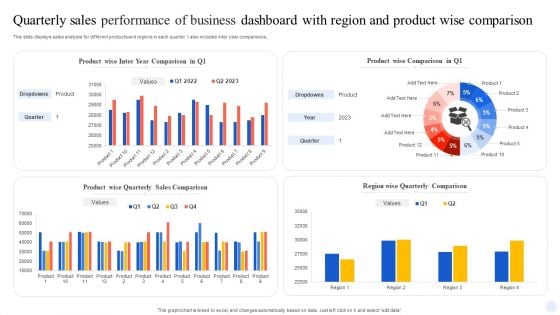
Quarterly Sales Performance Of Business Dashboard With Region And Product Wise Comparison Guidelines PDF
This slide displays sales analysis for different products and regions in each quarter. t also includes inter year comparisons. Pitch your topic with ease and precision using this Quarterly Sales Performance Of Business Dashboard With Region And Product Wise Comparison Guidelines PDF. This layout presents information on Product Wise Quarterly Sales, Comparison. It is also available for immediate download and adjustment. So, changes can be made in the color, design, graphics or any other component to create a unique layout.
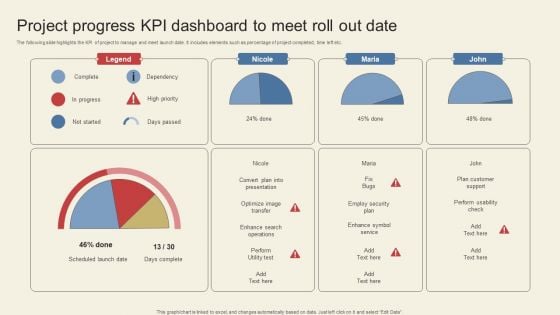
Project Progress Kpi Dashboard To Meet Roll Out Date Themes PDF
The following slide highlights the KPI of project to manage and meet launch date. It includes elements such as percentage of project completed, time left etc. Showcasing this set of slides titled Project Progress Kpi Dashboard To Meet Roll Out Date Themes PDF. The topics addressed in these templates are Legend, Nicole, Maria. All the content presented in this PPT design is completely editable. Download it and make adjustments in color, background, font etc. as per your unique business setting.
Social Media In Customer Support Social Media Customer Service Tracking Dashboard Structure Pdf
This slide represents the social dashboard for tracking media customer service by covering the total number of requests and requests answered, total revenue, support costs rate to revenue rate, customer satisfaction, the average time to solve an issue, and so on. This Social Media In Customer Support Social Media Customer Service Tracking Dashboard Structure Pdf from Slidegeeks makes it easy to present information on your topic with precision. It provides customization options, so you can make changes to the colors, design, graphics, or any other component to create a unique layout. It is also available for immediate download, so you can begin using it right away. Slidegeeks has done good research to ensure that you have everything you need to make your presentation stand out. Make a name out there for a brilliant performance. This slide represents the social dashboard for tracking media customer service by covering the total number of requests and requests answered, total revenue, support costs rate to revenue rate, customer satisfaction, the average time to solve an issue, and so on.
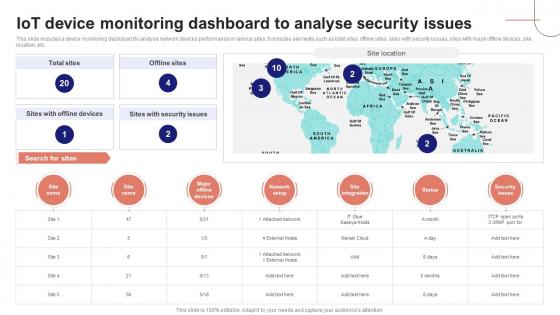
IoT Device Management Fundamentals IoT Device Monitoring Dashboard To Analyse IoT Ss V
This slide includes a device monitoring dashboard to analyse network devices performance in various sites. It includes elements such as total sites, offline sites, sites with security issues, sites with major offline devices, site location, etc. Slidegeeks is here to make your presentations a breeze with IoT Device Management Fundamentals IoT Device Monitoring Dashboard To Analyse IoT SS V With our easy-to-use and customizable templates, you can focus on delivering your ideas rather than worrying about formatting. With a variety of designs to choose from, you are sure to find one that suits your needs. And with animations and unique photos, illustrations, and fonts, you can make your presentation pop. So whether you are giving a sales pitch or presenting to the board, make sure to check out Slidegeeks first This slide includes a device monitoring dashboard to analyse network devices performance in various sites. It includes elements such as total sites, offline sites, sites with security issues, sites with major offline devices, site location, etc.
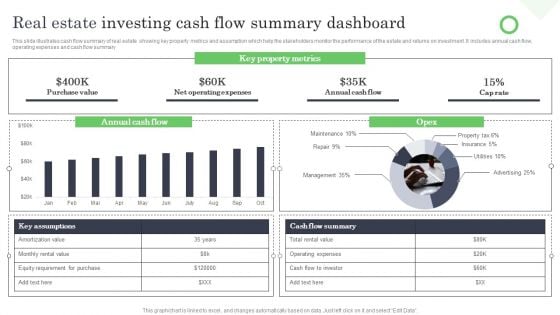
Real Estate Investing Cash Flow Summary Dashboard Ppt Model Design Ideas PDF
This slide illustrates cash flow summary of real estate showing key property metrics and assumption which help the stakeholders monitor the performance of the estate and returns on investment. It includes annual cash flow, operating expenses and cash flow summary. Showcasing this set of slides titled Real Estate Investing Cash Flow Summary Dashboard Ppt Model Design Ideas PDF. The topics addressed in these templates are Key Property Metrics, Cap Rate, Annual Cash Flow, Net Operating Expenses. All the content presented in this PPT design is completely editable. Download it and make adjustments in color, background, font etc. as per your unique business setting.
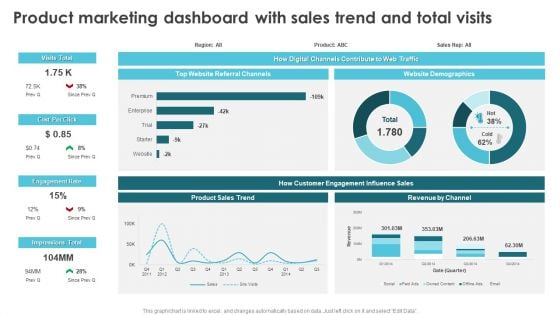
Product Marketing For Generating Product Marketing Dashboard With Sales Trend Designs PDF
This graph or chart is linked to excel, and changes automatically based on data. Just left click on it and select Edit Data. From laying roadmaps to briefing everything in detail, our templates are perfect for you. You can set the stage with your presentation slides. All you have to do is download these easy-to-edit and customizable templates. Product Marketing For Generating Product Marketing Dashboard With Sales Trend Designs PDF will help you deliver an outstanding performance that everyone would remember and praise you for. Do download this presentation today.
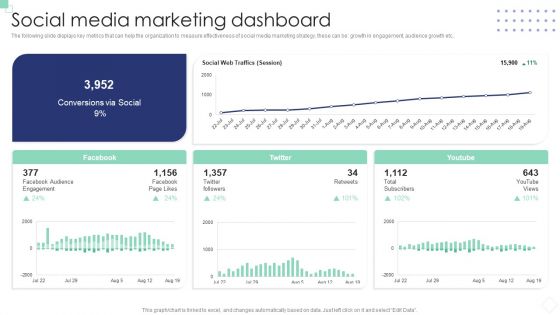
Implementing B2B And B2C Marketing Social Media Marketing Dashboard Designs PDF
The following slide displays key metrics that can help the organization to measure effectiveness of social media marketing strategy, these can be growth in engagement, audience growth etc. The best PPT templates are a great way to save time, energy, and resources. Slidegeeks have 100 percent editable powerpoint slides making them incredibly versatile. With these quality presentation templates, you can create a captivating and memorable presentation by combining visually appealing slides and effectively communicating your message. Download Implementing B2B And B2C Marketing Social Media Marketing Dashboard Designs PDF from Slidegeeks and deliver a wonderful presentation.
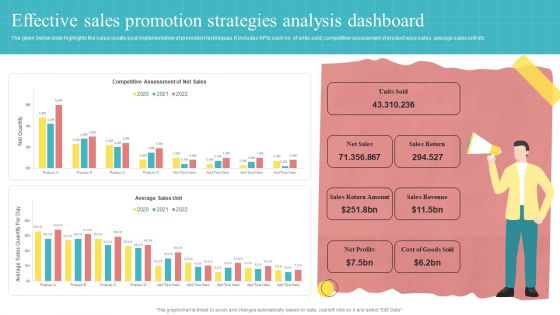
Effective Sales Promotion Strategies Analysis Dashboard Ppt PowerPoint Presentation Slides Background Designs PDF
The given below slide highlights the sales results post implementation of promotion techniques. It includes KPIs such no. of units sold, competitive assessment of product wise sales, average sales unit etc.Showcasing this set of slides titled Effective Sales Promotion Strategies Analysis Dashboard Ppt PowerPoint Presentation Slides Background Designs PDF. The topics addressed in these templates are Return Amount, Sales Return, Sales Revenue. All the content presented in this PPT design is completely editable. Download it and make adjustments in color, background, font etc. as per your unique business setting.
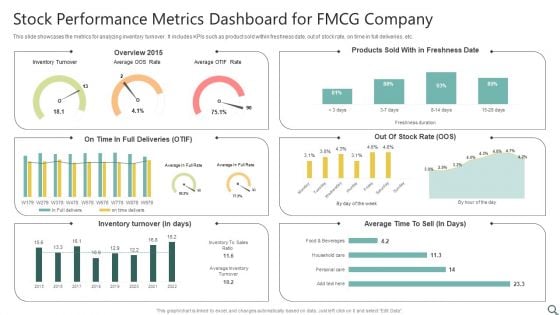
Stock Performance Metrics Dashboard For FMCG Company Ppt Ideas Design Inspiration PDF
This slide showcases the metrics for analyzing inventory turnover. It includes KPIs such as product sold within freshness date, out of stock rate, on time in full deliveries, etc. Showcasing this set of slides titled Stock Performance Metrics Dashboard For FMCG Company Ppt Ideas Design Inspiration PDF. The topics addressed in these templates are Inventory Turnover, Overview 2015, Inventory Turnover. All the content presented in this PPT design is completely editable. Download it and make adjustments in color, background, font etc. as per your unique business setting.
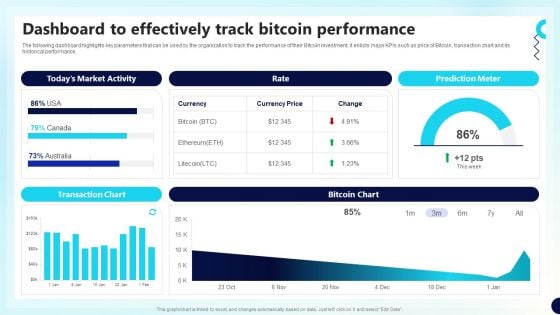
Dashboard To Effectively Track Bitcoin Decentralized Fund Investment Playbook Designs PDF
This Dashboard To Effectively Track Bitcoin Decentralized Fund Investment Playbook Designs PDF from Slidegeeks makes it easy to present information on your topic with precision. It provides customization options, so you can make changes to the colors, design, graphics, or any other component to create a unique layout. It is also available for immediate download, so you can begin using it right away. Slidegeeks has done good research to ensure that you have everything you need to make your presentation stand out. Make a name out there for a brilliant performance.
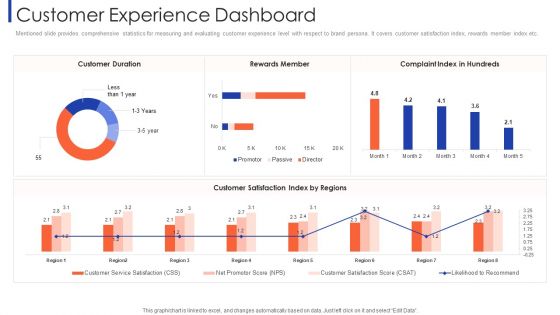
Customer Relationship Strategy For Building Loyalty Customer Experience Dashboard Designs PDF
Mentioned slide provides comprehensive statistics for measuring and evaluating customer experience level with respect to brand persona. It covers customer satisfaction index, rewards member index etc. Deliver an awe inspiring pitch with this creative customer relationship strategy for building loyalty customer experience dashboard designs pdf bundle. Topics like customer duration, rewards member, complaint index in hundreds, customer satisfaction index by regions can be discussed with this completely editable template. It is available for immediate download depending on the needs and requirements of the user.
Product Development Status Dashboard With Planning Design Development And Testing Icons PDF
The following slide showcases product development cycle to provide an insight on the various of product development. Key stages covered are development, introduction, growth, maturity and decline. Presenting Product Development Status Dashboard With Planning Design Development And Testing Icons PDF to dispense important information. This template comprises seven stages. It also presents valuable insights into the topics including Build The Product, Improve The Product, Release The Product. This is a completely customizable PowerPoint theme that can be put to use immediately. So, download it and address the topic impactfully.
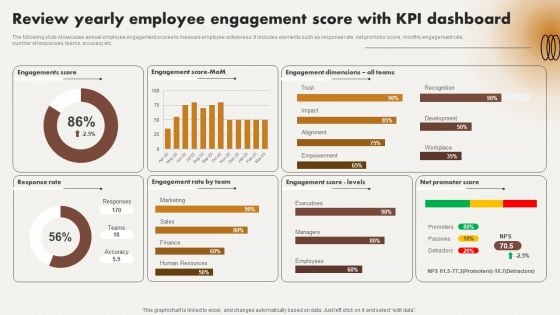
Review Yearly Employee Engagement Score With Kpi Dashboard Ppt Pictures Design Ideas PDF
The following slide showcases annual employee engagement scores to measure employee activeness. It includes elements such as response rate, net promotor score, monthly engagement rate, number of responses, teams, accuracy etc. From laying roadmaps to briefing everything in detail, our templates are perfect for you. You can set the stage with your presentation slides. All you have to do is download these easy to edit and customizable templates. Review Yearly Employee Engagement Score With Kpi Dashboard Ppt Pictures Design Ideas PDF will help you deliver an outstanding performance that everyone would remember and praise you for. Do download this presentation today.
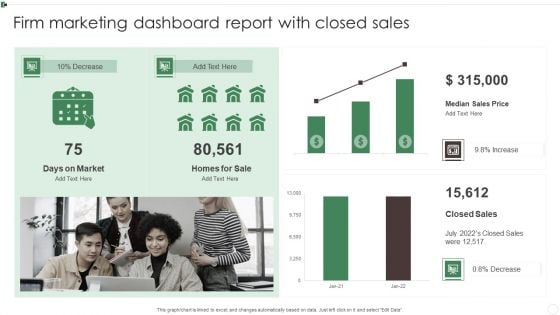
Firm Marketing Dashboard Report With Closed Sales Ppt Slides Graphics Example PDF
This graph or chart is linked to excel, and changes automatically based on data. Just left click on it and select Edit Data. Showcasing this set of slides titled Firm Marketing Dashboard Report With Closed Sales Ppt Slides Graphics Example PDF. The topics addressed in these templates are Days On Market, Homes For Sale, Median Sales Price, Closed Sales. All the content presented in this PPT design is completely editable. Download it and make adjustments in color, background, font etc. as per your unique business setting.
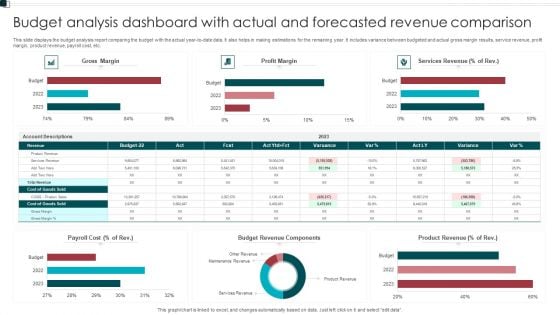
Budget Analysis Dashboard With Actual And Forecasted Revenue Comparison Structure PDF
This slide displays the budget analysis report comparing the budget with the actual year to date data. It also helps in making estimations for the remaining year. It includes variance between budgeted and actual gross margin results, service revenue, profit margin, product revenue, payroll cost, etc. Pitch your topic with ease and precision using this Budget Analysis Dashboard With Actual And Forecasted Revenue Comparison Structure PDF. This layout presents information on Payroll Cost, Budget Revenue Components, Product Revenue. It is also available for immediate download and adjustment. So, changes can be made in the color, design, graphics or any other component to create a unique layout.
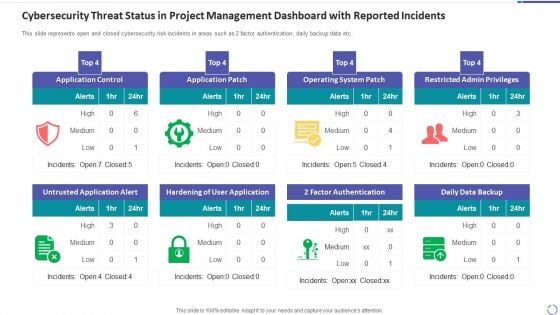
Cybersecurity Threat Status In Project Management Dashboard With Reported Incidents Introduction PDF
This slide represents open and closed cybersecurity risk incidents in areas such as 2 factor authentication, daily backup data etc. Showcasing this set of slides titled cybersecurity threat status in project management dashboard with reported incidents introduction pdf. The topics addressed in these templates are application control, application patch, operating system patch, restricted admin privileges, untrusted application alert. All the content presented in this PPT design is completely editable. Download it and make adjustments in color, background, font etc. as per your unique business setting.
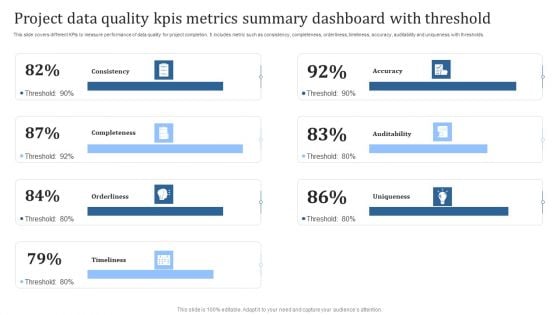
Project Data Quality Kpis Metrics Summary Dashboard With Threshold Guidelines PDF
This slide covers different KPIs to measure performance of data quality for project completion. It includes metric such as consistency, completeness, orderliness, timeliness, accuracy, auditability and uniqueness with thresholds. Pitch your topic with ease and precision using this Project Data Quality Kpis Metrics Summary Dashboard With Threshold Guidelines PDF. This layout presents information on Consistency, Completeness, Orderliness. It is also available for immediate download and adjustment. So, changes can be made in the color, design, graphics or any other component to create a unique layout.
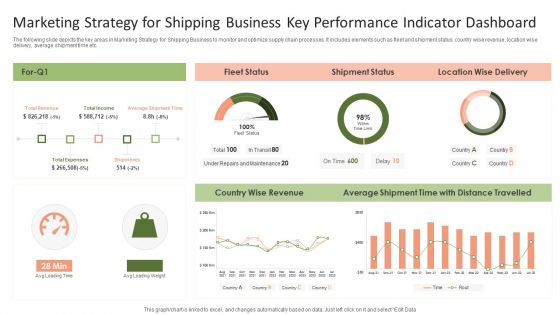
Marketing Strategy For Shipping Business Key Performance Indicator Dashboard Graphics PDF
The following slide depicts the key areas in Marketing Strategy for Shipping Business to monitor and optimize supply chain processes. It includes elements such as fleet and shipment status, country wise revenue, location wise delivery, average shipment time etc.Pitch your topic with ease and precision using this Marketing Strategy For Shipping Business Key Performance Indicator Dashboard Graphics PDF. This layout presents information on Shipment Status, Average Shipment, Wise Revenue. It is also available for immediate download and adjustment. So, changes can be made in the color, design, graphics or any other component to create a unique layout.
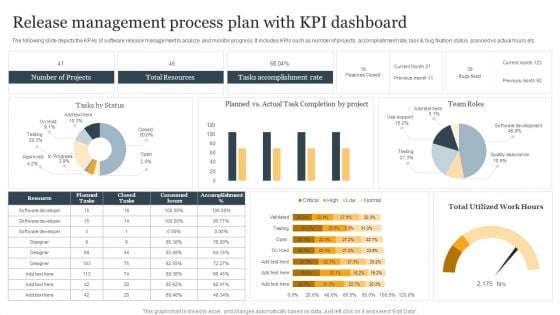
Release Management Process Plan With KPI Dashboard Ppt Infographic Template Structure PDF
The following slide depicts the KPAs of software release management to analyze and monitor progress. It includes KPIs such as number of projects, accomplishment rate, task and bug fixation status, planned vs actual hours etc. Showcasing this set of slides titled Release Management Process Plan With KPI Dashboard Ppt Infographic Template Structure PDF. The topics addressed in these templates are Number Of Projects, Total Resources, Tasks Accomplishment Rate. All the content presented in this PPT design is completely editable. Download it and make adjustments in color, background, font etc. as per your unique business setting.
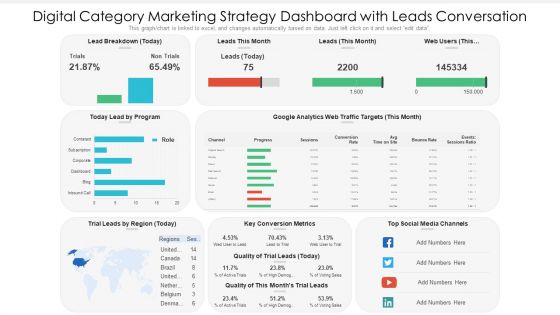
Digital Category Marketing Strategy Dashboard With Leads Conversation Ppt PowerPoint Presentation Slides Information PDF
This graph chart is linked to excel, and changes automatically based on data. Just left click on it and select edit data. Pitch your topic with ease and precision using this digital category marketing strategy dashboard with leads conversation ppt powerpoint presentation slides information pdf. This layout presents information on key conversion metrics, social media channels, lead by program. It is also available for immediate download and adjustment. So, changes can be made in the color, design, graphics or any other component to create a unique layout.
Education Metrics Dashboard For Tracking Student Ethnicity And Specially Abled Characteristics Brochure PDF
This slide covers the education key performance indicator tracker. It include metrics such as total applications, conversion rate, offers year to date, applications by ethnicity and disabilities, etc. Showcasing this set of slides titled Education Metrics Dashboard For Tracking Student Ethnicity And Specially Abled Characteristics Brochure PDF. The topics addressed in these templates are Total Applications, Conversion Rate 2022, Ethnicity. All the content presented in this PPT design is completely editable. Download it and make adjustments in color, background, font etc. as per your unique business setting.

Funding Pitch On Key Financial Metrics Dashboard Ppt Ideas Deck PDF
This slide illustrates facts and figures related to important financial metrics It includes cash flow, DSO, ROCE, EPS diluted for Q4 FY21, Q3 FY22 and Q4 FY22 etc. Showcasing this set of slides titled Funding Pitch On Key Financial Metrics Dashboard Ppt Ideas Deck PDF. The topics addressed in these templates are Cash Flow, EPS Diluted, ROCE. All the content presented in this PPT design is completely editable. Download it and make adjustments in color, background, font etc. as per your unique business setting.
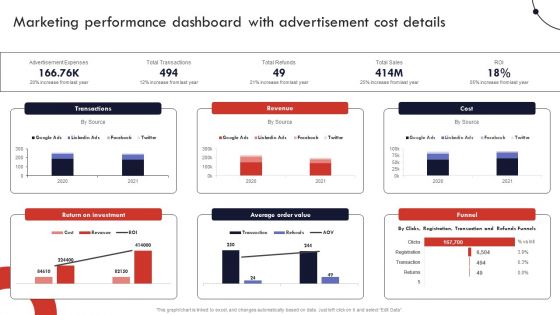
Product And Services Promotion Marketing Performance Dashboard With Advertisement Graphics PDF
This graph or chart is linked to excel, and changes automatically based on data. Just left click on it and select Edit Data. Slidegeeks is here to make your presentations a breeze with Product And Services Promotion Marketing Performance Dashboard With Advertisement Graphics PDF With our easy-to-use and customizable templates, you can focus on delivering your ideas rather than worrying about formatting. With a variety of designs to choose from, youre sure to find one that suits your needs. And with animations and unique photos, illustrations, and fonts, you can make your presentation pop. So whether youre giving a sales pitch or presenting to the board, make sure to check out Slidegeeks first.
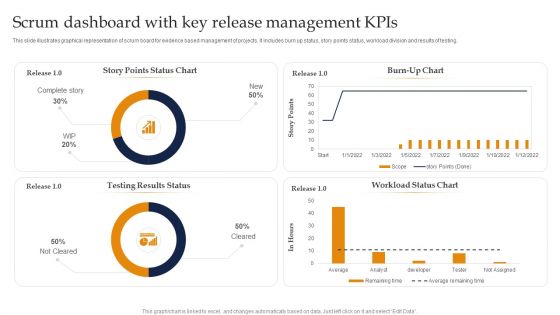
Scrum Dashboard With Key Release Management Kpis Ppt Summary Vector PDF
This slide illustrates graphical representation of scrum board for evidence based management of projects. It includes burn up status, story points status, workload division and results of testing. Showcasing this set of slides titled Scrum Dashboard With Key Release Management Kpis Ppt Summary Vector PDF. The topics addressed in these templates are Burn Up Chart, Workload Status Chart, Testing Results Status. All the content presented in this PPT design is completely editable. Download it and make adjustments in color, background, font etc. as per your unique business setting.


 Continue with Email

 Home
Home


