Portfolio Dashboard
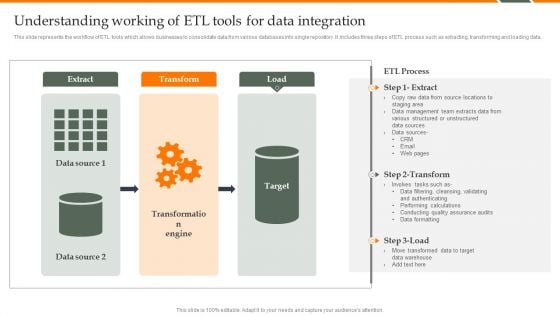
Human Resource Analytics Understanding Working Of ETL Tools For Data Integration Microsoft PDF
This slide represents the workflow of ETL tools which allows businesses to consolidate data from various databases into single repository. It includes three steps of ETL process such as extracting, transforming and loading data. Do you know about Slidesgeeks Human Resource Analytics Understanding Working Of ETL Tools For Data Integration Microsoft PDF These are perfect for delivering any kind od presentation. Using it, create PowerPoint presentations that communicate your ideas and engage audiences. Save time and effort by using our pre-designed presentation templates that are perfect for a wide range of topic. Our vast selection of designs covers a range of styles, from creative to business, and are all highly customizable and easy to edit. Download as a PowerPoint template or use them as Google Slides themes.
Magnifying Glass Vector Illustrating Buyer Behavior Icon Ppt Outline Information PDF
Persuade your audience using this magnifying glass vector illustrating buyer behavior icon ppt outline information pdf. This PPT design covers three stages, thus making it a great tool to use. It also caters to a variety of topics including magnifying glass vector illustrating buyer behavior icon. Download this PPT design now to present a convincing pitch that not only emphasizes the topic but also showcases your presentation skills.
Product Business Plan Review Icon With Magnifying Glass Diagrams PDF
Persuade your audience using this Product Business Plan Review Icon With Magnifying Glass Diagrams PDF. This PPT design covers four stages, thus making it a great tool to use. It also caters to a variety of topics including Product Business Plan Review, Icon With Magnifying Glass. Download this PPT design now to present a convincing pitch that not only emphasizes the topic but also showcases your presentation skills.
Google Keyword Assessment Icon For Improving Customer Engagement Download PDF
Persuade your audience using this Google Keyword Assessment Icon For Improving Customer Engagement Download PDF. This PPT design covers three stages, thus making it a great tool to use. It also caters to a variety of topics including Google Keyword Assessment Icon, Improving Customer Engagement. Download this PPT design now to present a convincing pitch that not only emphasizes the topic but also showcases your presentation skills.
HR First 100 Days Roadmap Icon For Employee Benefits Elements PDF
Persuade your audience using this HR First 100 Days Roadmap Icon For Employee Benefits Elements PDF. This PPT design covers three stages, thus making it a great tool to use. It also caters to a variety of topics including HR First 100 Days, Roadmap Icon, Employee Benefits. Download this PPT design now to present a convincing pitch that not only emphasizes the topic but also showcases your presentation skills.
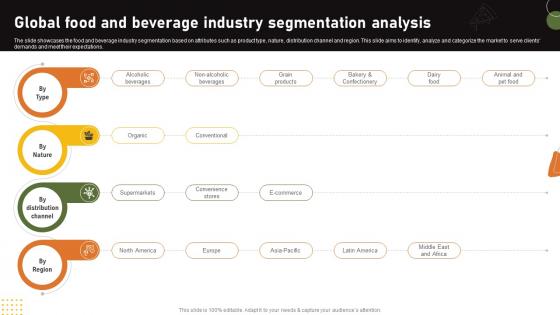
Global Food And Beverage Industry Segmentation Analysis Food And Drink Industry Report IR SS V
The slide showcases the food and beverage industry segmentation based on attributes such as product type, nature, distribution channel and region. This slide aims to identify, analyze and categorize the market to serve clients demands and meet their expectations. The Global Food And Beverage Industry Segmentation Analysis Food And Drink Industry Report IR SS V is a compilation of the most recent design trends as a series of slides. It is suitable for any subject or industry presentation, containing attractive visuals and photo spots for businesses to clearly express their messages. This template contains a variety of slides for the user to input data, such as structures to contrast two elements, bullet points, and slides for written information. Slidegeeks is prepared to create an impression. The slide showcases the food and beverage industry segmentation based on attributes such as product type, nature, distribution channel and region. This slide aims to identify, analyze and categorize the market to serve clients demands and meet their expectations.
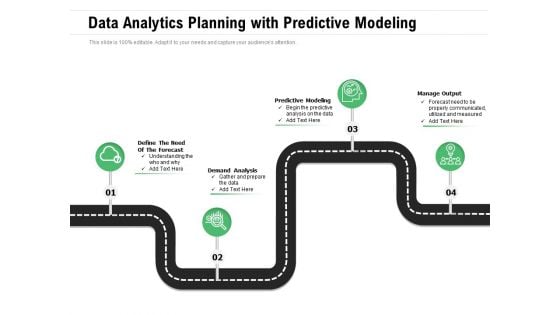
Data Analytics Planning With Predictive Modeling Ppt PowerPoint Presentation File Example Topics PDF
Presenting data analytics planning with predictive modeling ppt powerpoint presentation file example topics pdf to dispense important information. This template comprises four stages. It also presents valuable insights into the topics including analysis, communicated, predictive. This is a completely customizable PowerPoint theme that can be put to use immediately. So, download it and address the topic impactfully.
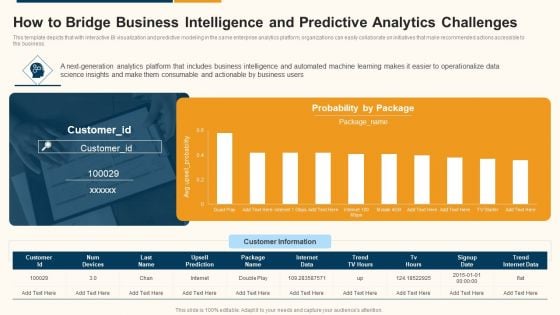
Data Interpretation And Analysis Playbook How To Bridge Business Intelligence And Predictive Analytics Challenges Designs PDF
This template depicts that with interactive BI visualization and predictive modeling in the same enterprise analytics platform, organizations can easily collaborate on initiatives that make recommended actions accessible to the business. Deliver an awe inspiring pitch with this creative data interpretation and analysis playbook how to bridge business intelligence and predictive analytics challenges designs pdf bundle. Topics like how to bridge business intelligence and predictive analytics challenges can be discussed with this completely editable template. It is available for immediate download depending on the needs and requirements of the user.

How To Create Cost Effective Kpis To Measure Effectiveness Of Facebook Strategy SS V
The following slide outlines key performance indicators KPI through which marketers can analyze impact of Facebook ads. The key metrics mentioned in slide are likes, shares, comments, click-through rate CTR, cost per conversion CPV, conversion rate, new followers, reach, and brand impressions. Find a pre-designed and impeccable How To Create Cost Effective Kpis To Measure Effectiveness Of Facebook Strategy SS V. The templates can ace your presentation without additional effort. You can download these easy-to-edit presentation templates to make your presentation stand out from others. So, what are you waiting for Download the template from Slidegeeks today and give a unique touch to your presentation. The following slide outlines key performance indicators KPI through which marketers can analyze impact of Facebook ads. The key metrics mentioned in slide are likes, shares, comments, click-through rate CTR, cost per conversion CPV, conversion rate, new followers, reach, and brand impressions.

Facebook Marketing Techniques Kpis To Measure Effectiveness Of Facebook Ad Strategy SS V
The following slide outlines key performance indicators KPI through which marketers can analyze impact of Facebook ads. The key metrics mentioned in slide are likes, shares, comments, click-through rate CTR , cost per conversion CPV , conversion rate, new followers, reach, and brand impressions. Find a pre-designed and impeccable Facebook Marketing Techniques Kpis To Measure Effectiveness Of Facebook Ad Strategy SS V. The templates can ace your presentation without additional effort. You can download these easy-to-edit presentation templates to make your presentation stand out from others. So, what are you waiting for Download the template from Slidegeeks today and give a unique touch to your presentation. The following slide outlines key performance indicators KPI through which marketers can analyze impact of Facebook ads. The key metrics mentioned in slide are likes, shares, comments, click-through rate CTR , cost per conversion CPV , conversion rate, new followers, reach, and brand impressions.
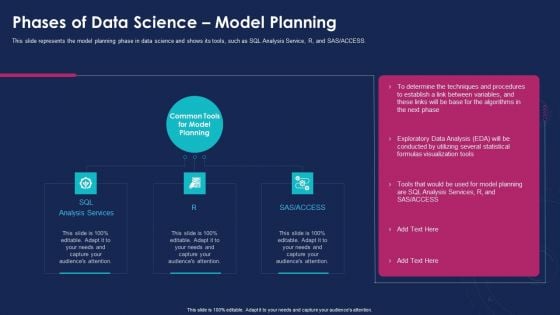
Data Analytics IT Phases Of Data Science Model Planning Ideas PDF
This slide represents the model planning phase in data science and shows its tools, such as SQL Analysis Service, R, and SAS or ACCESS. This is a data analytics it phases of data science model planning ideas pdf template with various stages. Focus and dispense information on three stages using this creative set, that comes with editable features. It contains large content boxes to add your information on topics like sql analysis services, r, sas or access. You can also showcase facts, figures, and other relevant content using this PPT layout. Grab it now.

Enterprise Problem Solving And Intellect Foundational Data Modelling Applications Ppt PowerPoint Presentation Inspiration Example Introduction PDF
Presenting this set of slides with name enterprise problem solving and intellect foundational data modelling applications ppt powerpoint presentation inspiration example introduction pdf. This is a one stage process. The stages in this process are sources systems, data cubes, healthcare, edw model, financial, cinical analytics and reporting, cost, charge, encounter. This is a completely editable PowerPoint presentation and is available for immediate download. Download now and impress your audience.
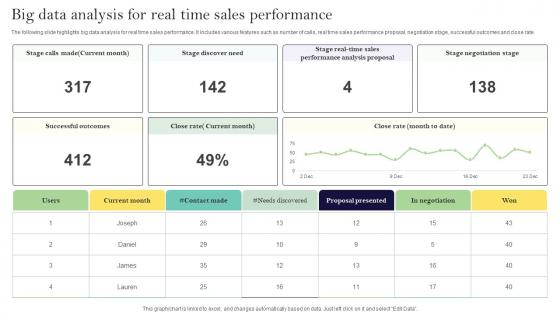
Big Data Analysis For Real Time Sales Performance Ppt Show Format Ideas Pdf
The following slide highlights big data analysis for real time sales performance. It includes various features such as number of calls, real time sales performance proposal, negotiation stage, successful outcomes and close rate. Showcasing this set of slides titled Big Data Analysis For Real Time Sales Performance Ppt Show Format Ideas Pdf. The topics addressed in these templates are Negotiation Stage, Successful Outcomes, Close Rate. All the content presented in this PPT design is completely editable. Download it and make adjustments in color, background, font etc. as per your unique business setting. The following slide highlights big data analysis for real time sales performance. It includes various features such as number of calls, real time sales performance proposal, negotiation stage, successful outcomes and close rate.
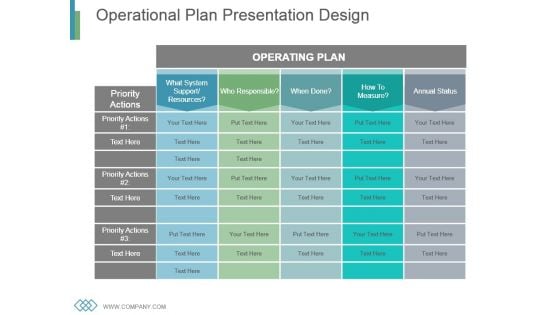
Operational Plan Presentation Design
This is a operational plan presentation design. This is a five stage process. The stages in this process are what system support resources, who responsible, when done, how, how to measure, annual status.
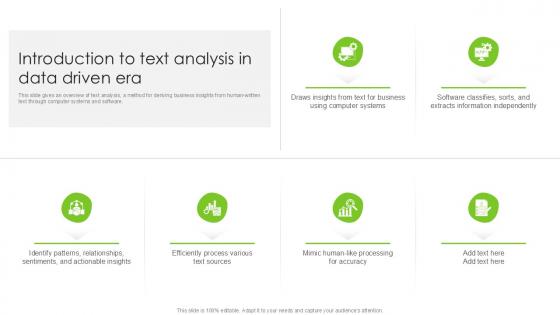
Introduction To Text Analysis In Data Driven Era PPT Powerpoint SS
This slide gives an overview of text analysis, a method for deriving business insights from human-written text through computer systems and software. Explore a selection of the finest Introduction To Text Analysis In Data Driven Era PPT Powerpoint SS here. With a plethora of professionally designed and pre-made slide templates, you can quickly and easily find the right one for your upcoming presentation. You can use our Introduction To Text Analysis In Data Driven Era PPT Powerpoint SS to effectively convey your message to a wider audience. Slidegeeks has done a lot of research before preparing these presentation templates. The content can be personalized and the slides are highly editable. Grab templates today from Slidegeeks. This slide gives an overview of text analysis, a method for deriving business insights from human-written text through computer systems and software.
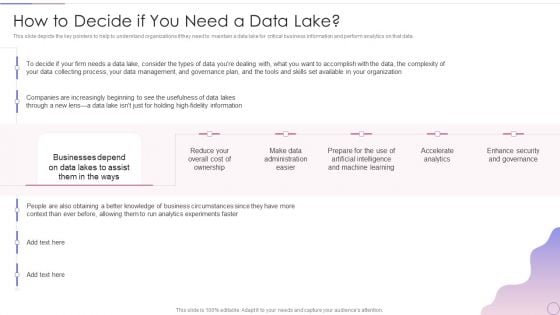
Data Lake Architecture Future Of Data Analysis How To Decide If You Need A Data Lake Designs PDF
This slide depicts the key pointers to help to understand organizations if they need to maintain a data lake for critical business information and perform analytics on that data.Deliver an awe inspiring pitch with this creative Data Lake Architecture Future Of Data Analysis How To Decide If You Need A Data Lake Designs PDF bundle. Topics like Businesses Depend, Fidelity Information, Artificial Intelligence can be discussed with this completely editable template. It is available for immediate download depending on the needs and requirements of the user.
Qualified Traffic Generation Through Search Engines Magnifying Glass Formats PDF
Do you know about Slidesgeeks Qualified Traffic Generation Through Search Engines Magnifying Glass Formats PDF. These are perfect for delivering any kind od presentation. Using it, create PowerPoint presentations that communicate your ideas and engage audiences. Save time and effort by using our pre designed presentation templates that are perfect for a wide range of topic. Our vast selection of designs covers a range of styles, from creative to business, and are all highly customizable and easy to edit. Download as a PowerPoint template or use them as Google Slides themes.
Chat Messenger Investor Funding Elevator Pitch Deck Magnify Glass Portrait PDF
Welcome to our selection of the Chat Messenger Investor Funding Elevator Pitch Deck Magnify Glass Portrait PDF. These are designed to help you showcase your creativity and bring your sphere to life. Planning and Innovation are essential for any business that is just starting out. This collection contains the designs that you need for your everyday presentations. All of our PowerPoints are 100 percent editable, so you can customize them to suit your needs. This multi purpose template can be used in various situations. Grab these presentation templates today.
KPIs To Track Impact Of Eco Friendly Procurement Icons Pdf
The slide showcases key performance indicators that assist in maintaining a track record of activities initiated in order to attain sustainable procurement in organisations. The KPIs are carbon emissions, power and energy, social, governance, etc.Pitch your topic with ease and precision using this KPIs To Track Impact Of Eco Friendly Procurement Icons Pdf This layout presents information on Measure Organizations, Consumption Costs, Stakeholder Engagement It is also available for immediate download and adjustment. So, changes can be made in the color, design, graphics or any other component to create a unique layout. The slide showcases key performance indicators that assist in maintaining a track record of activities initiated in order to attain sustainable procurement in organisations. The KPIs are carbon emissions, power and energy, social, governance, etc.

How Does Data Mining Work Using Data Mining Tools To Optimize Processes AI SS V
This slide showcases basic process on how data mining works which can help developers in getting an initial idea for its operations. It provides details about data gathering, data preparation, data mining and data analysis. Take your projects to the next level with our ultimate collection of How Does Data Mining Work Using Data Mining Tools To Optimize Processes AI SS V. Slidegeeks has designed a range of layouts that are perfect for representing task or activity duration, keeping track of all your deadlines at a glance. Tailor these designs to your exact needs and give them a truly corporate look with your own brand colors they will make your projects stand out from the rest This slide showcases basic process on how data mining works which can help developers in getting an initial idea for its operations. It provides details about data gathering, data preparation, data mining and data analysis.
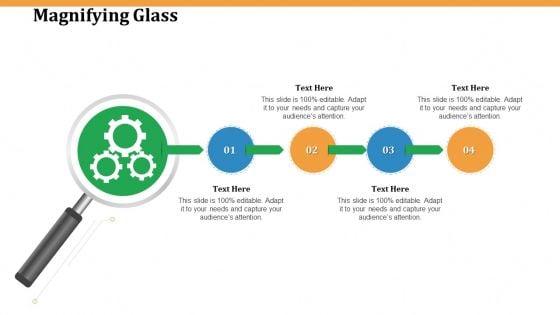
Software Integration WBS Magnifying Glass Ppt PowerPoint Presentation Infographic Template Backgrounds PDF
Presenting software integration wbs magnifying glass ppt powerpoint presentation infographic template backgrounds pdf to provide visual cues and insights. Share and navigate important information on four stages that need your due attention. This template can be used to pitch topics like magnifying glass. In addtion, this PPT design contains high resolution images, graphics, etc, that are easily editable and available for immediate download.
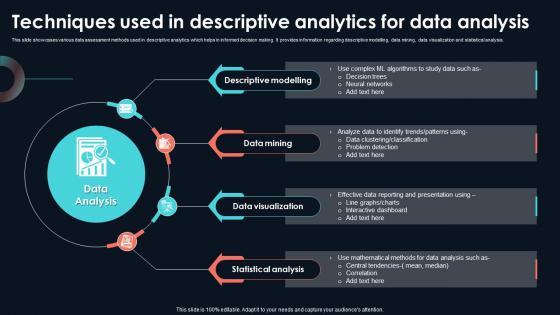
Techniques Used In Descriptive Analytics Developing Strategic Insights Using Big Data Analytics SS V
This slide showcases various data assessment methods used in descriptive analytics which helps in informed decision making. It provides information regarding descriptive modelling, data mining, data visualization and statistical analysis. Presenting this PowerPoint presentation, titled Techniques Used In Descriptive Analytics Developing Strategic Insights Using Big Data Analytics SS V, with topics curated by our researchers after extensive research. This editable presentation is available for immediate download and provides attractive features when used. Download now and captivate your audience. Presenting this Techniques Used In Descriptive Analytics Developing Strategic Insights Using Big Data Analytics SS V. Our researchers have carefully researched and created these slides with all aspects taken into consideration. This is a completely customizable Techniques Used In Descriptive Analytics Developing Strategic Insights Using Big Data Analytics SS V that is available for immediate downloading. Download now and make an impact on your audience. Highlight the attractive features available with our PPTs. This slide showcases various data assessment methods used in descriptive analytics which helps in informed decision making. It provides information regarding descriptive modelling, data mining, data visualization and statistical analysis.
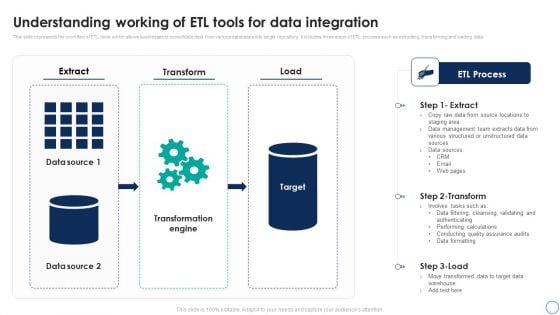
Business Analytics Application Understanding Working Of ETL Tools For Data Structure PDF
This slide represents the workflow of ETL tools which allows businesses to consolidate data from various databases into single repository. It includes three steps of ETL process such as extracting, transforming and loading data. This Business Analytics Application Understanding Working Of ETL Tools For Data Structure PDF from Slidegeeks makes it easy to present information on your topic with precision. It provides customization options, so you can make changes to the colors, design, graphics, or any other component to create a unique layout. It is also available for immediate download, so you can begin using it right away. Slidegeeks has done good research to ensure that you have everything you need to make your presentation stand out. Make a name out there for a brilliant performance.

Comprehensive Analysis Of Different Data Lineage Classification Data Lineage And Data Provenance Ideas PDF
This slide represents the data lineage and data provenance that represents data flow at summary and detail levels. The components of both concepts include a file transfer protocol server, data staging area, data warehouse, master data, data marts, and so on. Do you have an important presentation coming up Are you looking for something that will make your presentation stand out from the rest Look no further than Comprehensive Analysis Of Different Data Lineage Classification Data Lineage And Data Provenance Ideas PDF. With our professional designs, you can trust that your presentation will pop and make delivering it a smooth process. And with Slidegeeks, you can trust that your presentation will be unique and memorable. So why wait Grab Comprehensive Analysis Of Different Data Lineage Classification Data Lineage And Data Provenance Ideas PDF today and make your presentation stand out from the rest
Data Consumption Analytics Report Vector Icon Ppt PowerPoint Presentation Gallery Show PDF
Persuade your audience using this data consumption analytics report vector icon ppt powerpoint presentation gallery show pdf. This PPT design covers three stages, thus making it a great tool to use. It also caters to a variety of topics including data consumption analytics report vector icon. Download this PPT design now to present a convincing pitch that not only emphasizes the topic but also showcases your presentation skills.

Data Pre Processing With Rule Sentiment Analysis Demystified Understanding AI SS V
This slide provides information regarding tokenization technique during data-preprocessing in rule-based approach, which acts as a crucial step in transforming raw data into single words or fragments. If your project calls for a presentation, then Slidegeeks is your go-to partner because we have professionally designed, easy-to-edit templates that are perfect for any presentation. After downloading, you can easily edit Data Pre Processing With Rule Sentiment Analysis Demystified Understanding AI SS V and make the changes accordingly. You can rearrange slides or fill them with different images. Check out all the handy templates This slide provides information regarding tokenization technique during data-preprocessing in rule-based approach, which acts as a crucial step in transforming raw data into single words or fragments.
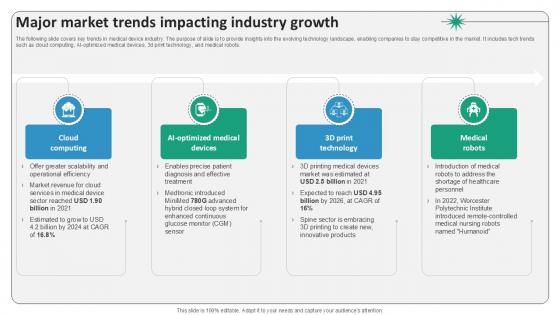
Major Market Trends Impacting Industry Growth Surgical Devices Ppt Template IR SS V
The following slide covers key trends in medical device industry. The purpose of slide is to provide insights into the evolving technology landscape, enabling companies to stay competitive in the market. It includes tech trends such as cloud computing, AI-optimized medical devices, 3d print technology, and medical robots. The Major Market Trends Impacting Industry Growth Surgical Devices Ppt Template IR SS V is a compilation of the most recent design trends as a series of slides. It is suitable for any subject or industry presentation, containing attractive visuals and photo spots for businesses to clearly express their messages. This template contains a variety of slides for the user to input data, such as structures to contrast two elements, bullet points, and slides for written information. Slidegeeks is prepared to create an impression. The following slide covers key trends in medical device industry. The purpose of slide is to provide insights into the evolving technology landscape, enabling companies to stay competitive in the market. It includes tech trends such as cloud computing, AI-optimized medical devices, 3d print technology, and medical robots.
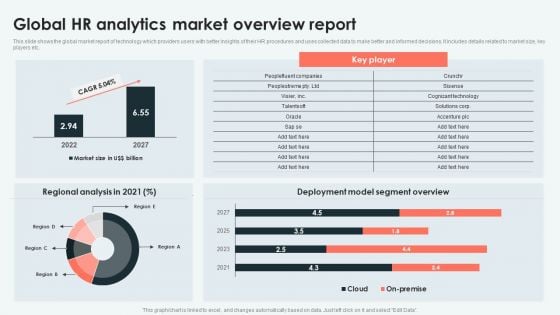
Analyzing And Deploying Global HR Analytics Market Overview Report Portrait PDF
This slide shows the global market report of technology which providers users with better insights of their HR procedures and uses collected data to make better and informed decisions. It includes details related to market size, key players etc. Create an editable Analyzing And Deploying Global HR Analytics Market Overview Report Portrait PDF that communicates your idea and engages your audience. Whether youre presenting a business or an educational presentation, pre-designed presentation templates help save time. Analyzing And Deploying Global HR Analytics Market Overview Report Portrait PDF is highly customizable and very easy to edit, covering many different styles from creative to business presentations. Slidegeeks has creative team members who have crafted amazing templates. So, go and get them without any delay.

Magnifying Glass Ppt PowerPoint Presentation Styles Graphics Design
This is a magnifying glass ppt powerpoint presentation styles graphics design. This is a four stage process. The stages in this process are magnifier glass, research, business, marketing, focus.

Case Study Trend Analysis For Telecommunications Business Product Analytics Implementation Data Analytics V
This slide provides a case study highlighting use of trend analysis in a telecom company to improve its sales. It covers challenges faced, initiatives undertaken and outcomes on costs and sales Slidegeeks is here to make your presentations a breeze with Case Study Trend Analysis For Telecommunications Business Product Analytics Implementation Data Analytics V With our easy-to-use and customizable templates, you can focus on delivering your ideas rather than worrying about formatting. With a variety of designs to choose from, you are sure to find one that suits your needs. And with animations and unique photos, illustrations, and fonts, you can make your presentation pop. So whether you are giving a sales pitch or presenting to the board, make sure to check out Slidegeeks first This slide provides a case study highlighting use of trend analysis in a telecom company to improve its sales. It covers challenges faced, initiatives undertaken and outcomes on costs and sales
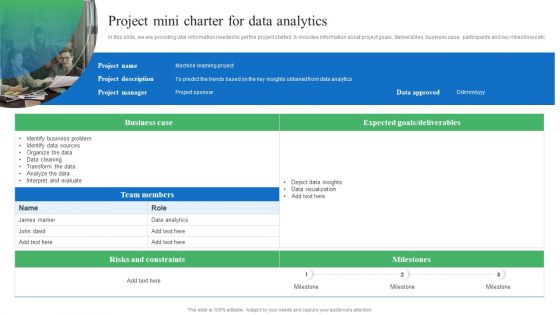
Toolkit For Data Science And Analytics Transition Project Mini Charter For Data Analytics Pictures PDF
In this slide, we are providing vital information needed to get the project started. It includes information about project goals, deliverables, business case, participants and key milestones etc. Welcome to our selection of the Toolkit For Data Science And Analytics Transition Project Mini Charter For Data Analytics Pictures PDF. These are designed to help you showcase your creativity and bring your sphere to life. Planning and Innovation are essential for any business that is just starting out. This collection contains the designs that you need for your everyday presentations. All of our PowerPoints are 100 percent editable, so you can customize them to suit your needs. This multi purpose template can be used in various situations. Grab these presentation templates today.
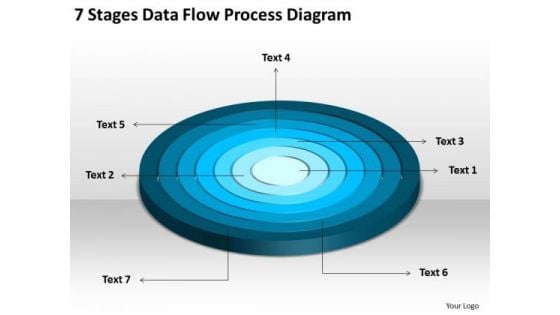
7 Stages Data Flow Process Diagram Business Plan PowerPoint Templates
We present our 7 stages data flow process diagram business plan PowerPoint templates.Download and present our Circle Charts PowerPoint Templates because Our PowerPoint Templates and Slides ensures Effective communication. They help you put across your views with precision and clarity. Download our Shapes PowerPoint Templates because Our PowerPoint Templates and Slides will let your team Walk through your plans. See their energy levels rise as you show them the way. Present our Signs PowerPoint Templates because Our PowerPoint Templates and Slides are Clear and concise. Use them and dispel any doubts your team may have. Present our Maketing PowerPoint Templates because Our PowerPoint Templates and Slides are aesthetically designed to attract attention. We gaurantee that they will grab all the eyeballs you need. Download and present our Metaphors-Visual Concepts PowerPoint Templates because Our PowerPoint Templates and Slides offer you the needful to organise your thoughts. Use them to list out your views in a logical sequence.Use these PowerPoint slides for presentations relating to diagram, circular, market, bar, advertise, interface, business, concept, vector, sign, success, presentation, symbol, template, circle, brochure, finance, data, description, report, marketing, title, label, abstract, management, graph, four, illustration, icon, pie, chart, strategy, catalog, research, web, design, growth, text, professional, banner, account, profit, information, background, info-graphic, analyze, financial, button, goals. The prominent colors used in the PowerPoint template are Blue, Blue light, White. Amuse your audience with our 7 Stages Data Flow Process Diagram Business Plan PowerPoint Templates. Some of them are designed to be far out.
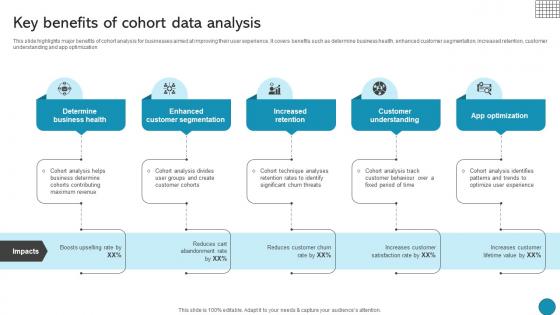
Key Benefits Of Cohort Data Analysis Driving Business Success Integrating Product
This slide highlights major benefits of cohort analysis for businesses aimed at improving their user experience. It covers benefits such as determine business health, enhanced customer segmentation, increased retention, customer understanding and app optimization This Key Benefits Of Cohort Data Analysis Driving Business Success Integrating Product from Slidegeeks makes it easy to present information on your topic with precision. It provides customization options, so you can make changes to the colors, design, graphics, or any other component to create a unique layout. It is also available for immediate download, so you can begin using it right away. Slidegeeks has done good research to ensure that you have everything you need to make your presentation stand out. Make a name out there for a brilliant performance. This slide highlights major benefits of cohort analysis for businesses aimed at improving their user experience. It covers benefits such as determine business health, enhanced customer segmentation, increased retention, customer understanding and app optimization
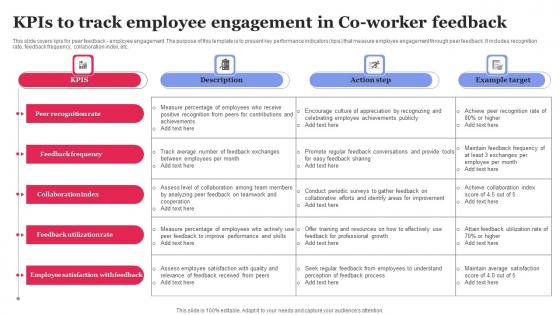
KPIS To Track Employee Engagement In Co Worker Feedback Inspiration Pdf
This slide covers kpis for peer feedback employee engagement. The purpose of this template is to present key performance indicators kpis that measure employee engagement through peer feedback. It includes recognition rate, feedback frequency, collaboration index, etc. Showcasing this set of slides titled KPIS To Track Employee Engagement In Co Worker Feedback Inspiration Pdf The topics addressed in these templates are Peer Recognition Rate, Feedback Frequency, Collaboration Index All the content presented in this PPT design is completely editable. Download it and make adjustments in color, background, font etc. as per your unique business setting. This slide covers kpis for peer feedback employee engagement. The purpose of this template is to present key performance indicators kpis that measure employee engagement through peer feedback. It includes recognition rate, feedback frequency, collaboration index, etc.
Strategic Planning And Execution A Comprehensive Guide Magnifying Glass Clipart PDF
Get a simple yet stunning designed Strategic Planning And Execution A Comprehensive Guide Magnifying Glass Clipart PDF. It is the best one to establish the tone in your meetings. It is an excellent way to make your presentations highly effective. So, download this PPT today from Slidegeeks and see the positive impacts. Our easy to edit Strategic Planning And Execution A Comprehensive Guide Magnifying Glass Clipart PDF can be your go to option for all upcoming conferences and meetings. So, what are you waiting for Grab this template today.
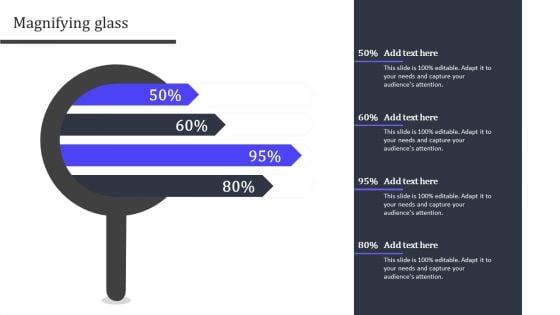
Magnifying Glass Analyzing And Managing Risk In Material Acquisition For Supply Chain Administration Introduction PDF
Slidegeeks is here to make your presentations a breeze with Magnifying Glass Analyzing And Managing Risk In Material Acquisition For Supply Chain Administration Introduction PDF With our easy to use and customizable templates, you can focus on delivering your ideas rather than worrying about formatting. With a variety of designs to choose from, you are sure to find one that suits your needs. And with animations and unique photos, illustrations, and fonts, you can make your presentation pop. So whether you are giving a sales pitch or presenting to the board, make sure to check out Slidegeeks first.
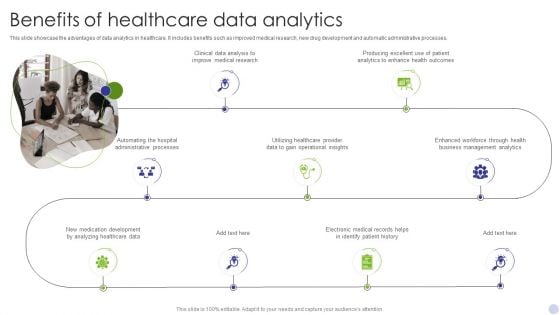
Benefits Of Healthcare Data Analytics Pictures PDF
This slide showcase the advantages of data analytics in healthcare. It includes benefits such as improved medical research, new drug development and automatic administrative processes. Persuade your audience using this Benefits Of Healthcare Data Analytics Pictures PDF. This PPT design covers Ten stages, thus making it a great tool to use. It also caters to a variety of topics including Clinical Data Analysis, Improve Medical Research. Download this PPT design now to present a convincing pitch that not only emphasizes the topic but also showcases your presentation skills.

Human Resource Monthly Employee Engagement Report PPT Example SS
This slide represents the employee engagement report prepared by the human resource team. It includes details related to response rate, highlights, factors, questions, factor and question summary etc. The Human Resource Monthly Employee Engagement Report PPT Example SS is a compilation of the most recent design trends as a series of slides. It is suitable for any subject or industry presentation, containing attractive visuals and photo spots for businesses to clearly express their messages. This template contains a variety of slides for the user to input data, such as structures to contrast two elements, bullet points, and slides for written information. Slidegeeks is prepared to create an impression. This slide represents the employee engagement report prepared by the human resource team. It includes details related to response rate, highlights, factors, questions, factor and question summary etc.

Data Warehousing And Data Mining Vs Machine Learning Comparative Analysis AI SS V
This slide showcases comparative analysis of data mining and machine learning, helping researchers finalize which methods or blend is best for their operations. It provides information about meaning, human intervention, purpose and use cases. Create an editable Data Warehousing And Data Mining Vs Machine Learning Comparative Analysis AI SS V that communicates your idea and engages your audience. Whether you are presenting a business or an educational presentation, pre-designed presentation templates help save time. Data Warehousing And Data Mining Vs Machine Learning Comparative Analysis AI SS V is highly customizable and very easy to edit, covering many different styles from creative to business presentations. Slidegeeks has creative team members who have crafted amazing templates. So, go and get them without any delay. This slide showcases comparative analysis of data mining and machine learning, helping researchers finalize which methods or blend is best for their operations. It provides information about meaning, human intervention, purpose and use cases.
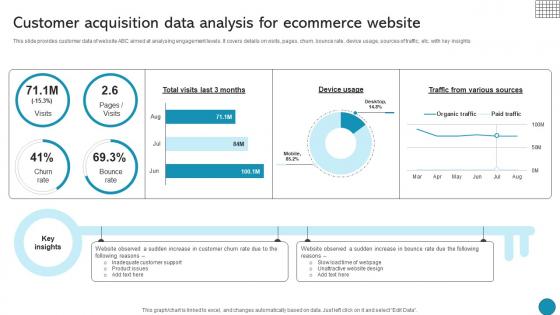
Customer Acquisition Data Analysis For Ecommerce Website Driving Business Success Integrating Product
This slide provides customer data of website ABC aimed at analysing engagement levels. It covers details on visits, pages, churn, bounce rate, device usage, sources of traffic, etc. with key insights If you are looking for a format to display your unique thoughts, then the professionally designed Customer Acquisition Data Analysis For Ecommerce Website Driving Business Success Integrating Product is the one for you. You can use it as a Google Slides template or a PowerPoint template. Incorporate impressive visuals, symbols, images, and other charts. Modify or reorganize the text boxes as you desire. Experiment with shade schemes and font pairings. Alter, share or cooperate with other people on your work. Download Customer Acquisition Data Analysis For Ecommerce Website Driving Business Success Integrating Product and find out how to give a successful presentation. Present a perfect display to your team and make your presentation unforgettable. This slide provides customer data of website ABC aimed at analysing engagement levels. It covers details on visits, pages, churn, bounce rate, device usage, sources of traffic, etc. with key insights
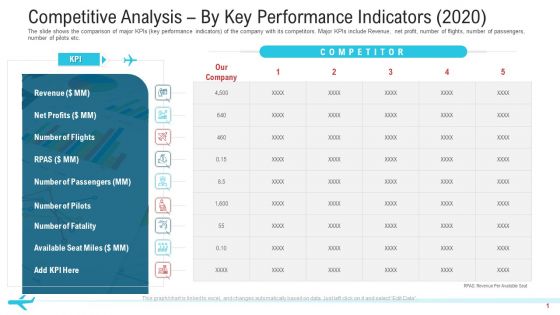
Competitive Analysis By Key Performance Indicators 2020 Designs PDF
The slide shows the comparison of major KPIs key performance indicators of the company with its competitors. Major KPIs include Revenue, net profit, number of flights, number of passengers, number of pilots etc.Deliver an awe-inspiring pitch with this creative competitive analysis by key performance indicators 2020 designs pdf. bundle. Topics like net profits, revenue, number of passengers can be discussed with this completely editable template. It is available for immediate download depending on the needs and requirements of the user.
Data Security Compliance System Icon Clipart Pdf
Pitch your topic with ease and precision using this Data Security Compliance System Icon Clipart Pdf. This layout presents information on Data Security, Compliance System. It is also available for immediate download and adjustment. So, changes can be made in the color, design, graphics or any other component to create a unique layout. Our Data Security Compliance System Icon Clipart Pdf are topically designed to provide an attractive backdrop to any subject. Use them to look like a presentation pro.
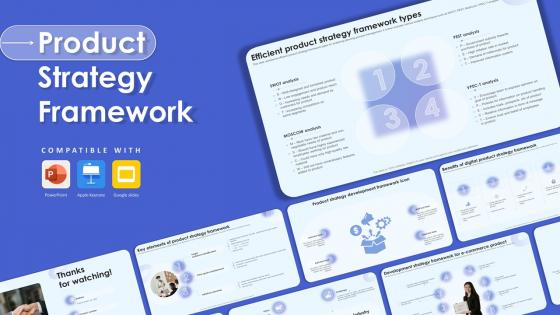
Product Strategy Framework Powerpoint Ppt Template Bundles
With well-researched insights and carefully-constructed design, this Product Strategy Framework Powerpoint Ppt Template Bundles is all that you need for your next business meeting with clients and win them over. Add your data to graphs, charts, and tables that are already ready to display it with stunning visuals and help your audience recall your work. With this PPT Complete Deck, you will be able to display your knowledge of the subject as well as your skills as a communicator. Share your ideas and make an impact on the audience with this PowerPoint Layout and ensure that you are known as a presentation professional. Download this PPT Template Bundle to create the most interesting presentation anyone has ever seen. Have a look at the Product Strategy Framework PowerPoint PPT presentation, a game-changing tool to assist firms to launch new products. This interactive resource offer approach to developing winning product strategies for varied markets. This PPT, which focuses on e commerce and digital product strategies, goes into key topics such as market analysis, competitive research, target audience identification, and positioning. Discover how to use industry trends and customer insights to create creative and appealing goods that attract to your target audience. Explore the complexities of product development, pricing, distribution, and promotional strategies, all supported by real-world case studies and best practices. Our Product Strategy Framework PPT will help you unlock the potential for extraordinary product success and boost your brands market position.

Global Finance Industry Market Trends Strategy For Launching A Financial Strategy SS V
This slide showcases the market trends of global finance industry. It includes trends such as digital transformation, fintech innovation, cybersecurity and data privacy and cryptocurrency and digital assets. If your project calls for a presentation, then Slidegeeks is your go-to partner because we have professionally designed, easy-to-edit templates that are perfect for any presentation. After downloading, you can easily edit Global Finance Industry Market Trends Strategy For Launching A Financial Strategy SS V and make the changes accordingly. You can rearrange slides or fill them with different images. Check out all the handy templates This slide showcases the market trends of global finance industry. It includes trends such as digital transformation, fintech innovation, cybersecurity and data privacy and cryptocurrency and digital assets.
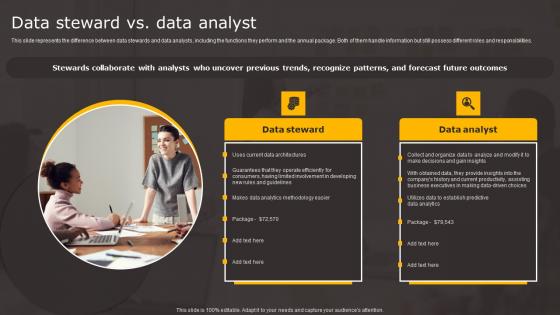
Data Stewardship In Business Processes Data Steward Vs Data Analyst Themes Pdf
This slide represents the difference between data stewards and data analysts, including the functions they perform and the annual package. Both of them handle information but still possess different roles and responsibilities. Find a pre designed and impeccable Data Stewardship In Business Processes Data Steward Vs Data Analyst Themes Pdf. The templates can ace your presentation without additional effort. You can download these easy to edit presentation templates to make your presentation stand out from others. So, what are you waiting for Download the template from Slidegeeks today and give a unique touch to your presentation. This slide represents the difference between data stewards and data analysts, including the functions they perform and the annual package. Both of them handle information but still possess different roles and responsibilities.
Icons Slide For Data Warehousing And Data Mining Guide AI SS V
Icons Slide For Data Custodianship Inspiration Pdf
Introducing our well designed Icons Slide For Data Custodianship Inspiration Pdf set of slides. The slide displays editable icons to enhance your visual presentation. The icons can be edited easily. So customize according to your business to achieve a creative edge. Download and share it with your audience. Our Icons Slide For Data Custodianship Inspiration Pdf are topically designed to provide an attractive backdrop to any subject. Use them to look like a presentation pro.
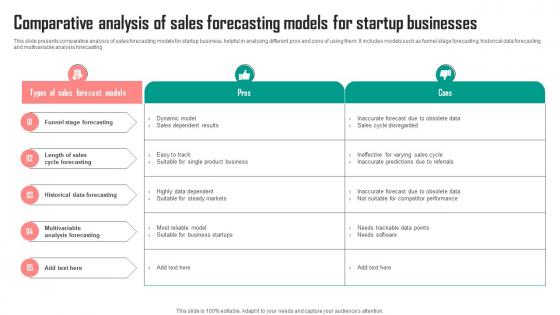
Comparative Analysis Of Sales Forecasting Models For Startup Businesses Mockup Pdf
This slide presents comparative analysis of sales forecasting models for startup business, helpful in analyzing different pros and cons of using them. It includes models such as funnel stage forecasting, historical data forecasting and multivariable analysis forecasting Showcasing this set of slides titled Comparative Analysis Of Sales Forecasting Models For Startup Businesses Mockup Pdf. The topics addressed in these templates are Stage Forecasting, Cycle Forecasting, Forecasting. All the content presented in this PPT design is completely editable. Download it and make adjustments in color, background, font etc. as per your unique business setting. This slide presents comparative analysis of sales forecasting models for startup business, helpful in analyzing different pros and cons of using them. It includes models such as funnel stage forecasting, historical data forecasting and multivariable analysis forecasting
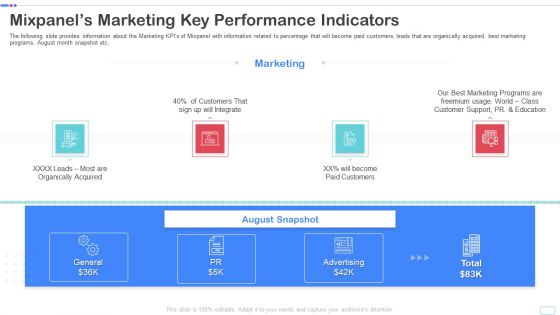
Mixpanel Capital Raising Pitch Deck Mixpanels Marketing Key Performance Indicators Portrait PDF
The following slide provides information about the Marketing KPIs of Mixpanel with information related to percentage that will become paid customers, leads that are organically acquired, best marketing programs, August month snapshot etc. Presenting mixpanel capital raising pitch deck mixpanels marketing key performance indicators portrait pdf to provide visual cues and insights. Share and navigate important information on four stages that need your due attention. This template can be used to pitch topics like mixpanels marketing key performance indicators. In addtion, this PPT design contains high resolution images, graphics, etc, that are easily editable and available for immediate download.
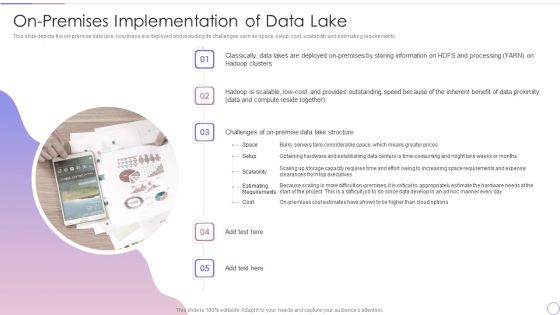
Data Lake Architecture Future Of Data Analysis On Premises Implementation Of Data Lake Template PDF
This slide depicts the on premise data lake, how these are deployed and including its challenges such as space, setup, cost, scalability and estimating requirements.Presenting Data Lake Architecture Future Of Data Analysis On Premises Implementation Of Data Lake Template PDF to provide visual cues and insights. Share and navigate important information on five stages that need your due attention. This template can be used to pitch topics like Provides Outstanding, Data Proximity, Considerable Space. In addtion, this PPT design contains high resolution images, graphics, etc, that are easily editable and available for immediate download.
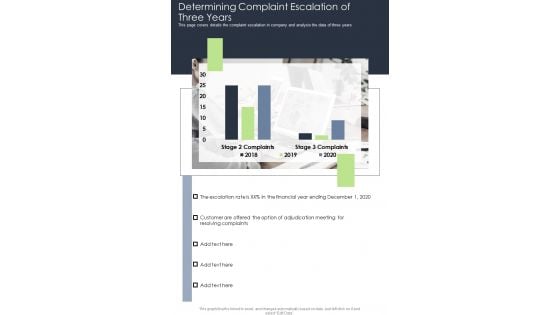
Determining Complaint Escalation Of Three Years One Pager Documents
This page covers details the complaint escalation in company and analysis the data of three years. Presenting you an exemplary Determining Complaint Escalation Of Three Years One Pager Documents. Our one-pager comprises all the must-have essentials of an inclusive document. You can edit it with ease, as its layout is completely editable. With such freedom, you can tweak its design and other elements to your requirements. Download this Determining Complaint Escalation Of Three Years One Pager Documents brilliant piece now.

Magnifying Glass Ppt PowerPoint Presentation Gallery Images
This is a magnifying glass ppt powerpoint presentation gallery images. This is a one stage process. The stages in this process are magnify, search, technology, marketing, strategy.
Magnifying Glass Ppt PowerPoint Presentation Slides Images
This is a magnifying glass ppt powerpoint presentation slides images. This is a three stage process. The stages in this process are business, marketing, strategy, magnify, search.
Magnify Glass Ppt PowerPoint Presentation Professional Skills
This is a magnify glass ppt powerpoint presentation professional skills. This is a one stage process. The stages in this process are magnify glass, search, technology, business, marketing.
Process Involved In Qualitative Data Evaluation Infographics Pdf
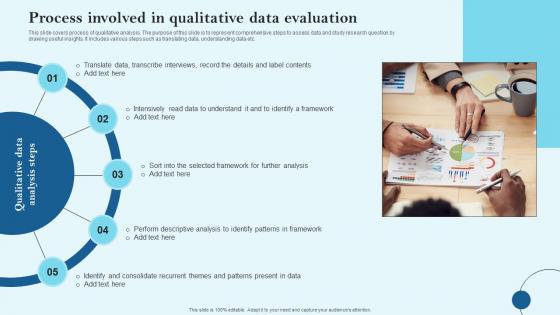
This slide covers process of qualitative analysis. The purpose of this slide is to represent comprehensive steps to assess data and study research question by drawing useful insights. It includes various steps such as translating data, understanding data etc. Pitch your topic with ease and precision using this Process Involved In Qualitative Data Evaluation Infographics Pdf This layout presents information on Qualitative Data, Analysis Steps, Framework It is also available for immediate download and adjustment. So, changes can be made in the color, design, graphics or any other component to create a unique layout. This slide covers process of qualitative analysis. The purpose of this slide is to represent comprehensive steps to assess data and study research question by drawing useful insights. It includes various steps such as translating data, understanding data etc.
Management Framework For Data Analysis And Business Intelligence Ppt PowerPoint Presentation Layouts Smartart PDF
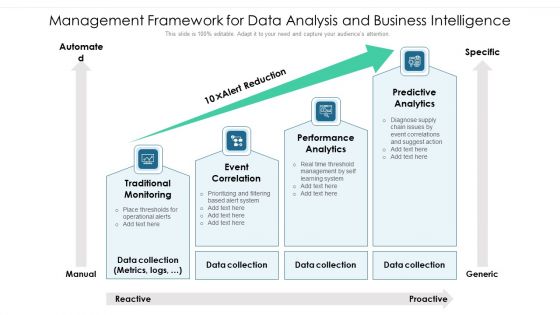
Persuade your audience using this management framework for data analysis and business intelligence ppt powerpoint presentation layouts smartart pdf. This PPT design covers four stages, thus making it a great tool to use. It also caters to a variety of topics including traditional monitoring, event correlation, performance analytics. Download this PPT design now to present a convincing pitch that not only emphasizes the topic but also showcases your presentation skills.

Availability Data Management In Powerpoint And Google Slides Cpb
Presenting our innovatively-designed set of slides titled Availability Data Management In Powerpoint And Google Slides Cpb. This completely editable PowerPoint graphic exhibits Availability Data Management that will help you convey the message impactfully. It can be accessed with Google Slides and is available in both standard screen and widescreen aspect ratios. Apart from this, you can download this well-structured PowerPoint template design in different formats like PDF, JPG, and PNG. So, click the download button now to gain full access to this PPT design. Our Availability Data Management In Powerpoint And Google Slides Cpb are topically designed to provide an attractive backdrop to any subject. Use them to look like a presentation pro.

Data Management System In Powerpoint And Google Slides Cpb
Presenting our innovatively-designed set of slides titled Data Management System In Powerpoint And Google Slides Cpb. This completely editable PowerPoint graphic exhibits Data Management System that will help you convey the message impactfully. It can be accessed with Google Slides and is available in both standard screen and widescreen aspect ratios. Apart from this, you can download this well-structured PowerPoint template design in different formats like PDF, JPG, and PNG. So, click the download button now to gain full access to this PPT design. Our Data Management System In Powerpoint And Google Slides Cpb are topically designed to provide an attractive backdrop to any subject. Use them to look like a presentation pro.

Predictive Data Model Neural Network Model For Predictive Analytics Structure PDF
Step 2 Create Detailed Data Tracking Plan Product Analytics Implementation Data Analytics V
This slide provides a detailed plan for XYZ company aimed at tracking customer data to personalize product features and recommendations. It covers details under various heads such as event, description, properties, source, location, code, user ID, timestamp and status Formulating a presentation can take up a lot of effort and time, so the content and message should always be the primary focus. The visuals of the PowerPoint can enhance the presenters message, so our Step 2 Create Detailed Data Tracking Plan Product Analytics Implementation Data Analytics V was created to help save time. Instead of worrying about the design, the presenter can concentrate on the message while our designers work on creating the ideal templates for whatever situation is needed. Slidegeeks has experts for everything from amazing designs to valuable content, we have put everything into Step 2 Create Detailed Data Tracking Plan Product Analytics Implementation Data Analytics V. This slide provides a detailed plan for XYZ company aimed at tracking customer data to personalize product features and recommendations. It covers details under various heads such as event, description, properties, source, location, code, user ID, timestamp and status


 Continue with Email

 Home
Home


