Portfolio Dashboard
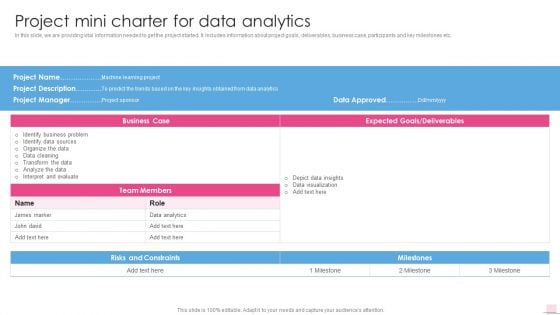
Project Mini Charter For Data Analytics Business Analysis Modification Toolkit Designs PDF
In this slide, we are providing vital information needed to get the project started. It includes information about project goals, deliverables, business case, participants and key milestones etc.Deliver an awe inspiring pitch with this creative Project Mini Charter For Data Analytics Business Analysis Modification Toolkit Designs PDF bundle. Topics like Identify Business, Team Members, Risks Constraints can be discussed with this completely editable template. It is available for immediate download depending on the needs and requirements of the user.
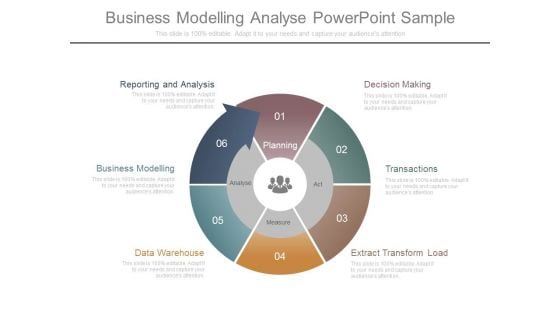
Business Modelling Analyse Powerpoint Sample
This is a business modelling analyse powerpoint sample. This is a six stage process. The stages in this process are decision making, transactions, extract transform load, data warehouse, business modelling, reporting and analysis, planning, act, measure, analyse.
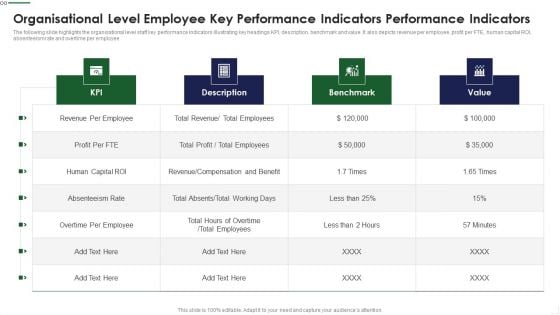
Organisational Level Employee Key Performance Indicators Performance Indicators Rules PDF
The following slide highlights the organisational level staff key performance Indicators illustrating key headings KPI, description, benchmark and value. It also depicts revenue per employee, profit per FTE, human capital ROI, absenteeism rate and overtime per employee Showcasing this set of slides titled Organisational Level Employee Key Performance Indicators Performance Indicators Rules PDF The topics addressed in these templates are Revenue Compensation, Overtime Employee, Benchmark All the content presented in this PPT design is completely editable. Download it and make adjustments in color, background, font etc. as per your unique business setting.
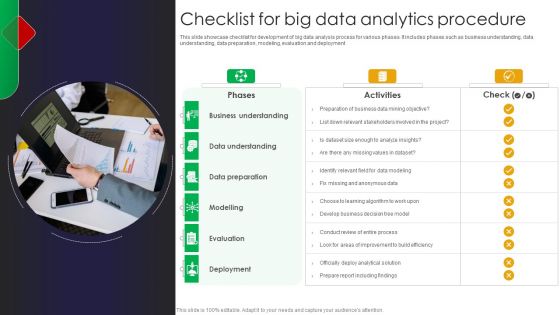
Checklist For Big Data Analytics Procedure Graphics PDF
This slide showcase checklist for development of big data analysis process for various phases. It includes phases such as business understanding, data understanding, data preparation, modeling, evaluation and deployment Presenting Checklist For Big Data Analytics Procedure Graphics PDF to dispense important information. This template comprises three stages. It also presents valuable insights into the topics including Procedure, Big Data, Checklist. This is a completely customizable PowerPoint theme that can be put to use immediately. So, download it and address the topic impactfully.
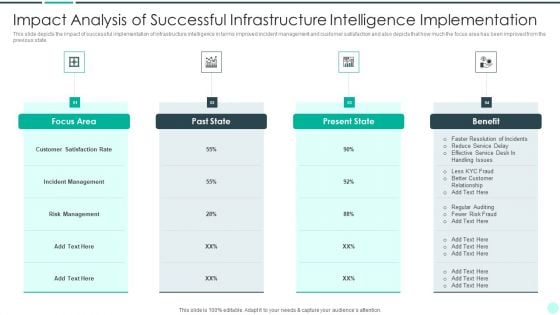
Executing Advance Data Analytics At Workspace Impact Analysis Of Successful Designs PDF
This slide depicts the impact of successful implementation of infrastructure intelligence in terms improved incident management and customer satisfaction and also depicts that how much the focus area has been improved from the previous state. This is a executing advance data analytics at workspace impact analysis of successful designs pdf template with various stages. Focus and dispense information on four stages using this creative set, that comes with editable features. It contains large content boxes to add your information on topics like impact analysis of successful infrastructure intelligence implementation. You can also showcase facts, figures, and other relevant content using this PPT layout. Grab it now.
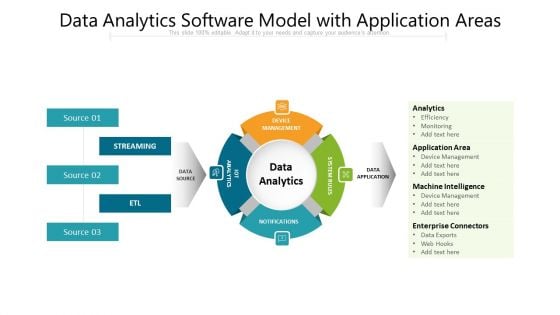
Data Analytics Software Model With Application Areas Ppt PowerPoint Presentation Inspiration Ideas PDF
Pitch your topic with ease and precision using this data analytics software model with application areas ppt powerpoint presentation inspiration ideas pdf. This layout presents information on device management, system rules, data analytics. It is also available for immediate download and adjustment. So, changes can be made in the color, design, graphics or any other component to create a unique layout.
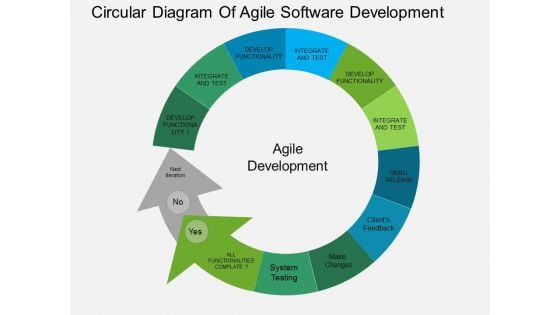
Circular Diagram Of Agile Software Development Powerpoint Templates
This PowerPoint template has been designed with circular diagram This diagram is a data visualization tool that gives you a simple way to present statistical information. This slide helps your audience examine and interpret the data you present.
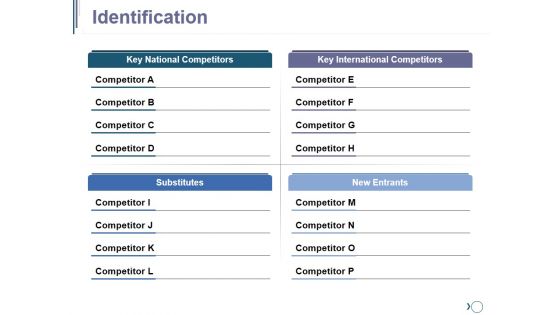
Identification Ppt PowerPoint Presentation Model Example
This is a identification ppt powerpoint presentation model example. This is a four stage process. The stages in this process are tables, marketing, strategy, planning, finance.
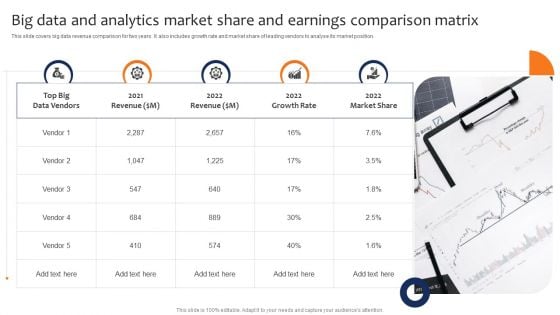
Big Data And Analytics Market Share And Earnings Comparison Matrix Elements PDF
This slide covers big data revenue comparison for two years. It also includes growth rate and market share of leading vendors to analyse its market position. Persuade your audience using this Big Data And Analytics Market Share And Earnings Comparison Matrix Elements PDF. This PPT design covers five stages, thus making it a great tool to use. It also caters to a variety of topics including Revenue, Growth Rate, Market Share. Download this PPT design now to present a convincing pitch that not only emphasizes the topic but also showcases your presentation skills.

Telecom Technology Industry Report With Growth Drivers Pictures PDF
The following slide highlights telecommunication technology industry report with growth drivers such as application services, BPO, digital operations, cybersecurity, data analytics, automation, robotics, business technology and consulting etc. Showcasing this set of slides titled Telecom Technology Industry Report With Growth Drivers Pictures PDF. The topics addressed in these templates are Application Services, Cybersecurity Data, Other Market Drivers. All the content presented in this PPT design is completely editable. Download it and make adjustments in color, background, font etc. as per your unique business setting.
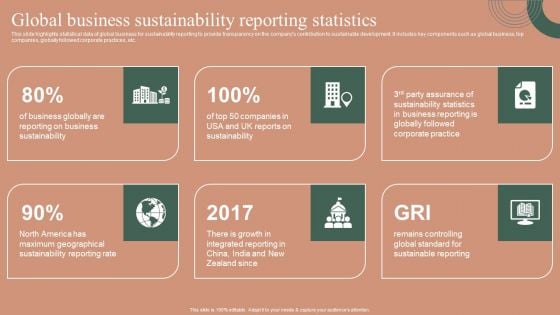
Global Business Sustainability Reporting Statistics Themes PDF
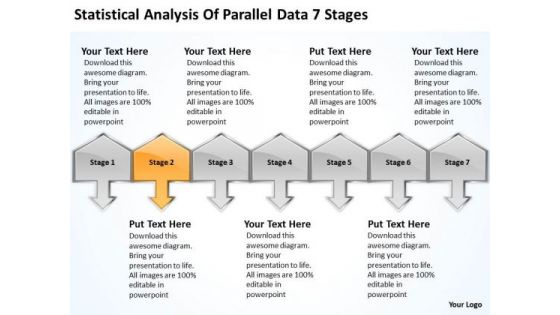
Analysis Of Parallel Data 7 Stages Ppt What Business Planning PowerPoint Templates
We present our analysis of parallel data 7 stages ppt what business planning PowerPoint templates.Use our Arrows PowerPoint Templates because you have the process in your head, our template design showing will illuminate your thoughts. Present our Shapes PowerPoint Templates because this template contains the material to highlight the key issues of your presentation. Download our Metaphors-Visual Concepts PowerPoint Templates because you have good reasons to back up the strength of your belief. Present our Signs PowerPoint Templates because you have made significant headway in this field. Download our Business PowerPoint Templates because the fruits of your labour are beginning to show.Enlighten them on the great plans you have for their enjoyment.Use these PowerPoint slides for presentations relating to achieve, achievement, action, business, chinese, company, concept, conceptual, corporate, definition, idea, macro, market, nature, organization, paintbrush, plan, profit, research, results, sand, shape, single, success, successful, symbol, text, translation, treasure, vision, word. The prominent colors used in the PowerPoint template are Orange, Gray, Black. People tell us our analysis of parallel data 7 stages ppt what business planning PowerPoint templates are visually appealing. Use our concept PowerPoint templates and PPT Slides are Festive. Use our analysis of parallel data 7 stages ppt what business planning PowerPoint templates are Awesome. PowerPoint presentation experts tell us our conceptual PowerPoint templates and PPT Slides are No-nonsense. People tell us our analysis of parallel data 7 stages ppt what business planning PowerPoint templates are Fun. Customers tell us our conceptual PowerPoint templates and PPT Slides will impress their bosses and teams. Bring on the heat with our Analysis Of Parallel Data 7 Stages Ppt What Business Planning PowerPoint Templates. All your doubts will begin to evaporate.
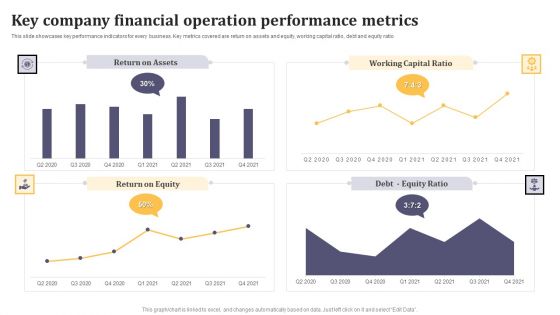
Key Company Financial Operation Performance Metrics Ppt Infographic Template Example Introduction PDF
This slide showcases key performance indicators for every business. Key metrics covered are return on assets and equity, working capital ratio, debt and equity ratio. Showcasing this set of slides titled Key Company Financial Operation Performance Metrics Ppt Infographic Template Example Introduction PDF. The topics addressed in these templates are Return on Assets, Working Capital Ratio, Return on Equity. All the content presented in this PPT design is completely editable. Download it and make adjustments in color, background, font etc. as per your unique business setting.
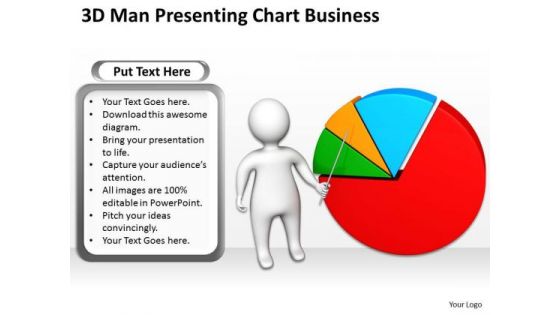
Business Model Diagram Examples 3d Man Presenting Chart PowerPoint Theme Slides
We present our business model diagram examples 3d man presenting chart powerpoint theme Slides.Download and present our Business PowerPoint Templates because They will bring a lot to the table. Their alluring flavours will make your audience salivate. Download our Finance PowerPoint Templates because Our PowerPoint Templates and Slides will bullet point your ideas. See them fall into place one by one. Use our People PowerPoint Templates because Our PowerPoint Templates and Slides will let your team Walk through your plans. See their energy levels rise as you show them the way. Use our Marketing PowerPoint Templates because You are well armed with penetrative ideas. Our PowerPoint Templates and Slides will provide the gunpowder you need. Download our Success PowerPoint Templates because Our PowerPoint Templates and Slides are Clear and concise. Use them and dispel any doubts your team may have.Use these PowerPoint slides for presentations relating to 3d, arrow, business, businessman, cartoon, character, chart, concept, corporate, data, development, diagram, display, figure, finance, financial, graph, graphic, green, growth, guy, human, icon, idea, illustration, information, investment, isolated, market, marketing, men, office, part, people, person, pie, presentation, professional, progress, red, reflection, report, shape, shiny, sign, slice, statistic, success, white. The prominent colors used in the PowerPoint template are Green, Red, Blue. Professionals tell us our business model diagram examples 3d man presenting chart powerpoint theme Slides are readymade to fit into any presentation structure. Use our concept PowerPoint templates and PPT Slides are designed by professionals Use our business model diagram examples 3d man presenting chart powerpoint theme Slides will impress their bosses and teams. Customers tell us our corporate PowerPoint templates and PPT Slides are topically designed to provide an attractive backdrop to any subject. Presenters tell us our business model diagram examples 3d man presenting chart powerpoint theme Slides look good visually. People tell us our concept PowerPoint templates and PPT Slides will save the presenter time. Coach subordinates with our Business Model Diagram Examples 3d Man Presenting Chart PowerPoint Theme Slides. Download without worries with our money back guaranteee.
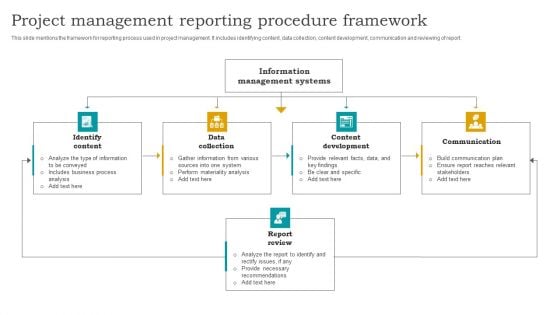
Project Management Reporting Procedure Framework Information PDF
This slide mentions the framework for reporting process used in project management. It includes identifying content, data collection, content development, communication and reviewing of report. Pitch your topic with ease and precision using this Project Management Reporting Procedure Framework Information PDF. This layout presents information on Data Collection, Content Development, Communication. It is also available for immediate download and adjustment. So, changes can be made in the color, design, graphics or any other component to create a unique layout.
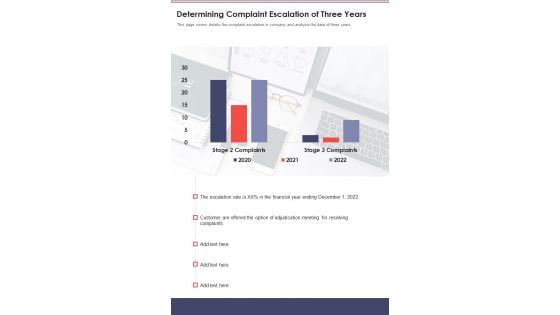
Determining Complaint Escalation Of Three Years Template 291 One Pager Documents
This page covers details the complaint escalation in company and analysis the data of three years. Presenting you an exemplary Determining Complaint Escalation Of Three Years Template 291 One Pager Documents. Our one-pager comprises all the must-have essentials of an inclusive document. You can edit it with ease, as its layout is completely editable. With such freedom, you can tweak its design and other elements to your requirements. Download this Determining Complaint Escalation Of Three Years Template 291 One Pager Documents brilliant piece now.
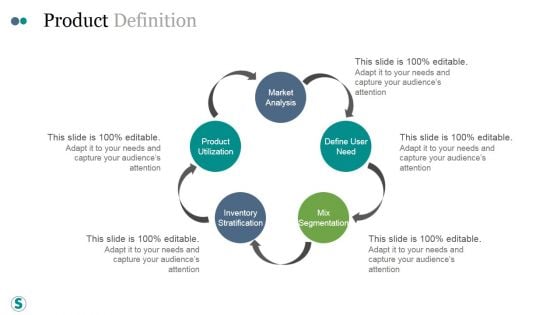
Product Definition Ppt PowerPoint Presentation Designs
This is a product definition ppt powerpoint presentation designs. This is a five stage process. The stages in this process are market analysis, define user need, mix segmentation, product utilization, inventory stratification.
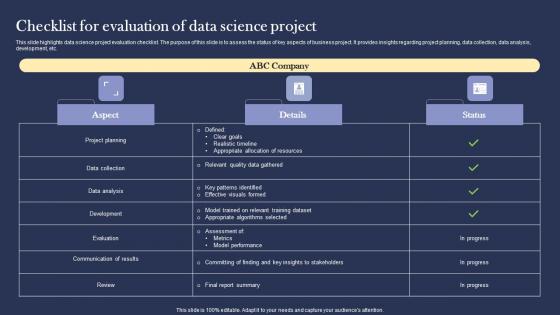
Checklist For Evaluation Of Data Science Project Ideas pdf
This slide highlights data science project evaluation checklist. The purpose of this slide is to assess the status of key aspects of business project. It provides insights regarding project planning, data collection, data analysis, development, etc. Pitch your topic with ease and precision using this Checklist For Evaluation Of Data Science Project Ideas pdf. This layout presents information on Data Collection, Data Analysis, Development. It is also available for immediate download and adjustment. So, changes can be made in the color, design, graphics or any other component to create a unique layout. This slide highlights data science project evaluation checklist. The purpose of this slide is to assess the status of key aspects of business project. It provides insights regarding project planning, data collection, data analysis, development, etc.
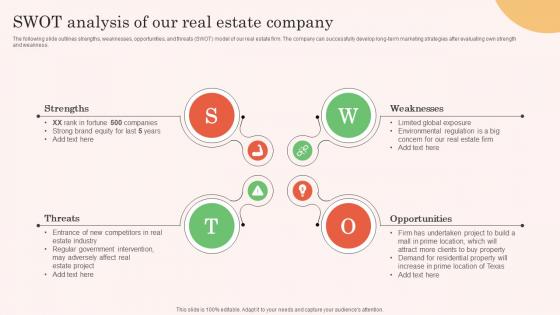
SWOT Analysis Of Our Real Estate Company Real Estate Property Marketing Designs Pdf
The following slide outlines strengths, weaknesses, opportunities, and threats SWOT model of our real estate firm. The company can successfully develop long-term marketing strategies after evaluating own strength and weakness.The SWOT Analysis Of Our Real Estate Company Real Estate Property Marketing Designs Pdf is a compilation of the most recent design trends as a series of slides. It is suitable for any subject or industry presentation, containing attractive visuals and photo spots for businesses to clearly express their messages. This template contains a variety of slides for the user to input data, such as structures to contrast two elements, bullet points, and slides for written information. Slidegeeks is prepared to create an impression. The following slide outlines strengths, weaknesses, opportunities, and threats SWOT model of our real estate firm. The company can successfully develop long-term marketing strategies after evaluating own strength and weakness.

Data Analytics System Model To Make Decisions Ppt PowerPoint Presentation Summary Graphics PDF
Showcasing this set of slides titled data analytics system model to make decisions ppt powerpoint presentation summary graphics pdf. The topics addressed in these templates are collect data, analyze make decisions, communicate. All the content presented in this PPT design is completely editable. Download it and make adjustments in color, background, font etc. as per your unique business setting.
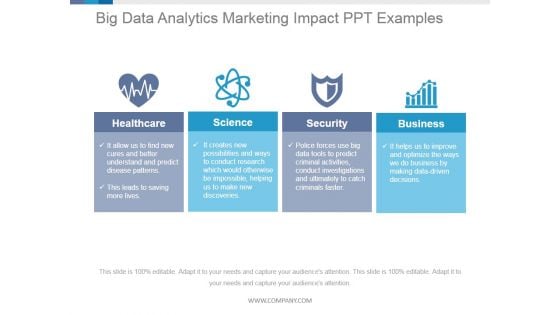
Big Data Analytics Marketing Impact Ppt PowerPoint Presentation Show
This is a big data analytics marketing impact ppt powerpoint presentation show. This is a four stage process. The stages in this process are healthcare, science, security, business.
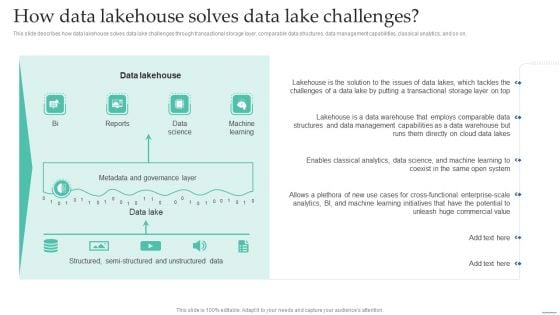
How Data Lakehouse Solves Data Lake Challenges Data Lake Creation With Hadoop Cluster Graphics PDF
This slide describes how data lakehouse solves data lake challenges through transactional storage layer, comparable data structures, data management capabilities, classical analytics, and so on.Do you have an important presentation coming up Are you looking for something that will make your presentation stand out from the rest Look no further than How Data Lakehouse Solves Data Lake Challenges Data Lake Creation With Hadoop Cluster Graphics PDF. With our professional designs, you can trust that your presentation will pop and make delivering it a smooth process. And with Slidegeeks, you can trust that your presentation will be unique and memorable. So why wait Grab How Data Lakehouse Solves Data Lake Challenges Data Lake Creation With Hadoop Cluster Graphics PDF today and make your presentation stand out from the rest.
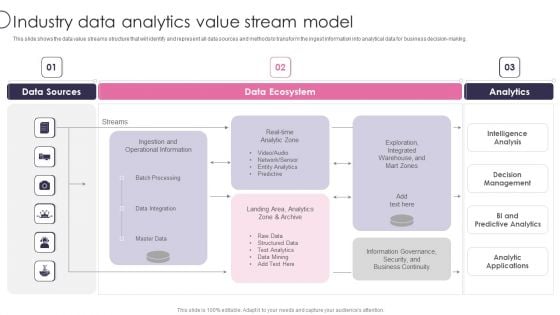
Information Transformation Process Toolkit Industry Data Analytics Value Stream Model Warehouse Template PDF
This slide shows the data value streams structure that will identify and represent all data sources and methods to transform the ingest information into analytical data for business decision making. Deliver an awe inspiring pitch with this creative Information Transformation Process Toolkit Industry Data Analytics Value Stream Model Warehouse Template PDF bundle. Topics like Data Sources, Data Ecosystem, Analytics can be discussed with this completely editable template. It is available for immediate download depending on the needs and requirements of the user.
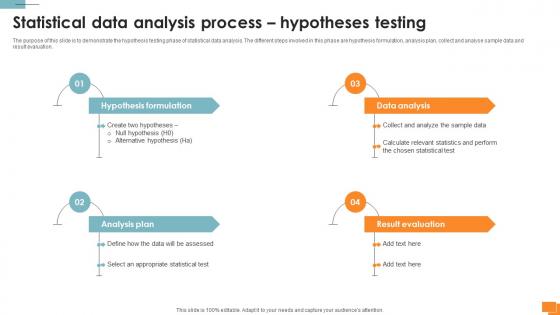
A134 Statistical Tools For Evidence Statistical Data Analysis Process Hypotheses Testing
The purpose of this slide is to demonstrate the hypothesis testing phase of statistical data analysis. The different steps involved in this phase are hypothesis formulation, analysis plan, collect and analyse sample data and result evaluation. Create an editable A134 Statistical Tools For Evidence Statistical Data Analysis Process Hypotheses Testing that communicates your idea and engages your audience. Whether you are presenting a business or an educational presentation, pre-designed presentation templates help save time. A134 Statistical Tools For Evidence Statistical Data Analysis Process Hypotheses Testing is highly customizable and very easy to edit, covering many different styles from creative to business presentations. Slidegeeks has creative team members who have crafted amazing templates. So, go and get them without any delay. The purpose of this slide is to demonstrate the hypothesis testing phase of statistical data analysis. The different steps involved in this phase are hypothesis formulation, analysis plan, collect and analyse sample data and result evaluation.
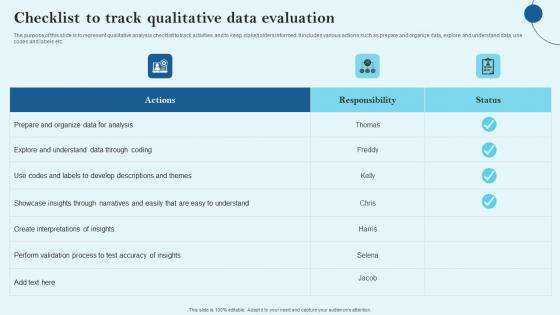
Checklist To Track Qualitative Data Evaluation Microsoft Pdf
The purpose of this slide is to represent qualitative analysis checklist to track activities and to keep stakeholders informed. It includes various actions such as prepare and organize data, explore and understand data, use codes and labels etc. Pitch your topic with ease and precision using this Checklist To Track Qualitative Data Evaluation Microsoft Pdf This layout presents information on Prepare And Organize, Data For Analysis, Responsibility It is also available for immediate download and adjustment. So, changes can be made in the color, design, graphics or any other component to create a unique layout. The purpose of this slide is to represent qualitative analysis checklist to track activities and to keep stakeholders informed. It includes various actions such as prepare and organize data, explore and understand data, use codes and labels etc.
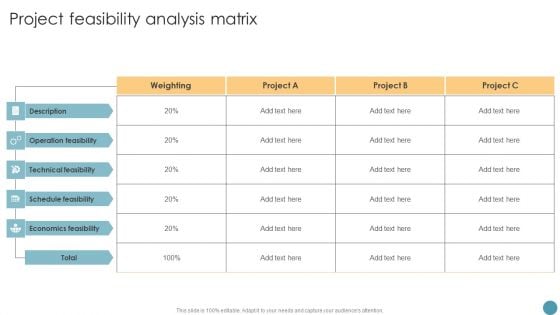
Project Feasibility Analysis Matrix Feasibility Analysis Report For Construction Project Designs PDF
The Project Feasibility Analysis Matrix Feasibility Analysis Report For Construction Project Designs PDF is a compilation of the most recent design trends as a series of slides. It is suitable for any subject or industry presentation, containing attractive visuals and photo spots for businesses to clearly express their messages. This template contains a variety of slides for the user to input data, such as structures to contrast two elements, bullet points, and slides for written information. Slidegeeks is prepared to create an impression.
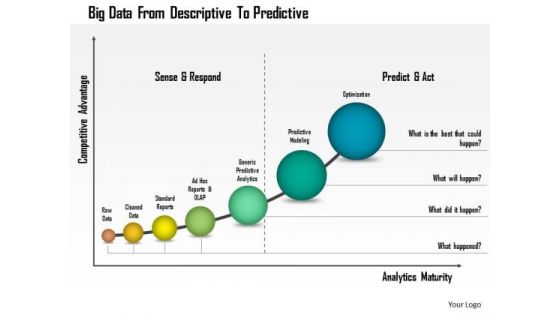
Business Diagram Big Data From Descriptive To Predictive Presentation Template
This business diagram has been designed with graphic of linear bar graph. This growing bar graph depicts the concept of big data analysis. Use this professional diagram for your financial and business analysis.
Evaluating Scores Ppt PowerPoint Presentation Icon Model
This is a evaluating scores ppt powerpoint presentation icon model. This is a eight stage process. The stages in this process are evaluator, strategic, product advantage, market attractiveness, leverage competencies.
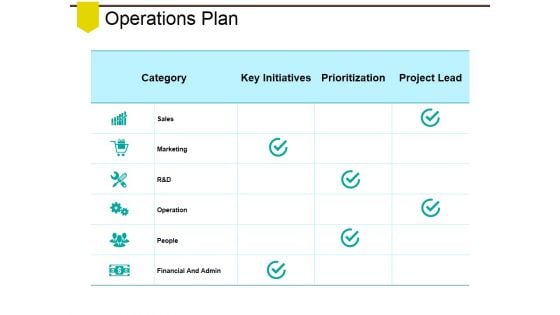
Operations Plan Ppt PowerPoint Presentation Model Samples
This is a operations plan ppt powerpoint presentation model samples. This is a three stage process. The stages in this process are sales, marketing, operation, people, financial and admin.
SAC Planning And Implementation Deployment Options For SAP Analytics Cloud Icons PDF
The purpose of this slide is to provide an information regarding the deployment methods for SAP Analytics Cloud implementation in the business organization. It also contains details of each deployment options key features. Presenting SAC Planning And Implementation Deployment Options For SAP Analytics Cloud Icons PDF to provide visual cues and insights. Share and navigate important information on two stages that need your due attention. This template can be used to pitch topics like Deployment Option Cloud, Most Suitable, Low implementation cost. In addtion, this PPT design contains high resolution images, graphics, etc, that are easily editable and available for immediate download.
Environmental Scanning Icon For Data Analysis Graphics PDF
Persuade your audience using this Environmental Scanning Icon For Data Analysis Graphics PDF. This PPT design covers four stages, thus making it a great tool to use. It also caters to a variety of topics including Environmental Scanning Icon For Data Analysis. Download this PPT design now to present a convincing pitch that not only emphasizes the topic but also showcases your presentation skills.
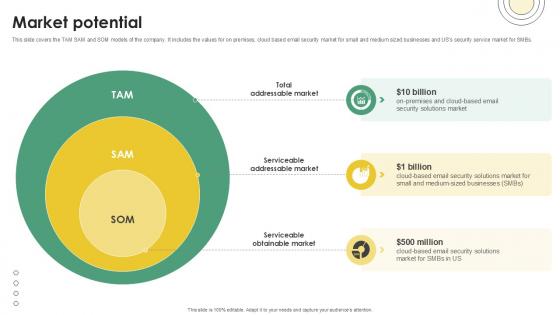
Market Potential Email And Data Protection Platform Capital Funding Pitch Deck PPT Presentation
This slide covers the TAM SAM and SOM models of the company. It includes the values for on premises, cloud based email security market for small and medium sized businesses and USs security service market for SMBs. Are you in need of a template that can accommodate all of your creative concepts This one is crafted professionally and can be altered to fit any style. Use it with Google Slides or PowerPoint. Include striking photographs, symbols, depictions, and other visuals. Fill, move around, or remove text boxes as desired. Test out color palettes and font mixtures. Edit and save your work, or work with colleagues. Download Market Potential Email And Data Protection Platform Capital Funding Pitch Deck PPT Presentation and observe how to make your presentation outstanding. Give an impeccable presentation to your group and make your presentation unforgettable. This slide covers the TAM SAM and SOM models of the company. It includes the values for on premises, cloud based email security market for small and medium sized businesses and USs security service market for SMBs.
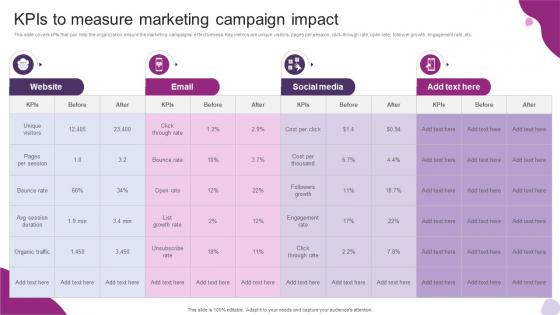
Kpis To Measure Marketing Campaign Impact Powerful Marketing Techniques Strategy SS V
This slide covers kPIs that can help the organization ensure the marketing campaigns effectiveness. Key metrics are unique visitors, pages per session, click-through rate, open rate, follower growth, engagement rate, etc. Do you know about Slidesgeeks Kpis To Measure Marketing Campaign Impact Powerful Marketing Techniques Strategy SS V These are perfect for delivering any kind od presentation. Using it, create PowerPoint presentations that communicate your ideas and engage audiences. Save time and effort by using our pre-designed presentation templates that are perfect for a wide range of topic. Our vast selection of designs covers a range of styles, from creative to business, and are all highly customizable and easy to edit. Download as a PowerPoint template or use them as Google Slides themes. This slide covers kPIs that can help the organization ensure the marketing campaigns effectiveness. Key metrics are unique visitors, pages per session, click-through rate, open rate, follower growth, engagement rate, etc.
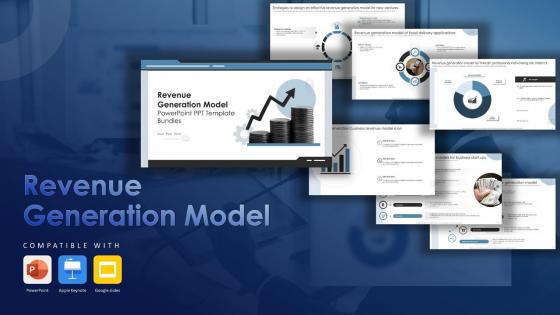
Revenue Generation Model Powerpoint Ppt Template Bundles
Using this ready-made PowerPoint slide, you can incorporate your own data to make an impact with your business innovation and clarity of goals. Use this brilliantly designed Revenue Generation Model Powerpoint Ppt Template Bundles to showcase how ultimately all business concepts are related. This presentation template can also be used to record resource allocation in a visual form. The B2B Revenue Model, Ecommerce Revenue Model, Start Up Revenue Models-Slide Revenue Generation Model Powerpoint Ppt Template Bundles is suitable for all your business needs, where you need to make sure that all bases are covered. Download this PPT template now to start a journey on your chosen business, with customer satisfaction the key aim. Our Revenue Generation Model PowerPoint PPT Template Bundles are creatively designed to enhance any presentation. Use them to deliver a professional and polished look.
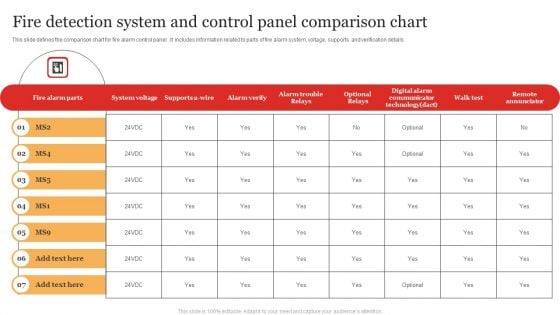
Fire Detection System And Control Panel Comparison Chart Information PDF
Pitch your topic with ease and precision using this Fire Detection System And Control Panel Comparison Chart Information PDF. This layout presents information on Digital Communicator, System Voltage, Remote Annunciator. It is also available for immediate download and adjustment. So, changes can be made in the color, design, graphics or any other component to create a unique layout.

Pharmaceutical Company Key Performance Indicators Clipart PDF
The slide shows the key Performance Indicator KPI s which will help the company to track the success rate of implemented strategies. Major KPIs include number of products sold, pharma products manufactures, research and development expenses per year, total number of patients, etc.Presenting pharmaceutical company key performance indicators clipart pdf to provide visual cues and insights. Share and navigate important information on one stage that need your due attention. This template can be used to pitch topics like research and development, key performance indicator, pharma products manufactured In addtion, this PPT design contains high resolution images, graphics, etc, that are easily editable and available for immediate download.
Overview And Key Trends In Insurance Industry Effective General Insurance Marketing Icons Pdf
This slide presents an overview of the market and key trends in the insurance industry. It includes trends such as digital information, data analytics And AI, personalization, customer experience, collaboration And partnerships, and environmental and social responsibility. Slidegeeks is here to make your presentations a breeze with Overview And Key Trends In Insurance Industry Effective General Insurance Marketing Icons Pdf With our easy-to-use and customizable templates, you can focus on delivering your ideas rather than worrying about formatting. With a variety of designs to choose from, you are sure to find one that suits your needs. And with animations and unique photos, illustrations, and fonts, you can make your presentation pop. So whether you are giving a sales pitch or presenting to the board, make sure to check out Slidegeeks first. This slide presents an overview of the market and key trends in the insurance industry. It includes trends such as digital information, data analytics And AI, personalization, customer experience, collaboration And partnerships, and environmental and social responsibility.
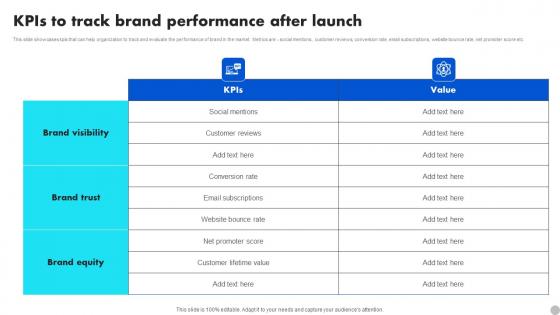
KPIS To Track Brand Performance After Launch Brand Diversification Approach Elements Pdf
This slide showcases kpis that can help organization to track and evaluate the performance of brand in the market. Metrics are social mentions, customer reviews, conversion rate, email subscriptions, website bounce rate, net promoter score etc. The KPIS To Track Brand Performance After Launch Brand Diversification Approach Elements Pdf is a compilation of the most recent design trends as a series of slides. It is suitable for any subject or industry presentation, containing attractive visuals and photo spots for businesses to clearly express their messages. This template contains a variety of slides for the user to input data, such as structures to contrast two elements, bullet points, and slides for written information. Slidegeeks is prepared to create an impression. This slide showcases kpis that can help organization to track and evaluate the performance of brand in the market. Metrics are social mentions, customer reviews, conversion rate, email subscriptions, website bounce rate, net promoter score etc.
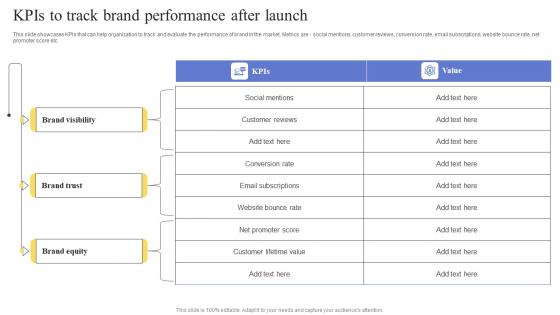
KPIS To Track Brand Performance After Launch Maximizing Revenue Using Demonstration Pdf
This slide showcases KPIs that can help organization to track and evaluate the performance of brand in the market. Metrics are - social mentions, customer reviews, conversion rate, email subscriptions, website bounce rate, net promoter score etc. The KPIS To Track Brand Performance After Launch Maximizing Revenue Using Demonstration Pdf is a compilation of the most recent design trends as a series of slides. It is suitable for any subject or industry presentation, containing attractive visuals and photo spots for businesses to clearly express their messages. This template contains a variety of slides for the user to input data, such as structures to contrast two elements, bullet points, and slides for written information. Slidegeeks is prepared to create an impression. This slide showcases KPIs that can help organization to track and evaluate the performance of brand in the market. Metrics are - social mentions, customer reviews, conversion rate, email subscriptions, website bounce rate, net promoter score etc.
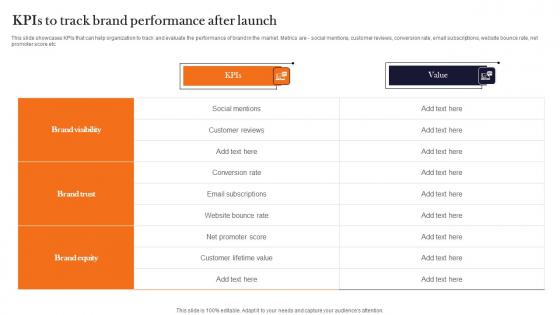
Kpis To Track Brand Performance After Launch Product Advertising And Positioning Pictures Pdf
This slide showcases KPIs that can help organization to track and evaluate the performance of brand in the market. Metrics are social mentions, customer reviews, conversion rate, email subscriptions, website bounce rate, net promoter score etc. The Kpis To Track Brand Performance After Launch Product Advertising And Positioning Pictures Pdf is a compilation of the most recent design trends as a series of slides. It is suitable for any subject or industry presentation, containing attractive visuals and photo spots for businesses to clearly express their messages. This template contains a variety of slides for the user to input data, such as structures to contrast two elements, bullet points, and slides for written information. Slidegeeks is prepared to create an impression. This slide showcases KPIs that can help organization to track and evaluate the performance of brand in the market. Metrics are social mentions, customer reviews, conversion rate, email subscriptions, website bounce rate, net promoter score etc.

Splunk Analysis Of Big Data To Assess Business Value Sample Pdf
Following slide showcases splunk big data analysis to evaluate business value. The purpose of this slide is to help businesses in forming better decisions by providing insights into their data. It includes components such as search, deploy, proactive monitoring, etc. Showcasing this set of slides titled Splunk Analysis Of Big Data To Assess Business Value Sample Pdf The topics addressed in these templates are Enterprise Scalability, Operational Intelligence All the content presented in this PPT design is completely editable. Download it and make adjustments in color, background, font etc. as per your unique business setting. Following slide showcases splunk big data analysis to evaluate business value. The purpose of this slide is to help businesses in forming better decisions by providing insights into their data. It includes components such as search, deploy, proactive monitoring, etc.
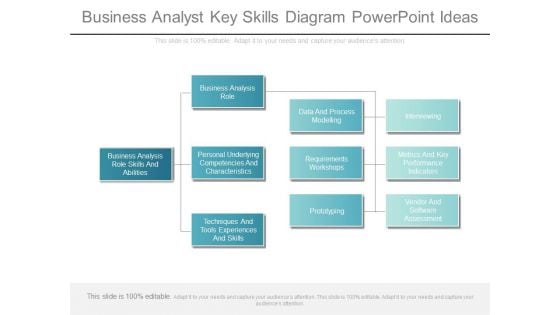
Business Analyst Key Skills Diagram Powerpoint Ideas
This is a business analyst key skills diagram powerpoint ideas. This is a four stage process. The stages in this process are business analysis role skills and abilities, business analysis role, personal underlying competencies and characteristics, techniques and tools experiences and skills, data and process modelling, requirements workshops, prototyping, interviewing, metrics and key performance indicators, vendor and software assessment.
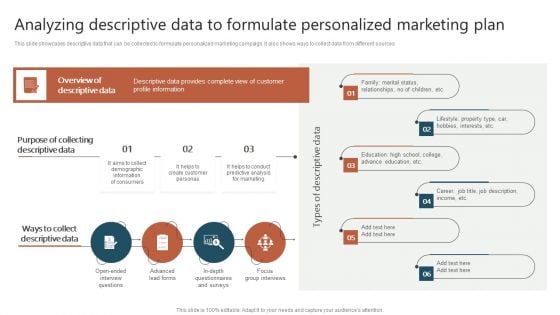
Analyzing Descriptive Data To Formulate Personalized Marketing Plan Ppt Layouts Graphics Design PDF
This slide showcases descriptive data that can be collected to formulate personalized marketing campaign. It also shows ways to collect data from different sources. Are you in need of a template that can accommodate all of your creative concepts This one is crafted professionally and can be altered to fit any style. Use it with Google Slides or PowerPoint. Include striking photographs, symbols, depictions, and other visuals. Fill, move around, or remove text boxes as desired. Test out color palettes and font mixtures. Edit and save your work, or work with colleagues. Download Analyzing Descriptive Data To Formulate Personalized Marketing Plan Ppt Layouts Graphics Design PDF and observe how to make your presentation outstanding. Give an impeccable presentation to your group and make your presentation unforgettable.
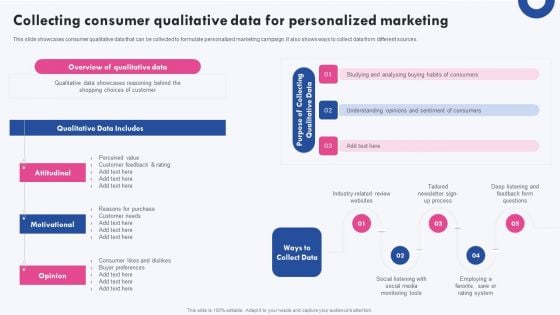
Targeted Marketing Campaigns To Improve Buyers Experience Collecting Consumer Qualitative Data Designs PDF
This slide showcases consumer qualitative data that can be collected to formulate personalized marketing campaign. It also shows ways to collect data from different sources. Are you in need of a template that can accommodate all of your creative concepts This one is crafted professionally and can be altered to fit any style. Use it with Google Slides or PowerPoint. Include striking photographs, symbols, depictions, and other visuals. Fill, move around, or remove text boxes as desired. Test out color palettes and font mixtures. Edit and save your work, or work with colleagues. Download Targeted Marketing Campaigns To Improve Buyers Experience Collecting Consumer Qualitative Data Designs PDF and observe how to make your presentation outstanding. Give an impeccable presentation to your group and make your presentation unforgettable.
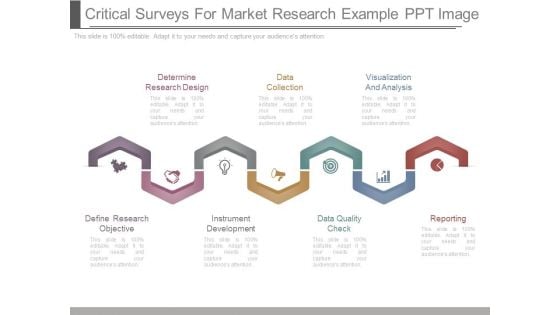
Critical Surveys For Market Research Example Ppt Image
This is a critical surveys for market research example ppt image. This is a seven stage process. The stages in this process are determine research design, data collection, visualization and analysis, define research objective, instrument development, data quality check, reporting.
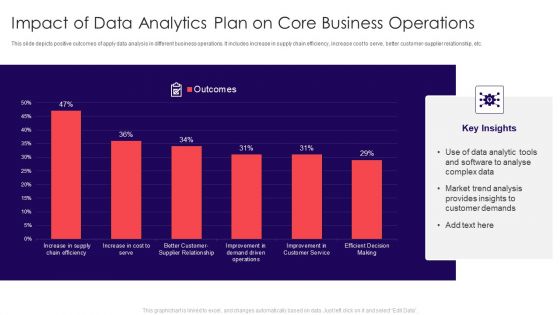
Impact Of Data Analytics Plan On Core Business Operations Summary PDF
This slide depicts positive outcomes of apply data analysis in different business operations. It includes increase in supply chain efficiency, increase cost to serve, better customer-supplier relationship, etc. Showcasing this set of slides titled Impact Of Data Analytics Plan On Core Business Operations Summary PDF. The topics addressed in these templates are Customer Demands, Market Trend Analysis, Complex Data. All the content presented in this PPT design is completely editable. Download it and make adjustments in color, background, font etc. as per your unique business setting.

Data Designing Ppt PowerPoint Presentation Complete Deck With Slides
This is a data designing ppt powerpoint presentation complete deck with slides. This is a one stage process. The stages in this process are business, management, planning, strategy, marketing.
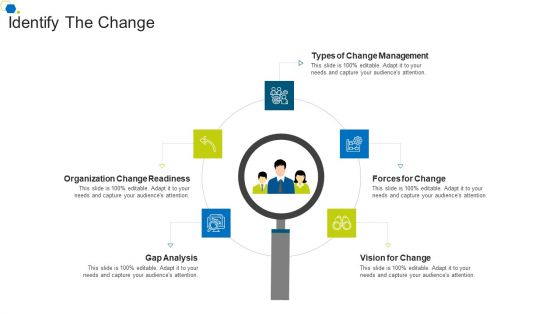
Identify The Change Corporate Transformation Strategic Outline Slides PDF
Presenting identify the change corporate transformation strategic outline slides pdf to provide visual cues and insights. Share and navigate important information on five stages that need your due attention. This template can be used to pitch topics like gap analysis, organization change readiness, types of change management, forces for change, vision for change. In addtion, this PPT design contains high resolution images, graphics, etc, that are easily editable and available for immediate download.
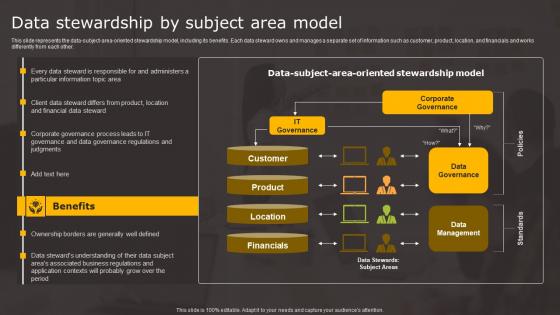
Data Stewardship By Subject Area Data Stewardship In Business Processes Information Pdf
This slide represents the data subject area oriented stewardship model, including its benefits. Each data steward owns and manages a separate set of information such as customer, product, location, and financials and works differently from each other. Crafting an eye catching presentation has never been more straightforward. Let your presentation shine with this tasteful yet straightforward Data Stewardship By Subject Area Data Stewardship In Business Processes Information Pdf template. It offers a minimalistic and classy look that is great for making a statement. The colors have been employed intelligently to add a bit of playfulness while still remaining professional. Construct the ideal Data Stewardship By Subject Area Data Stewardship In Business Processes Information Pdf that effortlessly grabs the attention of your audience Begin now and be certain to wow your customers This slide represents the data subject area oriented stewardship model, including its benefits. Each data steward owns and manages a separate set of information such as customer, product, location, and financials and works differently from each other.
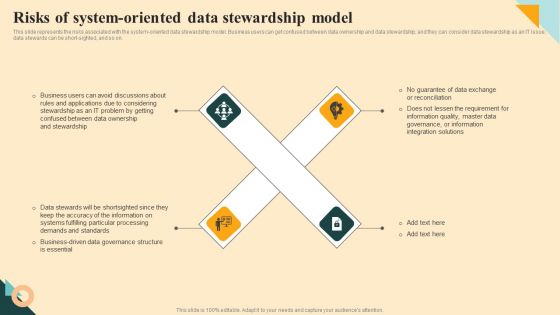
Risks Of System Oriented Data Stewardship Model Professional PDF
This slide represents the risks associated with the system-oriented data stewardship model. Business users can get confused between data ownership and data stewardship, and they can consider data stewardship as an IT issue, data stewards can be short-sighted, and so on. Explore a selection of the finest Risks Of System Oriented Data Stewardship Model Professional PDF here. With a plethora of professionally designed and pre made slide templates, you can quickly and easily find the right one for your upcoming presentation. You can use our Risks Of System Oriented Data Stewardship Model Professional PDF to effectively convey your message to a wider audience. Slidegeeks has done a lot of research before preparing these presentation templates. The content can be personalized and the slides are highly editable. Grab templates today from Slidegeeks.
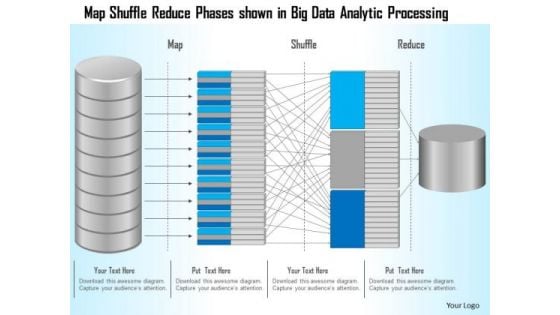
Business Diagram Map Shuffle Reduce Phases Shown In Big Data Analytic Processing Ppt Slide
This technology slide has been designed with graphic of map and data text. This diagram helps to depict concept of data analysis and processing. Use this diagram slide for computer technology related presentations.
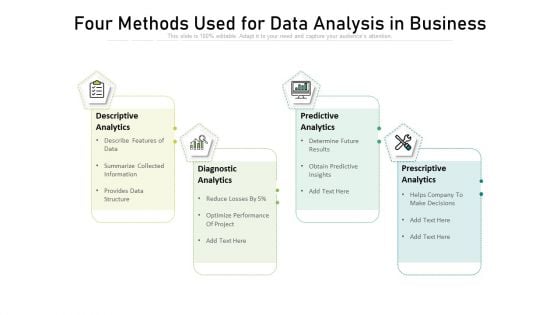
Four Methods Used For Data Analysis In Business Portrait PDF
Persuade your audience using this four methods used for data analysis in business portrait pdf.This PPT design covers four stages, thus making it a great tool to use. It also caters to a variety of topics including descriptive analytics, diagnostic analytics, predictive analytics, prescriptive analytics. Download this PPT design now to present a convincing pitch that not only emphasizes the topic but also showcases your presentation skills.
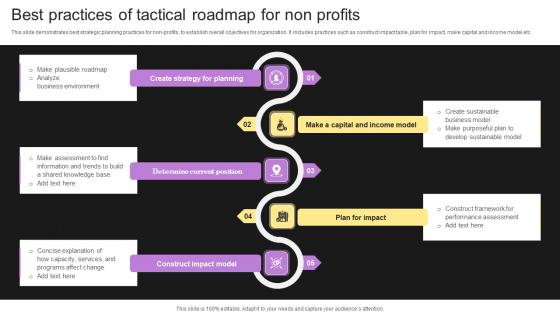
Best Practices Of Tactical Roadmap For Non Profits Infographics Pdf
This slide demonstrates best strategic planning practices for non profits, to establish overall objectives for organization. It includes practices such as construct impact table, plan for impact, make capital and income model etc.Showcasing this set of slides titled Best Practices Of Tactical Roadmap For Non Profits Infographics Pdf The topics addressed in these templates are Determine Current Position, Construct Impact Model, Performance Assessment All the content presented in this PPT design is completely editable. Download it and make adjustments in color, background, font etc. as per your unique business setting. This slide demonstrates best strategic planning practices for non profits, to establish overall objectives for organization. It includes practices such as construct impact table, plan for impact, make capital and income model etc.
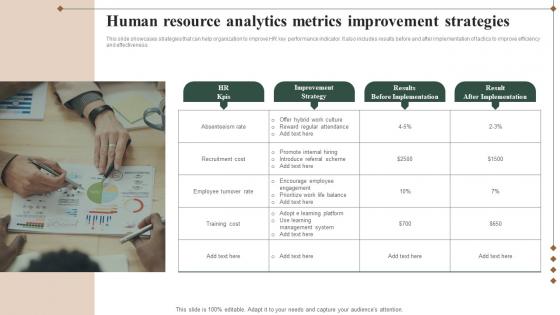
Human Resource Analytics Metrics Improvement Strategies Professional Pdf
This slide showcases strategies that can help organization to improve HR key performance indicator. It also includes results before and after implementation of tactics to improve efficiency and effectiveness.Showcasing this set of slides titled Human Resource Analytics Metrics Improvement Strategies Professional Pdf The topics addressed in these templates are Absenteeism Rate, Employee Turnover, Training Cost All the content presented in this PPT design is completely editable. Download it and make adjustments in color, background, font etc. as per your unique business setting. This slide showcases strategies that can help organization to improve HR key performance indicator. It also includes results before and after implementation of tactics to improve efficiency and effectiveness.
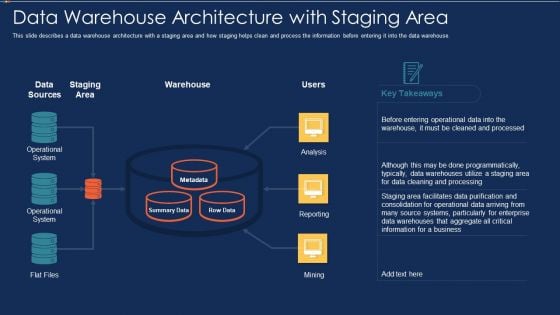
Data Warehousing IT Data Warehouse Architecture With Staging Area Ppt Styles Objects PDF
This slide describes a data warehouse architecture with a staging area and how staging helps clean and process the information before entering it into the data warehouse. Presenting data warehousing it data warehouse architecture with staging area ppt styles objects pdf to provide visual cues and insights. Share and navigate important information on three stages that need your due attention. This template can be used to pitch topics like operational system, analysis, reporting, mining, flat files. In addtion, this PPT design contains high resolution images, graphics, etc, that are easily editable and available for immediate download.
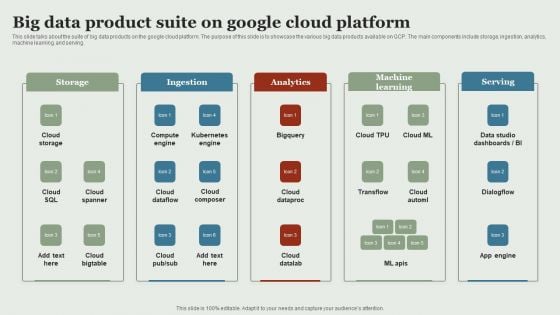
Google Cloud Service Models Big Data Product Suite On Google Cloud Platform Rules PDF
This slide talks about the suite of big data products on the google cloud platform. The purpose of this slide is to showcase the various big data products available on GCP. The main components include storage, ingestion, analytics, machine learning, and serving. Are you in need of a template that can accommodate all of your creative concepts This one is crafted professionally and can be altered to fit any style. Use it with Google Slides or PowerPoint. Include striking photographs, symbols, depictions, and other visuals. Fill, move around, or remove text boxes as desired. Test out color palettes and font mixtures. Edit and save your work, or work with colleagues. Download Google Cloud Service Models Big Data Product Suite On Google Cloud Platform Rules PDF and observe how to make your presentation outstanding. Give an impeccable presentation to your group and make your presentation unforgettable.
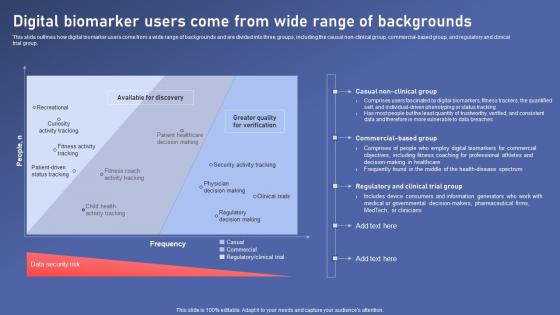
Digital Biomarker Users Wide Biomedical Data Science And Health Informatics Designs Pdf
This slide outlines how digital biomarker users come from a wide range of backgrounds and are divided into three groups, including the causal non clinical group, commercial based group, and regulatory and clinical trial group. Formulating a presentation can take up a lot of effort and time, so the content and message should always be the primary focus. The visuals of the PowerPoint can enhance the presenters message, so our Digital Biomarker Users Wide Biomedical Data Science And Health Informatics Designs Pdf was created to help save time. Instead of worrying about the design, the presenter can concentrate on the message while our designers work on creating the ideal templates for whatever situation is needed. Slidegeeks has experts for everything from amazing designs to valuable content, we have put everything into Digital Biomarker Users Wide Biomedical Data Science And Health Informatics Designs Pdf This slide outlines how digital biomarker users come from a wide range of backgrounds and are divided into three groups, including the causal non clinical group, commercial based group, and regulatory and clinical trial group.

Big Data Analytics Ppt PowerPoint Presentation Complete With Slides
Induce strategic thinking by presenting this complete deck. Enthrall your audience by deploying this thought provoking PPT deck. It can be downloaded in both standard and widescreen aspect ratios, thus making it a complete package to use and deploy. Convey your thoughts and actions using the sixty five slides presented in this complete deck. Additionally, feel free to alter its components like color, graphics, design, etc, to create a great first impression. Grab it now by clicking on the download button below.
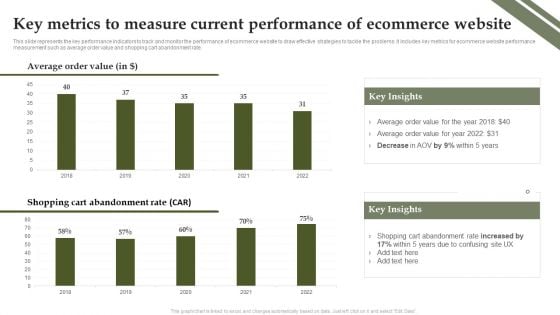
Analyzing And Deploying Effective CMS Key Metrics To Measure Current Performance Of Ecommerce Website Infographics PDF
This slide represents the key performance indicators to track and monitor the performance of ecommerce website to draw effective strategies to tackle the problems. It includes key metrics for ecommerce website performance measurement such as average order value and shopping cart abandonment rate. Do you know about Slidesgeeks Analyzing And Deploying Effective CMS Key Metrics To Measure Current Performance Of Ecommerce Website Infographics PDF These are perfect for delivering any kind od presentation. Using it, create PowerPoint presentations that communicate your ideas and engage audiences. Save time and effort by using our pre designed presentation templates that are perfect for a wide range of topic. Our vast selection of designs covers a range of styles, from creative to business, and are all highly customizable and easy to edit. Download as a PowerPoint template or use them as Google Slides themes.
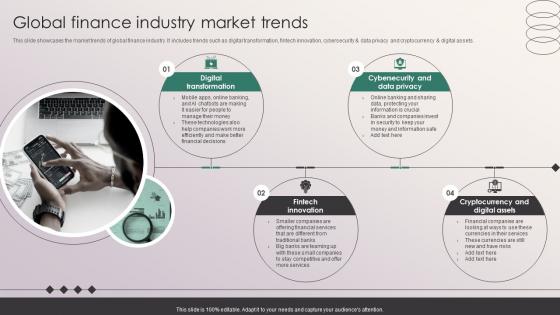
Global Finance Industry Market Trends Penetrating Markets With Financial Strategy SS V
This slide showcases the market trends of global finance industry. It includes trends such as digital transformation, fintech innovation, cybersecurity and data privacy and cryptocurrency and digital assets. If your project calls for a presentation, then Slidegeeks is your go to partner because we have professionally designed, easy to edit templates that are perfect for any presentation. After downloading, you can easily edit Global Finance Industry Market Trends Penetrating Markets With Financial Strategy SS V and make the changes accordingly. You can rearrange slides or fill them with different images. Check out all the handy templates This slide showcases the market trends of global finance industry. It includes trends such as digital transformation, fintech innovation, cybersecurity and data privacy and cryptocurrency and digital assets.


 Continue with Email

 Home
Home


