Portfolio Dashboard
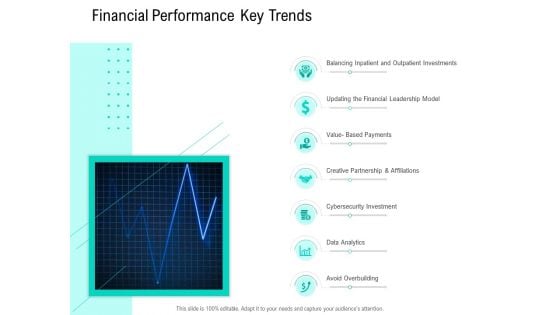
Nursing Administration Financial Performance Key Trends Ppt Infographics Themes PDF
Deliver an awe inspiring pitch with this creative nursing administration financial performance key trends ppt infographics themes pdf bundle. Topics like data analytics, avoid overbuilding, cybersecurity investment, value based payments, updating the financial leadership model can be discussed with this completely editable template. It is available for immediate download depending on the needs and requirements of the user.
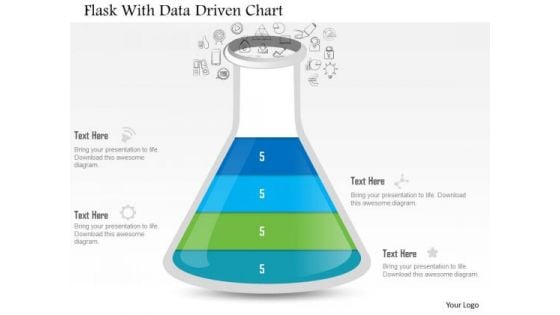
Business Diagram Flask With Data Driven Chart PowerPoint Slide
This data driven diagram has been designed with flask graphics. Download this diagram to give your presentations more effective look. It helps in clearly conveying your message to clients and audience.
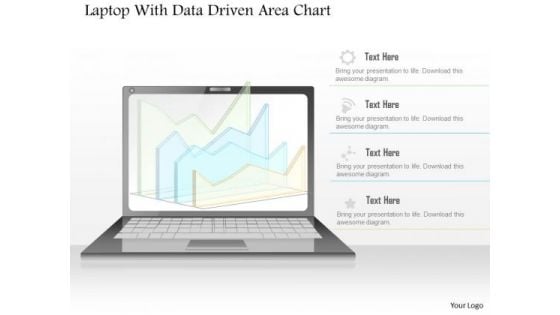
Business Diagram Laptop With Data Driven Area Chart PowerPoint Slide
This diagram has been designed with laptop and data driven area chart. Download this diagram to give your presentations more effective look. It helps in clearly conveying your message to clients and audience.
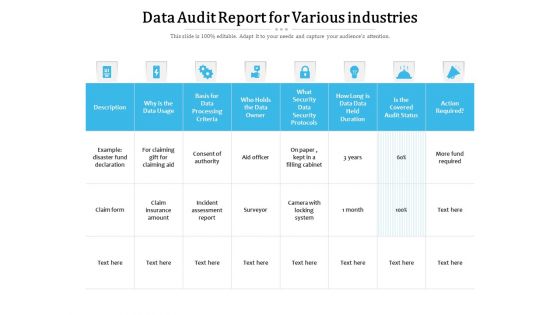
Data Audit Report For Various Industries Ppt PowerPoint Presentation Show Background Designs PDF
Showcasing this set of slides titled data audit report for various industries ppt powerpoint presentation show background designs pdf. The topics addressed in these templates are example disaster fund declaration, claim form, example disaster fund declaration, claim insurance amount, incident assessment report. All the content presented in this PPT design is completely editable. Download it and make adjustments in color, background, font etc. as per your unique business setting.
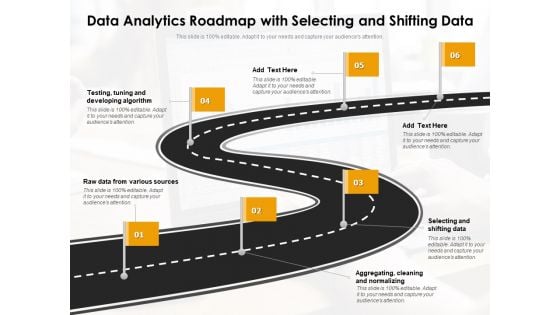
Data Analytics Roadmap With Selecting And Shifting Data Ppt PowerPoint Presentation File Designs PDF
Persuade your audience using this data analytics roadmap with selecting and shifting data ppt powerpoint presentation file designs pdf. This PPT design covers six stages, thus making it a great tool to use. It also caters to a variety of topics including developing, sources, data. Download this PPT design now to present a convincing pitch that not only emphasizes the topic but also showcases your presentation skills.
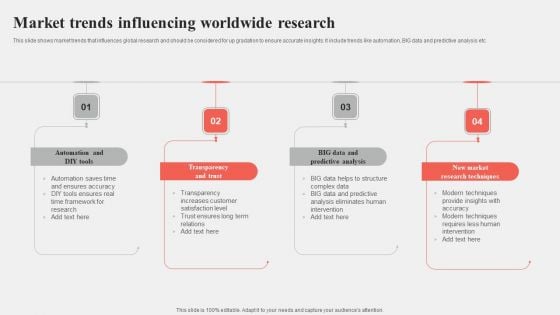
Market Trends Influencing Worldwide Research Themes PDF
This slide shows market trends that influences global research and should be considered for up gradation to ensure accurate insights. It include trends like automation, BIG data and predictive analysis etc Persuade your audience using this Market Trends Influencing Worldwide Research Themes PDF. This PPT design covers four stages, thus making it a great tool to use. It also caters to a variety of topics including Transparency, Predictive Analysis, Research Techniques. Download this PPT design now to present a convincing pitch that not only emphasizes the topic but also showcases your presentation skills.
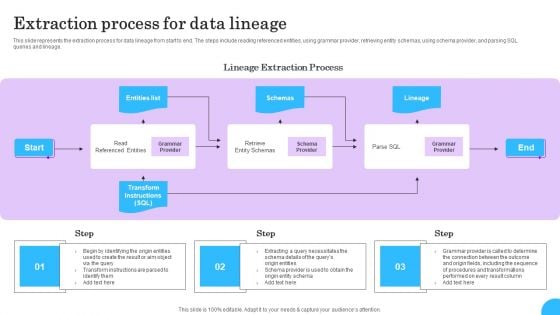
Comprehensive Analysis Of Different Data Lineage Classification Extraction Process For Data Lineage Designs PDF
This slide represents the extraction process for data lineage from start to end. The steps include reading referenced entities, using grammar provider, retrieving entity schemas, using schema provider, and parsing SQL queries and lineage. Explore a selection of the finest Comprehensive Analysis Of Different Data Lineage Classification Extraction Process For Data Lineage Designs PDF here. With a plethora of professionally designed and pre-made slide templates, you can quickly and easily find the right one for your upcoming presentation. You can use our Comprehensive Analysis Of Different Data Lineage Classification Extraction Process For Data Lineage Designs PDF to effectively convey your message to a wider audience. Slidegeeks has done a lot of research before preparing these presentation templates. The content can be personalized and the slides are highly editable. Grab templates today from Slidegeeks.
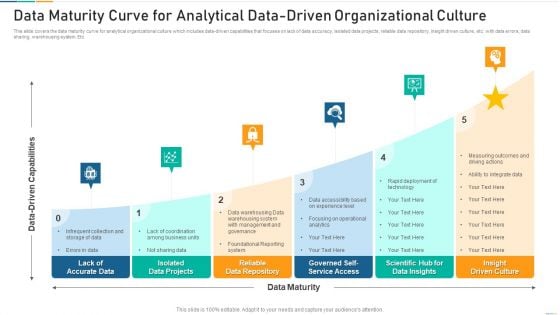
Data Maturity Curve For Analytical Data Driven Organizational Culture Inspiration PDF
Persuade your audience using this data maturity curve for analytical data driven organizational culture inspiration pdf. This PPT design covers five stages, thus making it a great tool to use. It also caters to a variety of topics including service, system, warehousing. Download this PPT design now to present a convincing pitch that not only emphasizes the topic but also showcases your presentation skills.
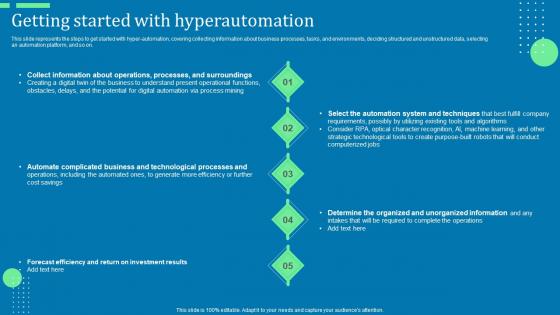
Getting Started With Hyperautomation Ppt Model Deck Pdf
This slide represents the steps to get started with hyper-automation, covering collecting information about business processes, tasks, and environments, deciding structured and unstructured data, selecting an automation platform, and so on. Coming up with a presentation necessitates that the majority of the effort goes into the content and the message you intend to convey. The visuals of a PowerPoint presentation can only be effective if it supplements and supports the story that is being told. Keeping this in mind our experts created Getting Started With Hyperautomation Ppt Model Deck Pdf to reduce the time that goes into designing the presentation. This way, you can concentrate on the message while our designers take care of providing you with the right template for the situation. This slide represents the steps to get started with hyper-automation, covering collecting information about business processes, tasks, and environments, deciding structured and unstructured data, selecting an automation platform, and so on.
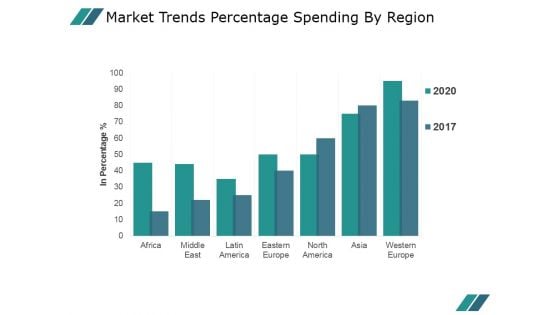
Market Trends Percentage Spending By Region Ppt PowerPoint Presentation Picture
This is a market trends percentage spending by region ppt powerpoint presentation picture. This is a seven stage process. The stages in this process are business, marketing, growth, planning, management.

Business Intelligence And Big Key Features Of Predictive Data Analytics Software Microsoft PDF
This slide represents the characteristics of predictive data analytics software. It includes features like predictive modeling, predictive scoring and data mining functions that help companies to get better insights. This is a business intelligence and big key features of predictive data analytics software microsoft pdf template with various stages. Focus and dispense information on five stages using this creative set, that comes with editable features. It contains large content boxes to add your information on topics like analysis network and links, data mining functions, predictive modeling, predictive scoring, automate analytics. You can also showcase facts, figures, and other relevant content using this PPT layout. Grab it now.
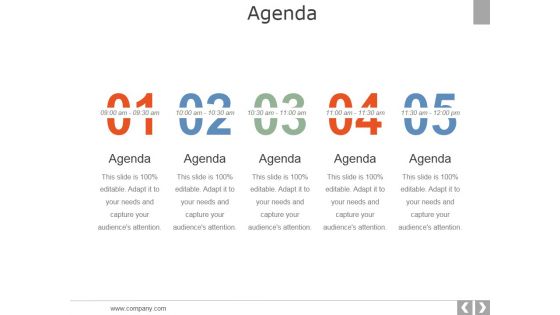
Agenda Ppt PowerPoint Presentation Model Graphics
This is a agenda ppt powerpoint presentation model graphics. This is a five stage process. The stages in this process are business, strategy, marketing, analysis, agenda.
Critical Notes Ppt PowerPoint Presentation Model Template
This is a critical notes ppt powerpoint presentation model template. This is a three stage process. The stages in this process are business, strategy, marketing, analysis, post it.
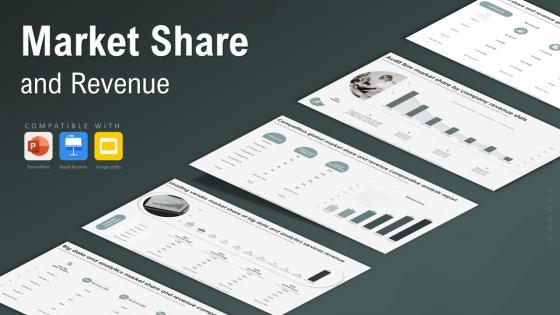
Market Share And Revenue Powerpoint Ppt
This Market Share And Revenue Powerpoint Ppt is designed to help you retain your audiences attention. This content-ready PowerPoint Template enables you to take your audience on a journey and share information in a way that is easier to recall. It helps you highlight the crucial parts of your work so that the audience does not get saddled with information download. This Market Share And Revenue From Sales, Big Data Market Share, Competitors Market Share, Unit Market And Revenue Share-slide PPT Deck comes prepared with the graphs and charts you could need to showcase your information through visuals. You only need to enter your own data in them. Download this editable PowerPoint Theme and walk into that meeting with confidence. The Market Share and Revenue PowerPoint PPT is a dynamic presentation template designed to analyze and showcase a companys market performance. It features visually appealing slides covering market share trends, revenue growth comparisons, and competitive analysis. This template includes charts, graphs, and infographics to clearly communicate key metrics and business insights. Ideal for business analysts, marketing professionals, and executives, it enables users to highlight strategic achievements, performance benchmarks, and growth opportunities effectively.
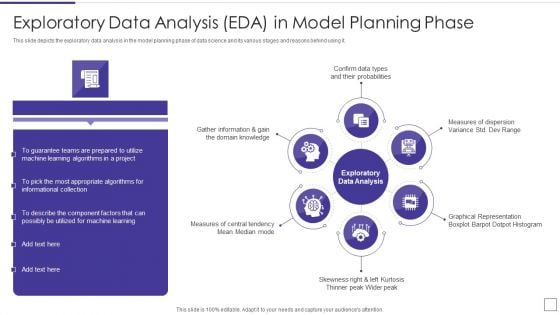
Data Mining Implementation Exploratory Data Analysis EDA In Model Planning Phase Infographics PDF
This slide depicts the exploratory data analysis in the model planning phase of data science and its various stages and reasons behind using it.This is a data mining implementation exploratory data analysis eda in model planning phase infographics pdf template with various stages. Focus and dispense information on six stages using this creative set, that comes with editable features. It contains large content boxes to add your information on topics like confirm data types and their probabilities, domain knowledge, measures of central tendency You can also showcase facts, figures, and other relevant content using this PPT layout. Grab it now.
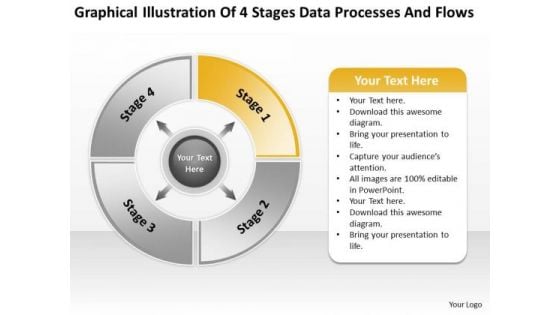
Illustration Of 4 Stages Data Processes And Flows Ppt Linear Rate PowerPoint Slides
We present our illustration of 4 stages data processes and flows ppt linear rate PowerPoint Slides.Present our Circle charts PowerPoint Templates because Our PowerPoint Templates and Slides are Clear and concise. Use them and dispel any doubts your team may have. Use our Process and Flows PowerPoint Templates because Our PowerPoint Templates and Slides will bullet point your ideas. See them fall into place one by one. Use our Business PowerPoint Templates because You should Throw the gauntlet with our PowerPoint Templates and Slides. They are created to take up any challenge. Use our Marketing PowerPoint Templates because It is Aesthetically crafted by artistic young minds. Our PowerPoint Templates and Slides are designed to display your dexterity. Use our Shapes PowerPoint Templates because Our PowerPoint Templates and Slides have the Brilliant backdrops. Guaranteed to illuminate the minds of your audience.Use these PowerPoint slides for presentations relating to Diagram , flow, process, chart, sequence, review, refresh, duplicate, concept, arrow, success, rotation, presentation, course, iterate, relate, circle, ring, recycle, report, work flow, simple, react, repeat, four, cycle, circulation, stage, connection, circular, system, strategy, round, section, direction, swirl, phase, method, procedure, correlate, cyclic, continuity, repetition. The prominent colors used in the PowerPoint template are Orange, Gray, Black. They consider you their father figure. Deliver on their expectations with our Illustration Of 4 Stages Data Processes And Flows Ppt Linear Rate PowerPoint Slides.
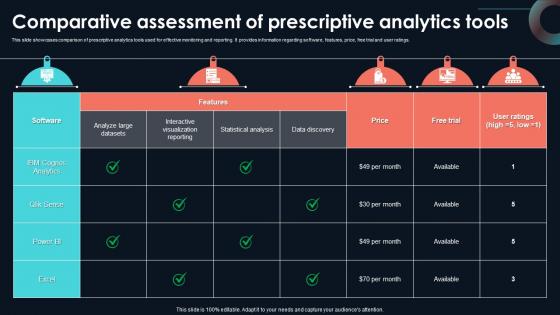
Comparative Assessment Of Prescriptive Developing Strategic Insights Using Big Data Analytics SS V
This slide showcases comparison of prescriptive analytics tools used for effective monitoring and reporting. It provides information regarding software, features, price, free trial and user ratings. Welcome to our selection of the Comparative Assessment Of Prescriptive Developing Strategic Insights Using Big Data Analytics SS V. These are designed to help you showcase your creativity and bring your sphere to life. Planning and Innovation are essential for any business that is just starting out. This collection contains the designs that you need for your everyday presentations. All of our PowerPoints are 100Percent editable, so you can customize them to suit your needs. This multi-purpose template can be used in various situations. Grab these presentation templates today. This slide showcases comparison of prescriptive analytics tools used for effective monitoring and reporting. It provides information regarding software, features, price, free trial and user ratings.

Large Language Models Llms Deployed By ChatGPT How Generative AI Tools Work AI SS V
This slide provides information regarding execution of large language model which ChatGPT deploys. Such models are trained on huge amounts of textual data that revert in natural language text as response. Get a simple yet stunning designed Large Language Models Llms Deployed By ChatGPT How Generative AI Tools Work AI SS V. It is the best one to establish the tone in your meetings. It is an excellent way to make your presentations highly effective. So, download this PPT today from Slidegeeks and see the positive impacts. Our easy-to-edit Large Language Models Llms Deployed By ChatGPT How Generative AI Tools Work AI SS V can be your go-to option for all upcoming conferences and meetings. So, what are you waiting for Grab this template today. This slide provides information regarding execution of large language model which ChatGPT deploys. Such models are trained on huge amounts of textual data that revert in natural language text as response.

Yellow Folder And Arrow Download Data PowerPoint Templates Ppt Backgrounds For Slides 0113
We present our Yellow Folder And Arrow Download Data PowerPoint Templates PPT Backgrounds For Slides 0113.Present our Computer PowerPoint Templates because Our PowerPoint Templates and Slides will give good value for money. They also have respect for the value of your time. Use our Signs PowerPoint Templates because You can Channelise the thoughts of your team with our PowerPoint Templates and Slides. Urge them to focus on the goals you have set. Use our Arrows PowerPoint Templates because Our PowerPoint Templates and Slides will help you be quick off the draw. Just enter your specific text and see your points hit home. Present our Business PowerPoint Templates because Our PowerPoint Templates and Slides will provide weight to your words. They will bring out the depth of your thought process. Download our Shapes PowerPoint Templates because It is Aesthetically crafted by artistic young minds. Our PowerPoint Templates and Slides are designed to display your dexterity.Use these PowerPoint slides for presentations relating to upload download folder icon, computer, arrows, business, shapes, signs. The prominent colors used in the PowerPoint template are Blue, Yellow, Green. PowerPoint presentation experts tell us our Yellow Folder And Arrow Download Data PowerPoint Templates PPT Backgrounds For Slides 0113 will get their audience's attention. Use our shapes PowerPoint templates and PPT Slides help you meet deadlines which are an element of today's workplace. Just browse and pick the slides that appeal to your intuitive senses. People tell us our Yellow Folder And Arrow Download Data PowerPoint Templates PPT Backgrounds For Slides 0113 provide you with a vast range of viable options. Select the appropriate ones and just fill in your text. The feedback we get is that our arrows PowerPoint templates and PPT Slides have awesome images to get your point across. Professionals tell us our Yellow Folder And Arrow Download Data PowerPoint Templates PPT Backgrounds For Slides 0113 will help them to explain complicated concepts. Presenters tell us our signs PowerPoint templates and PPT Slides are specially created by a professional team with vast experience. They diligently strive to come up with the right vehicle for your brilliant Ideas. Put in our Yellow Folder And Arrow Download Data PowerPoint Templates Ppt Backgrounds For Slides 0113 as the catalyst. Churn out new equations with your ideas.

Big Data Architect Workflow Of Big Data Management Guidelines PDF
This slide defines the workflow of big data, including data sources, data management, modeling, result analysis, visualization, and user interaction.Deliver an awe inspiring pitch with this creative Big Data Architect Workflow Of Big Data Management Guidelines PDF bundle. Topics like Data Management, Preprocessing, Model Estimation can be discussed with this completely editable template. It is available for immediate download depending on the needs and requirements of the user.
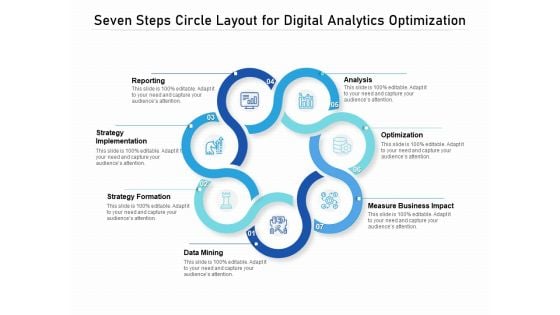
Seven Steps Circle Layout For Digital Analytics Optimization Ppt PowerPoint Presentation Model Structure PDF
Persuade your audience using this seven steps circle layout for digital analytics optimization ppt powerpoint presentation model structure pdf. This PPT design covers seven stages, thus making it a great tool to use. It also caters to a variety of topics including reporting, strategy implementation, strategy formation, data mining, measure business impact, optimization, analysis. Download this PPT design now to present a convincing pitch that not only emphasizes the topic but also showcases your presentation skills.
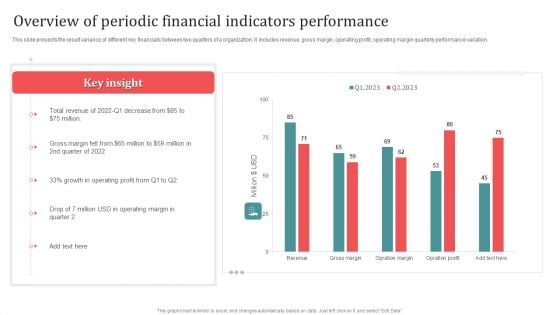
Overview Of Periodic Financial Indicators Performance Designs PDF
This slide presents the result variance of different key financials between two quarters of a organization. It includes revenue, gross margin, operating profit, operating margin quarterly performance variation. Showcasing this set of slides titled Overview Of Periodic Financial Indicators Performance Designs PDF. The topics addressed in these templates are Overview Of Periodic, Financial Indicators Performance. All the content presented in this PPT design is completely editable. Download it and make adjustments in color, background, font etc. as per your unique business setting.
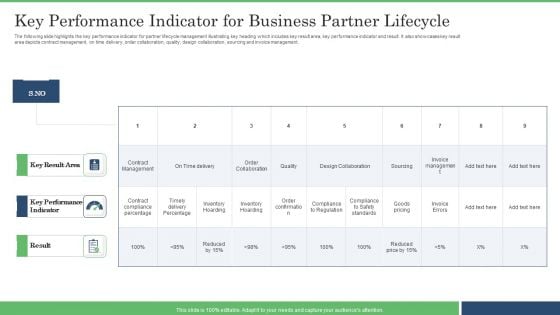
Key Performance Indicator For Business Partner Lifecycle Brochure PDF
The following slide highlights the key performance indicator for partner lifecycle management illustrating key heading which includes key result area, key performance indicator and result. It also showcases key result area depicts contract management, on time delivery, order collaboration, quality, design collaboration, sourcing and invoice management. Showcasing this set of slides titled Key Performance Indicator For Business Partner Lifecycle Brochure PDF. The topics addressed in these templates are Key Performance Indicator, Inventory Hoarding, Design Collaboration. All the content presented in this PPT design is completely editable. Download it and make adjustments in color, background, font etc. as per your unique business setting.
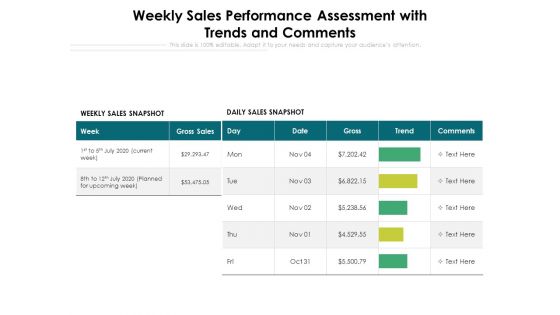
Weekly Sales Performance Assessment With Trends And Comments Ppt PowerPoint Presentation Model Maker PDF
Presenting this set of slides with name weekly sales performance assessment with trends and comments ppt powerpoint presentation model maker pdf. The topics discussed in these slides are weekly sales snapshot, daily sales snapshot, trend, gross, gross sales. This is a completely editable PowerPoint presentation and is available for immediate download. Download now and impress your audience.
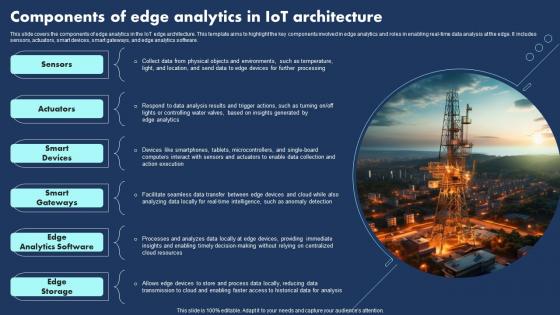
Components Of Edge Analytics In Iot Architecture Professional Pdf
This slide covers the components of edge analytics in the IoT edge architecture. This template aims to highlight the key components involved in edge analytics and roles in enabling real time data analysis at the edge. It includes sensors, actuators, smart devices, smart gateways, and edge analytics software.Pitch your topic with ease and precision using this Components Of Edge Analytics In Iot Architecture Professional Pdf This layout presents information on Smart Gateways, Smart Devices, Analytics Software It is also available for immediate download and adjustment. So, changes can be made in the color, design, graphics or any other component to create a unique layout. This slide covers the components of edge analytics in the IoT edge architecture. This template aims to highlight the key components involved in edge analytics and roles in enabling real time data analysis at the edge. It includes sensors, actuators, smart devices, smart gateways, and edge analytics software.

Hospital Management Healthcare Management Data Analytics Architecture Ppt Model Tips PDF
This is a hospital management healthcare management data analytics architecture ppt model tips pdf template with various stages. Focus and dispense information on two stages using this creative set, that comes with editable features. It contains large content boxes to add your information on topics like line of business, external sources, management, performance improvement, financial management. You can also showcase facts, figures, and other relevant content using this PPT layout. Grab it now.
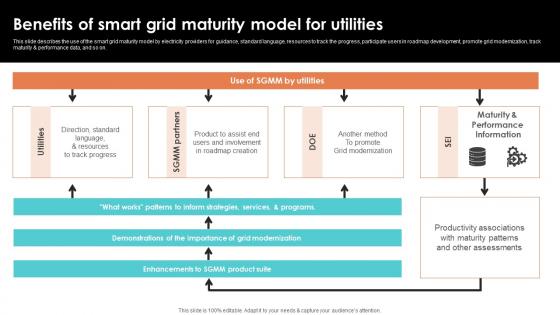
Benefits Of Smart Grid Maturity Model For Utilities Smart Grid Working
This slide describes the use of the smart grid maturity model by electricity providers for guidance, standard language, resources to track the progress, participate users in roadmap development, promote grid modernization, track maturity and performance data, and so on. Create an editable Benefits Of Smart Grid Maturity Model For Utilities Smart Grid Working that communicates your idea and engages your audience. Whether you are presenting a business or an educational presentation, pre designed presentation templates help save time. Benefits Of Smart Grid Maturity Model For Utilities Smart Grid Working is highly customizable and very easy to edit, covering many different styles from creative to business presentations. Slidegeeks has creative team members who have crafted amazing templates. So, go and get them without any delay. This slide describes the use of the smart grid maturity model by electricity providers for guidance, standard language, resources to track the progress, participate users in roadmap development, promote grid modernization, track maturity and performance data, and so on.
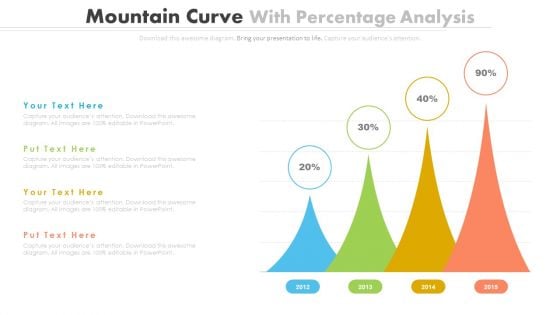
Percentage Data Growth Chart Powerpoint Slides
This PowerPoint template has been designed with percentage data growth chart. Download this PPT chart to depict financial ratio analysis. This PowerPoint slide is of great help in the business sector to make realistic presentations and provides effective way of presenting your newer thoughts.
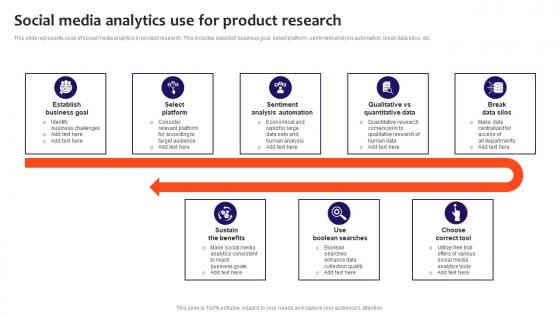
Social Media Analytics Use For Product Research Clipart Pdf
This slide represents uses of social media analytics in product research. This includes establish business goal, select platform, sentiment analysis automation, break data silos, etc. Showcasing this set of slides titled Social Media Analytics Use For Product Research Clipart Pdf. The topics addressed in these templates are Establish Business Goal, Sentiment Analysis Automation, Sustain The Benefits. All the content presented in this PPT design is completely editable. Download it and make adjustments in color, background, font etc. as per your unique business setting. This slide represents uses of social media analytics in product research. This includes establish business goal, select platform, sentiment analysis automation, break data silos, etc.
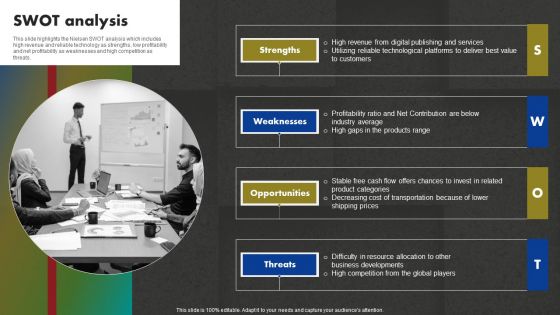
Data And Customer Analysis Company Outline SWOT Analysis Mockup PDF

Key Resources Security Service Provider Business Model BMC SS V
This slide covers the importance assets to operate business. It includes data centers, intellectual property, financial and human resources. Slidegeeks is here to make your presentations a breeze with Key Resources Security Service Provider Business Model BMC SS V With our easy-to-use and customizable templates, you can focus on delivering your ideas rather than worrying about formatting. With a variety of designs to choose from, you are sure to find one that suits your needs. And with animations and unique photos, illustrations, and fonts, you can make your presentation pop. So whether you are giving a sales pitch or presenting to the board, make sure to check out Slidegeeks first This slide covers the importance assets to operate business. It includes data centers, intellectual property, financial and human resources.
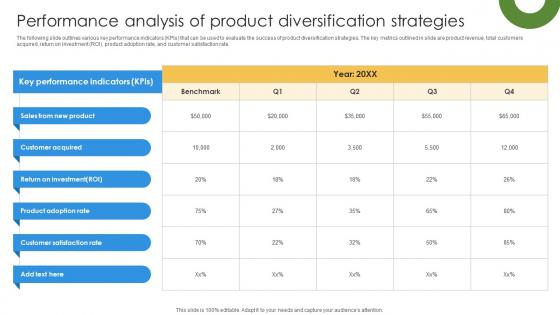
Marketing Growth Strategy To Strengthen Performance Analysis Of Product Strategy SS V
The following slide outlines various key performance indicators KPIs that can be used to evaluate the success of product diversification strategies. The key metrics outlined in slide are product revenue, total customers acquired, return on investment ROI, product adoption rate, and customer satisfaction rate. If you are looking for a format to display your unique thoughts, then the professionally designed Marketing Growth Strategy To Strengthen Performance Analysis Of Product Strategy SS V is the one for you. You can use it as a Google Slides template or a PowerPoint template. Incorporate impressive visuals, symbols, images, and other charts. Modify or reorganize the text boxes as you desire. Experiment with shade schemes and font pairings. Alter, share or cooperate with other people on your work. Download Marketing Growth Strategy To Strengthen Performance Analysis Of Product Strategy SS V and find out how to give a successful presentation. Present a perfect display to your team and make your presentation unforgettable. The following slide outlines various key performance indicators KPIs that can be used to evaluate the success of product diversification strategies. The key metrics outlined in slide are product revenue, total customers acquired, return on investment ROI, product adoption rate, and customer satisfaction rate.
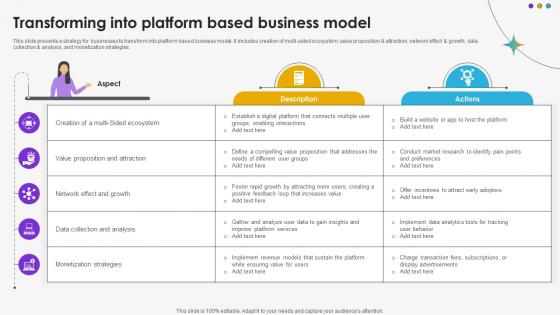
Transforming Into Platform Based Business Model DT SS V
This slide presents a strategy for businesses to transform into platform based business model. It includes creation of multi-sided ecosystem, value proposition and attraction, network effect and growth, data collection and analysis, and monetization strategies.Whether you have daily or monthly meetings, a brilliant presentation is necessary. Transforming Into Platform Based Business Model DT SS V can be your best option for delivering a presentation. Represent everything in detail using Transforming Into Platform Based Business Model DT SS V and make yourself stand out in meetings. The template is versatile and follows a structure that will cater to your requirements. All the templates prepared by Slidegeeks are easy to download and edit. Our research experts have taken care of the corporate themes as well. So, give it a try and see the results. This slide presents a strategy for businesses to transform into platform based business model. It includes creation of multi-sided ecosystem, value proposition and attraction, network effect and growth, data collection and analysis, and monetization strategies.

Current Vs Future State For Data Evaluation Procedure Information PDF
This slide illustrates difference between current state and future state process of data evaluation and research. It includes market analysis, market execution and data etc.Pitch your topic with ease and precision using this Current Vs Future State For Data Evaluation Procedure Information PDF. This layout presents information on Customer Relationship, Customer Responses, Based Web Experience. It is also available for immediate download and adjustment. So, changes can be made in the color, design, graphics or any other component to create a unique layout.
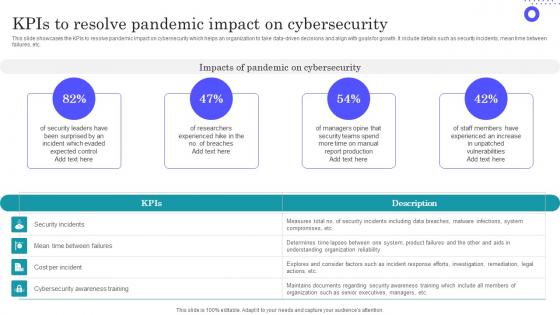
KPIs To Resolve Pandemic Impact On Cybersecurity Microsoft Pdf
Pitch your topic with ease and precision using this KPIs To Resolve Pandemic Impact On Cybersecurity Microsoft Pdf This layout presents information on Understanding Organization, Security Incidents, Malware Infections It is also available for immediate download and adjustment. So, changes can be made in the color, design, graphics or any other component to create a unique layout. This slide showcases the KPIs to resolve pandemic impact on cybersecurity which helps an organization to take data driven decisions and align with goals for growth. It include details such as security incidents, mean time between failures, etc.
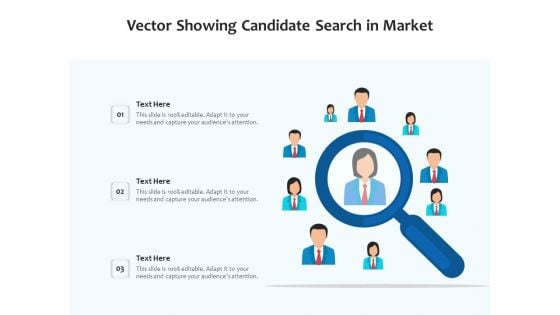
Vector Showing Candidate Search In Market Ppt PowerPoint Presentation File Picture PDF
Persuade your audience using this vector showing candidate search in market ppt powerpoint presentation file picture pdf. This PPT design covers three stages, thus making it a great tool to use. It also caters to a variety of topics including vector showing candidate search in market. Download this PPT design now to present a convincing pitch that not only emphasizes the topic but also showcases your presentation skills.
Business Diagram 3d Capsule With Multiple Icons For Business Data Flow PowerPoint Slide
This diagram has been designed with 3d graphic of capsule with multiple icons. This data driven PowerPoint slide can be used to give your presentations more effective look. It helps in clearly conveying your message to clients and audience.
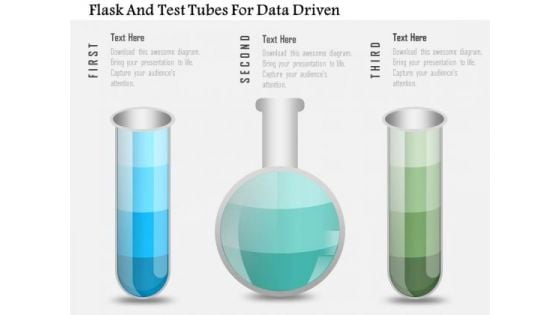
Business Diagram Flask And Test Tubes For Data Driven PowerPoint Slide
This data driven diagram has been designed with flask and test tubes. Download this diagram to give your presentations more effective look. It helps in clearly conveying your message to clients and audience.

Business Diagram Three Heads With Pie For Data Driven Technology PowerPoint Slide
This business diagram displays three human faces with pie charts. This Power Point template has been designed to compare and present business data. You may use this diagram to impart professional appearance to your presentations.
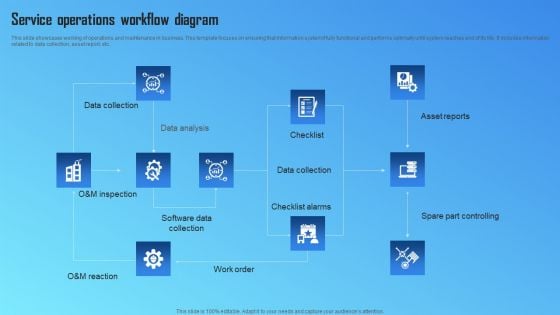
Service Operations Workflow Diagram Designs PDF
This slide showcases working of operations and maintenance in business. This template focuses on ensuring that information system if fully functional and performs optimally until system reaches end of its life. It includes information related to data collection, asset report, etc. Showcasing this set of slides titled Service Operations Workflow Diagram Designs PDF. The topics addressed in these templates are Data Collection, Data Analysis, Software Data Collection. All the content presented in this PPT design is completely editable. Download it and make adjustments in color, background, font etc. as per your unique business setting.
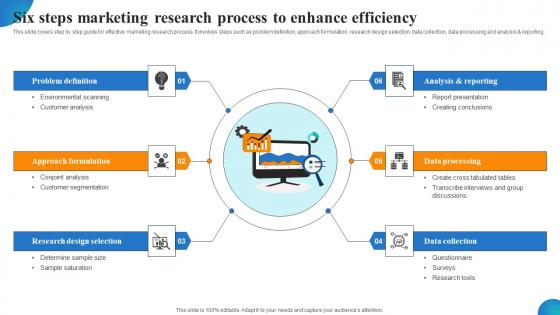
Six Steps Marketing Research Process To Enhance Efficiency MDSS For Enhanced Elements Pdf
This slide covers step by step guide for effective marketing research process. It involves steps such as problem definition, approach formulation, research design selection, data collection, data processing and analysis and reporting. This Six Steps Marketing Research Process To Enhance Efficiency MDSS For Enhanced Elements Pdf from Slidegeeks makes it easy to present information on your topic with precision. It provides customization options, so you can make changes to the colors, design, graphics, or any other component to create a unique layout. It is also available for immediate download, so you can begin using it right away. Slidegeeks has done good research to ensure that you have everything you need to make your presentation stand out. Make a name out there for a brilliant performance. This slide covers step by step guide for effective marketing research process. It involves steps such as problem definition, approach formulation, research design selection, data collection, data processing and analysis and reporting.
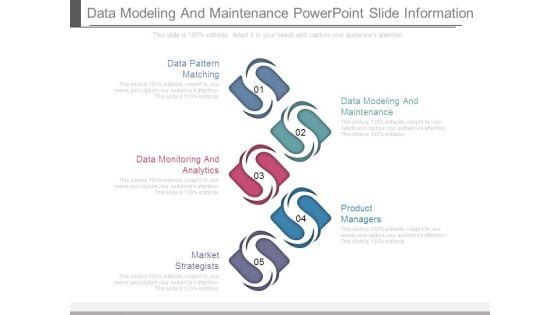
Data Modeling And Maintenance Powerpoint Slide Information
This is a data modeling and maintenance powerpoint slide information. This is a five stage process. The stages in this process are data pattern matching, data modeling and maintenance, data monitoring and analytics, product managers, market strategists.
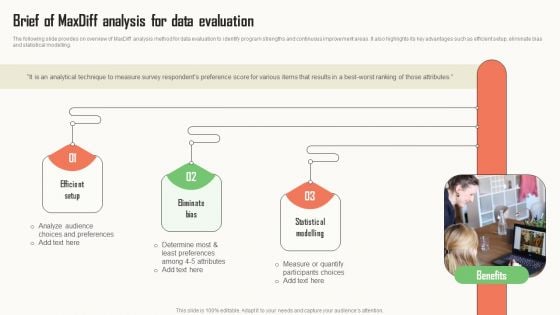
Strategic Market Insight Implementation Guide Brief Of Maxdiff Analysis For Data Evaluation Themes PDF
The following slide provides on overview of MaxDiff analysis method for data evaluation to identify program strengths and continuous improvement areas. It also highlights its key advantages such as efficient setup, eliminate bias and statistical modelling. Do you have to make sure that everyone on your team knows about any specific topic I yes, then you should give Strategic Market Insight Implementation Guide Brief Of Maxdiff Analysis For Data Evaluation Themes PDF a try. Our experts have put a lot of knowledge and effort into creating this impeccable Strategic Market Insight Implementation Guide Brief Of Maxdiff Analysis For Data Evaluation Themes PDF. You can use this template for your upcoming presentations, as the slides are perfect to represent even the tiniest detail. You can download these templates from the Slidegeeks website and these are easy to edit. So grab these today.
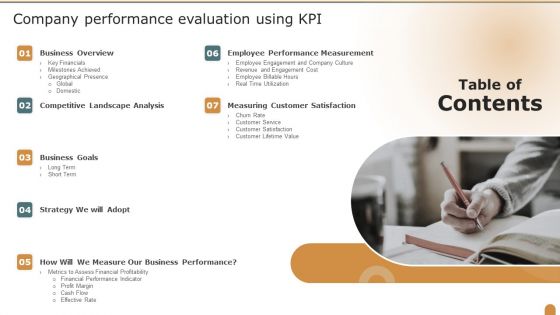
Table Of Contents Company Performance Evaluation Using KPI Infographics PDF
Presenting Table Of Contents Company Performance Evaluation Using KPI Infographics PDF to provide visual cues and insights. Share and navigate important information on seven stages that need your due attention. This template can be used to pitch topics like Business Overview, Business Goals, Competitive Landscape Analysis. In addtion, this PPT design contains high resolution images, graphics, etc, that are easily editable and available for immediate download.
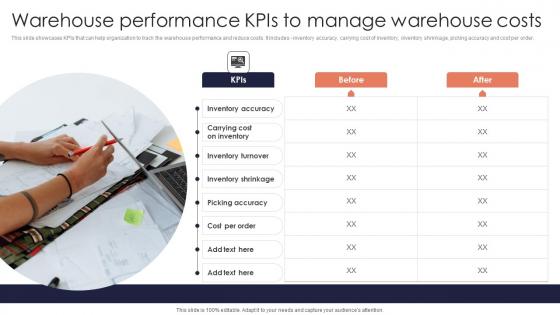
Warehouse Performance KPIs Minimizing Inventory Wastage Through Warehouse Slides Pdf
This slide showcases KPIs that can help organization to track the warehouse performance and reduce costs. It includes inventory accuracy, carrying cost of inventory, inventory shrinkage, picking accuracy and cost per order. Retrieve professionally designed Warehouse Performance KPIs Minimizing Inventory Wastage Through Warehouse Slides Pdf to effectively convey your message and captivate your listeners. Save time by selecting pre made slideshows that are appropriate for various topics, from business to educational purposes. These themes come in many different styles, from creative to corporate, and all of them are easily adjustable and can be edited quickly. Access them as PowerPoint templates or as Google Slides themes. You do not have to go on a hunt for the perfect presentation because Slidegeeks got you covered from everywhere. This slide showcases KPIs that can help organization to track the warehouse performance and reduce costs. It includes inventory accuracy, carrying cost of inventory, inventory shrinkage, picking accuracy and cost per order.
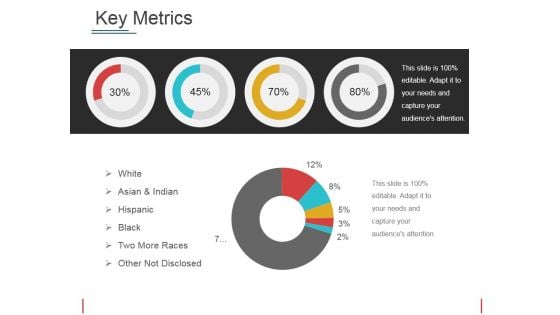
Key Metrics Ppt PowerPoint Presentation Model Professional
This is a key metrics ppt powerpoint presentation model professional. This is a four stage process. The stages in this process are white, asian and indian, hispanic, black, two more races, other not disclosed.
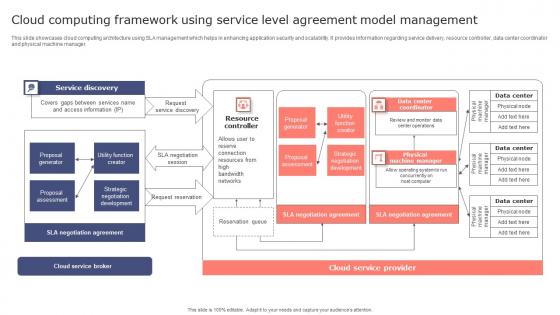
Cloud Computing Framework Using Service Level Agreement Model Management Topics Pdf
This slide showcases cloud computing architecture using SLA management which helps in enhancing application security and scalability. It provides information regarding service delivery, resource controller, data center coordinator and physical machine manager. Showcasing this set of slides titled Cloud Computing Framework Using Service Level Agreement Model Management Topics Pdf. The topics addressed in these templates are Service Discovery, Resource Controller. All the content presented in this PPT design is completely editable. Download it and make adjustments in color, background, font etc. as per your unique business setting. This slide showcases cloud computing architecture using SLA management which helps in enhancing application security and scalability. It provides information regarding service delivery, resource controller, data center coordinator and physical machine manager.
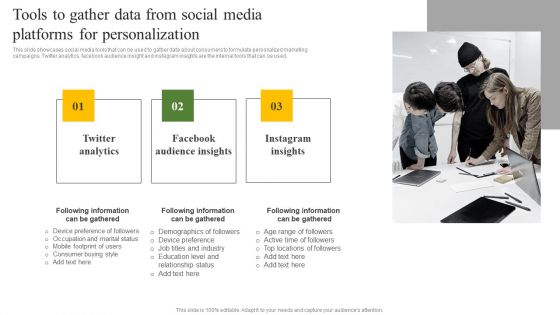
Tools To Gather Data From Social Media Platforms For Personalization Ppt Summary Microsoft PDF
This slide showcases social media tools that can be used to gather data about consumers to formulate personalized marketing campaigns. Twitter analytics, facebook audience insight and instagram insights are the internal tools that can be used. If you are looking for a format to display your unique thoughts, then the professionally designed Tools To Gather Data From Social Media Platforms For Personalization Ppt Summary Microsoft PDF is the one for you. You can use it as a Google Slides template or a PowerPoint template. Incorporate impressive visuals, symbols, images, and other charts. Modify or reorganize the text boxes as you desire. Experiment with shade schemes and font pairings. Alter, share or cooperate with other people on your work. Download Tools To Gather Data From Social Media Platforms For Personalization Ppt Summary Microsoft PDF and find out how to give a successful presentation. Present a perfect display to your team and make your presentation unforgettable.
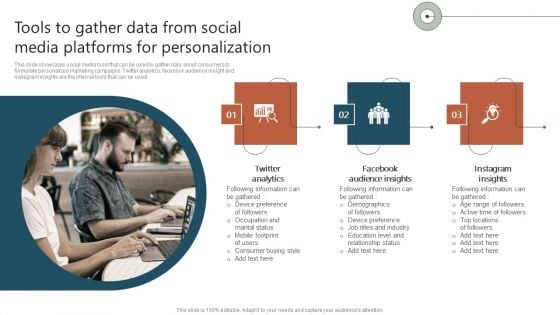
Tools To Gather Data From Social Media Platforms For Personalization Ppt Infographic Template Information PDF
This slide showcases social media tools that can be used to gather data about consumers to formulate personalized marketing campaigns. Twitter analytics, facebook audience insight and instagram insights are the internal tools that can be used. If you are looking for a format to display your unique thoughts, then the professionally designed Tools To Gather Data From Social Media Platforms For Personalization Ppt Infographic Template Information PDF is the one for you. You can use it as a Google Slides template or a PowerPoint template. Incorporate impressive visuals, symbols, images, and other charts. Modify or reorganize the text boxes as you desire. Experiment with shade schemes and font pairings. Alter, share or cooperate with other people on your work. Download Tools To Gather Data From Social Media Platforms For Personalization Ppt Infographic Template Information PDF and find out how to give a successful presentation. Present a perfect display to your team and make your presentation unforgettable.
Tools To Gather Data From Social Media Platforms For Personalization Icons PDF
This slide showcases social media tools that can be used to gather data about consumers to formulate personalized marketing campaigns. Twitter analytics, facebook audience insight and instagram insights are the internal tools that can be used. Take your projects to the next level with our ultimate collection of Tools To Gather Data From Social Media Platforms For Personalization Icons PDF. Slidegeeks has designed a range of layouts that are perfect for representing task or activity duration, keeping track of all your deadlines at a glance. Tailor these designs to your exact needs and give them a truly corporate look with your own brand colors they will make your projects stand out from the rest
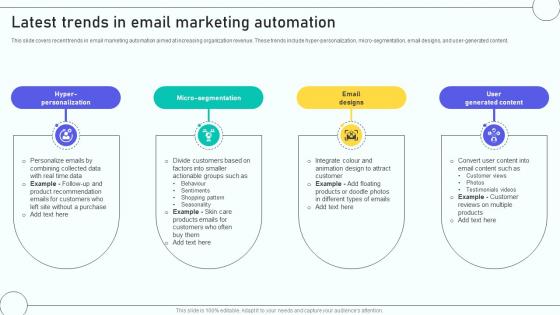
Email Marketing Automation Process Latest Trends In Email Marketing Automation
This slide covers recent trends in email marketing automation aimed at increasing organization revenue. These trends include hyper-personalization, micro-segmentation, email designs, and user-generated content. Explore a selection of the finest Email Marketing Automation Process Latest Trends In Email Marketing Automation here. With a plethora of professionally designed and pre-made slide templates, you can quickly and easily find the right one for your upcoming presentation. You can use our Email Marketing Automation Process Latest Trends In Email Marketing Automation to effectively convey your message to a wider audience. Slidegeeks has done a lot of research before preparing these presentation templates. The content can be personalized and the slides are highly editable. Grab templates today from Slidegeeks. This slide covers recent trends in email marketing automation aimed at increasing organization revenue. These trends include hyper-personalization, micro-segmentation, email designs, and user-generated content.
3d Two Stages Of Process Analysis Flow Charting PowerPoint Slides
We present our 3d two stages of process analysis flow charting PowerPoint Slides.Download our Business PowerPoint Templates because like the famed William Tell, they put aside all emotions and concentrate on the target. Use our Competition PowerPoint Templates because it has inspired a whole new world of medical endeavour. Present our Marketing PowerPoint Templates because networking is an imperative in todays world. You need to access the views of others. Similarly you need to give access to them of your abilities. Present our Design PowerPoint Templates because Our Template designs are State of the Art. Download our Metaphor PowerPoint Templates because you can asked to strive to give true form to your great dream.Use these PowerPoint slides for presentations relating to analysis, analyze, background, business, chart, competition, conceptual, corporation, create, data, decision, design, direction, economic, enterprise, future, graph, idea, illustration, information, innovate, layout, management, marketing, paper, plan, process, product, project, science, social, . The prominent colors used in the PowerPoint template are Blue, Gray, Black. Professionals tell us our 3d two stages of process analysis flow charting PowerPoint Slides are designed by professionals The feedback we get is that our create PowerPoint templates and PPT Slides are Elegant. We assure you our 3d two stages of process analysis flow charting PowerPoint Slides are Dazzling. Customers tell us our corporation PowerPoint templates and PPT Slides provide you with a vast range of viable options. Select the appropriate ones and just fill in your text. Presenters tell us our 3d two stages of process analysis flow charting PowerPoint Slides will impress their bosses and teams. People tell us our corporation PowerPoint templates and PPT Slides are Attractive. Examine data with our 3d Two Stages Of Process Analysis Flow Charting PowerPoint Slides. You will come out on top.
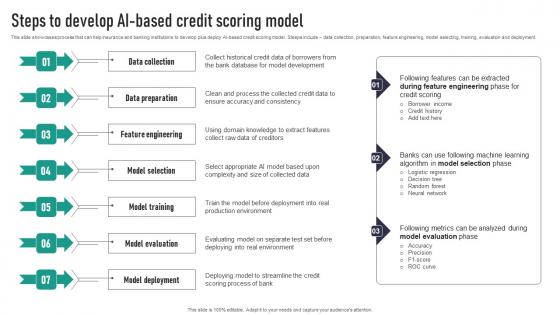
Steps To Develop AI Based Credit Scoring Model Background Pdf
This slide showcases process that can help insurance and banking institutions to develop plus deploy AI-based credit scoring model. Steeps include data collection, preparation, feature engineering, model selecting, training, evaluation and deployment. Crafting an eye-catching presentation has never been more straightforward. Let your presentation shine with this tasteful yet straightforward Steps To Develop AI Based Credit Scoring Model Background Pdf template. It offers a minimalistic and classy look that is great for making a statement. The colors have been employed intelligently to add a bit of playfulness while still remaining professional. Construct the ideal Steps To Develop AI Based Credit Scoring Model Background Pdf that effortlessly grabs the attention of your audience Begin now and be certain to wow your customers This slide showcases process that can help insurance and banking institutions to develop plus deploy AI-based credit scoring model. Steeps include data collection, preparation, feature engineering, model selecting, training, evaluation and deployment.
Areas For Data Analytics Application With Icons Ppt PowerPoint Presentation Gallery Inspiration PDF
Persuade your audience using this areas for data analytics application with icons ppt powerpoint presentation gallery inspiration pdf. This PPT design covers six stages, thus making it a great tool to use. It also caters to a variety of topics including manufacturing, e commerce, finance . Download this PPT design now to present a convincing pitch that not only emphasizes the topic but also showcases your presentation skills.
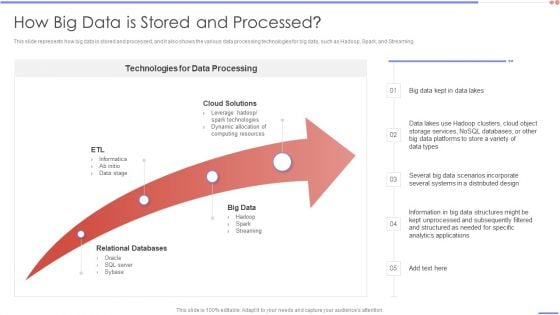
Data Analytics Management How Big Data Is Stored And Processed Introduction PDF
This slide represents how big data is stored and processed, and it also shows the various data processing technologies for big data, such as Hadoop, Spark, and Streaming.Presenting Data Analytics Management How Big Data Is Stored And Processed Introduction PDF to provide visual cues and insights. Share and navigate important information on one stage that need your due attention. This template can be used to pitch topics like Technologies For Data, Relational Databases, Cloud Solutions. In addtion, this PPT design contains high resolution images, graphics, etc, that are easily editable and available for immediate download.
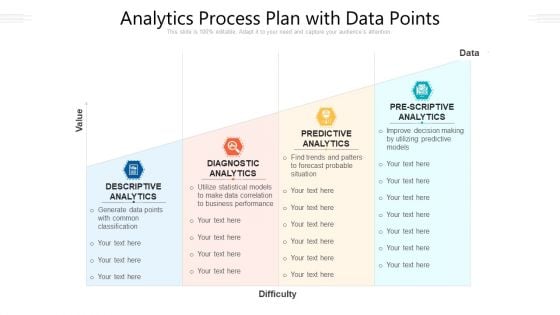
Analytics Process Plan With Data Points Ppt PowerPoint Presentation File Design Ideas PDF
Persuade your audience using this analytics process plan with data points ppt powerpoint presentation file design ideas pdf. This PPT design covers four stages, thus making it a great tool to use. It also caters to a variety of topics including descriptive analytics, diagnostic analytics, predictive analytics. Download this PPT design now to present a convincing pitch that not only emphasizes the topic but also showcases your presentation skills.

Factors Contributing To Text Analytics Necessity PPT Sample SS
This slide outlines factors contributing to the necessity of text analytics, such as unstructured data, business insights, decision-making, automation, etc. Formulating a presentation can take up a lot of effort and time, so the content and message should always be the primary focus. The visuals of the PowerPoint can enhance the presenters message, so our Factors Contributing To Text Analytics Necessity PPT Sample SS was created to help save time. Instead of worrying about the design, the presenter can concentrate on the message while our designers work on creating the ideal templates for whatever situation is needed. Slidegeeks has experts for everything from amazing designs to valuable content, we have put everything into Factors Contributing To Text Analytics Necessity PPT Sample SS This slide outlines factors contributing to the necessity of text analytics, such as unstructured data, business insights, decision-making, automation, etc.
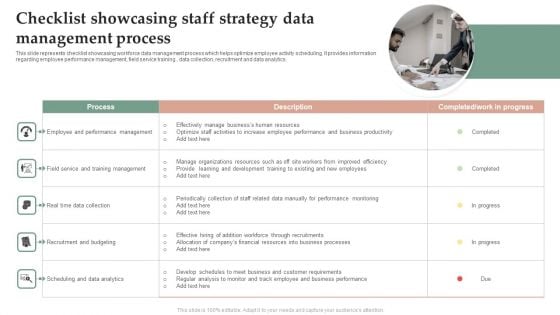
Checklist Showcasing Staff Strategy Data Management Process Information PDF
This slide represents checklist showcasing workforce data management process which helps optimize employee activity scheduling. It provides information regarding employee performance management, field service training , data collection, recruitment and data analytics. Persuade your audience using this Checklist Showcasing Staff Strategy Data Management Process Information PDF. This PPT design covers One stage, thus making it a great tool to use. It also caters to a variety of topics including Recruitment Budgeting, Scheduling Data Analytics. Download this PPT design now to present a convincing pitch that not only emphasizes the topic but also showcases your presentation skills.

About Model Training In Machine Learning Introduction To MLOPs IT
The slide provides an overview of the process of model training in machine learning. It highlights the various steps involved in the model training process, which include preparing data for training, selecting an appropriate algorithm, etc. Boost your pitch with our creative About Model Training In Machine Learning Introduction To MLOPs IT. Deliver an awe-inspiring pitch that will mesmerize everyone. Using these presentation templates you will surely catch everyones attention. You can browse the ppts collection on our website. We have researchers who are experts at creating the right content for the templates. So you do not have to invest time in any additional work. Just grab the template now and use them. The slide provides an overview of the process of model training in machine learning. It highlights the various steps involved in the model training process, which include preparing data for training, selecting an appropriate algorithm, etc.
Coca Cola Emotional Marketing Strategy Magnifying Glass Ppt Infographics Graphics Example PDF
Welcome to our selection of the Coca Cola Emotional Marketing Strategy Magnifying Glass Ppt Infographics Graphics Example PDF. These are designed to help you showcase your creativity and bring your sphere to life. Planning and Innovation are essential for any business that is just starting out. This collection contains the designs that you need for your everyday presentations. All of our PowerPoints are 100 percent editable, so you can customize them to suit your needs. This multi-purpose template can be used in various situations. Grab these presentation templates today


 Continue with Email

 Home
Home


