Portfolio Plan
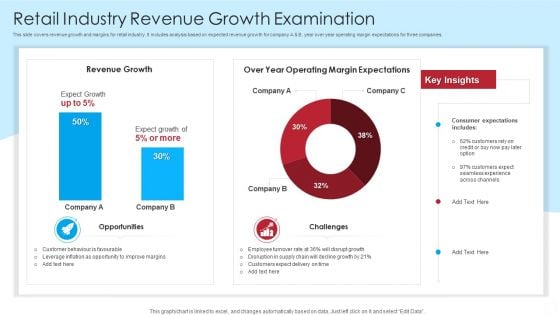
Retail Industry Revenue Growth Examination Slides PDF
This slide covers revenue growth and margins for retail industry. It includes analysis based on expected revenue growth for company A B, year over year operating margin expectations for three companies.Showcasing this set of slides titled Retail Industry Revenue Growth Examination Slides PDF. The topics addressed in these templates are Expect Growth, Consumer Expectations, Leverage Inflation. All the content presented in this PPT design is completely editable. Download it and make adjustments in color, background, font etc. as per your unique business setting.
Marketing And Operation KPI Dashboard To Increase Efficiency Icons PDF
This slide covers sales and operations KPI dashboard to increase efficiency. It involves performance, increase in profit, target, monthly profit and quarterly revenue trend. Pitch your topic with ease and precision using this Marketing And Operation KPI Dashboard To Increase Efficiency Icons PDF. This layout presents information on Profit By Monthly, Target, Performance. It is also available for immediate download and adjustment. So, changes can be made in the color, design, graphics or any other component to create a unique layout.
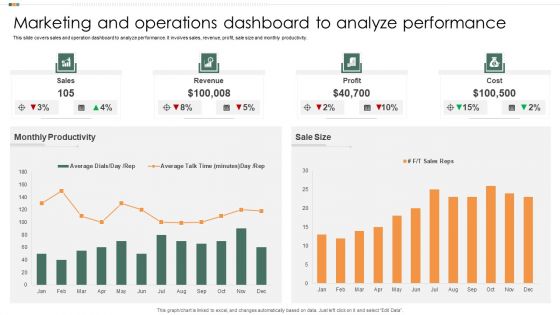
Marketing And Operations Dashboard To Analyze Performance Infographics PDF
This slide covers sales and operation dashboard to analyze performance. It involves sales, revenue, profit, sale size and monthly productivity. Showcasing this set of slides titled Marketing And Operations Dashboard To Analyze Performance Infographics PDF. The topics addressed in these templates are Monthly Productivity, Sales, Revenue. All the content presented in this PPT design is completely editable. Download it and make adjustments in color, background, font etc. as per your unique business setting.
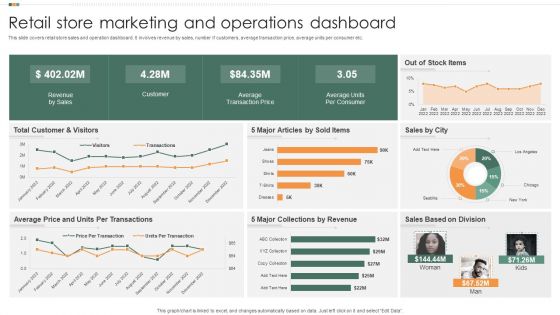
Retail Store Marketing And Operations Dashboard Mockup PDF
This slide covers retail store sales and operation dashboard. It involves revenue by sales, number if customers, average transaction price, average units per consumer etc. Pitch your topic with ease and precision using this Retail Store Marketing And Operations Dashboard Mockup PDF. This layout presents information on Revenue By Sales, Customer, Average Transaction Price. It is also available for immediate download and adjustment. So, changes can be made in the color, design, graphics or any other component to create a unique layout.
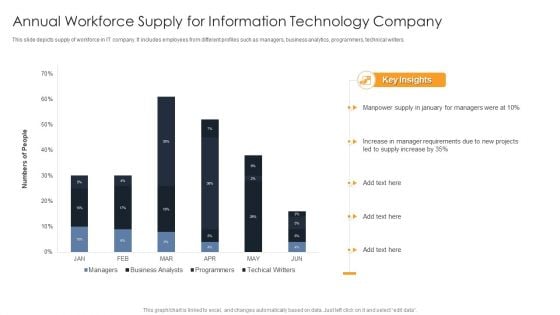
Annual Workforce Supply For Information Technology Company Ppt Pictures Files PDF
This slide depicts supply of workforce in IT company. It includes employees from different profiles such as managers, business analytics, programmers, technical writers. Showcasing this set of slides titled Annual Workforce Supply For Information Technology Company Ppt Pictures Files PDF. The topics addressed in these templates are Annual Workforce Supply, Information Technology Company. All the content presented in this PPT design is completely editable. Download it and make adjustments in color, background, font etc. as per your unique business setting.
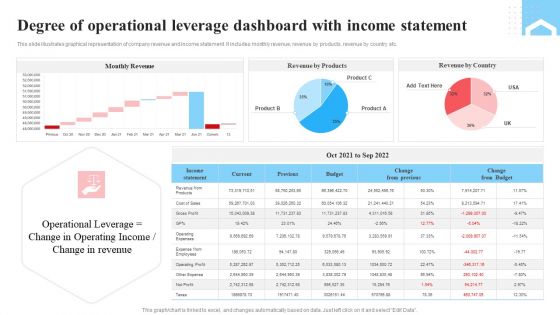
Degree Of Operational Leverage Dashboard With Income Statement Ppt Infographics Layout PDF
This slide illustrates graphical representation of company revenue and income statement. It includes monthly revenue, revenue by products, revenue by country etc. Pitch your topic with ease and precision using this Degree Of Operational Leverage Dashboard With Income Statement Ppt Infographics Layout PDF. This layout presents information on Monthly Revenue, Income Statement, Product. It is also available for immediate download and adjustment. So, changes can be made in the color, design, graphics or any other component to create a unique layout.
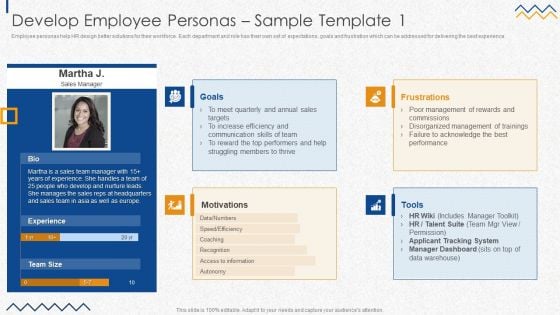
Develop Employee Personas Sample Template 1 Information PDF
Employee personas help HR design better solutions for their workforce. Each department and role has their own set of expectations, goals and frustration which can be addressed for delivering the best experience. Deliver and pitch your topic in the best possible manner with this Develop Employee Personas Sample Template 1 Information PDF. Use them to share invaluable insights on Frustrations, Disorganized Management, Struggling Members and impress your audience. This template can be altered and modified as per your expectations. So, grab it now.
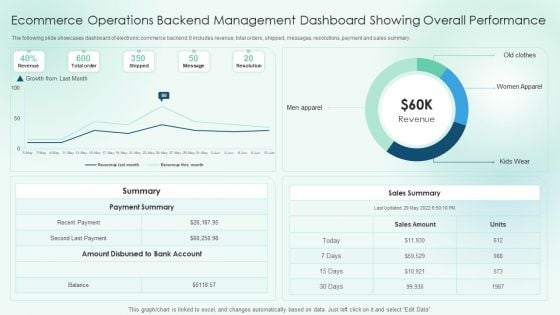
Ecommerce Operations Backend Management Dashboard Showing Overall Performance Slides PDF
The following slide showcases dashboard of electronic commerce backend. It includes revenue, total orders, shipped, messages, resolutions, payment and sales summary.Pitch your topic with ease and precision using this Ecommerce Operations Backend Management Dashboard Showing Overall Performance Slides PDF. This layout presents information on Payment Summary, Amount Disbursed, Sales Summary. It is also available for immediate download and adjustment. So, changes can be made in the color, design, graphics or any other component to create a unique layout.
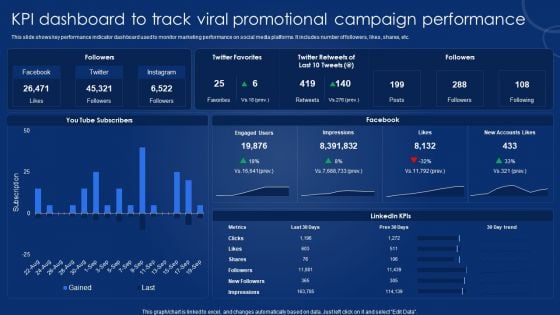
KPI Dashboard To Track Viral Promotional Campaign Performance Icons PDF
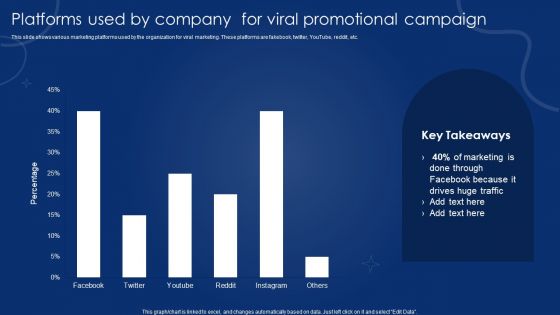
Platforms Used By Company For Viral Promotional Campaign Information PDF
This slide shows various marketing platforms used by the organization for viral marketing. These platforms are fakebook, twitter, YouTube, reddit, etc. Showcasing this set of slides titled Platforms Used By Company For Viral Promotional Campaign Information PDF. The topics addressed in these templates are Marketing, Facebook, Drives Huge Traffic. All the content presented in this PPT design is completely editable. Download it and make adjustments in color, background, font etc. as per your unique business setting.
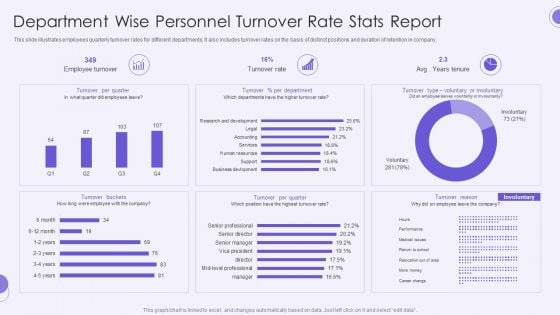
Department Wise Personnel Turnover Rate Stats Report Introduction PDF
This slide illustrates employees quarterly turnover rates for different departments. It also includes turnover rates on the basis of distinct positions and duration of retention in company.Showcasing this set of slides titled Department Wise Personnel Turnover Rate Stats Report Introduction PDF. The topics addressed in these templates are Employee Turnover, Turnover Per Quarter, Voluntary Or Involuntary. All the content presented in this PPT design is completely editable. Download it and make adjustments in color, background, font etc. as per your unique business setting.

Impact Of Personnel Workplace Conflict Stats Rules PDF
This slide illustrates the outcome of conflict among employees at workplace. It includes personal insults, absence, departmental arguments, bullying, resignations, terminations, project failure and change in departments.Pitch your topic with ease and precision using this Impact Of Personnel Workplace Conflict Stats Rules PDF. This layout presents information on Personal Attacks, Training Is Advantageous, Conflict Resolution. It is also available for immediate download and adjustment. So, changes can be made in the color, design, graphics or any other component to create a unique layout.
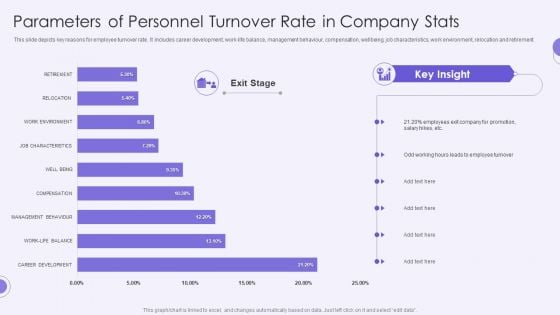
Parameters Of Personnel Turnover Rate In Company Stats Template PDF
This slide depicts key reasons for employee turnover rate. It includes career development, work-life balance, management behaviour, compensation, wellbeing, job characteristics, work environment, relocation and retirement.Pitch your topic with ease and precision using this Parameters Of Personnel Turnover Rate In Company Stats Template PDF. This layout presents information on Career Development, Management Behavior, Compensation. It is also available for immediate download and adjustment. So, changes can be made in the color, design, graphics or any other component to create a unique layout.
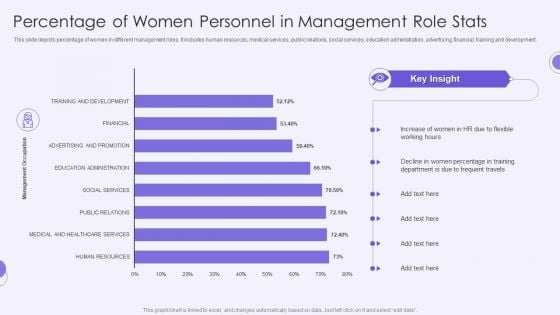
Percentage Of Women Personnel In Management Role Stats Clipart PDF
This slide depicts percentage of women in different management roles. It includes human resources, medical services, public relations, social services, education administration, advertising, financial, training and development.Showcasing this set of slides titled Percentage Of Women Personnel In Management Role Stats Clipart PDF. The topics addressed in these templates are Increase Women, Percentage In Training, Frequent Travels. All the content presented in this PPT design is completely editable. Download it and make adjustments in color, background, font etc. as per your unique business setting.
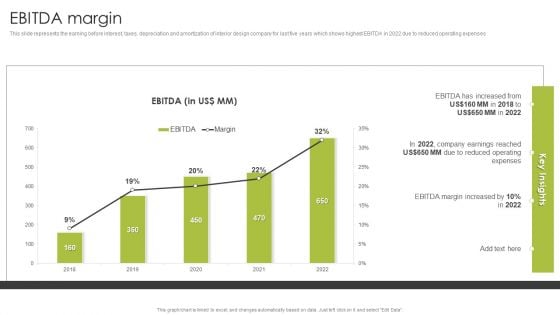
Home Interior Styling Services Company Profile EBITDA Margin Microsoft PDF
This slide represents the earning before interest, taxes, depreciation and amortization of interior design company for last five years which shows highest EBITDA in 2022 due to reduced operating expenses.Deliver an awe inspiring pitch with this creative Home Interior Styling Services Company Profile EBITDA Margin Microsoft PDF bundle. Topics like Company Earnings, Reduced Operating, Margin Increased can be discussed with this completely editable template. It is available for immediate download depending on the needs and requirements of the user.
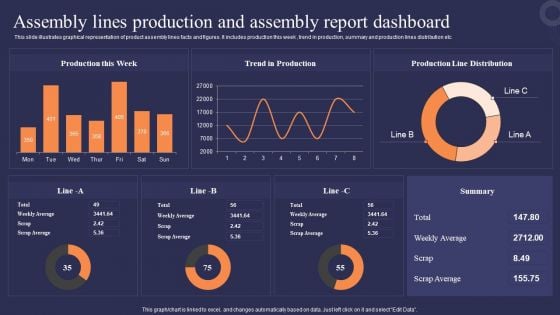
Assembly Lines Production And Assembly Report Dashboard Microsoft PDF
This slide illustrates graphical representation of product assembly lines facts and figures. It includes production this week , trend in production, summary and production lines distribution etc.Showcasing this set of slides titled Assembly Lines Production And Assembly Report Dashboard Microsoft PDF. The topics addressed in these templates are Production, Trend Production, Production Distribution. All the content presented in this PPT design is completely editable. Download it and make adjustments in color, background, font etc. as per your unique business setting.
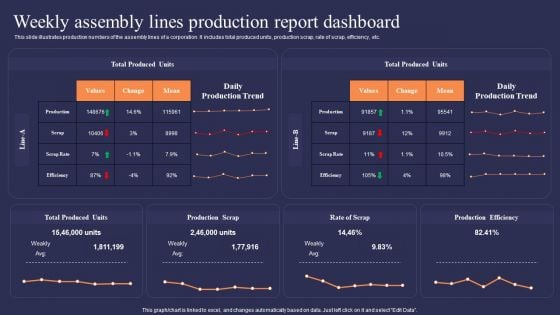
Weekly Assembly Lines Production Report Dashboard Demonstration PDF
This slide illustrates production numbers of the assembly lines of a corporation. It includes total produced units, production scrap, rate of scrap, efficiency, etc.Showcasing this set of slides titled Weekly Assembly Lines Production Report Dashboard Demonstration PDF. The topics addressed in these templates are Total Produced, Production Efficiency, Production Scrap. All the content presented in this PPT design is completely editable. Download it and make adjustments in color, background, font etc. as per your unique business setting.
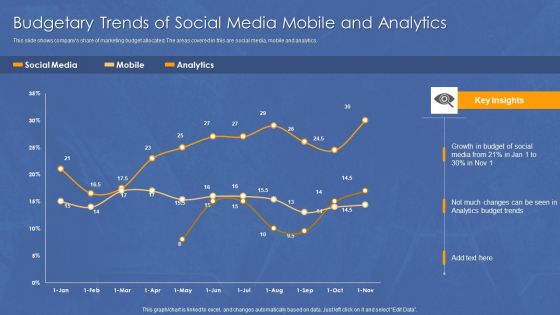
Budgetary Trends Of Social Media Mobile And Analytics Infographics PDF
This slide shows companys share of marketing budget allocated. The areas covered in this are social media, mobile and analytics.Showcasing this set of slides titled Budgetary Trends Of Social Media Mobile And Analytics Infographics PDF. The topics addressed in these templates are Growth Budget, Changes Can, Analytics Budget. All the content presented in this PPT design is completely editable. Download it and make adjustments in color, background, font etc. as per your unique business setting.
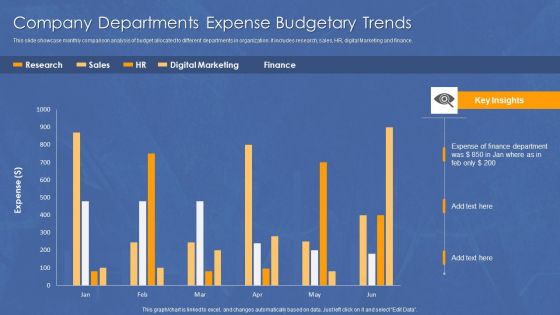
Company Departments Expense Budgetary Trends Diagrams PDF
This slide showcase monthly comparison analysis of budget allocated to different departments in organization. It includes research, sales, HR, digital Marketing and finance. Pitch your topic with ease and precision using this Company Departments Expense Budgetary Trends Diagrams PDF. This layout presents information on Expense, Finance, Department. It is also available for immediate download and adjustment. So, changes can be made in the color, design, graphics or any other component to create a unique layout.
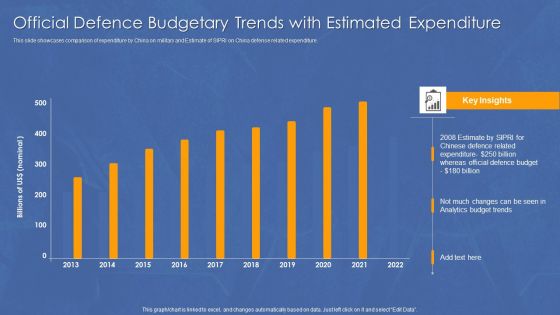
Official Defence Budgetary Trends With Estimated Expenditure Diagrams PDF
This slide showcases comparison of expenditure by China on military and Estimate of SIPRI on China defense related expenditure.Pitch your topic with ease and precision using this Official Defence Budgetary Trends With Estimated Expenditure Diagrams PDF. This layout presents information on Defence Related, Defence Budget, Expenditure. It is also available for immediate download and adjustment. So, changes can be made in the color, design, graphics or any other component to create a unique layout.
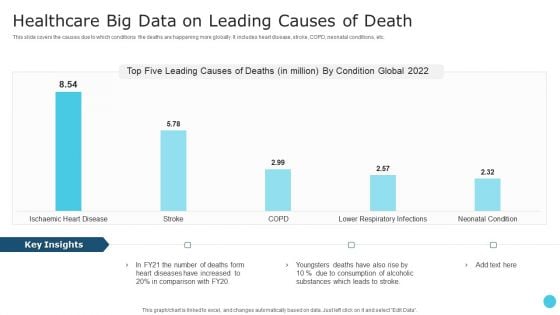
Healthcare Big Data On Leading Causes Of Death Information PDF
This slide covers the causes due to which conditions the deaths are happening more globally. It includes heart disease, stroke, COPD, neonatal conditions, etc. Showcasing this set of slides titled Healthcare Big Data On Leading Causes Of Death Information PDF. The topics addressed in these templates are Healthcare Big Data, Condition Global. All the content presented in this PPT design is completely editable. Download it and make adjustments in color, background, font etc. as per your unique business setting.
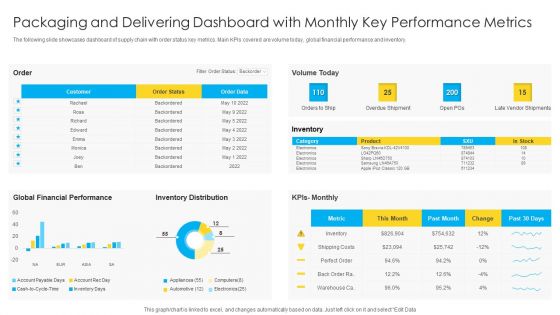
Packaging And Delivering Dashboard With Monthly Key Performance Metrics Microsoft PDF
The following slide showcases dashboard of supply chain with order status key metrics. Main KPIs covered are volume today, global financial performance and inventory. Pitch your topic with ease and precision using this Packaging And Delivering Dashboard With Monthly Key Performance Metrics Microsoft PDF. This layout presents information on Customer, Global Financial Performance, Inventory Distribution. It is also available for immediate download and adjustment. So, changes can be made in the color, design, graphics or any other component to create a unique layout.
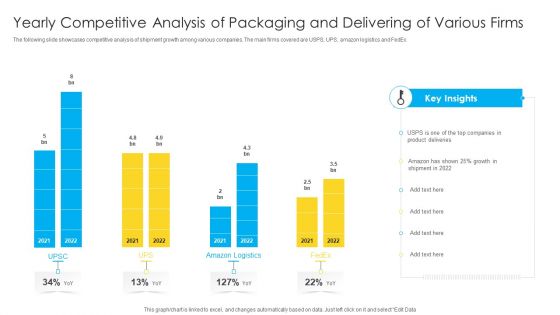
Yearly Competitive Analysis Of Packaging And Delivering Of Various Firms Professional PDF
The following slide showcases competitive analysis of shipment growth among various companies. The main firms covered are USPS, UPS, amazon logistics and FedEx. Pitch your topic with ease and precision using this Yearly Competitive Analysis Of Packaging And Delivering Of Various Firms Professional PDF. This layout presents information on Product Deliveries, Growth. It is also available for immediate download and adjustment. So, changes can be made in the color, design, graphics or any other component to create a unique layout.
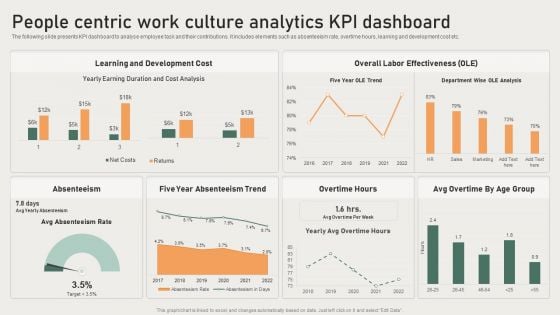
People Centric Work Cuture Analytics Kpi Dashboard Brochure PDF
The following slide presents KPI dashboard to analyse employee task and their contributions. It includes elements such as absenteeism rate, overtime hours, learning and development cost etc. Showcasing this set of slides titled People Centric Work Cuture Analytics Kpi Dashboard Brochure PDF. The topics addressed in these templates are Development Cost, Overall Labor Effectiveness, Absenteeism. All the content presented in this PPT design is completely editable. Download it and make adjustments in color, background, font etc. as per your unique business setting.
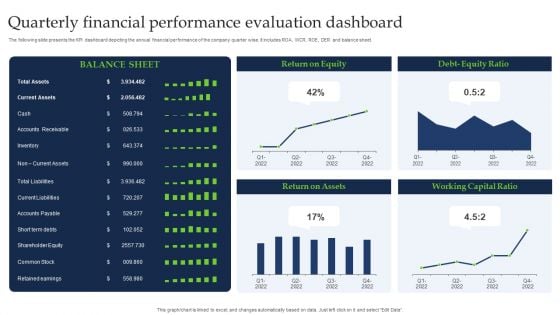
Quarterly Financial Performance Evaluation Dashboard Guidelines PDF
The following slide presents the KPI dashboard depicting the annual financial performance of the company quarter wise. It includes ROA, WCR, ROE, DER and balance sheet. Pitch your topic with ease and precision using this Quarterly Financial Performance Evaluation Dashboard Guidelines PDF. This layout presents information on Current Assets, Shareholder Equity, Common Stock. It is also available for immediate download and adjustment. So, changes can be made in the color, design, graphics or any other component to create a unique layout.
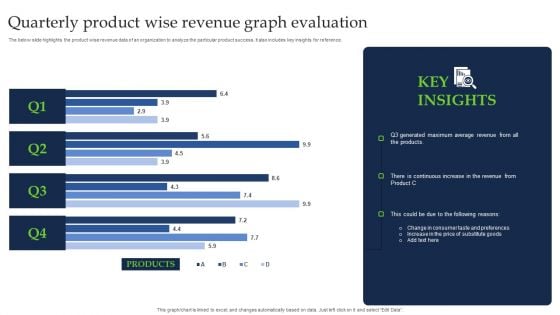
Quarterly Product Wise Revenue Graph Evaluation Brochure PDF
The below slide highlights the product wise revenue data of an organization to analyze the particular product success. It also includes key insights for reference. Pitch your topic with ease and precision using this Quarterly Product Wise Revenue Graph Evaluation Brochure PDF. This layout presents information on Products, Average Revenue. It is also available for immediate download and adjustment. So, changes can be made in the color, design, graphics or any other component to create a unique layout.
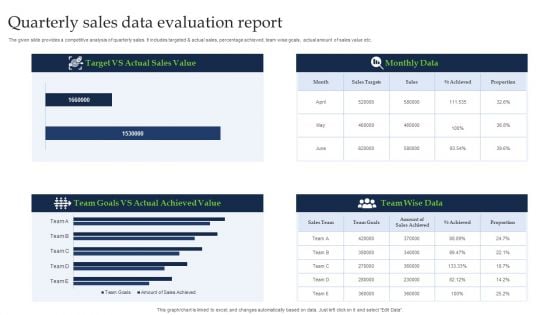
Quarterly Sales Data Evaluation Report Ideas PDF
The given slide provides a competitive analysis of quarterly sales. It includes targeted and actual sales, percentage achieved, team wise goals, actual amount of sales value etc. Showcasing this set of slides titled Quarterly Sales Data Evaluation Report Ideas PDF. The topics addressed in these templates are Actual Sales Value, Target, Actual Achieved Value. All the content presented in this PPT design is completely editable. Download it and make adjustments in color, background, font etc. as per your unique business setting.
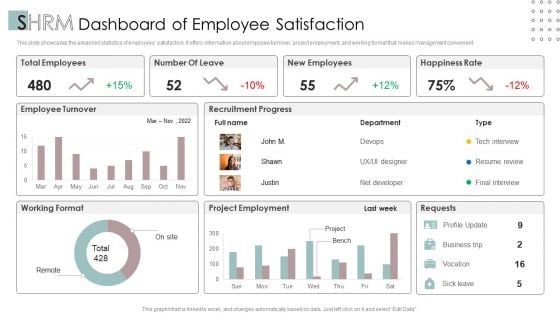
SHRM Dashboard Of Employee Satisfaction Ppt PowerPoint Presentation Styles Example File PDF
This slide showcases the advanced statistics of employees satisfaction. It offers information about employee turnover, project employment, and working format that makes management convenient.Pitch your topic with ease and precision using this SHRM Dashboard Of Employee Satisfaction Ppt PowerPoint Presentation Styles Example File PDF. This layout presents information on Total Employees, Happiness Rate, Project Employment. It is also available for immediate download and adjustment. So, changes can be made in the color, design, graphics or any other component to create a unique layout.
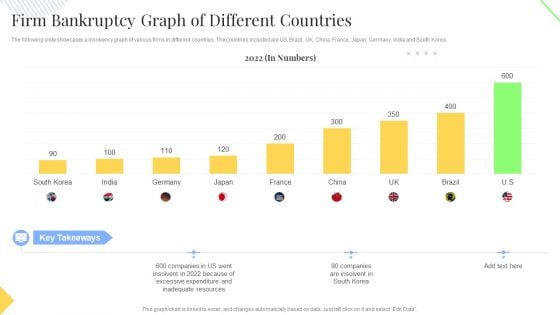
Firm Bankruptcy Graph Of Different Countries Summary PDF
The following slide showcases a insolvency graph of various firms in different countries. The countries included are US, Brazil, UK, China, France, Japan, Germany, India and South Korea. Showcasing this set of slides titled Firm Bankruptcy Graph Of Different Countries Summary PDF. The topics addressed in these templates are Excessive Expenditure, Inadequate Resources. All the content presented in this PPT design is completely editable. Download it and make adjustments in color, background, font etc. as per your unique business setting.

Commercial Marketing KPI With Accumulated Sales And Profit Portrait PDF
This slide template covers about key performing indicators like number of sales with revenue and profit generated in comparison with cost input and breakdown.Showcasing this set of slides titled Commercial Marketing KPI With Accumulated Sales And Profit Portrait PDF. The topics addressed in these templates are Cost Breakdown, Accumulated Revenue, Incremental Sales. All the content presented in this PPT design is completely editable. Download it and make adjustments in color, background, font etc. as per your unique business setting.
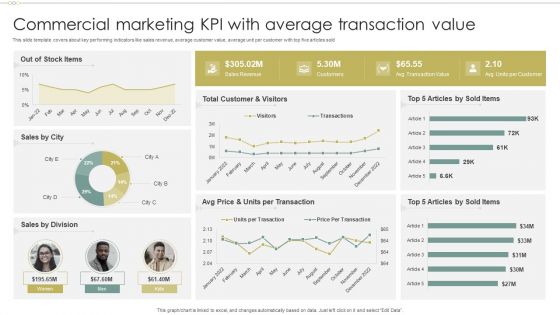
Commercial Marketing KPI With Average Transaction Value Formats PDF
This slide template covers about key performing indicators like sales revenue, average customer value, average unit per customer with top five articles sold. Pitch your topic with ease and precision using this Commercial Marketing KPI With Average Transaction Value Formats PDF. This layout presents information on Total Customer, Per Transaction, Transaction Value. It is also available for immediate download and adjustment. So, changes can be made in the color, design, graphics or any other component to create a unique layout.
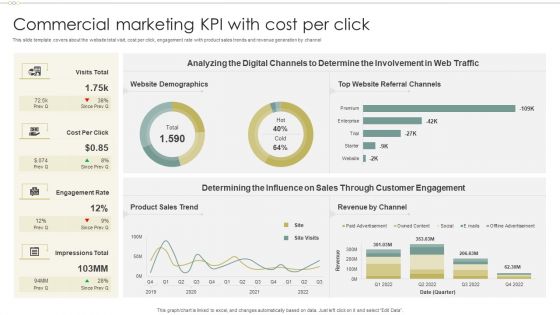
Commercial Marketing KPI With Cost Per Click Guidelines PDF
This slide template covers about the website total visit, cost per click, engagement rate with product sales trends and revenue generation by channel. Pitch your topic with ease and precision using this Commercial Marketing KPI With Cost Per Click Guidelines PDF. This layout presents information on Website Demographics, Referral Channels, Determining Influence. It is also available for immediate download and adjustment. So, changes can be made in the color, design, graphics or any other component to create a unique layout.
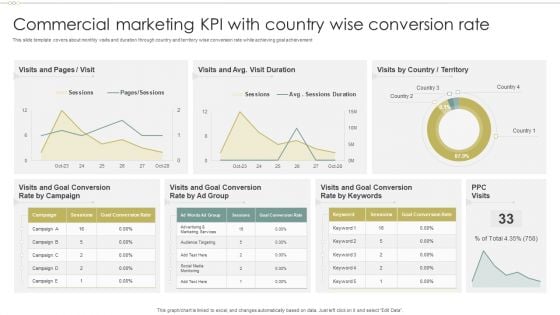
Commercial Marketing KPI With Country Wise Conversion Rate Summary PDF
This slide template covers about monthly visits and duration through country and territory wise conversion rate while achieving goal achievement. Showcasing this set of slides titled Commercial Marketing KPI With Country Wise Conversion Rate Summary PDF. The topics addressed in these templates are Goal Conversion, Visits Goal, Country Territory. All the content presented in this PPT design is completely editable. Download it and make adjustments in color, background, font etc. as per your unique business setting.
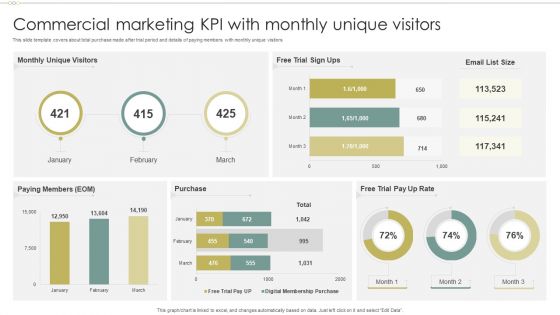
Commercial Marketing KPI With Monthly Unique Visitors Graphics PDF
This slide template covers about total purchase made after trial period and details of paying members with monthly unique visitors.Showcasing this set of slides titled Commercial Marketing KPI With Monthly Unique Visitors Graphics PDF. The topics addressed in these templates are Unique Visitors, Paying Members, Trial Pay. All the content presented in this PPT design is completely editable. Download it and make adjustments in color, background, font etc. as per your unique business setting.

Commercial Marketing KPI With Return On Investment Diagrams PDF
This slide templates covers about trade marketing key performing indicators with website visitors, leads by channel, social media reach with yearly goal achievement.Pitch your topic with ease and precision using this Commercial Marketing KPI With Return On Investment Diagrams PDF. This layout presents information on Marketing Spend, Return Investment, Budget Remaining. It is also available for immediate download and adjustment. So, changes can be made in the color, design, graphics or any other component to create a unique layout.
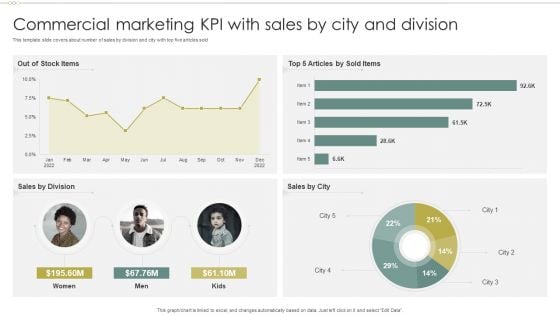
Commercial Marketing KPI With Sales By City And Division Template PDF
This template slide covers about number of sales by division and city with top five articles sold.Showcasing this set of slides titled Commercial Marketing KPI With Sales By City And Division Template PDF. The topics addressed in these templates are Commercial Marketing KPI With Sales By City And Division Template PDF. All the content presented in this PPT design is completely editable. Download it and make adjustments in color, background, font etc. as per your unique business setting.
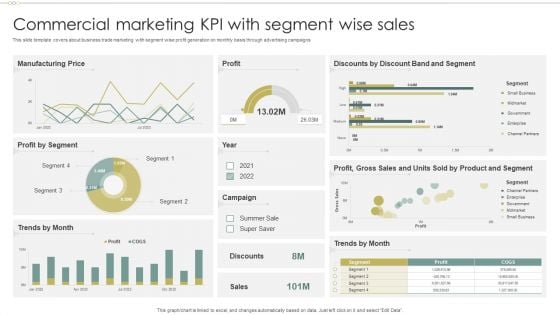
Commercial Marketing KPI With Segment Wise Sales Inspiration PDF
This slide template covers about business trade marketing with segment wise profit generation on monthly basis through advertising campaigns.Pitch your topic with ease and precision using this Commercial Marketing KPI With Segment Wise Sales Inspiration PDF. This layout presents information on Manufacturing Price, Campaign, Discounts Discount. It is also available for immediate download and adjustment. So, changes can be made in the color, design, graphics or any other component to create a unique layout.
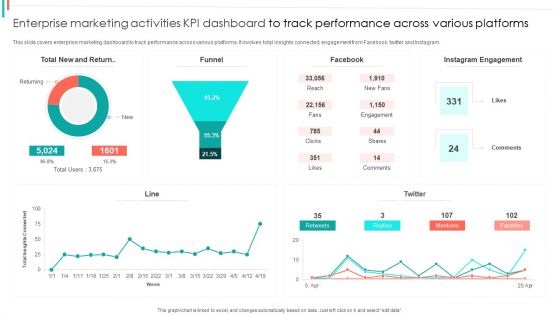
Enterprise Marketing Activities KPI Dashboard To Track Performance Across Various Platforms Ideas PDF
This slide covers enterprise marketing dashboard to track performance across various platforms. It involves total insights connected, engagement from Facebook, twitter and Instagram.Pitch your topic with ease and precision using this Enterprise Marketing Activities KPI Dashboard To Track Performance Across Various Platforms Ideas PDF. This layout presents information on Instagram Engagement, Comments, Returning. It is also available for immediate download and adjustment. So, changes can be made in the color, design, graphics or any other component to create a unique layout.
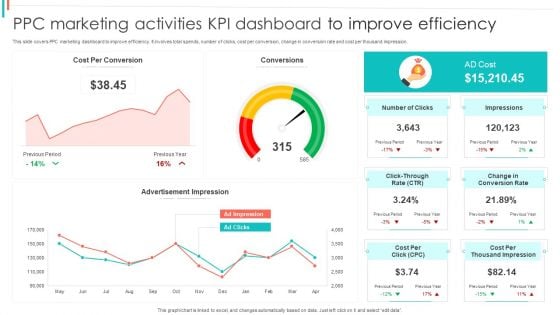
PPC Marketing Activities KPI Dashboard To Improve Efficiency Diagrams PDF
This slide covers PPC marketing dashboard to improve efficiency. It involves total spends, number of clicks, cost per conversion, change in conversion rate and cost per thousand impression.Showcasing this set of slides titled PPC Marketing Activities KPI Dashboard To Improve Efficiency Diagrams PDF. The topics addressed in these templates are Per Conversion, Advertisement Impression, Impressions. All the content presented in this PPT design is completely editable. Download it and make adjustments in color, background, font etc. as per your unique business setting.
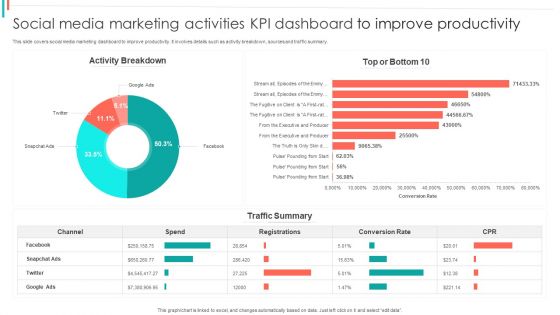
Social Media Marketing Activities KPI Dashboard To Improve Productivity Summary PDF
This slide covers social media marketing dashboard to improve productivity. It involves details such as activity breakdown, sources and traffic summary.Pitch your topic with ease and precision using this Social Media Marketing Activities KPI Dashboard To Improve Productivity Summary PDF. This layout presents information on Activity Breakdown, Conversion Rate, Traffic Summary. It is also available for immediate download and adjustment. So, changes can be made in the color, design, graphics or any other component to create a unique layout.
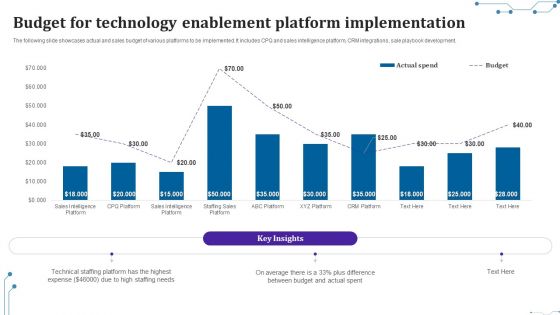
Budget For Technology Enablement Platform Implementation Slides PDF
The following slide showcases actual and sales budget of various platforms to be implemented. It includes CPQ and sales intelligence platform, CRM integrations, sale playbook development.Showcasing this set of slides titled Budget For Technology Enablement Platform Implementation Slides PDF. The topics addressed in these templates are Technical Staffing, Between Budget, Staffing Needs. All the content presented in this PPT design is completely editable. Download it and make adjustments in color, background, font etc. as per your unique business setting.
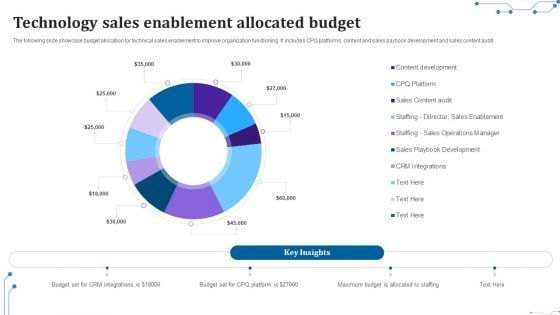
Technology Sales Enablement Allocated Budget Information PDF
The following slide showcase budget allocation for technical sales enablement to improve organization functioning. It includes CPQ platforms, content and sales paybook development and sales content audit.Showcasing this set of slides titled Technology Sales Enablement Allocated Budget Information PDF. The topics addressed in these templates are Content Development, Sales Content, Sales Operations. All the content presented in this PPT design is completely editable. Download it and make adjustments in color, background, font etc. as per your unique business setting.
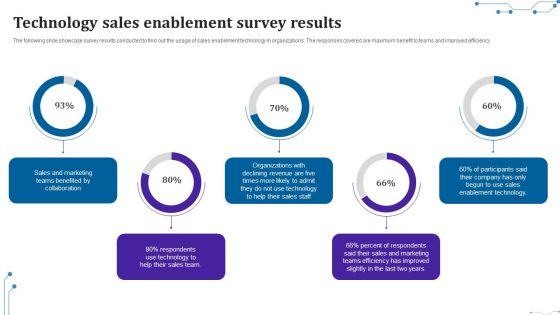
Technology Sales Enablement Survey Results Pictures PDF
The following slide showcase survey results conducted to find out the usage of sales enablement technology in organizations. The responses covered are maximum benefit to teams and improved efficiency.Pitch your topic with ease and precision using this Technology Sales Enablement Survey Results Pictures PDF. This layout presents information on Teams Benefited, Sales Marketing, Percent Respondents. It is also available for immediate download and adjustment. So, changes can be made in the color, design, graphics or any other component to create a unique layout.

Employee Unsatisfactory Performance Dashboard With Training Costs Professional PDF
This slide contains the information on the employee performance in the company over the past years. It also includes the absenteeism rate, overtime hours, OLE, training costs, etc. Showcasing this set of slides titled Employee Unsatisfactory Performance Dashboard With Training Costs Professional PDF. The topics addressed in these templates are Absenteeism, Absenteeism Rate, Duration Training. All the content presented in this PPT design is completely editable. Download it and make adjustments in color, background, font etc. as per your unique business setting.
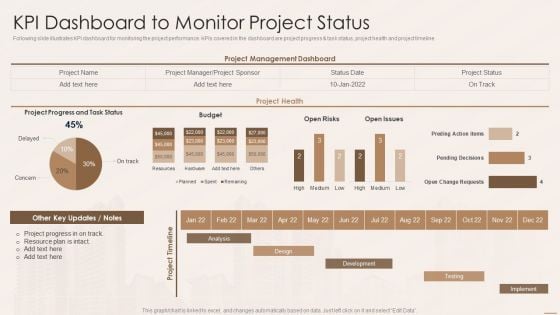
Real Estate Developers Funding Alternatives Kpi Dashboard To Monitor Project Status Structure PDF
Following slide illustrates KPI dashboard for monitoring the project performance. KPIs covered in the dashboard are project progress and task status, project health and project timeline. Deliver an awe inspiring pitch with this creative Real Estate Developers Funding Alternatives Kpi Dashboard To Monitor Project Status Structure PDF bundle. Topics like Analysis, DeAnalysis, Design, Development can be discussed with this completely editable template. It is available for immediate download depending on the needs and requirements of the user.
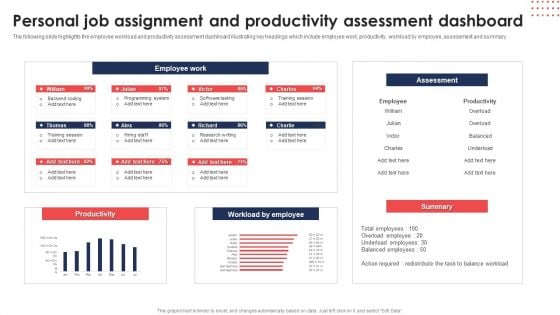
Personal Job Assignment And Productivity Assessment Dashboard Sample PDF
The following slide highlights the employee workload and productivity assessment dashboard illustrating key headings which include employee work, productivity, workload by employee, assessment and summary. Pitch your topic with ease and precision using this Personal Job Assignment And Productivity Assessment Dashboard Sample PDF. This layout presents information on Employee Work, Assessment, Productivity. It is also available for immediate download and adjustment. So, changes can be made in the color, design, graphics or any other component to create a unique layout.
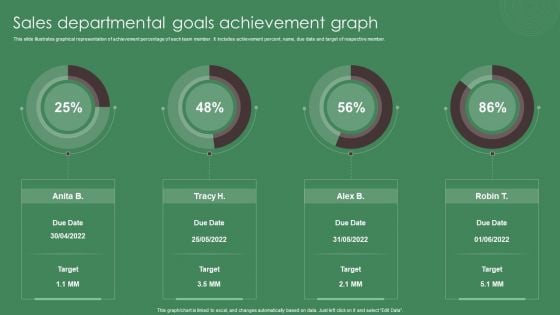
Sales Departmental Goals Achievement Graph Ppt Inspiration Slide Download PDF
This slide illustrates graphical representation of achievement percentage of each team member. It includes achievement percent, name, due date and target of respective member. Pitch your topic with ease and precision using this Sales Departmental Goals Achievement Graph Ppt Inspiration Slide Download PDF. This layout presents information on Sales Departmental, Goals, Achievement Graph. It is also available for immediate download and adjustment. So, changes can be made in the color, design, graphics or any other component to create a unique layout.
Education Dashboard For Tracking Gender Based Retention Metrics Template PDF
This slide illustrates student retention analysis dashboard. It include metrics based on gender, campus, ethnicity, and age group. Pitch your topic with ease and precision using this Education Dashboard For Tracking Gender Based Retention Metrics Template PDF. This layout presents information on Gender Based, Retention Rates, Age Group, Campus Wise. It is also available for immediate download and adjustment. So, changes can be made in the color, design, graphics or any other component to create a unique layout.
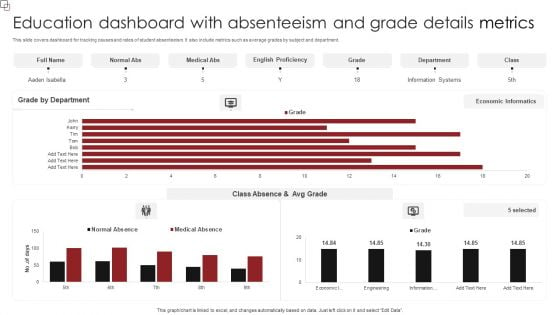
Education Dashboard With Absenteeism And Grade Details Metrics Diagrams PDF
This slide covers dashboard for tracking causes and rates of student absenteeism. It also include metrics such as average grades by subject and department. Pitch your topic with ease and precision using this Education Dashboard With Absenteeism And Grade Details Metrics Diagrams PDF. This layout presents information on Grade Department, English Proficiency, Medical Abs. It is also available for immediate download and adjustment. So, changes can be made in the color, design, graphics or any other component to create a unique layout.
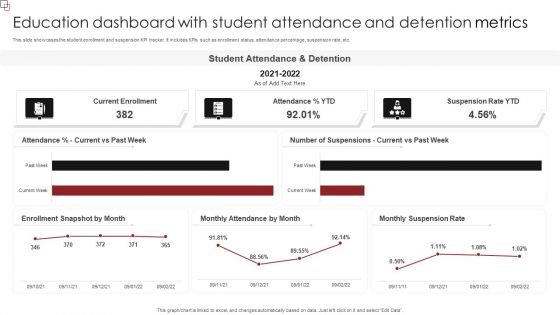
Education Dashboard With Student Attendance And Detention Metrics Inspiration PDF
This slide showcases the student enrollment and suspension KPI tracker. It includes KPIs such as enrollment status, attendance percentage, suspension rate, etc. Pitch your topic with ease and precision using this Education Dashboard With Student Attendance And Detention Metrics Inspiration PDF. This layout presents information on Student Attendance, Suspension Rate YTD, Current Enrollment. It is also available for immediate download and adjustment. So, changes can be made in the color, design, graphics or any other component to create a unique layout.
Quarterly Employee Performance Tracking With KPI Dashboard Portrait PDF
The following slide depicts the employee performance analysis on quarterly basis to identify their effectiveness and inefficiencies. It includes elements such as absenteeism, training cost, overtime, labor effectiveness etc. Showcasing this set of slides titled Quarterly Employee Performance Tracking With KPI Dashboard Portrait PDF. The topics addressed in these templates are Training Costs, Quarterly Average, Target. All the content presented in this PPT design is completely editable. Download it and make adjustments in color, background, font etc. as per your unique business setting.
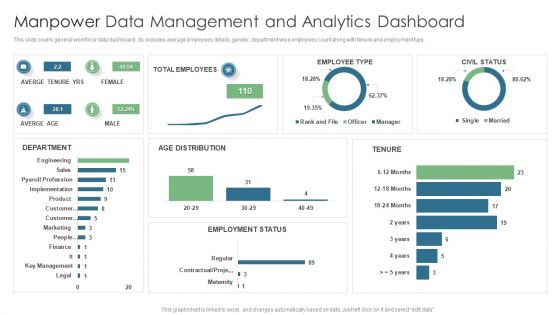
Manpower Data Management And Analytics Dashboard Topics PDF
This slide covers general workforce data dashboard . Its includes average employees details, gender, department wise employees count along with tenure and employment type. Pitch your topic with ease and precision using this Manpower Data Management And Analytics Dashboard Topics PDF. This layout presents information on Total Employees, Averge Tenure Yrs, Employee Type. It is also available for immediate download and adjustment. So, changes can be made in the color, design, graphics or any other component to create a unique layout.
Global Talent Management Portal Software Market Assessment Icons PDF
This slide caters details about global HRM software market assessment in terms of CAGR, global HRM software market by region, by company and designation. Deliver and pitch your topic in the best possible manner with this Global Talent Management Portal Software Market Assessment Icons PDF. Use them to share invaluable insights on Resource Software, Market, Management and impress your audience. This template can be altered and modified as per your expectations. So, grab it now.
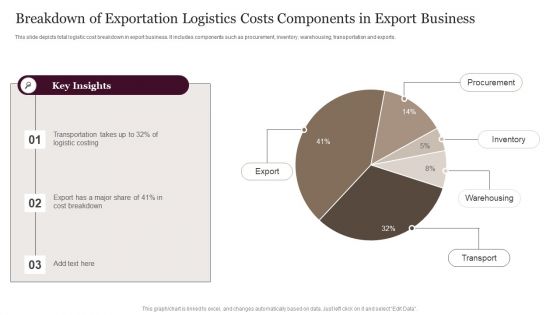
Breakdown Of Exportation Logistics Costs Components In Export Business Formats PDF
This slide depicts total logistic cost breakdown in export business. It includes components such as procurement, inventory, warehousing, transportation and exports. Showcasing this set of slides titled Breakdown Of Exportation Logistics Costs Components In Export Business Formats PDF. The topics addressed in these templates are Inventory, Warehousing, Procurement. All the content presented in this PPT design is completely editable. Download it and make adjustments in color, background, font etc. as per your unique business setting.
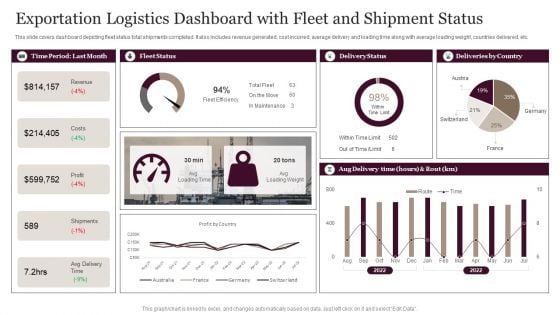
Exportation Logistics Dashboard With Fleet And Shipment Status Demonstration PDF
This slide covers dashboard depicting fleet status total shipments completed. It also includes revenue generated, cost incurred, average delivery and loading time along with average loading weight, countries delivered, etc. Showcasing this set of slides titled Exportation Logistics Dashboard With Fleet And Shipment Status Demonstration PDF. The topics addressed in these templates are Revenue, Costs, Profit. All the content presented in this PPT design is completely editable. Download it and make adjustments in color, background, font etc. as per your unique business setting.
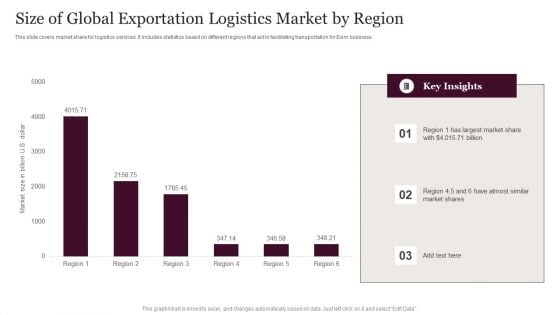
Size Of Global Exportation Logistics Market By Region Information PDF
This slide covers market share for logistics services. It includes statistics based on different regions that aid in facilitating transportation for Exim business. Pitch your topic with ease and precision using this Size Of Global Exportation Logistics Market By Region Information PDF. This layout presents information on Global Exportation Logistics, Market By Region. It is also available for immediate download and adjustment. So, changes can be made in the color, design, graphics or any other component to create a unique layout.
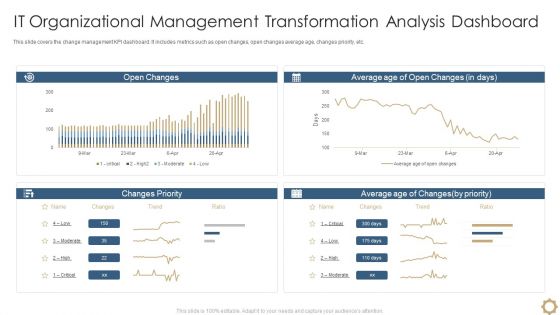
It Organizational Management Transformation Analysis Dashboard Download PDF
This slide covers the change management KPI dashboard. It includes metrics such as open changes, open changes average age, changes priority, etc. Showcasing this set of slides titled It Organizational Management Transformation Analysis Dashboard Download PDF. The topics addressed in these templates are It Organizational Management, Transformation Analysis Dashboard. All the content presented in this PPT design is completely editable. Download it and make adjustments in color, background, font etc. as per your unique business setting.
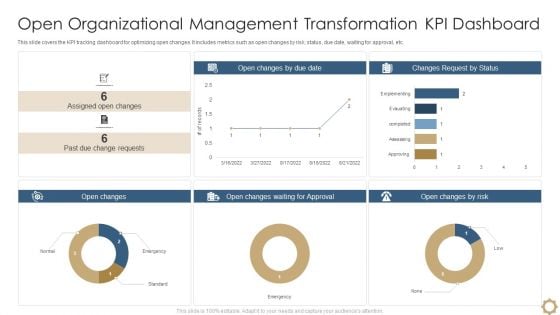
Open Organizational Management Transformation Kpi Dashboard Information PDF
This slide covers the KPI tracking dashboard for optimizing open changes. It includes metrics such as open changes by risk, status, due date, waiting for approval, etc. Pitch your topic with ease and precision using this Open Organizational Management Transformation Kpi Dashboard Information PDF. This layout presents information on Open Organizational Management, Transformation Kpi Dashboard. It is also available for immediate download and adjustment. So, changes can be made in the color, design, graphics or any other component to create a unique layout.
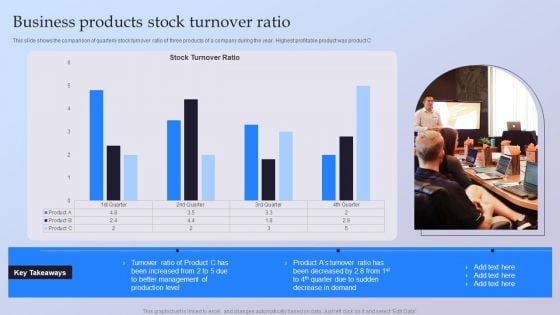
Business Products Stock Turnover Ratio Ppt File Aids PDF
This slide shows the comparison of quarterly stock turnover ratio of three products of a company during the year. Highest profitable product was product C Pitch your topic with ease and precision using this Business Products Stock Turnover Ratio Ppt File Aids PDF. This layout presents information on Better Management, Production Level, Turnover Ratio. It is also available for immediate download and adjustment. So, changes can be made in the color, design, graphics or any other component to create a unique layout.
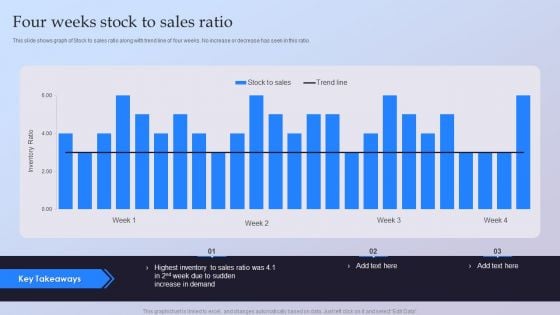
Four Weeks Stock To Sales Ratio Ppt Ideas Guide PDF
This slide shows graph of Stock to sales ratio along with trend line of four weeks. No increase or decrease has seen in this ratio. Pitch your topic with ease and precision using this Four Weeks Stock To Sales Ratio Ppt Ideas Guide PDF. This layout presents information on Highest Inventory, Sales Ratio, Increase Demand. It is also available for immediate download and adjustment. So, changes can be made in the color, design, graphics or any other component to create a unique layout.


 Continue with Email

 Home
Home


