Portfolio Plan
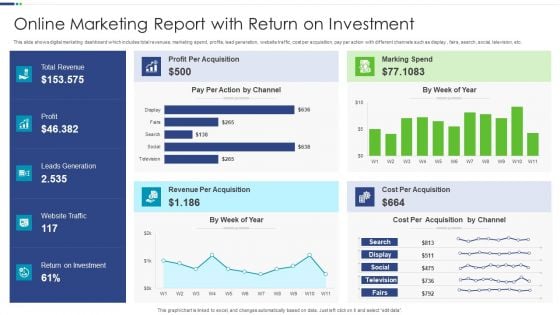
Online Marketing Report With Return On Investment Inspiration PDF
This slide shows digital marketing dashboard which includes total revenues, marketing spend, profits, lead generation, website traffic, cost per acquisition, pay per action with different channels such as display , fairs, search, social, television, etc.Showcasing this set of slides titled Online Marketing Report With Return On Investment Inspiration PDF The topics addressed in these templates are Leads Generation, Cost Acquisition, Return Investment All the content presented in this PPT design is completely editable. Download it and make adjustments in color, background, font etc. as per your unique business setting.
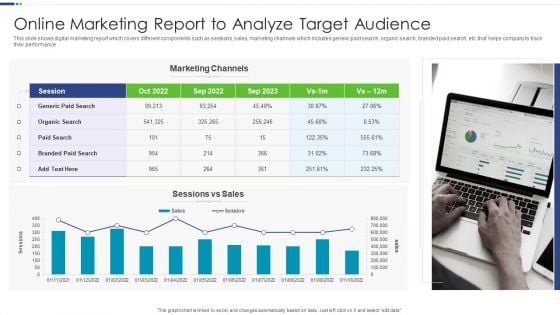
Online Marketing Report To Analyze Target Audience Elements PDF
This slide shows digital marketing report which covers different components such as sessions, sales, marketing channels which includes generic paid search, organic search, branded paid search, etc. that helps company to track their performance.Showcasing this set of slides titled Online Marketing Report To Analyze Target Audience Elements PDF The topics addressed in these templates are Online Marketing, Report To Analyze, Target Audience All the content presented in this PPT design is completely editable. Download it and make adjustments in color, background, font etc. as per your unique business setting.
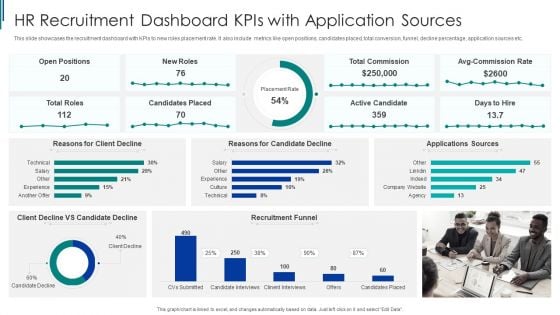
HR Recruitment Dashboard Kpis With Application Sources Ppt Pictures Styles PDF
This slide showcases the recruitment dashboard with KPIs to new roles placement rate. It also include metrics like open positions, candidates placed, total conversion, funnel, decline percentage, application sources etc. Pitch your topic with ease and precision using this HR Recruitment Dashboard Kpis With Application Sources Ppt Pictures Styles PDF. This layout presents information on Recruitment Funnel, HR Recruitment, Dashboard Kpis. It is also available for immediate download and adjustment. So, changes can be made in the color, design, graphics or any other component to create a unique layout.
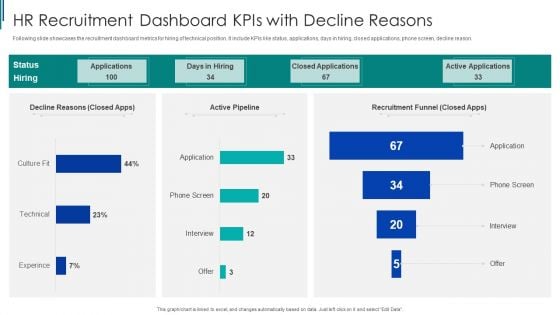
HR Recruitment Dashboard Kpis With Decline Reasons Ppt Pictures Example Introduction PDF
Following slide showcases the recruitment dashboard metrics for hiring of technical position. It include KPIs like status, applications, days in hiring, closed applications, phone screen, decline reason. Showcasing this set of slides titled HR Recruitment Dashboard Kpis With Decline Reasons Ppt Pictures Example Introduction PDF. The topics addressed in these templates are Recruitment Funnel, HR Recruitment, Dashboard Kpis. All the content presented in this PPT design is completely editable. Download it and make adjustments in color, background, font etc. as per your unique business setting.
HR Recruitment Dashboard Kpis With Recruitment Cost Ppt Inspiration Icons PDF
This slide showcases the recruitment dashboard of company of Hr department. It include time to hire days, cost, source, department, funnel no. of applications, male female ratio. Showcasing this set of slides titled HR Recruitment Dashboard Kpis With Recruitment Cost Ppt Inspiration Icons PDF. The topics addressed in these templates are Recruitment Funnel, Operational Dashboard, Application Date. All the content presented in this PPT design is completely editable. Download it and make adjustments in color, background, font etc. as per your unique business setting.
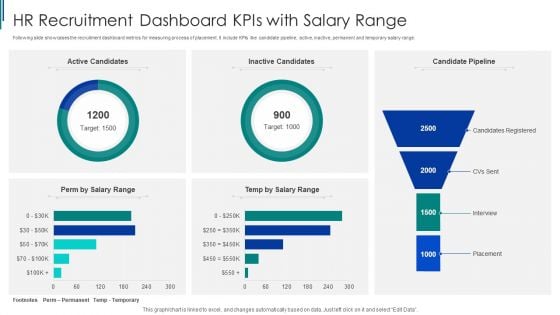
HR Recruitment Dashboard Kpis With Salary Range Ppt Inspiration Rules PDF
Following slide showcases the recruitment dashboard metrics for measuring process of placement. It include KPIs like candidate pipeline, active, inactive, permanent and temporary salary range. Pitch your topic with ease and precision using this HR Recruitment Dashboard Kpis With Salary Range Ppt Inspiration Rules PDF. This layout presents information on HR Recruitment, Dashboard Kpis, Salary Range. It is also available for immediate download and adjustment. So, changes can be made in the color, design, graphics or any other component to create a unique layout.
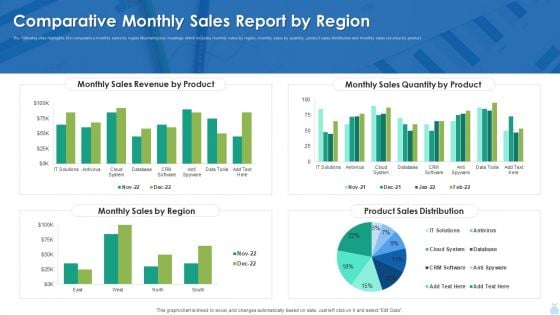
Comparative Monthly Sales Report By Region Graphics PDF
The following slide highlights the comparative monthly sales by region illustrating key headings which includes monthly sales by region, monthly sales by quantity, product sales distribution and monthly sales revenue by product. Showcasing this set of slides titled Comparative Monthly Sales Report By Region Graphics PDF. The topics addressed in these templates are Sales Revenue, Monthly Sales Quantity, Product Sales Distribution. All the content presented in this PPT design is completely editable. Download it and make adjustments in color, background, font etc. as per your unique business setting.
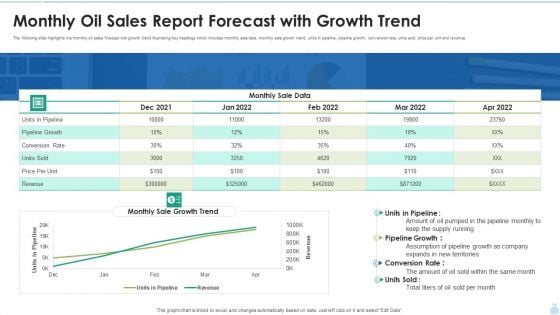
Monthly Oil Sales Report Forecast With Growth Trend Graphics PDF
The following slide highlights the monthly oil sales forecast with growth trend illustrating key headings which includes monthly sale data, monthly sale growth trend, units in pipeline, pipeline growth, conversion rate, units sold, price per unit and revenue. Showcasing this set of slides titled Monthly Oil Sales Report Forecast With Growth Trend Graphics PDF. The topics addressed in these templates are Pipeline Growth, Monthly Sale Data, Conversion Rate. All the content presented in this PPT design is completely editable. Download it and make adjustments in color, background, font etc. as per your unique business setting.
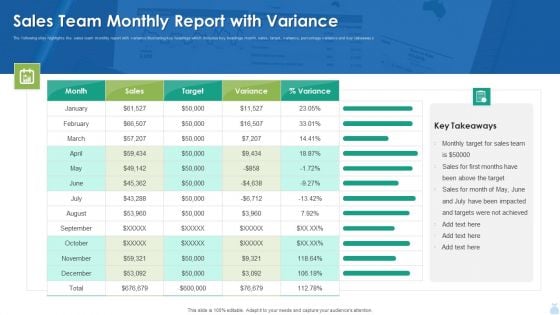
Sales Team Monthly Report With Variance Background PDF
The following slide highlights the sales team monthly report with variance illustrating key headings which includes key headings month, sales, target, variance, percentage variance and key takeaways. Pitch your topic with ease and precision using this Sales Team Monthly Report With Variance Background PDF. This layout presents information on Sales Team Monthly Report With Variance Background PDF. It is also available for immediate download and adjustment. So, changes can be made in the color, design, graphics or any other component to create a unique layout.
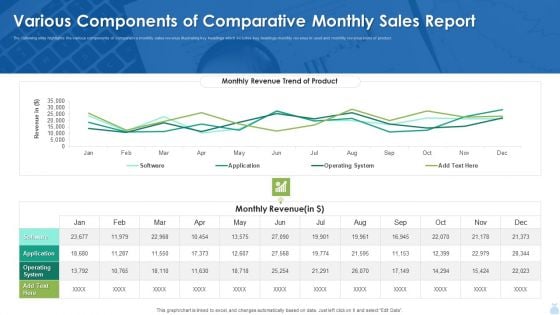
Various Components Of Comparative Monthly Sales Report Inspiration PDF
The following slide highlights the various components of comparative monthly sales revenue illustrating key headings which includes key headings monthly revenue in used and monthly revenue trend of product. Showcasing this set of slides titled Various Components Of Comparative Monthly Sales Report Inspiration PDF. The topics addressed in these templates are Various Components Of Comparative Monthly Sales Report Inspiration PDF. All the content presented in this PPT design is completely editable. Download it and make adjustments in color, background, font etc. as per your unique business setting.
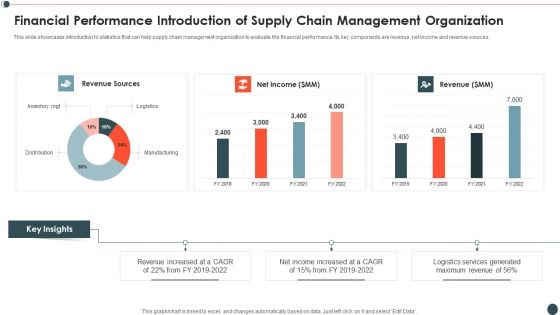
Financial Performance Introduction Of Supply Chain Management Organization Infographics PDF
This slide showcases introduction to statistics that can help supply chain management organization to evaluate the financial performance. Its key components are revenue, net income and revenue sources.Pitch your topic with ease and precision using this Financial Performance Introduction Of Supply Chain Management Organization Infographics PDF This layout presents information on Revenue Sources, Revenue Increased, Income Increased It is also available for immediate download and adjustment. So, changes can be made in the color, design, graphics or any other component to create a unique layout.
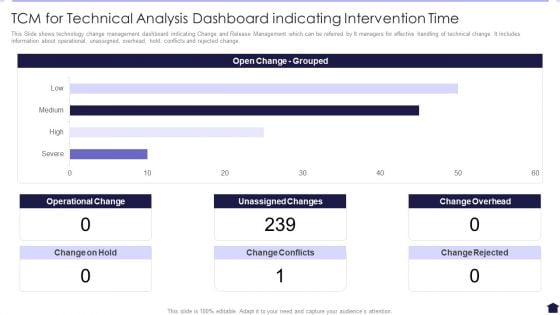
TCM For Technical Analysis Dashboard Indicating Intervention Time Background PDF
This Slide shows technology change management dashboard indicating Change and Release Management which can be referred by It managers for effective handling of technical change. It includes information about operational, unassigned, overhead, hold, conflicts and rejected change. Showcasing this set of slides titled TCM For Technical Analysis Dashboard Indicating Intervention Time Background PDF. The topics addressed in these templates are Operational Change, Unassigned Changes, Change Overhead. All the content presented in this PPT design is completely editable. Download it and make adjustments in color, background, font etc. as per your unique business setting.
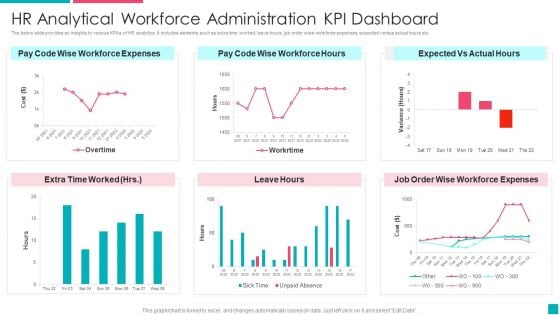
HR Analytical Workforce Administration Kpi Dashboard Introduction PDF
The below slide provides an insights to various KPAs of HR analytics. It includes elements such as extra time worked, leave hours, job order wise workforce expenses, expected versus actual hours etc. Showcasing this set of slides titled HR Analytical Workforce Administration Kpi Dashboard Introduction PDF. The topics addressed in these templates are Workforce Expenses, Administration KPI Dashboard. All the content presented in this PPT design is completely editable. Download it and make adjustments in color, background, font etc. as per your unique business setting.
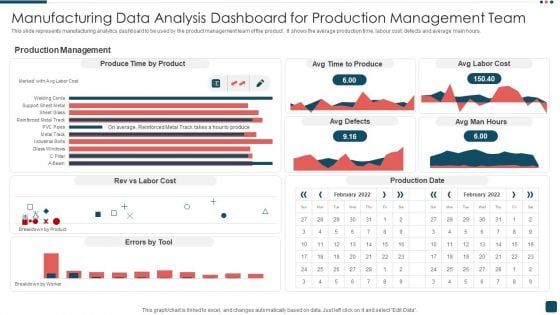
Manufacturing Data Analysis Dashboard For Production Management Team Summary PDF
This slide represents manufacturing analytics dashboard to be used by the product management team of the product . It shows the average production time, labour cost, defects and average main hours. Pitch your topic with ease and precision using this Manufacturing Data Analysis Dashboard For Production Management Team Summary PDF. This layout presents information on Production Management, Product, Cost. It is also available for immediate download and adjustment. So, changes can be made in the color, design, graphics or any other component to create a unique layout.
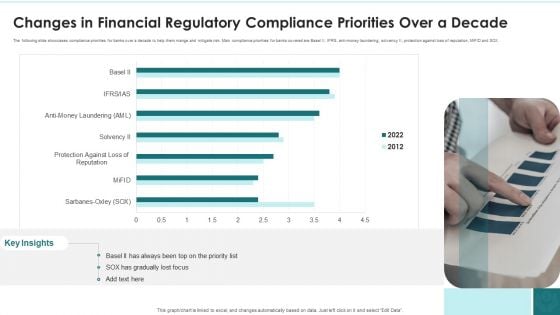
Changes In Financial Regulatory Compliance Priorities Over A Decade Template PDF
The following slide showcases compliance priorities for banks over a decade to help them mange and mitigate risk. Main compliance priorities for banks covered are Basel II, IFRS, anti-money laundering, solvency II, protection against loss of reputation, MiFID and SOX.Showcasing this set of slides titled Changes In Financial Regulatory Compliance Priorities Over A Decade Template PDF The topics addressed in these templates are Protection Against, Loss Reputation, Money Laundering All the content presented in this PPT design is completely editable. Download it and make adjustments in color, background, font etc. as per your unique business setting.
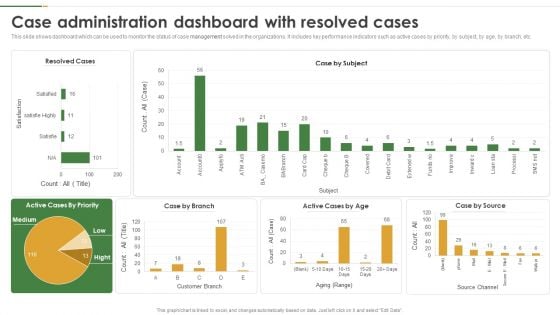
Case Administration Dashboard With Resolved Cases Graphics PDF
This slide shows dashboard which can be used to monitor the status of case management solved in the organizations. It includes key performance indicators such as active cases by priority, by subject, by age, by branch, etc. Pitch your topic with ease and precision using this Case Administration Dashboard With Resolved Cases Graphics PDF. This layout presents information on Case Administration Dashboard, Resolved Cases. It is also available for immediate download and adjustment. So, changes can be made in the color, design, graphics or any other component to create a unique layout.
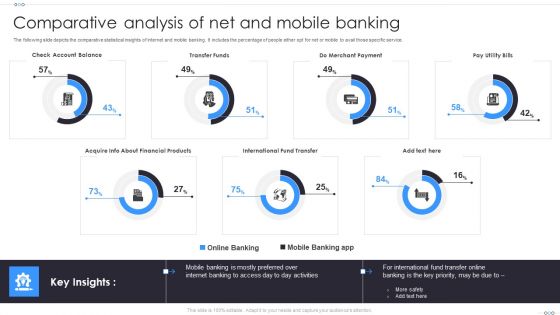
Comparative Analysis Of Net And Mobile Banking Template PDF
The following slide depicts the comparative statistical insights of internet and mobile banking. It includes the percentage of people either opt for net or mobile to avail those specific service. Showcasing this set of slides titled Comparative Analysis Of Net And Mobile Banking Template PDF. The topics addressed in these templates are Transfer Funds, Merchant Payment, International Fund Transfer. All the content presented in this PPT design is completely editable. Download it and make adjustments in color, background, font etc. as per your unique business setting.

Home Insurance Analytics Statistics With Settlement Time Dashboard Ideas PDF
This slide illustrates home insurance facts and figures of the organization. It includes monthly claim volume, claim status, average notification time, acknowledged time, decision time etc. Pitch your topic with ease and precision using this Home Insurance Analytics Statistics With Settlement Time Dashboard Ideas PDF. This layout presents information on Average Acknowledged Time, Average Decision Time, Average Lead Time. It is also available for immediate download and adjustment. So, changes can be made in the color, design, graphics or any other component to create a unique layout.
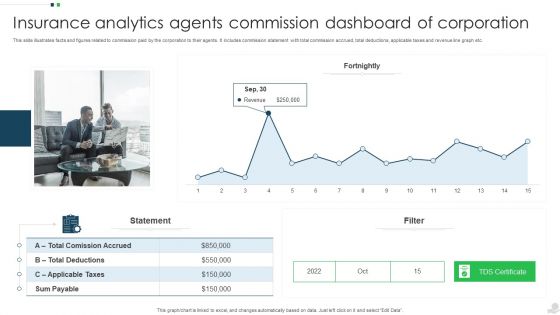
Insurance Analytics Agents Commission Dashboard Of Corporation Introduction PDF
This slide illustrates facts and figures related to commission paid by the corporation to their agents. It includes commission statement with total commission accrued, total deductions, applicable taxes and revenue line graph etc. Pitch your topic with ease and precision using this Insurance Analytics Agents Commission Dashboard Of Corporation Introduction PDF. This layout presents information on Applicable Taxes, Sum Payable, Revenue. It is also available for immediate download and adjustment. So, changes can be made in the color, design, graphics or any other component to create a unique layout.
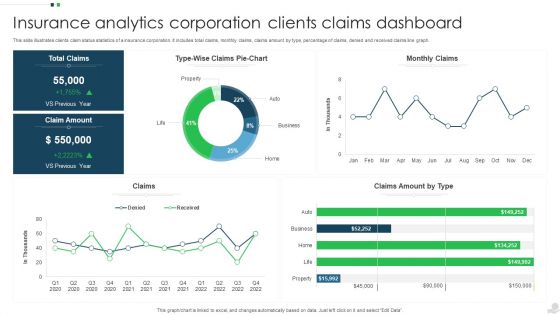
Insurance Analytics Corporation Clients Claims Dashboard Summary PDF
This slide illustrates clients claim status statistics of a insurance corporation. It includes total claims, monthly claims, claims amount by type, percentage of claims, denied and received claims line graph. Showcasing this set of slides titled Insurance Analytics Corporation Clients Claims Dashboard Summary PDF. The topics addressed in these templates are Insurance Analytics Corporation, Clients Claims Dashboard. All the content presented in this PPT design is completely editable. Download it and make adjustments in color, background, font etc. as per your unique business setting.
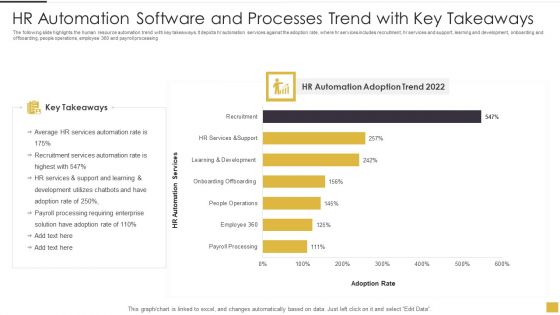
HR Automation Software And Processes Trend With Key Takeaways Themes PDF
The following slide highlights the human resource automation trend with key takeaways. It depicts hr automation services against the adoption rate, where hr services includes recruitment, hr services and support, learning and development, onboarding and offboarding, people operations, employee 360 and payroll processing. Showcasing this set of slides titled HR Automation Software And Processes Trend With Key Takeaways Themes PDF. The topics addressed in these templates are Average, Services Automation Rate, Requiring Enterprise. All the content presented in this PPT design is completely editable. Download it and make adjustments in color, background, font etc. as per your unique business setting.
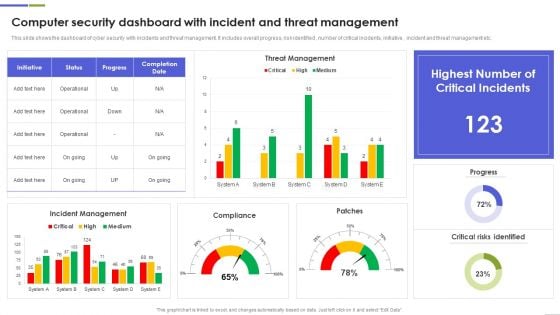
Computer Security Dashboard With Incident And Threat Management Rules PDF
This slide shows the dashboard of cyber security with incidents and threat management. It includes overall progress, risk identified , number of critical incidents, initiative , incident and threat management etc.Showcasing this set of slides titled Computer Security Dashboard With Incident And Threat Management Rules PDF The topics addressed in these templates are Critical Incidents, Risks Identified, Compliance All the content presented in this PPT design is completely editable. Download it and make adjustments in color, background, font etc. as per your unique business setting.
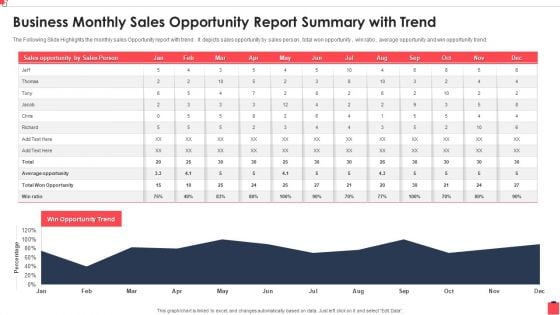
Business Monthly Sales Opportunity Report Summary With Trend Professional PDF
The Following Slide Highlights the monthly sales Opportunity report with trend . It depicts sales opportunity by sales person , total won opportunity , win ratio , average opportunity and win opportunity trend.Showcasing this set of slides titled Business Monthly Sales Opportunity Report Summary With Trend Professional PDF The topics addressed in these templates are Average Opportunity, Won Opportunity, Sales Opportunity All the content presented in this PPT design is completely editable. Download it and make adjustments in color, background, font etc. as per your unique business setting.
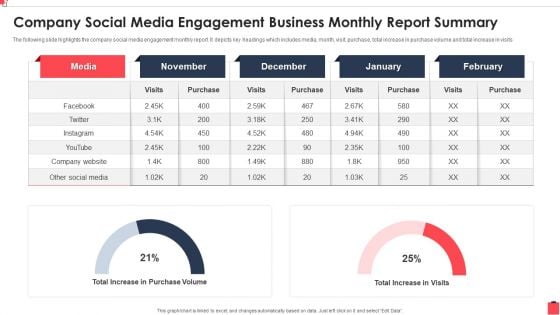
Company Social Media Engagement Business Monthly Report Summary Mockup PDF
The following slide highlights the company social media engagement monthly report. It depicts key headings which includes media, month, visit, purchase, total increase in purchase volume and total increase in visits.Pitch your topic with ease and precision using this Company Social Media Engagement Business Monthly Report Summary Mockup PDF This layout presents information on Total Increase, Company Website, Purchase Volume It is also available for immediate download and adjustment. So, changes can be made in the color, design, graphics or any other component to create a unique layout.
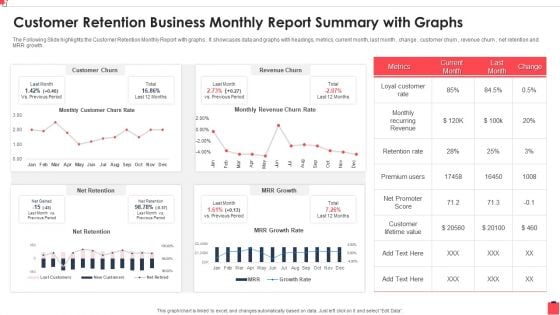
Customer Retention Business Monthly Report Summary With Graphs Guidelines PDF
The Following Slide highlights the Customer Retention Monthly Report with graphs . It showcases data and graphs with headings, metrics, current month, last month , change , customer churn , revenue churn , net retention and MRR growth. Showcasing this set of slides titled Customer Retention Business Monthly Report Summary With Graphs Guidelines PDF The topics addressed in these templates are Recurring Revenue, Customer Churn, Promoter Score All the content presented in this PPT design is completely editable. Download it and make adjustments in color, background, font etc. as per your unique business setting.
Weekly Tracking Dashboard For Social Media Content Inspiration PDF
This slide showcases weekly content tracking dashboard that can help organization to track the statistics of social media blogs and videos. Its key components are avg impressions per post, avg reach per post, avg engagement rate and avg click through rate.Showcasing this set of slides titled Weekly Tracking Dashboard For Social Media Content Inspiration PDF The topics addressed in these templates are Impressions Per, Impression On Facebook, Posts Reactions All the content presented in this PPT design is completely editable. Download it and make adjustments in color, background, font etc. as per your unique business setting.
Yearly Outcomes Summary Of Profit And Loss Trends Icons PDF
This slide shows the graphical representation of result summary of profit and loss trends for five consecutive years that shows revenues, cost of goods sold, selling, general and administrative expenses, net income, etc.Pitch your topic with ease and precision using this Yearly Outcomes Summary Of Profit And Loss Trends Icons PDF This layout presents information on Earned Maximum, Selling General, Administrative Expenses It is also available for immediate download and adjustment. So, changes can be made in the color, design, graphics or any other component to create a unique layout.
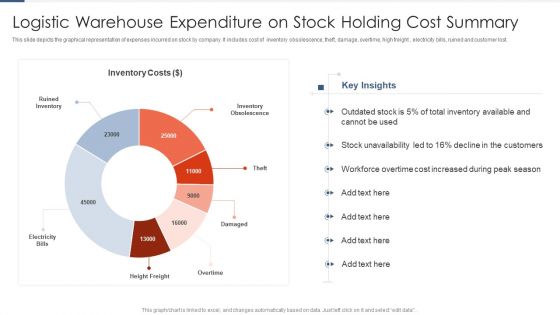
Logistic Warehouse Expenditure On Stock Holding Cost Summary Slides PDF
This slide depicts the graphical representation of expenses incurred on stock by company. It includes cost of inventory obsolescence, theft, damage, overtime, high freight , electricity bills, ruined and customer lost.Showcasing this set of slides titled Logistic Warehouse Expenditure On Stock Holding Cost Summary Slides PDF. The topics addressed in these templates are Inventory Available, Stock Unavailability, Cost Increased. All the content presented in this PPT design is completely editable. Download it and make adjustments in color, background, font etc. as per your unique business setting.
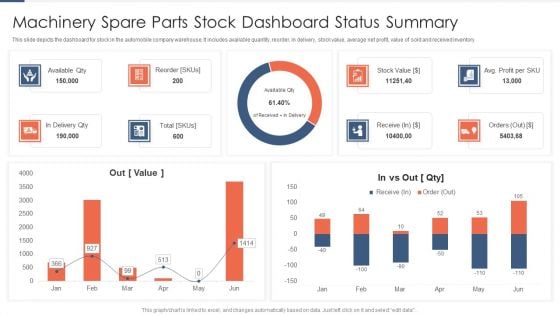
Machinery Spare Parts Stock Dashboard Status Summary Topics PDF
This slide depicts the dashboard for stock in the automobile company warehouse. It includes available quantity, reorder, in delivery, stock value, average net profit, value of sold and received inventory. Pitch your topic with ease and precision using this Machinery Spare Parts Stock Dashboard Status Summary Topics PDF. This layout presents information on Available Qty, Delivery Qty, Reorder. It is also available for immediate download and adjustment. So, changes can be made in the color, design, graphics or any other component to create a unique layout.
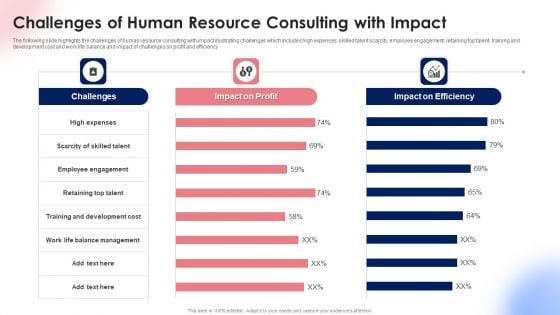
Challenges Of Human Resource Consulting With Impact Ppt Styles Layout PDF
The following slide highlights the challenges of human resource consulting with impact illustrating challenges which includes high expenses, skilled talent scarcity, employee engagement, retaining top talent, training and development cost and work life balance and impact of challenges on profit and efficiency. Showcasing this set of slides titled Challenges Of Human Resource Consulting With Impact Ppt Styles Layout PDF. The topics addressed in these templates are Challenges, Impact On Profit, Impact On Efficiency. All the content presented in this PPT design is completely editable. Download it and make adjustments in color, background, font etc. as per your unique business setting.
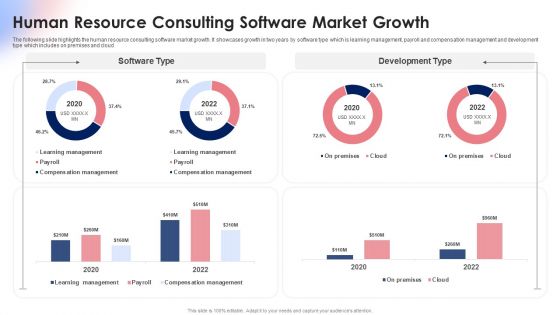
Human Resource Consulting Software Market Growth Ppt Styles Show PDF
The following slide highlights the human resource consulting software market growth. It showcases growth in two years by software type which is learning management, payroll and compensation management and development type which includes on premises and cloud. Pitch your topic with ease and precision using this Human Resource Consulting Software Market Growth Ppt Styles Show PDF. This layout presents information on Software Type, Development Type, Compensation Management, Learning Management. It is also available for immediate download and adjustment. So, changes can be made in the color, design, graphics or any other component to create a unique layout.
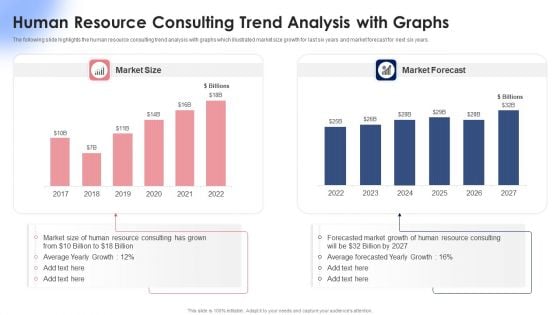
Human Resource Consulting Trend Analysis With Graphs Ppt Summary Clipart Images PDF
The following slide highlights the human resource consulting trend analysis with graphs which illustrated market size growth for last six years and market forecast for next six years. Pitch your topic with ease and precision using this Human Resource Consulting Trend Analysis With Graphs Ppt Summary Clipart Images PDF. This layout presents information on Market Size, Market Forecast, 2017 To 2022. It is also available for immediate download and adjustment. So, changes can be made in the color, design, graphics or any other component to create a unique layout.
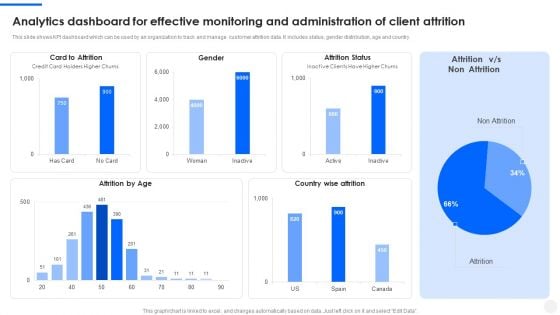
Analytics Dashboard For Effective Monitoring And Administration Of Client Attrition Portrait PDF
This slide shows KPI dashboard which can be used by an organization to track and manage customer attrition data. It includes status, gender distribution, age and country. Showcasing this set of slides titled Analytics Dashboard For Effective Monitoring And Administration Of Client Attrition Portrait PDF. The topics addressed in these templates are Attrition Status, Card To Attrition, Country Wise Attrition. All the content presented in this PPT design is completely editable. Download it and make adjustments in color, background, font etc. as per your unique business setting.
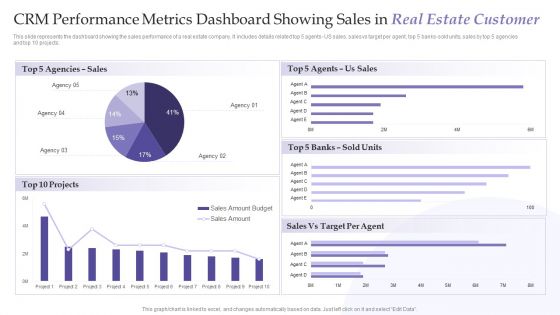
CRM Performance Metrics Dashboard Showing Sales In Real Estate Customer Information PDF
This slide represents the dashboard showing the sales performance of a real estate company. It includes details related top 5 agents US sales, sales vs target per agent, top 5 banks-sold units, sales by top 5 agencies. Pitch your topic with ease and precision using this CRM Performance Metrics Dashboard Showing Sales In Real Estate Customer Information PDF. This layout presents information on Us Sales, Sold Units, Target Per Agent. It is also available for immediate download and adjustment. So, changes can be made in the color, design, graphics or any other component to create a unique layout.
Pipeline Tracking And Management By Real Estate Customer Relationship Management Brochure PDF
This slide represents the report prepared with the help of CRM software for real estate company to track and manage companys sales pipeline. It includes details related to region wise conversion, lead source analysis, accounts analytics etc. Pitch your topic with ease and precision using this Pipeline Tracking And Management By Real Estate Customer Relationship Management Brochure PDF. This layout presents information on Conversion Rate, Lead Source Analysis, Wise Conversion. It is also available for immediate download and adjustment. So, changes can be made in the color, design, graphics or any other component to create a unique layout.
HR Dashboard To Tackle Low Output Icons PDF
This slide depicts the dashboard used by human resource management to track employee productivity rate and identify bottlenecks in performance. It includes status of tickets, occupancy and resolution rate, net promoter score and track of agents solving tickets. Showcasing this set of slides titled HR Dashboard To Tackle Low Output Icons PDF. The topics addressed in these templates are Resolution Rate, Occupancy Rate, Net Promoter Score. All the content presented in this PPT design is completely editable. Download it and make adjustments in color, background, font etc. as per your unique business setting.
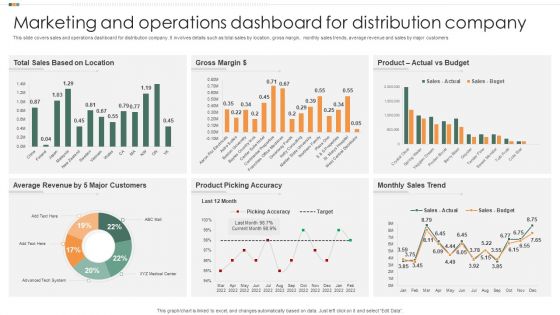
Marketing And Operations Dashboard For Distribution Company Guidelines PDF
This slide covers sales and operations dashboard for distribution company. It involves details such as total sales by location, gross margin, monthly sales trends, average revenue and sales by major customers. Pitch your topic with ease and precision using this Marketing And Operations Dashboard For Distribution Company Guidelines PDF. This layout presents information on Gross Margin, Actual Vs Budget, Product. It is also available for immediate download and adjustment. So, changes can be made in the color, design, graphics or any other component to create a unique layout.
Marketing And Operations Dashboard For Ecommerce Business Icons PDF
This slide covers sales and operations dashboard for ecommerce business. It involves details such as total sales generated, number of brands, total revenue generated, number of units sold and gender and age range breakdown. Showcasing this set of slides titled Marketing And Operations Dashboard For Ecommerce Business Icons PDF. The topics addressed in these templates are Total Sales Generated, Total Revenue Generated, Returning Consumers. All the content presented in this PPT design is completely editable. Download it and make adjustments in color, background, font etc. as per your unique business setting.
Marketing And Operations Dashboard For Performance Management Icons PDF
This slide covers sales and operation dashboard for performance management. It involves details such as number of new buyers, sales revenue, average revenue per unit etc. Pitch your topic with ease and precision using this Marketing And Operations Dashboard For Performance Management Icons PDF. This layout presents information on Average Revenue Per Unit, Customer Acquisition Cost, Customer Lifetime Value. It is also available for immediate download and adjustment. So, changes can be made in the color, design, graphics or any other component to create a unique layout.

Marketing And Operations Dashboard To Drive Effective Productivity Background PDF
This slide covers sales and operations dashboard to drive effective productivity. It involves details such as number of account assigned, working accounts, engaged accounts and total account activity. Pitch your topic with ease and precision using this Marketing And Operations Dashboard To Drive Effective Productivity Background PDF. This layout presents information on Total Account Activity, Number Of Working Account, Engaged Account. It is also available for immediate download and adjustment. So, changes can be made in the color, design, graphics or any other component to create a unique layout.
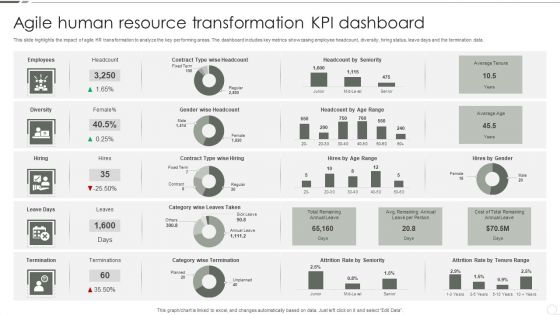
Agile Human Resource Transformation KPI Dashboard Microsoft PDF
This slide highlights the impact of agile HR transformation to analyze the key performing areas. The dashboard includes key metrics showcasing employee headcount, diversity, hiring status, leave days and the termination data. Showcasing this set of slides titled Agile Human Resource Transformation KPI Dashboard Microsoft PDF. The topics addressed in these templates are Employees, Diversity, Hiring, Leave Days, Termination. All the content presented in this PPT design is completely editable. Download it and make adjustments in color, background, font etc. as per your unique business setting.
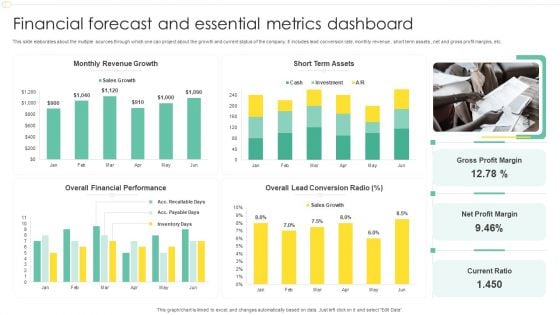
Financial Forecast And Essential Metrics Dashboard Ppt File Show PDF
This slide elaborates about the multiple sources through which one can project about the growth and current status of the company. It includes lead conversion rate, monthly revenue , short term assets , net and gross profit margins, etc. Pitch your topic with ease and precision using this Financial Forecast And Essential Metrics Dashboard Ppt File Show PDF. This layout presents information on Monthly Revenue Growth, Short Term Assets, Overall Financial Performance, Net Profit Margin. It is also available for immediate download and adjustment. So, changes can be made in the color, design, graphics or any other component to create a unique layout.
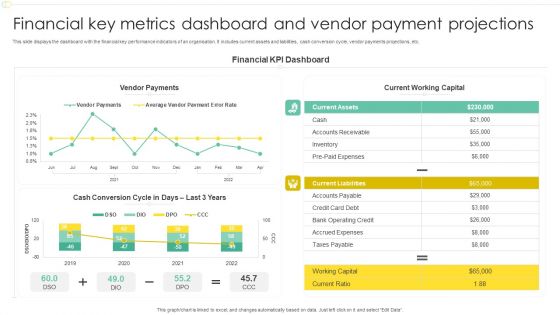
Financial Key Metrics Dashboard And Vendor Payment Projections Professional PDF
This slide displays the dashboard with the financial key performance indicators of an organisation. It includes current assets and liabilities, cash conversion cycle, vendor payments projections, etc. Pitch your topic with ease and precision using this Financial Key Metrics Dashboard And Vendor Payment Projections Professional PDF. This layout presents information on Financial KPI Dashboard, Current Working Capital, Vendor Payments. It is also available for immediate download and adjustment. So, changes can be made in the color, design, graphics or any other component to create a unique layout.
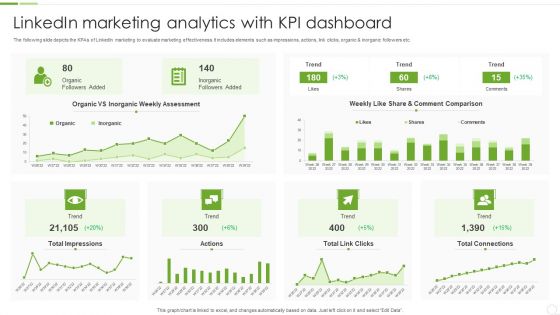
Linkedin Marketing Analytics With KPI Dashboard Ppt PowerPoint Presentation File Inspiration PDF
The following slide depicts the KPAs of LinkedIn marketing to evaluate marketing effectiveness. It includes elements such as impressions, actions, link clicks, organic and inorganic followers etc. Showcasing this set of slides titled Linkedin Marketing Analytics With KPI Dashboard Ppt PowerPoint Presentation File Inspiration PDF. The topics addressed in these templates are Total Impressions, Total Connections, Inorganic Followers Added. All the content presented in this PPT design is completely editable. Download it and make adjustments in color, background, font etc. as per your unique business setting.
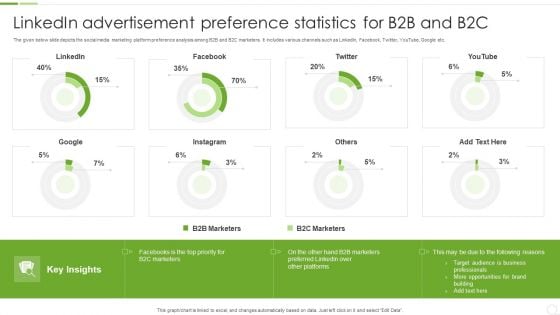
Linkedin Advertisement Preference Statistics For B2B And B2C Ppt Visual Aids Professional PDF
The given below slide depicts the social media marketing platform preference analysis among B2B and B2C marketers. It includes various channels such as LinkedIn, Facebook, Twitter, YouTube, Google etc. Pitch your topic with ease and precision using this Linkedin Advertisement Preference Statistics For B2B And B2C Ppt Visual Aids Professional PDF. This layout presents information on B2B Marketers, B2C Marketers, Target Audience. It is also available for immediate download and adjustment. So, changes can be made in the color, design, graphics or any other component to create a unique layout.
Saas Cloud Security Analysis With KPI Dashboard Ppt PowerPoint Presentation Icon Slides PDF
The following slide highlights the assessment of Software as a security to meet safety standards. It includes key elements such as critical incidents, risk analysis, number of open tasks etc. Pitch your topic with ease and precision using this Saas Cloud Security Analysis With KPI Dashboard Ppt PowerPoint Presentation Icon Slides PDF. This layout presents information on Quarterly Incident Severity, Incident Risk Analysis, Critical Incidents. It is also available for immediate download and adjustment. So, changes can be made in the color, design, graphics or any other component to create a unique layout.
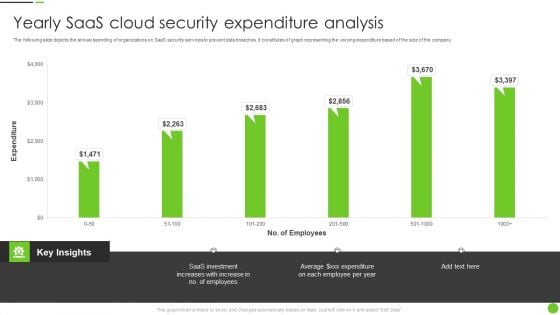
Yearly Saas Cloud Security Expenditure Analysis Ppt PowerPoint Presentation File Deck PDF
The following slide depicts the annual spending of organizations on SaaS security services to prevent data breaches. It constitutes of graph representing the varying expenditure based of the size of the company. Pitch your topic with ease and precision using this Yearly Saas Cloud Security Expenditure Analysis Ppt PowerPoint Presentation File Deck PDF. This layout presents information on Saas Investment, Employees. It is also available for immediate download and adjustment. So, changes can be made in the color, design, graphics or any other component to create a unique layout.
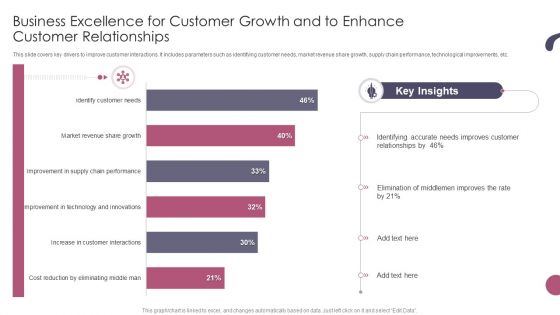
Business Excellence For Customer Growth And To Enhance Customer Relationships Ppt Infographic Template Styles PDF
This slide covers key drivers to improve customer interactions. It includes parameters such as identifying customer needs, market revenue share growth, supply chain performance, technological improvements, etc. Pitch your topic with ease and precision using this Business Excellence For Customer Growth And To Enhance Customer Relationships Ppt Infographic Template Styles PDF. This layout presents information on Business Excellence, Customer Growth, Customer Relationships. It is also available for immediate download and adjustment. So, changes can be made in the color, design, graphics or any other component to create a unique layout.
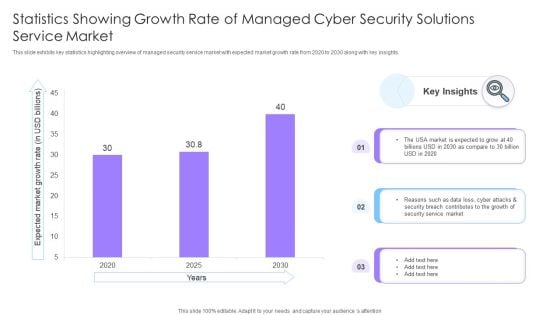
Statistics Showing Growth Rate Of Managed Cyber Security Solutions Service Market Ppt Show Inspiration PDF
This slide exhibits key statistics highlighting overview of managed security service market with expected market growth rate from 2020 to 2030 along with key insights. Pitch your topic with ease and precision using this Statistics Showing Growth Rate Of Managed Cyber Security Solutions Service Market Ppt Show Inspiration PDF. This layout presents information on Statistics Showing Growth, Cyber Security, Solutions Service Market. It is also available for immediate download and adjustment. So, changes can be made in the color, design, graphics or any other component to create a unique layout.
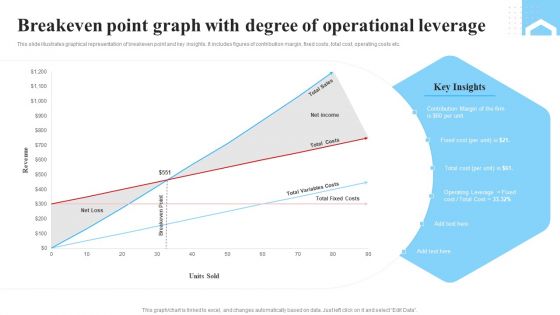
Breakeven Point Graph With Degree Of Operational Leverage Ppt Layouts Graphics Pictures PDF
This slide illustrates graphical representation of breakeven point and key insights. It includes figures of contribution margin, fixed costs, total cost, operating costs etc. Showcasing this set of slides titled Breakeven Point Graph With Degree Of Operational Leverage Ppt Layouts Graphics Pictures PDF. The topics addressed in these templates are Total Sales, Net income, Total Costs, Total Variables Costs. All the content presented in this PPT design is completely editable. Download it and make adjustments in color, background, font etc. as per your unique business setting.
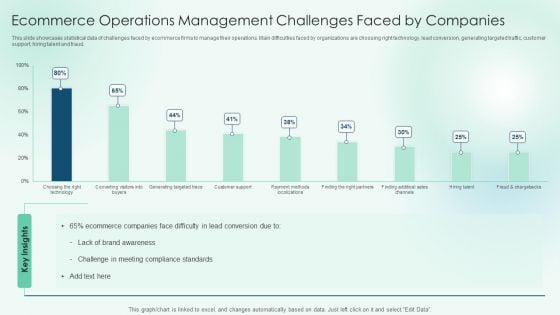
Ecommerce Operations Management Challenges Faced By Companies Slides PDF
This slide showcases statistical data of challenges faced by ecommerce firms to manage their operations. Main difficulties faced by organizations are choosing right technology, lead conversion, generating targeted traffic, customer support, hiring talent and fraud.Showcasing this set of slides titled Ecommerce Operations Management Challenges Faced By Companies Slides PDF. The topics addressed in these templates are Ecommerce Companies, Brand Awareness, Compliance Standards. All the content presented in this PPT design is completely editable. Download it and make adjustments in color, background, font etc. as per your unique business setting.
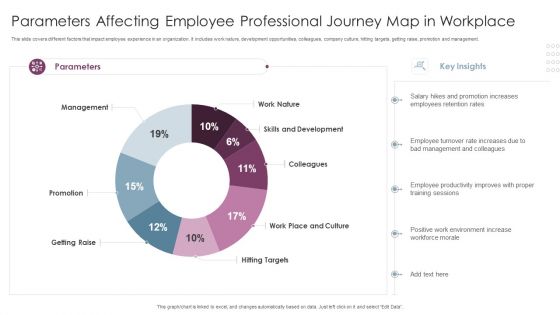
Parameters Affecting Employee Professional Journey Map In Workplace Download PDF
This slide covers different factors that impact employee experience in an organization. It includes work nature, development opportunities, colleagues, company culture, hitting targets, getting raise, promotion and management. Pitch your topic with ease and precision using this Parameters Affecting Employee Professional Journey Map In Workplace Download PDF. This layout presents information on Management, Promotion, Getting Raise, Hitting Targets. It is also available for immediate download and adjustment. So, changes can be made in the color, design, graphics or any other component to create a unique layout.
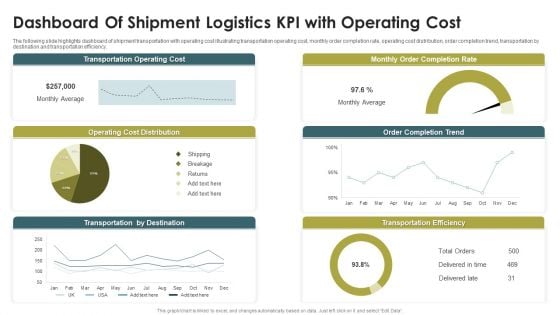
Dashboard Of Shipment Logistics KPI With Operating Cost Ppt Styles Example Topics PDF
The following slide highlights dashboard of shipment transportation with operating cost illustrating transportation operating cost, monthly order completion rate, operating cost distribution, order completion trend, transportation by destination and transportation efficiency. Showcasing this set of slides titled Dashboard Of Shipment Logistics KPI With Operating Cost Ppt Styles Example Topics PDF. The topics addressed in these templates are Transportation Operating Cost, Monthly Order, Completion Rate, Operating Cost Distribution. All the content presented in this PPT design is completely editable. Download it and make adjustments in color, background, font etc. as per your unique business setting.

Logistics KPI Status Dashboard With Monthly KPI Ppt Infographic Template Layout PDF
The following slide highlights the transportation status dashboard with monthly KPI illustrating order status with customer, order date and delivery date. It shows financial performance for four quarters as well as todays order, inventory and monthly KPI with Inventory, shipping cost for past 30 days. Pitch your topic with ease and precision using this Logistics KPI Status Dashboard With Monthly KPI Ppt Infographic Template Layout PDF. This layout presents information on Order Status, Today Order, Inventory, Monthly KPI. It is also available for immediate download and adjustment. So, changes can be made in the color, design, graphics or any other component to create a unique layout.
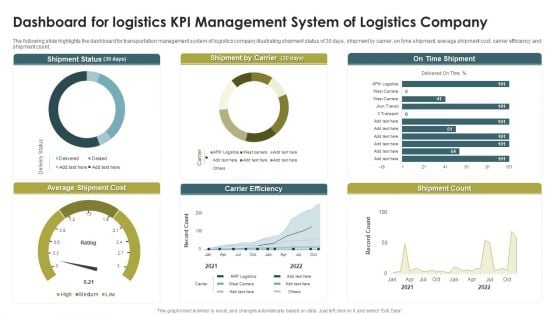
Dashboard For Logistics KPI Management System Of Logistics Company Infographics PDF
The following slide highlights the dashboard for transportation management system of logistics company illustrating shipment status of 30 days, shipment by carrier, on time shipment, average shipment cost, carrier efficiency and shipment count. Pitch your topic with ease and precision using this Dashboard For Logistics KPI Management System Of Logistics Company Infographics PDF. This layout presents information on Shipment Status, Shipment By Carrier, On Time Shipment. It is also available for immediate download and adjustment. So, changes can be made in the color, design, graphics or any other component to create a unique layout.
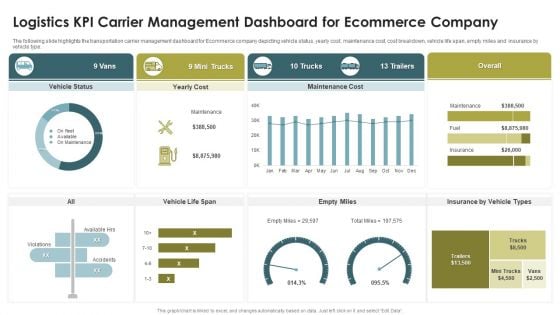
Logistics KPI Carrier Management Dashboard For Ecommerce Company Microsoft PDF
The following slide highlights the transportation carrier management dashboard for Ecommerce company depicting vehicle status, yearly cost, maintenance cost, cost breakdown, vehicle life span, empty miles and insurance by vehicle type. Pitch your topic with ease and precision using this Logistics KPI Carrier Management Dashboard For Ecommerce Company Microsoft PDF. This layout presents information on Mini Trucks, 13 Trailers, Empty Miles, Vehicle Life Span. It is also available for immediate download and adjustment. So, changes can be made in the color, design, graphics or any other component to create a unique layout.
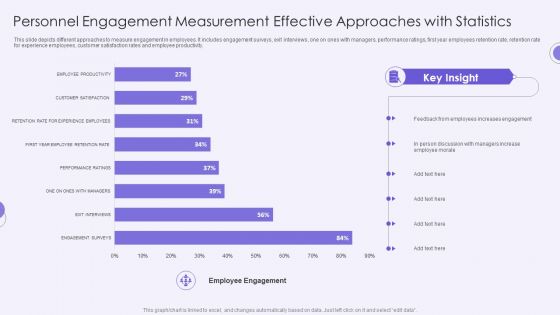
Personnel Engagement Measurement Effective Approaches With Statistics Structure PDF
This slide depicts different approaches to measure engagement in employees. It includes engagement surveys, exit interviews, one on ones with managers, performance ratings, first year employees retention rate, retention rate for experience employees, customer satisfaction rates and employee productivity. Pitch your topic with ease and precision using this Personnel Engagement Measurement Effective Approaches With Statistics Structure PDF. This layout presents information on Employees Increases, Person Discussion, Employee Morale. It is also available for immediate download and adjustment. So, changes can be made in the color, design, graphics or any other component to create a unique layout.
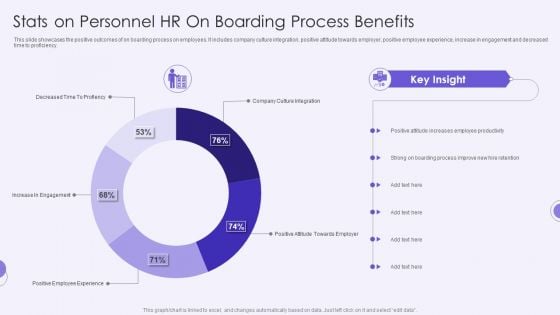
Stats On Personnel HR On Boarding Process Benefits Mockup PDF
This slide showcases the positive outcomes of on boarding process on employees. It includes company culture integration, positive attitude towards employer, positive employee experience, increase in engagement and decreased time to proficiency.Showcasing this set of slides titled Stats On Personnel HR On Boarding Process Benefits Mockup PDF. The topics addressed in these templates are Positive Attitude, Increases Employee, Boarding Process. All the content presented in this PPT design is completely editable. Download it and make adjustments in color, background, font etc. as per your unique business setting.
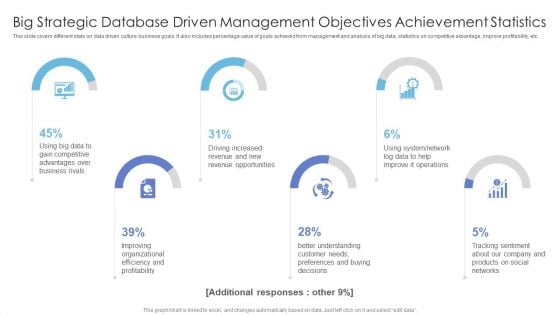
Big Strategic Database Driven Management Objectives Achievement Statistics Professional PDF
This slide covers different stats on data driven culture business goals. It also includes percentage value of goals achieved from management and analysis of big data, statistics on competitive advantage, improve profitability, etc.Showcasing this set of slides titled Big Strategic Database Driven Management Objectives Achievement Statistics Professional PDF. The topics addressed in these templates are Gain Competitive, Driving Increased, Revenue Opportunities. All the content presented in this PPT design is completely editable. Download it and make adjustments in color, background, font etc. as per your unique business setting.
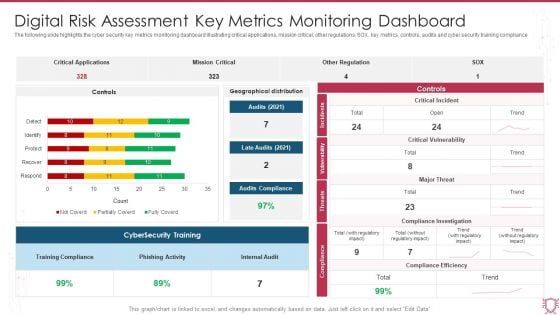
Digital Risk Assessment Key Metrics Monitoring Dashboard Ppt Ideas Diagrams PDF
The following slide highlights the cyber security key metrics monitoring dashboard illustrating critical applications, mission critical, other regulations, SOX, key metrics, controls, audits and cyber security training compliance. Showcasing this set of slides titled Digital Risk Assessment Key Metrics Monitoring Dashboard Ppt Ideas Diagrams PDF. The topics addressed in these templates are Critical Applications, Mission Critical, Other Regulation. All the content presented in this PPT design is completely editable. Download it and make adjustments in color, background, font etc. as per your unique business setting.


 Continue with Email

 Home
Home


