Powerpoint Diagrams
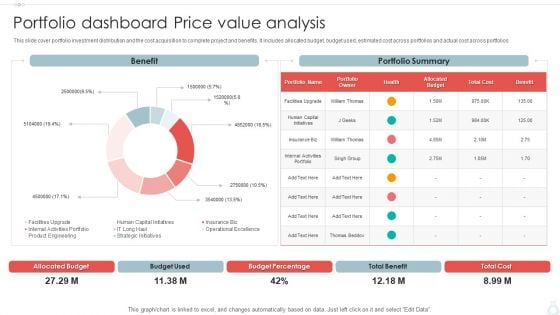
Portfolio Dashboard Price Value Analysis Ppt PowerPoint Presentation Gallery Model PDF
This slide cover portfolio investment distribution and the cost acquisition to complete project and benefits. It includes allocated budget, budget used, estimated cost across portfolios and actual cost across portfolios. Showcasing this set of slides titled Portfolio Dashboard Price Value Analysis Ppt PowerPoint Presentation Gallery Model PDF. The topics addressed in these templates are Portfolio Summary, Budget Percentage, Total Benefit, Total Cost. All the content presented in this PPT design is completely editable. Download it and make adjustments in color, background, font etc. as per your unique business setting.
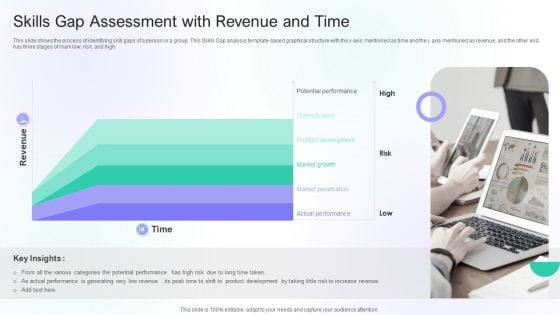
Skills Gap Assessment With Revenue And Time Ppt PowerPoint Presentation Infographics Format PDF
This slide shows the process of identifying skill gaps of a person or a group. This Skills Gap analysis template-based graphical structure with the x axis mentioned as time and the y axis mentioned as revenue, and the other end has three stages of mark low, risk, and high. Showcasing this set of slides titled Skills Gap Assessment With Revenue And Time Ppt PowerPoint Presentation Infographics Format PDF. The topics addressed in these templates are Potential Performance, Product Development, Market Penetration. All the content presented in this PPT design is completely editable. Download it and make adjustments in color, background, font etc. as per your unique business setting.
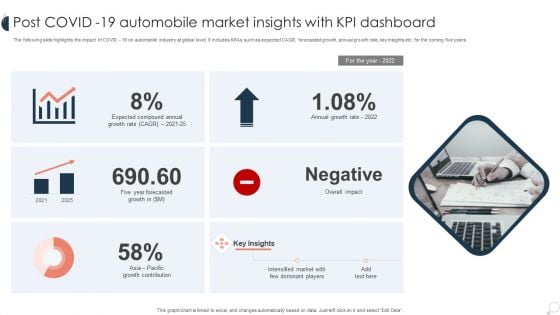
Post COVID 19 Automobile Market Insights With KPI Dashboard Ppt PowerPoint Presentation Slides Background Images PDF
The following slide highlights the impact of COVID 19 on automobile industry at global level. It includes KPAs such as expected CAGR, forecasted growth, annual growth rate, key insights etc. for the coming five years. Showcasing this set of slides titled Post COVID 19 Automobile Market Insights With KPI Dashboard Ppt PowerPoint Presentation Slides Background Images PDF. The topics addressed in these templates are Expected Compound, Annual Growth, Overall Impact. All the content presented in this PPT design is completely editable. Download it and make adjustments in color, background, font etc. as per your unique business setting.
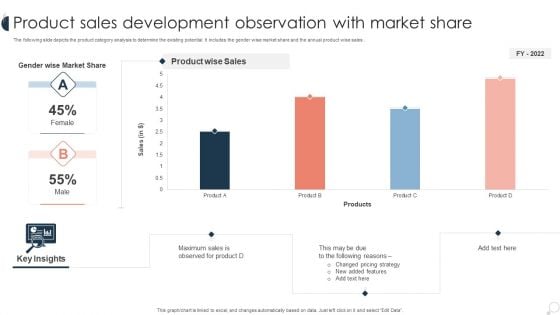
Product Sales Development Observation With Market Share Ppt PowerPoint Presentation Infographic Template Guide PDF
The following slide depicts the product category analysis to determine the existing potential. It includes the gender wise market share and the annual product wise sales . Pitch your topic with ease and precision using this Product Sales Development Observation With Market Share Ppt PowerPoint Presentation Infographic Template Guide PDF. This layout presents information on Changed Pricing, Observed For Product, Product Wise. It is also available for immediate download and adjustment. So, changes can be made in the color, design, graphics or any other component to create a unique layout.
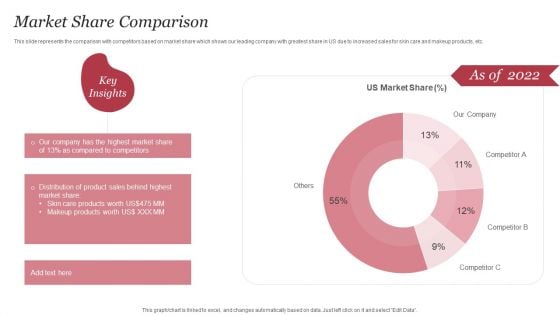
Personal Care Company Profile Market Share Comparison Ppt PowerPoint Presentation Gallery Deck PDF
This slide represents the comparison with competitors based on market share which shows our leading company with greatest share in US due to increased sales for skin care and makeup products, etc. Deliver an awe inspiring pitch with this creative Personal Care Company Profile Market Share Comparison Ppt PowerPoint Presentation Gallery Deck PDF bundle. Topics like US Market Share, Product Sales, Skin Care Products can be discussed with this completely editable template. It is available for immediate download depending on the needs and requirements of the user.

6 Year Revenue Declining Graph Ppt PowerPoint Presentation Outline Sample PDF
This slide shows the revenues of the company over the last years to have a clear idea of organization growth and financial status . It includes the 6 year 2017 to 2022 revenue earned by the company.Showcasing this set of slides titled 6 Year Revenue Declining Graph Ppt PowerPoint Presentation Outline Sample PDF. The topics addressed in these templates are Revenue Company, Highest Comparison, Conditions Restrictions. All the content presented in this PPT design is completely editable. Download it and make adjustments in color, background, font etc. as per your unique business setting.
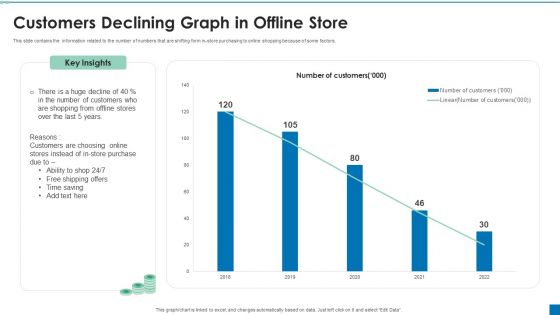
Customers Declining Graph In Offline Store Ppt PowerPoint Presentation Professional Clipart PDF
This slide contains the information related to the number of numbers that are shifting form in-store purchasing to online shopping because of some factors. Pitch your topic with ease and precision using this Customers Declining Graph In Offline Store Ppt PowerPoint Presentation Professional Clipart PDF. This layout presents information on Customers Choosing, Store Purchase, Time Saving. It is also available for immediate download and adjustment. So, changes can be made in the color, design, graphics or any other component to create a unique layout.
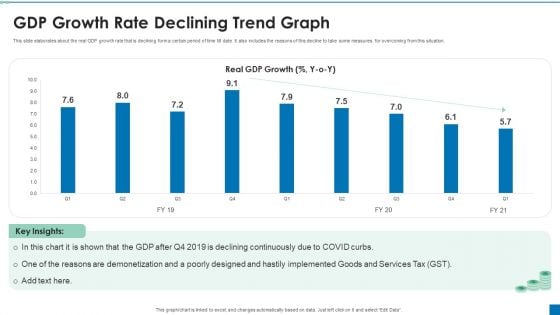
GDP Growth Rate Declining Trend Graph Ppt PowerPoint Presentation Slides Professional PDF
This slide elaborates about the real GDP growth rate that is declining form a certain period of time till date. It also includes the reasons of this decline to take some measures for overcoming from this situation. Showcasing this set of slides titled GDP Growth Rate Declining Trend Graph Ppt PowerPoint Presentation Slides Professional PDF. The topics addressed in these templates are Declining Continuously, Poorly Designed, Reasons Demonetization. All the content presented in this PPT design is completely editable. Download it and make adjustments in color, background, font etc. as per your unique business setting.
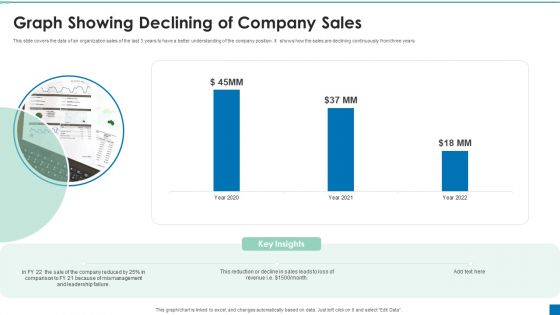
Graph Showing Declining Of Company Sales Ppt PowerPoint Presentation Portfolio Graphics Example PDF
This slide covers the data of an organization sales of the last 3 years to have a better understanding of the company position. It shows how the sales are declining continuously from three years.Pitch your topic with ease and precision using this Graph Showing Declining Of Company Sales Ppt PowerPoint Presentation Portfolio Graphics Example PDF. This layout presents information on Reduction Decline, Comparison, Mismanagement. It is also available for immediate download and adjustment. So, changes can be made in the color, design, graphics or any other component to create a unique layout.
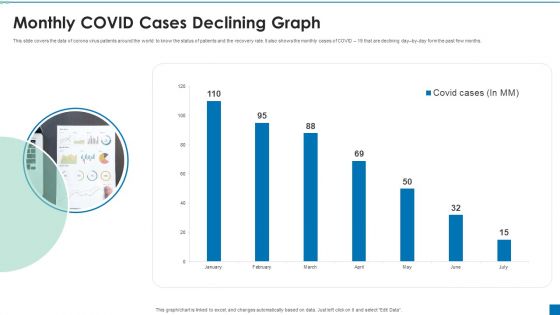
Monthly COVID Cases Declining Graph Ppt PowerPoint Presentation Ideas Slide Portrait PDF
This slide covers the data of corona virus patients around the world to know the status of patients and the recovery rate. It also shows the monthly cases of COVID 19 that are declining day by day form the past few months.Showcasing this set of slides titled Monthly COVID Cases Declining Graph Ppt PowerPoint Presentation Ideas Slide Portrait PDF. The topics addressed in these templates are Monthly Covid Cases, Declining Graph. All the content presented in this PPT design is completely editable. Download it and make adjustments in color, background, font etc. as per your unique business setting.
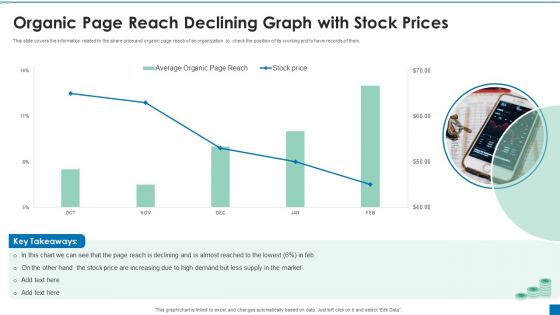
Organic Page Reach Declining Graph With Stock Prices Ppt PowerPoint Presentation Ideas Styles PDF
This slide covers the information related to the share price and organic page reach of an organization to check the position of its working and to have records of them.Pitch your topic with ease and precision using this Organic Page Reach Declining Graph With Stock Prices Ppt PowerPoint Presentation Ideas Styles PDF. This layout presents information on Increasing High, Reach Declining, Supply Market. It is also available for immediate download and adjustment. So, changes can be made in the color, design, graphics or any other component to create a unique layout.
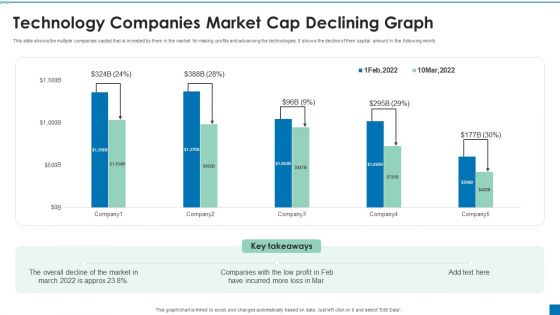
Technology Companies Market Cap Declining Graph Ppt PowerPoint Presentation File Smartart PDF
This slide shows the multiple companies capital that is invested by them in the market for making profits and advancing the technologies. It shows the decline of their capital amount in the following month. Pitch your topic with ease and precision using this Technology Companies Market Cap Declining Graph Ppt PowerPoint Presentation File Smartart PDF. This layout presents information on Overall Decline, Companies Low, Incurred Mor. It is also available for immediate download and adjustment. So, changes can be made in the color, design, graphics or any other component to create a unique layout.
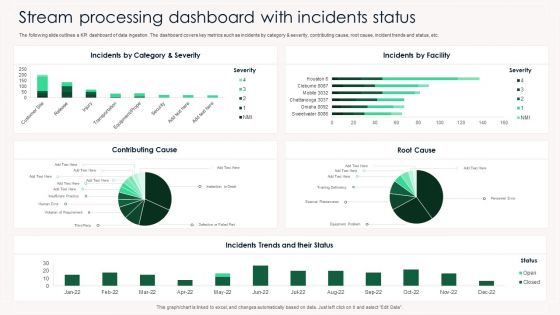
Stream Processing Dashboard With Incidents Status Ppt PowerPoint Presentation Gallery Portrait PDF
The following slide outlines a KPI dashboard of data ingestion. The dashboard covers key metrics such as incidents by category and severity, contributing cause, root cause, incident trends and status, etc. Showcasing this set of slides titled Stream Processing Dashboard With Incidents Status Ppt PowerPoint Presentation Gallery Portrait PDF. The topics addressed in these templates are Incidens, Category And Severity, Incidents By Facility, Contributing Cause. All the content presented in this PPT design is completely editable. Download it and make adjustments in color, background, font etc. as per your unique business setting.
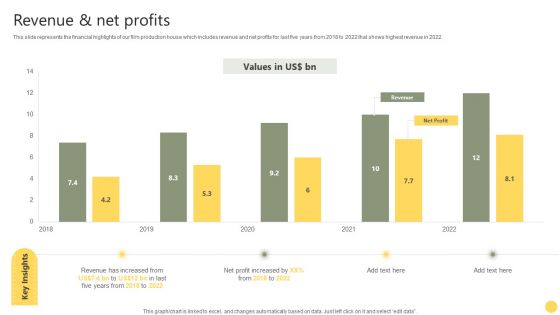
Film Making Firm Profile Revenue And Net Profits Ppt PowerPoint Presentation Gallery Template PDF
This slide represents the financial highlights of our film production house which includes revenue and net profits for last five years from 2018 to 2022 that shows highest revenue in 2022. Deliver an awe inspiring pitch with this creative Film Making Firm Profile Revenue And Net Profits Ppt PowerPoint Presentation Gallery Template PDF bundle. Topics like 2018 To 2022, Net Profit Increased, Revenue can be discussed with this completely editable template. It is available for immediate download depending on the needs and requirements of the user.
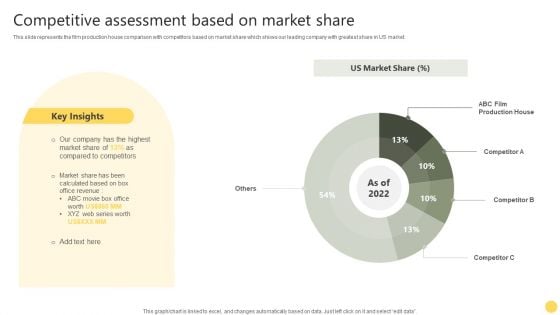
Film Making Firm Profile Competitive Assessment Based On Market Share Ppt PowerPoint Presentation Gallery Files PDF
This slide represents the film production house comparison with competitors based on market share which shows our leading company with greatest share in US market. Deliver and pitch your topic in the best possible manner with this Film Making Firm Profile Competitive Assessment Based On Market Share Ppt PowerPoint Presentation Gallery Files PDF. Use them to share invaluable insights on Key Insights, US Market Share, Market Share and impress your audience. This template can be altered and modified as per your expectations. So, grab it now.

Customized Marketing Impact On Conversion Rates Ppt PowerPoint Presentation Gallery Slideshow PDF
This slide highlights the comparative analysis on conversion rates from the use customized marketing. The platform includes search engine marketing, website, email and social media. Pitch your topic with ease and precision using this Customized Marketing Impact On Conversion Rates Ppt PowerPoint Presentation Gallery Slideshow PDF. This layout presents information on Search Engine Marketing, Social Media, Mobile Apps. It is also available for immediate download and adjustment. So, changes can be made in the color, design, graphics or any other component to create a unique layout.
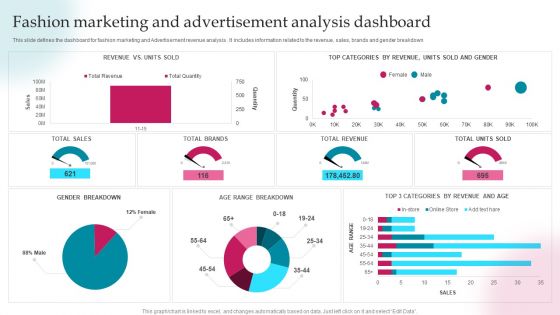
Fashion Marketing And Advertisement Analysis Dashboard Ppt PowerPoint Presentation Gallery Topics PDF
This slide defines the dashboard for fashion marketing and Advertisement revenue analysis . It includes information related to the revenue, sales, brands and gender breakdown. Pitch your topic with ease and precision using this Fashion Marketing And Advertisement Analysis Dashboard Ppt PowerPoint Presentation Gallery Topics PDF. This layout presents information on Total Revenue, Total Brands, Total Sales. It is also available for immediate download and adjustment. So, changes can be made in the color, design, graphics or any other component to create a unique layout.
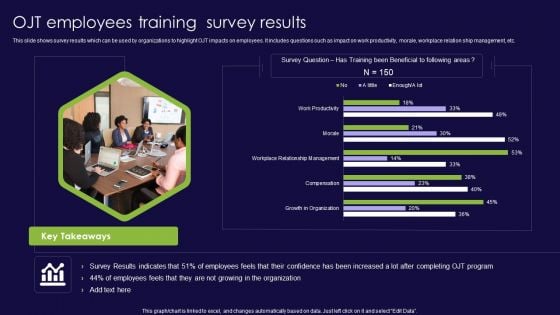
OJT Employees Training Survey Results Ppt PowerPoint Presentation File Master Slide PDF
This slide shows survey results which can be used by organizations to highlight OJT impacts on employees. It includes questions such as impact on work productivity, morale, workplace relation ship management, etc. Pitch your topic with ease and precision using this OJT Employees Training Survey Results Ppt PowerPoint Presentation File Master Slide PDF. This layout presents information on Growth Organization, Compensation, Workplace Relationship Management. It is also available for immediate download and adjustment. So, changes can be made in the color, design, graphics or any other component to create a unique layout.
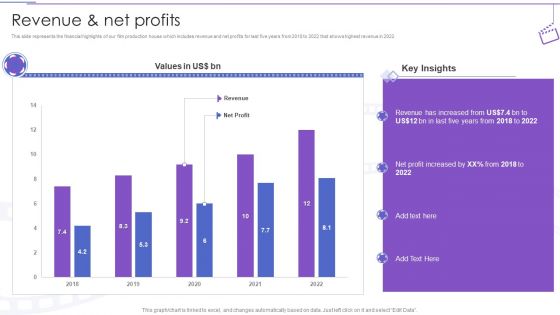
Film Making Company Outline Revenue And Net Profits Ppt PowerPoint Presentation Ideas Slide Portrait PDF
This slide represents the financial highlights of our film production house which includes revenue and net profits for last five years from 2018 to 2022 that shows highest revenue in 2022.Deliver an awe inspiring pitch with this creative Film Making Company Outline Revenue And Net Profits Ppt PowerPoint Presentation Ideas Slide Portrait PDF bundle. Topics like Revenue Increased, Five Years, Profit Increased can be discussed with this completely editable template. It is available for immediate download depending on the needs and requirements of the user.
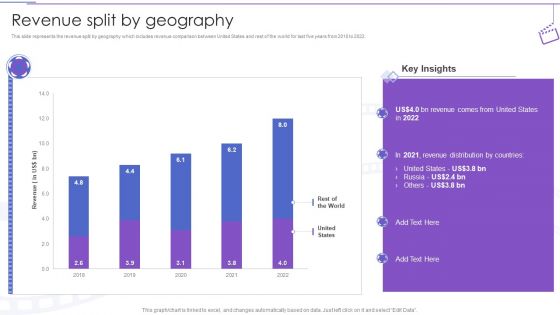
Film Making Company Outline Revenue Split By Geography Ppt PowerPoint Presentation Professional Graphic Images PDF
This slide represents the revenue split by geography which includes revenue comparison between United States and rest of the world for last five years from 2018 to 2022.Deliver and pitch your topic in the best possible manner with this Film Making Company Outline Revenue Split By Geography Ppt PowerPoint Presentation Professional Graphic Images PDF. Use them to share invaluable insights on United States, Revenue Distribution, Revenue Comes and impress your audience. This template can be altered and modified as per your expectations. So, grab it now.
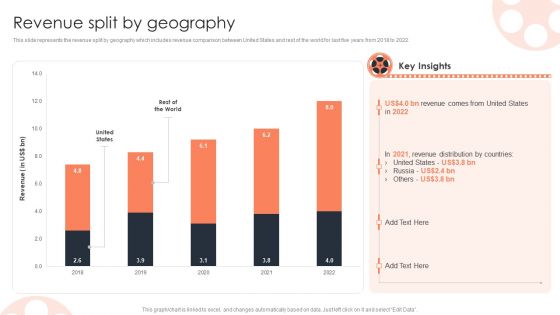
Revenue Split By Geography Film Media Company Profile Ppt PowerPoint Presentation Infographics Infographics PDF
This slide represents the financial highlights of our film production house which includes revenue and net profits for last five years from 2018 to 2022 that shows highest revenue in 2022.Deliver and pitch your topic in the best possible manner with this Revenue Split By Geography Film Media Company Profile Ppt PowerPoint Presentation Infographics Infographics PDF. Use them to share invaluable insights on United States, Revenue Distribution, Key Insights and impress your audience. This template can be altered and modified as per your expectations. So, grab it now.
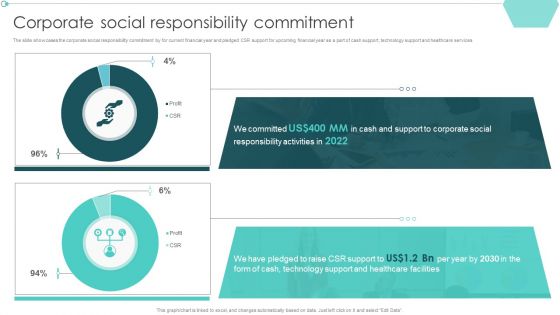
Transportation Company Profile Corporate Social Responsibility Commitment Ppt PowerPoint Presentation Model Master Slide PDF
The slide showcases the corporate social responsibility commitment by for current financial year and pledged CSR support for upcoming financial year as a part of cash support, technology support and healthcare services.Deliver an awe inspiring pitch with this creative Transportation Company Profile Corporate Social Responsibility Commitment Ppt PowerPoint Presentation Model Master Slide PDF bundle. Topics like Responsibility Activities, Pledged Raise, Technology Support can be discussed with this completely editable template. It is available for immediate download depending on the needs and requirements of the user.
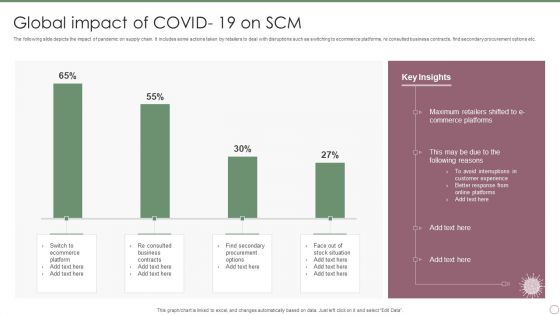
Global Impact Of COVID 19 On SCM Ppt PowerPoint Presentation File Sample PDF
The following slide depicts the impact of pandemic on supply chain. It includes some actions taken by retailers to deal with disruptions such as switching to ecommerce platforms, re consulted business contracts, find secondary procurement options etc. Showcasing this set of slides titled Global Impact Of COVID 19 On SCM Ppt PowerPoint Presentation File Sample PDF. The topics addressed in these templates are Maximum Retailers Shifted, Commerce Platforms, Customer Experience. All the content presented in this PPT design is completely editable. Download it and make adjustments in color, background, font etc. as per your unique business setting.
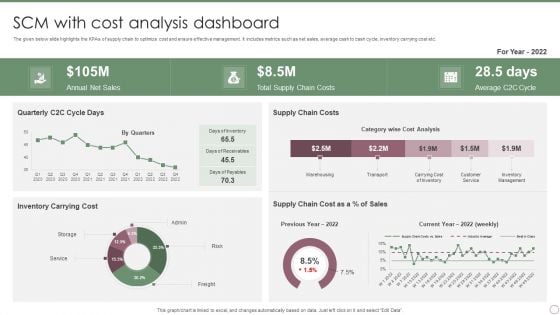
SCM With Cost Analysis Dashboard Ppt PowerPoint Presentation File Slides PDF
The given below slide highlights the KPAs of supply chain to optimize cost and ensure effective management. It includes metrics such as net sales, average cash to cash cycle, inventory carrying cost etc. Showcasing this set of slides titled SCM With Cost Analysis Dashboard Ppt PowerPoint Presentation File Slides PDF. The topics addressed in these templates are Annual Net Sales, Total Supply Chain, Costs, Average C2C Cycle. All the content presented in this PPT design is completely editable. Download it and make adjustments in color, background, font etc. as per your unique business setting.
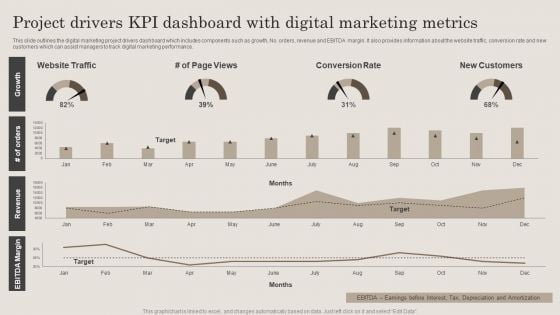
Project Drivers Kpi Dashboard With Digital Marketing Metrics Ppt PowerPoint Presentation File Clipart PDF
This slide outlines the digital marketing project drivers dashboard which includes components such as growth, No. orders, revenue and EBITDA margin. It also provides information about the website traffic, conversion rate and new customers which can assist managers to track digital marketing performance. Showcasing this set of slides titled Project Drivers Kpi Dashboard With Digital Marketing Metrics Ppt PowerPoint Presentation File Clipart PDF. The topics addressed in these templates are Website Traffic, Conversion Rate, New Customers. All the content presented in this PPT design is completely editable. Download it and make adjustments in color, background, font etc. as per your unique business setting.
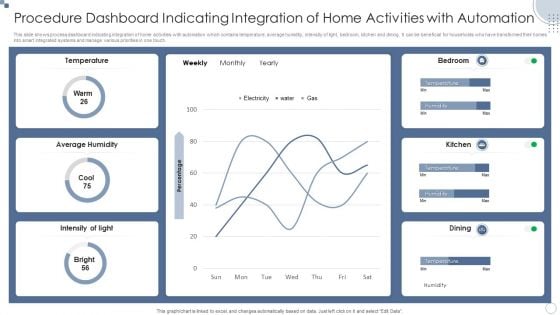
Procedure Dashboard Indicating Integration Of Home Activities With Automation Ppt PowerPoint Presentation File Files PDF
This slide shows process dashboard indicating integration of home activities with automation which contains temperature, average humidity, intensity of light, bedroom, kitchen and dining. It can be beneficial for households who have transformed their homes into smart integrated systems and manage various priorities in one touch.Showcasing this set of slides titled Procedure Dashboard Indicating Integration Of Home Activities With Automation Ppt PowerPoint Presentation File Files PDF. The topics addressed in these templates are Average Humidity, Temperature, Intensity Light. All the content presented in this PPT design is completely editable. Download it and make adjustments in color, background, font etc. as per your unique business setting.
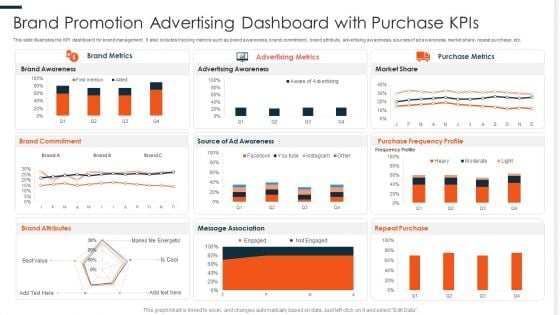
Brand Promotion Advertising Dashboard With Purchase Kpis Ppt PowerPoint Presentation File Format PDF
This slide illustrates the KPI dashboard for brand management. It also includes tracking metrics such as brand awareness, brand commitment, brand attribute, advertising awareness, sources of ad awareness, market share, repeat purchase, etc. Showcasing this set of slides titled Brand Promotion Advertising Dashboard With Purchase Kpis Ppt PowerPoint Presentation File Format PDF. The topics addressed in these templates are Brand Awareness, Advertising Awareness, Purchase Frequency. All the content presented in this PPT design is completely editable. Download it and make adjustments in color, background, font etc. as per your unique business setting.
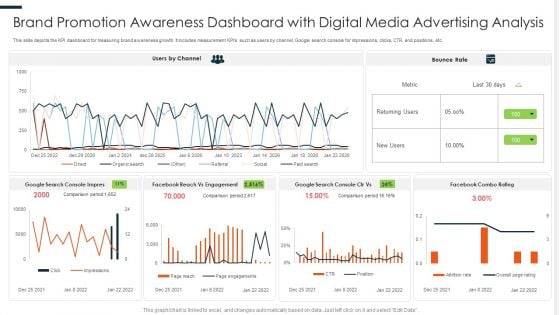
Brand Promotion Awareness Dashboard With Digital Media Advertising Analysis Ppt PowerPoint Presentation Design Ideas PDF
This slide depicts the KPI dashboard for measuring brand awareness growth. It includes measurement KPIs such as users by channel, Google search console for impressions, clicks, CTR, and positions, etc. Pitch your topic with ease and precision using this Brand Promotion Awareness Dashboard With Digital Media Advertising Analysis Ppt PowerPoint Presentation Design Ideas PDF. This layout presents information on Console Impress, Reach Engagement, Combo Rating. It is also available for immediate download and adjustment. So, changes can be made in the color, design, graphics or any other component to create a unique layout.
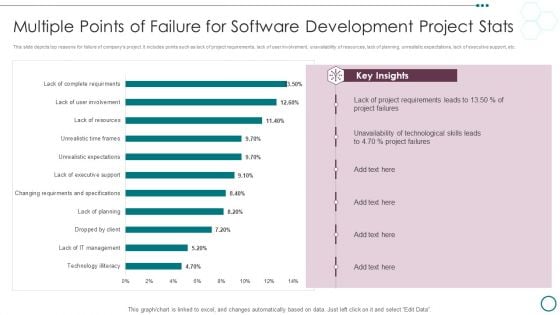
Multiple Points Of Failure For Software Development Project Stats Ppt PowerPoint Presentation Infographics Slides PDF
This slide depicts top reasons for failure of companys project. It includes points such as lack of project requirements, lack of user involvement, unavailability of resources, lack of planning, unrealistic expectations, lack of executive support, etc.Pitch your topic with ease and precision using this Multiple Points Of Failure For Software Development Project Stats Ppt PowerPoint Presentation Infographics Slides PDF. This layout presents information on Project Requirements, Unavailability Technological, Project Failures. It is also available for immediate download and adjustment. So, changes can be made in the color, design, graphics or any other component to create a unique layout.
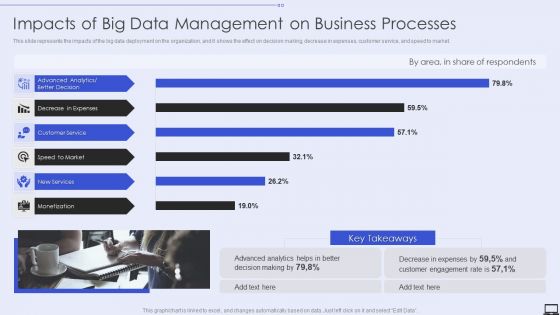
Impacts Of Big Data Management On Business Processes Ppt PowerPoint Presentation File Infographics PDF
This slide represents the impacts of the big data deployment on the organization, and it shows the effect on decision making, decrease in expenses, customer service, and speed to market. Deliver and pitch your topic in the best possible manner with this Impacts Of Big Data Management On Business Processes Ppt PowerPoint Presentation File Infographics PDF. Use them to share invaluable insights on Decision Making, Expenses, Customer Engagement Rate and impress your audience. This template can be altered and modified as per your expectations. So, grab it now.
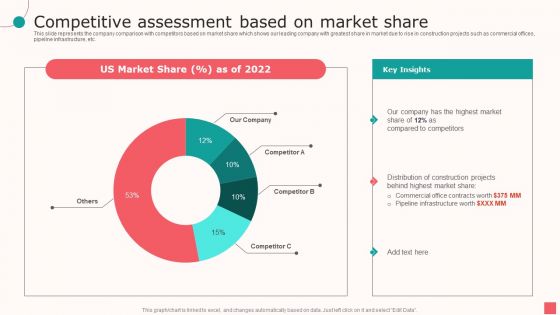
Real Estate Company Details Competitive Assessment Based On Market Share Ppt PowerPoint Presentation Summary Infographics PDF
This slide represents the company comparison with competitors based on market share which shows our leading company with greatest share in market due to rise in construction projects such as commercial offices, pipeline infrastructure, etc.Deliver an awe inspiring pitch with this creative Real Estate Company Details Competitive Assessment Based On Market Share Ppt PowerPoint Presentation Summary Infographics PDF bundle. Topics like Compared Competitors, Distribution Construction, Pipeline Infrastructure can be discussed with this completely editable template. It is available for immediate download depending on the needs and requirements of the user.

Real Estate Company Details Net Profit And Margin Analysis Ppt PowerPoint Presentation Model Images PDF
This slide represents the companys net profit and margin for five years which shows strong position due to reduced operating expenses, increased revenue, etc. that allow creditors to know about companys health.Deliver and pitch your topic in the best possible manner with this Real Estate Company Details Net Profit And Margin Analysis Ppt PowerPoint Presentation Model Images PDF. Use them to share invaluable insights on Profit Increased, Increased Revenue, Operating Expenses and impress your audience. This template can be altered and modified as per your expectations. So, grab it now.
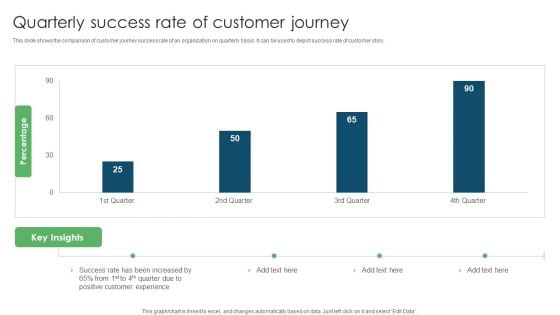
Quarterly Success Rate Of Customer Journey Ppt PowerPoint Presentation Outline Mockup PDF
This slide shows the comparison of customer journey success rate of an organization on quarterly basis. It can be used to depict success rate of customer story. Pitch your topic with ease and precision using this Quarterly Success Rate Of Customer Journey Ppt PowerPoint Presentation Outline Mockup PDF. This layout presents information on Success Rate, Increased Positive, Customer Experience. It is also available for immediate download and adjustment. So, changes can be made in the color, design, graphics or any other component to create a unique layout.
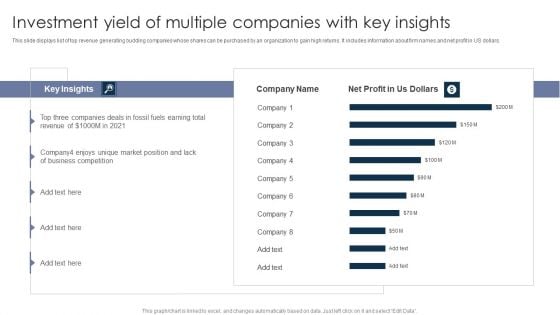
Investment Yield Of Multiple Companies With Key Insights Ppt PowerPoint Presentation Layouts Display
This slide displays list of top revenue generating budding companies whose shares can be purchased by an organization to gain high returns. It includes information about firm names and net profit in US dollars. Showcasing this set of slides titled Investment Yield Of Multiple Companies With Key Insights Ppt PowerPoint Presentation Layouts Display. The topics addressed in these templates are Three Companies, Business Competition, Fuels Earning. All the content presented in this PPT design is completely editable. Download it and make adjustments in color, background, font etc. as per your unique business setting.
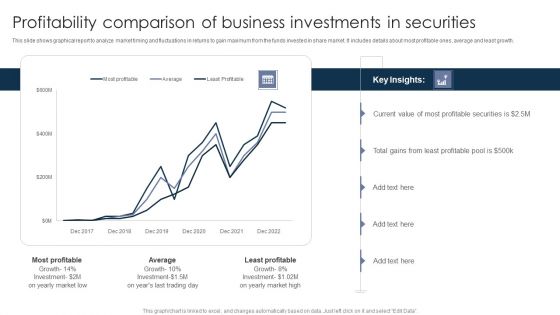
Profitability Comparison Of Business Investments In Securities Ppt PowerPoint Presentation Outline Deck PDF
This slide shows graphical report to analyze market timing and fluctuations in returns to gain maximum from the funds invested in share market. It includes details about most profitable ones, average and least growth. Pitch your topic with ease and precision using this Profitability Comparison Of Business Investments In Securities Ppt PowerPoint Presentation Outline Deck PDF. This layout presents information on Most Profitable, Least Profitable, Least Profitable. It is also available for immediate download and adjustment. So, changes can be made in the color, design, graphics or any other component to create a unique layout.
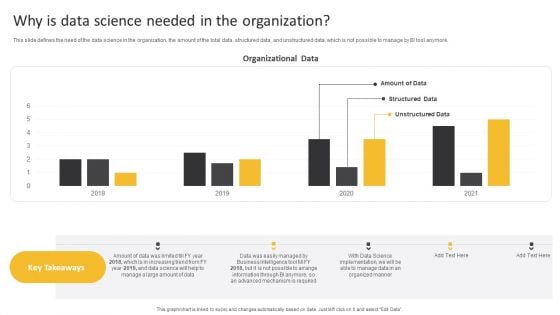
Information Science Why Is Data Science Needed In The Organization Ppt PowerPoint Presentation Slide Download PDF
This slide defines the need of the data science in the organization, the amount of the total data, structured data, and unstructured data, which is not possible to manage by BI tool anymore.Deliver an awe inspiring pitch with this creative Information Science Why Is Data Science Needed In The Organization Ppt PowerPoint Presentation Slide Download PDF bundle. Topics like Organized Manner, Advanced Mechanism, Information Through can be discussed with this completely editable template. It is available for immediate download depending on the needs and requirements of the user.
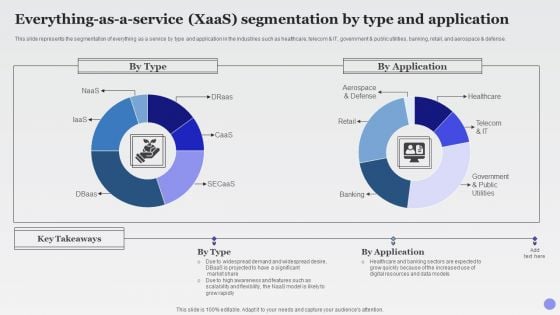
Everything As A Service Xaas Segmentation Xaas Cloud Computing Models Ppt PowerPoint Presentation Slides Guide PDF
This slide represents the segmentation of everything as a service by type and application in the industries such as healthcare, telecom and IT, government and public utilities, banking, retail, and aerospace and defense.Deliver an awe inspiring pitch with this creative Everything As A Service Xaas Segmentation Xaas Cloud Computing Models Ppt PowerPoint Presentation Slides Guide PDF bundle. Topics like Aerospace Defense, Government Public, Utilities Sectors can be discussed with this completely editable template. It is available for immediate download depending on the needs and requirements of the user.
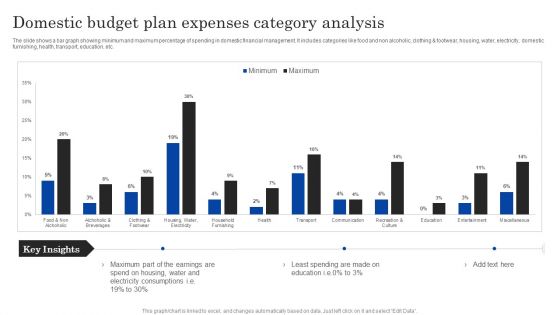
Domestic Budget Plan Expenses Category Analysis Ppt PowerPoint Presentation Layouts Inspiration PDF
The slide shows a bar graph showing minimum and maximum percentage of spending in domestic financial management. It includes categories like food and non alcoholic, clothing and footwear, housing, water, electricity, domestic furnishing, health, transport, education, etc.Showcasing this set of slides titled Domestic Budget Plan Expenses Category Analysis Ppt PowerPoint Presentation Layouts Inspiration PDF. The topics addressed in these templates are Part Earnings, Electricity Consumptions, Least Spending. All the content presented in this PPT design is completely editable. Download it and make adjustments in color, background, font etc. as per your unique business setting.

Domestic Budget Plan Income And Expenditure Analysis Dashboard Ppt PowerPoint Presentation Layouts Clipart Images PDF
The slide presents a dashboard to analyze and monitor income and expenses for formulating savings plan. It includes income, expenses, savings, top five expenses and unplanned expenses.Pitch your topic with ease and precision using this Domestic Budget Plan Income And Expenditure Analysis Dashboard Ppt PowerPoint Presentation Layouts Clipart Images PDF. This layout presents information on Unplanned Expenses, Expenses, Key Metrics. It is also available for immediate download and adjustment. So, changes can be made in the color, design, graphics or any other component to create a unique layout.
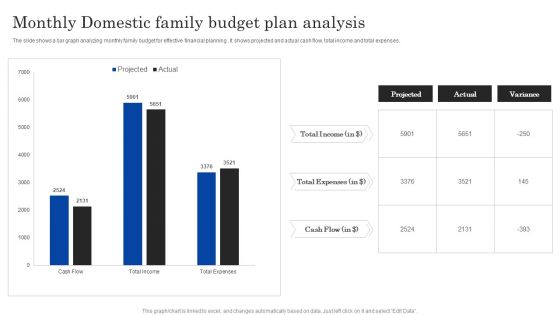
Monthly Domestic Family Budget Plan Analysis Ppt PowerPoint Presentation Portfolio Guide PDF
The slide shows a bar graph analyzing monthly family budget for effective financial planning . It shows projected and actual cash flow, total income and total expenses.Showcasing this set of slides titled Monthly Domestic Family Budget Plan Analysis Ppt PowerPoint Presentation Portfolio Guide PDF. The topics addressed in these templates are Total Income, Total Expenses, Cash Flow. All the content presented in this PPT design is completely editable. Download it and make adjustments in color, background, font etc. as per your unique business setting.
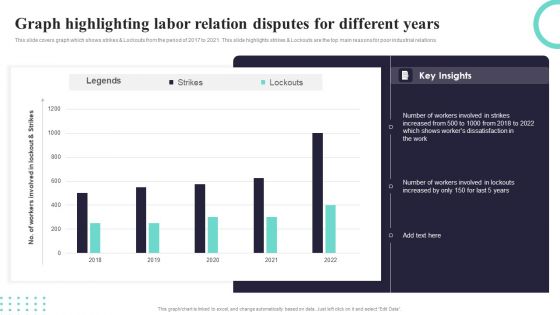
Graph Highlighting Labor Relation Disputes For Different Years Ppt PowerPoint Presentation Gallery Sample PDF
This slide covers graph which shows strikes and Lockouts from the period of 2017 to 2021. This slide highlights strikes and Lockouts are the top main reasons for poor industrial relations. Showcasing this set of slides titled Graph Highlighting Labor Relation Disputes For Different Years Ppt PowerPoint Presentation Gallery Sample PDF. The topics addressed in these templates are Legends, Strikes, Lockouts. All the content presented in this PPT design is completely editable. Download it and make adjustments in color, background, font etc. as per your unique business setting.
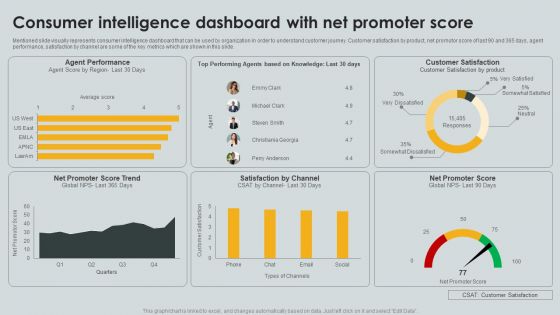
Consumer Intelligence Dashboard With Net Promoter Score Ppt PowerPoint Presentation File Templates PDF
Mentioned slide visually represents consumer intelligence dashboard that can be used by organization in order to understand customer journey. Customer satisfaction by product, net promotor score of last 90 and 365 days, agent performance, satisfaction by channel are some of the key metrics which are shown in this slide. Showcasing this set of slides titled Consumer Intelligence Dashboard With Net Promoter Score Ppt PowerPoint Presentation File Templates PDF. The topics addressed in these templates are Agent Performance, Satisfaction Channel, Net Promoter. All the content presented in this PPT design is completely editable. Download it and make adjustments in color, background, font etc. as per your unique business setting.
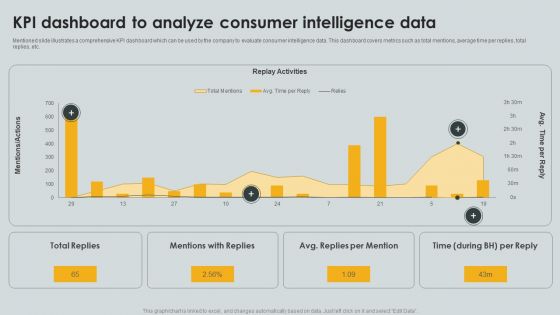
KPI Dashboard To Analyze Consumer Intelligence Data Ppt PowerPoint Presentation File Portfolio PDF
Mentioned slide illustrates a comprehensive KPI dashboard which can be used by the company to evaluate consumer intelligence data. This dashboard covers metrics such as total mentions, average time per replies, total replies, etc. Pitch your topic with ease and precision using this KPI Dashboard To Analyze Consumer Intelligence Data Ppt PowerPoint Presentation File Portfolio PDF. This layout presents information on Replay Activities, Total Replies, Mentions Replies. It is also available for immediate download and adjustment. So, changes can be made in the color, design, graphics or any other component to create a unique layout.
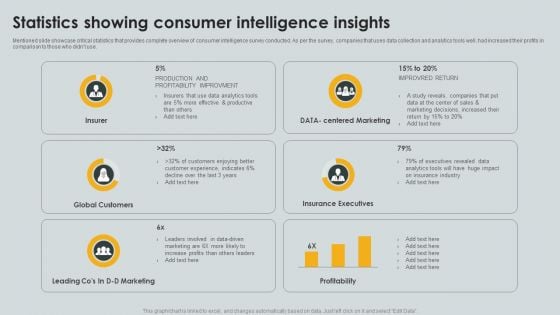
Statistics Showing Consumer Intelligence Insights Ppt PowerPoint Presentation Gallery Information PDF
Mentioned slide showcase critical statistics that provides complete overview of consumer intelligence survey conducted. As per the survey, companies that uses data collection and analytics tools well, had increased their profits in comparison to those who didnt use. Showcasing this set of slides titled Statistics Showing Consumer Intelligence Insights Ppt PowerPoint Presentation Gallery Information PDF. The topics addressed in these templates are Insurer, Global Customers, Insurance Executives. All the content presented in this PPT design is completely editable. Download it and make adjustments in color, background, font etc. as per your unique business setting.
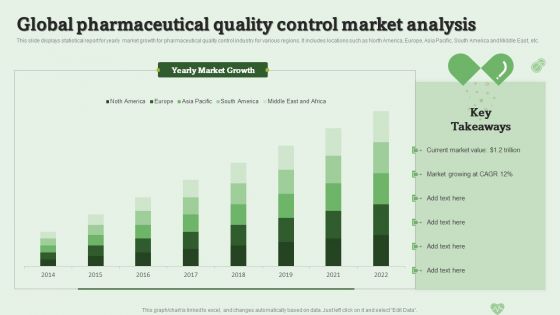
Global Pharmaceutical Quality Control Market Analysis Ppt PowerPoint Presentation Show Slides PDF
This slide displays statistical report for yearly market growth for pharmaceutical quality control industry for various regions. It includes locations such as North America, Europe, Asia Pacific, South America and Middle East, etc. Showcasing this set of slides titled Global Pharmaceutical Quality Control Market Analysis Ppt PowerPoint Presentation Show Slides PDF. The topics addressed in these templates are Market Value, Market Growing, Market Growth. All the content presented in this PPT design is completely editable. Download it and make adjustments in color, background, font etc. as per your unique business setting.

Key Challenges Of Pharmaceutical Quality Control In Industry Ppt PowerPoint Presentation Slides Examples PDF
This slide displays statistical analysis for most common operational barriers faced by pharmaceutical industry in quality management. It includes details such as digitalization, automation, cost inflations, process transparency, etc. Pitch your topic with ease and precision using this Key Challenges Of Pharmaceutical Quality Control In Industry Ppt PowerPoint Presentation Slides Examples PDF. This layout presents information on Opretional Inconsistencies, Latest Technologies, Automation Related. It is also available for immediate download and adjustment. So, changes can be made in the color, design, graphics or any other component to create a unique layout.
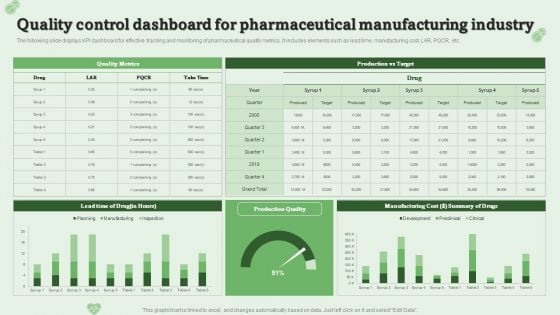
Quality Control Dashboard For Pharmaceutical Manufacturing Industry Ppt PowerPoint Presentation Model Layouts PDF
The following slide displays KPI dashboard for effective tracking and monitoring of pharmaceutical quality metrics. It includes elements such as lead time, manufacturing cost, LAR, PQCR, etc.Pitch your topic with ease and precision using this Quality Control Dashboard For Pharmaceutical Manufacturing Industry Ppt PowerPoint Presentation Model Layouts PDF. This layout presents information on Manufacturing Cost, Summary Drugs, Quality Metrics. It is also available for immediate download and adjustment. So, changes can be made in the color, design, graphics or any other component to create a unique layout.
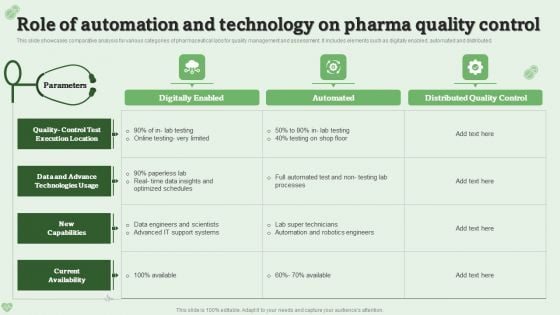
Role Of Automation And Technology On Pharma Quality Control Ppt PowerPoint Presentation Gallery Backgrounds PDF
This slide showcases comparative analysis for various categories of pharmaceutical labs for quality management and assessment. It includes elements such as digitally enabled, automated and distributed. Showcasing this set of slides titled Role Of Automation And Technology On Pharma Quality Control Ppt PowerPoint Presentation Gallery Backgrounds PDF. The topics addressed in these templates are Data Engineers, Current Availability, Quality Control. All the content presented in this PPT design is completely editable. Download it and make adjustments in color, background, font etc. as per your unique business setting.
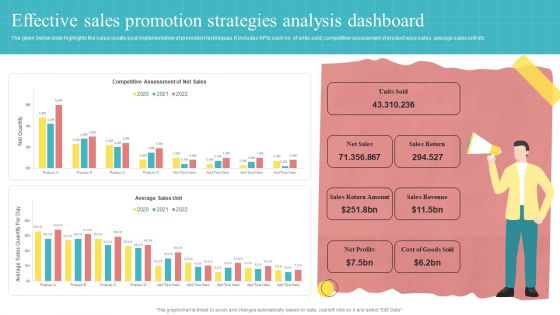
Effective Sales Promotion Strategies Analysis Dashboard Ppt PowerPoint Presentation Slides Background Designs PDF
The given below slide highlights the sales results post implementation of promotion techniques. It includes KPIs such no. of units sold, competitive assessment of product wise sales, average sales unit etc.Showcasing this set of slides titled Effective Sales Promotion Strategies Analysis Dashboard Ppt PowerPoint Presentation Slides Background Designs PDF. The topics addressed in these templates are Return Amount, Sales Return, Sales Revenue. All the content presented in this PPT design is completely editable. Download it and make adjustments in color, background, font etc. as per your unique business setting.
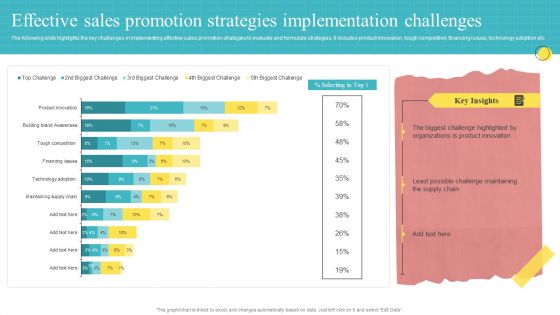
Effective Sales Promotion Strategies Implementation Challenges Ppt PowerPoint Presentation Ideas Graphics Tutorials PDF
The following slide highlights the key challenges in implementing effective sales promotion strategies to evaluate and formulate strategies. It includes product innovation, tough competition, financing issues, technology adoption etc. Pitch your topic with ease and precision using this Effective Sales Promotion Strategies Implementation Challenges Ppt PowerPoint Presentation Ideas Graphics Tutorials PDF. This layout presents information on Biggest Challenge, Product Innovation, Challenge Maintaining. It is also available for immediate download and adjustment. So, changes can be made in the color, design, graphics or any other component to create a unique layout.
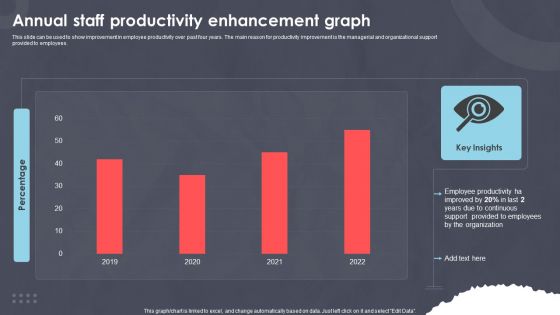
Annual Staff Productivity Enhancement Graph Ppt PowerPoint Presentation Styles Aids PDF
This slide can be used to show improvement in employee productivity over past four years. The main reason for productivity improvement is the managerial and organizational support provided to employees. Pitch your topic with ease and precision using this Annual Staff Productivity Enhancement Graph Ppt PowerPoint Presentation Styles Aids PDF. This layout presents information on Employee Productivity, Improved Last, Due Continuous. It is also available for immediate download and adjustment. So, changes can be made in the color, design, graphics or any other component to create a unique layout.
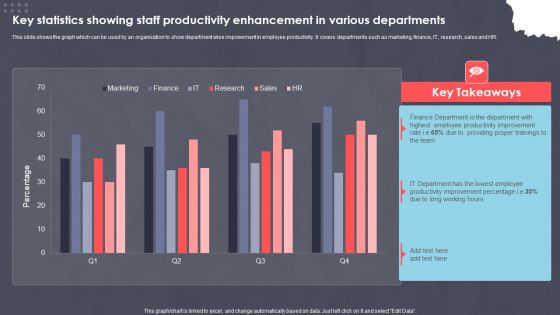
Key Statistics Showing Staff Productivity Enhancement In Various Departments Ppt PowerPoint Presentation Slides Portrait PDF
This slide shows the graph which can be used by an organization to show department wise improvement in employee productivity. It covers departments such as marketing, finance, IT, research, sales and HR. Pitch your topic with ease and precision using this Key Statistics Showing Staff Productivity Enhancement In Various Departments Ppt PowerPoint Presentation Slides Portrait PDF. This layout presents information on XXXXXXXXXXXXXXXXXXXXXXXXX. It is also available for immediate download and adjustment. So, changes can be made in the color, design, graphics or any other component to create a unique layout.
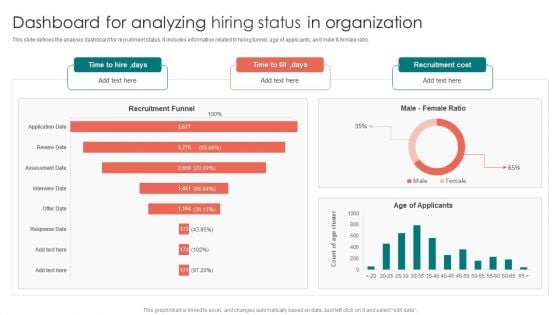
Dashboard For Analyzing Hiring Status In Organization Ppt PowerPoint Presentation Gallery Images PDF
This slide defines the analysis dashboard for recruitment status. It includes information related to hiring funnel, age of applicants, and male and female ratio. Pitch your topic with ease and precision using this Dashboard For Analyzing Hiring Status In Organization Ppt PowerPoint Presentation Gallery Images PDF. This layout presents information on Recruitment Funnel, Time To Hire, Age Applicants. It is also available for immediate download and adjustment. So, changes can be made in the color, design, graphics or any other component to create a unique layout.
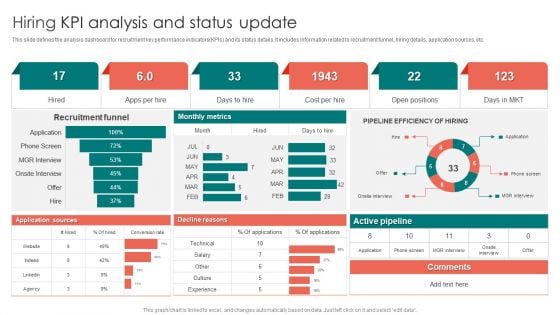
Hiring KPI Analysis And Status Update Ppt PowerPoint Presentation Gallery Show PDF
This slide defines the analysis dashboard for recruitment key performance indicators KPIs and its status details. It includes information related to recruitment funnel, hiring details, application sources, etc. Showcasing this set of slides titled Hiring KPI Analysis And Status Update Ppt PowerPoint Presentation Gallery Show PDF. The topics addressed in these templates are Recruitment Funnel, Monthly Metrics, Active Pipeline. All the content presented in this PPT design is completely editable. Download it and make adjustments in color, background, font etc. as per your unique business setting.
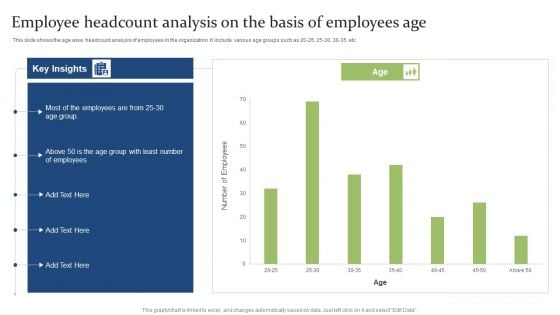
Employee Headcount Analysis On The Basis Of Employees Age Ppt PowerPoint Presentation Model Ideas PDF
This slide shows the age wise headcount analysis of employees in the organization. It include various age groups such as 20 25, 25 30, 30 35, etc.Pitch your topic with ease and precision using this Employee Headcount Analysis On The Basis Of Employees Age Ppt PowerPoint Presentation Model Ideas PDF. This layout presents information on Employee Headcount, Analysis Basis, Employees Age. It is also available for immediate download and adjustment. So, changes can be made in the color, design, graphics or any other component to create a unique layout.
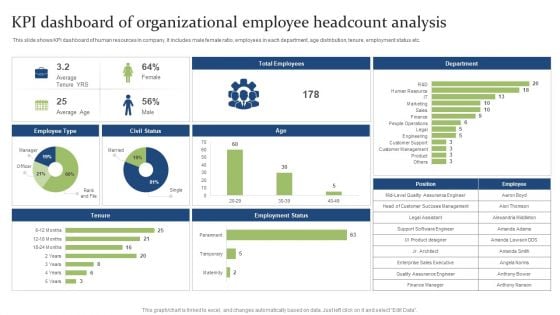
KPI Dashboard Of Organizational Employee Headcount Analysis Ppt PowerPoint Presentation Styles Show PDF
This slide shows KPI dashboard of human resources in company. It includes male female ratio, employees in each department, age distribution, tenure, employment status etc. Showcasing this set of slides titled KPI Dashboard Of Organizational Employee Headcount Analysis Ppt PowerPoint Presentation Styles Show PDF. The topics addressed in these templates are Support Software, Engineer Success, Sales Executive. All the content presented in this PPT design is completely editable. Download it and make adjustments in color, background, font etc. as per your unique business setting.
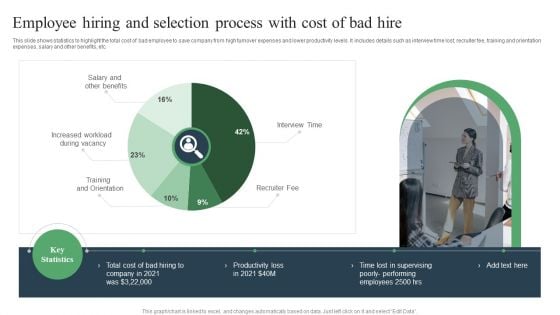
Employee Hiring And Selection Process With Cost Of Bad Hire Ppt PowerPoint Presentation Outline Skills PDF
This slide shows statistics to highlight the total cost of bad employee to save company from high turnover expenses and lower productivity levels. It includes details such as interview time lost, recruiter fee, training and orientation expenses, salary and other benefits, etc. Pitch your topic with ease and precision using this Employee Hiring And Selection Process With Cost Of Bad Hire Ppt PowerPoint Presentation Outline Skills PDF. This layout presents information on Employee Hiring, Selection Process, Candidate Screening. It is also available for immediate download and adjustment. So, changes can be made in the color, design, graphics or any other component to create a unique layout.
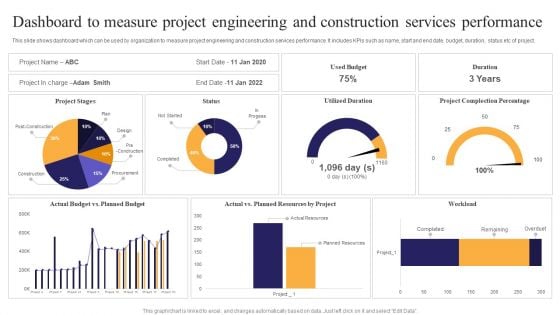
Dashboard To Measure Project Engineering And Construction Services Performance Ppt PowerPoint Presentation File Elements PDF
This slide shows dashboard which can be used by organization to measure project engineering and construction services performance. It includes KPIs such as name, start and end date, budget, duration, status etc of project. Showcasing this set of slides titled Dashboard To Measure Project Engineering And Construction Services Performance Ppt PowerPoint Presentation File Elements PDF. The topics addressed in these templates are Planned Resources, Utilized Duration, Project Complection. All the content presented in this PPT design is completely editable. Download it and make adjustments in color, background, font etc. as per your unique business setting.
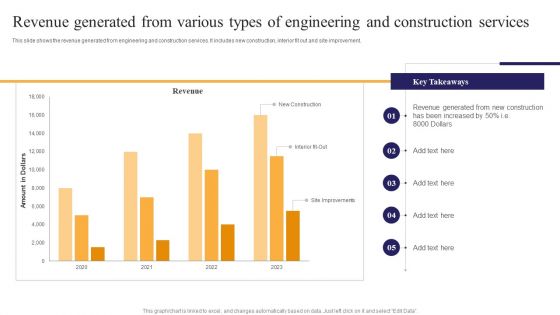
Revenue Generated From Various Types Of Engineering And Construction Services Ppt PowerPoint Presentation File Guide PDF
This slide shows the revenue generated from engineering and construction services. It includes new construction, interior fit out and site improvement. Pitch your topic with ease and precision using this Revenue Generated From Various Types Of Engineering And Construction Services Ppt PowerPoint Presentation File Guide PDF. This layout presents information on Revenue Generated, New Construction, Been Increased. It is also available for immediate download and adjustment. So, changes can be made in the color, design, graphics or any other component to create a unique layout.
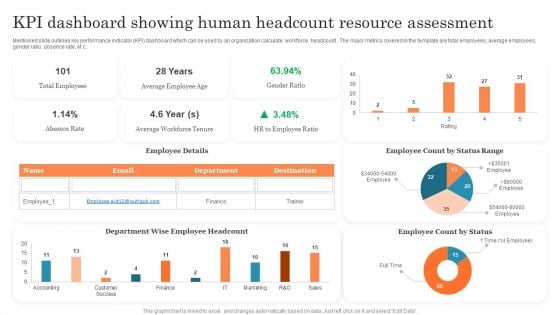
KPI Dashboard Showing Human Headcount Resource Assessment Ppt PowerPoint Presentation Outline PDF
Mentioned slide outlines key performance indicator KPI dashboard which can be used by an organization calculate workforce headcount . The major metrics covered in the template are total employees, average employees, gender ratio, absence rate, etc. Pitch your topic with ease and precision using this KPI Dashboard Showing Human Headcount Resource Assessment Ppt PowerPoint Presentation Outline PDF. This layout presents information on Total Employees, Average Employee, Employee Count. It is also available for immediate download and adjustment. So, changes can be made in the color, design, graphics or any other component to create a unique layout.


 Continue with Email

 Home
Home


