Predictive Analytics
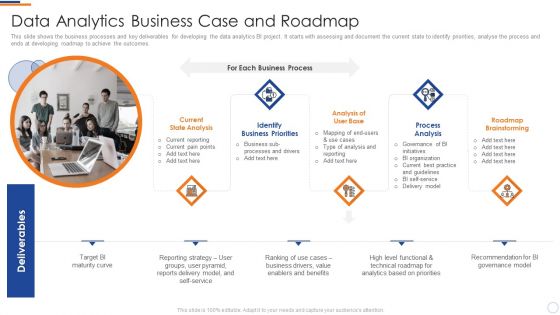
Business Intelligence And Big Data Analytics Data Analytics Business Case And Roadmap Template PDF
This slide shows the business processes and key deliverables for developing the data analytics BI project. It starts with assessing and document the current state to identify priorities, analyse the process and ends at developing roadmap to achieve the outcomes. This is a business intelligence and big data analytics data analytics business case and roadmap template pdf template with various stages. Focus and dispense information on five stages using this creative set, that comes with editable features. It contains large content boxes to add your information on topics like current state analysis, identify business priorities, analysis user base, process analysis, roadmap brainstorming. You can also showcase facts, figures, and other relevant content using this PPT layout. Grab it now.
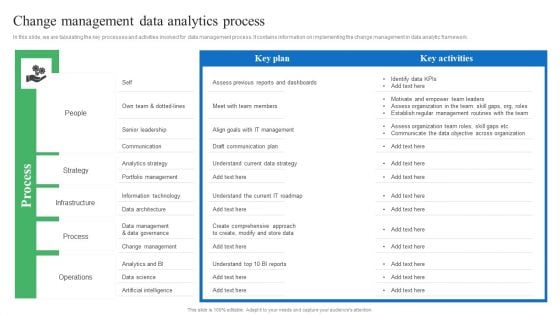
Toolkit For Data Science And Analytics Transition Change Management Data Analytics Process Guidelines PDF
In this slide, we are tabulating the key processes and activities involved for data management process. It contains information on implementing the change management in data analytic framework. Take your projects to the next level with our ultimate collection of Toolkit For Data Science And Analytics Transition Change Management Data Analytics Process Guidelines PDF. Slidegeeks has designed a range of layouts that are perfect for representing task or activity duration, keeping track of all your deadlines at a glance. Tailor these designs to your exact needs and give them a truly corporate look with your own brand colors they will make your projects stand out from the rest.

Toolkit For Data Science And Analytics Transition Data Analytics Project Plan Designs PDF
This slide shows the data analytics lifecycle covering multiple stages starting from presenting the business case to data identification, data validation, analysis and ending at data visualization and utilization of results. Present like a pro with Toolkit For Data Science And Analytics Transition Data Analytics Project Plan Designs PDF Create beautiful presentations together with your team, using our easy to use presentation slides. Share your ideas in real time and make changes on the fly by downloading our templates. So whether you are in the office, on the go, or in a remote location, you can stay in sync with your team and present your ideas with confidence. With Slidegeeks presentation got a whole lot easier. Grab these presentations today.
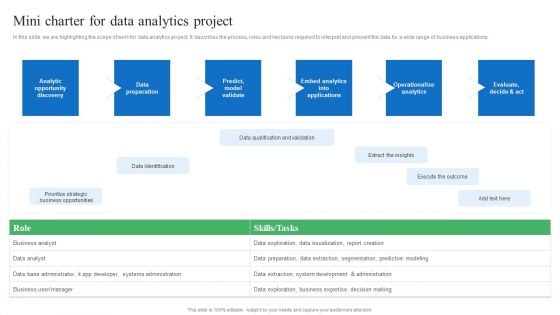
Toolkit For Data Science And Analytics Transition Mini Charter For Data Analytics Project Introduction PDF
In this slide, we are highlighting the scope of work for data analytics project. It describes the process, roles and key tasks required to interpret and present the data for a wide range of business applications. Slidegeeks is here to make your presentations a breeze with Toolkit For Data Science And Analytics Transition Mini Charter For Data Analytics Project Introduction PDF With our easy to use and customizable templates, you can focus on delivering your ideas rather than worrying about formatting. With a variety of designs to choose from, you are sure to find one that suits your needs. And with animations and unique photos, illustrations, and fonts, you can make your presentation pop. So whether you are giving a sales pitch or presenting to the board, make sure to check out Slidegeeks first.
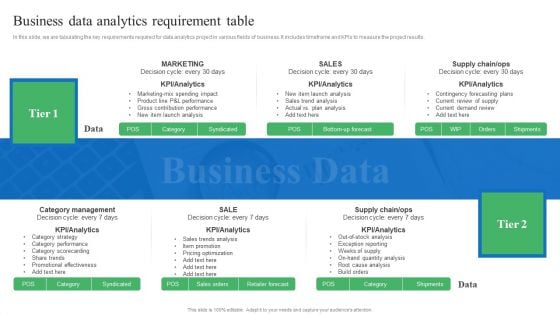
Toolkit For Data Science And Analytics Transition Business Data Analytics Requirement Table Sample PDF
In this slide, we are tabulating the key requirements required for data analytics project in various fields of business. It includes timeframe and KPIs to measure the project results. This Toolkit For Data Science And Analytics Transition Business Data Analytics Requirement Table Sample PDF from Slidegeeks makes it easy to present information on your topic with precision. It provides customization options, so you can make changes to the colors, design, graphics, or any other component to create a unique layout. It is also available for immediate download, so you can begin using it right away. Slidegeeks has done good research to ensure that you have everything you need to make your presentation stand out. Make a name out there for a brilliant performance.
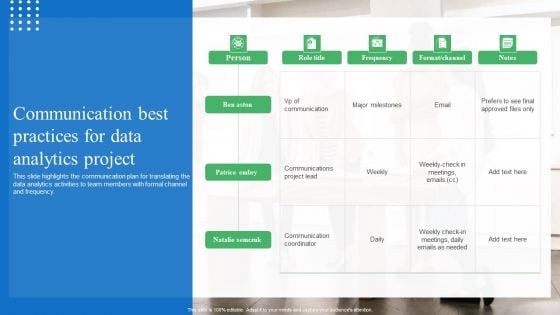
Toolkit For Data Science And Analytics Transition Communication Best Practices For Data Analytics Project Summary PDF
This slide highlights the communication plan for translating the data analytics activities to team members with formal channel and frequency. Do you know about Slidesgeeks Toolkit For Data Science And Analytics Transition Communication Best Practices For Data Analytics Project Summary PDF These are perfect for delivering any kind od presentation. Using it, create PowerPoint presentations that communicate your ideas and engage audiences. Save time and effort by using our pre designed presentation templates that are perfect for a wide range of topic. Our vast selection of designs covers a range of styles, from creative to business, and are all highly customizable and easy to edit. Download as a PowerPoint template or use them as Google Slides themes.
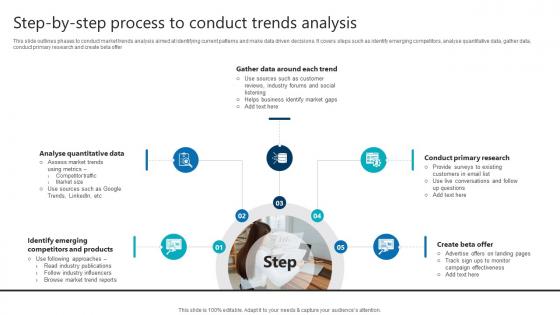
Step By Step Process To Conduct Trends Analysis Product Analytics Implementation Data Analytics V
This slide outlines phases to conduct market trends analysis aimed at identifying current patterns and make data driven decisions. It covers steps such as identify emerging competitors, analyse quantitative data, gather data, conduct primary research and create beta offerComing up with a presentation necessitates that the majority of the effort goes into the content and the message you intend to convey. The visuals of a PowerPoint presentation can only be effective if it supplements and supports the story that is being told. Keeping this in mind our experts created Step By Step Process To Conduct Trends Analysis Product Analytics Implementation Data Analytics V to reduce the time that goes into designing the presentation. This way, you can concentrate on the message while our designers take care of providing you with the right template for the situation. This slide outlines phases to conduct market trends analysis aimed at identifying current patterns and make data driven decisions. It covers steps such as identify emerging competitors, analyse quantitative data, gather data, conduct primary research and create beta offer
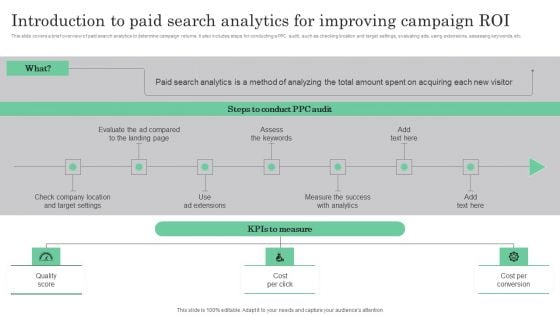
Online Marketing Analytics To Enhance Business Growth Introduction To Paid Search Analytics For Improving Template PDF
This slide covers a brief overview of paid search analytics to determine campaign returns. It also includes steps for conducting a PPC audit, such as checking location and target settings, evaluating ads, using extensions, assessing keywords, etc. Present like a pro with Online Marketing Analytics To Enhance Business Growth Introduction To Paid Search Analytics For Improving Template PDF Create beautiful presentations together with your team, using our easy to use presentation slides. Share your ideas in real time and make changes on the fly by downloading our templates. So whether you are in the office, on the go, or in a remote location, you can stay in sync with your team and present your ideas with confidence. With Slidegeeks presentation got a whole lot easier. Grab these presentations today.

Toolkit For Data Science And Analytics Transition Key Consideration For Data Analytics Implementation Strategy Ideas PDF
This slide depicts a holistic data analytics implementation strategy that includes a roadmap with a mix of business and technology imperatives. Slidegeeks is here to make your presentations a breeze with Toolkit For Data Science And Analytics Transition Key Consideration For Data Analytics Implementation Strategy Ideas PDF With our easy to use and customizable templates, you can focus on delivering your ideas rather than worrying about formatting. With a variety of designs to choose from, you are sure to find one that suits your needs. And with animations and unique photos, illustrations, and fonts, you can make your presentation pop. So whether you are giving a sales pitch or presenting to the board, make sure to check out Slidegeeks first.
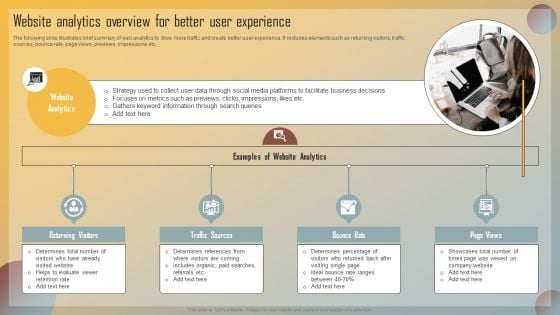
Guide For Marketing Analytics To Improve Decisions Website Analytics Overview For Better User Experience Demonstration PDF
The following slide illustrates brief summary of web analytics to drive more traffic and create better user experience. It includes elements such as returning visitors, traffic sources, bounce rate, page views, previews, impressions etc. Slidegeeks has constructed Guide For Marketing Analytics To Improve Decisions Website Analytics Overview For Better User Experience Demonstration PDF after conducting extensive research and examination. These presentation templates are constantly being generated and modified based on user preferences and critiques from editors. Here, you will find the most attractive templates for a range of purposes while taking into account ratings and remarks from users regarding the content. This is an excellent jumping off point to explore our content and will give new users an insight into our top notch PowerPoint Templates.
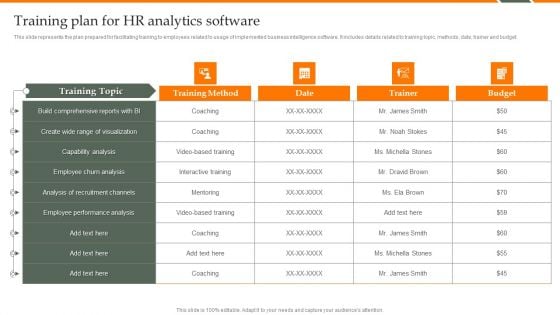
Human Resource Analytics Training Plan For HR Analytics Software Guidelines PDF
This slide represents the plan prepared for facilitating training to employees related to usage of implemented business intelligence software. It includes details related to training topic, methods, date, trainer and budget. Take your projects to the next level with our ultimate collection of Human Resource Analytics Training Plan For HR Analytics Software Guidelines PDF. Slidegeeks has designed a range of layouts that are perfect for representing task or activity duration, keeping track of all your deadlines at a glance. Tailor these designs to your exact needs and give them a truly corporate look with your own brand colors theyll make your projects stand out from the rest.
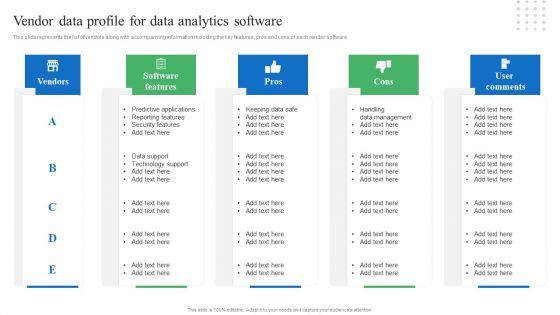
Toolkit For Data Science And Analytics Transition Vendor Data Profile For Data Analytics Software Infographics PDF
This slide represents the list of vendors along with accompanying information including the key features, pros and cons of each vendor software. If your project calls for a presentation, then Slidegeeks is your go to partner because we have professionally designed, easy to edit templates that are perfect for any presentation. After downloading, you can easily edit Toolkit For Data Science And Analytics Transition Vendor Data Profile For Data Analytics Software Infographics PDF and make the changes accordingly. You can rearrange slides or fill them with different images. Check out all the handy templates.
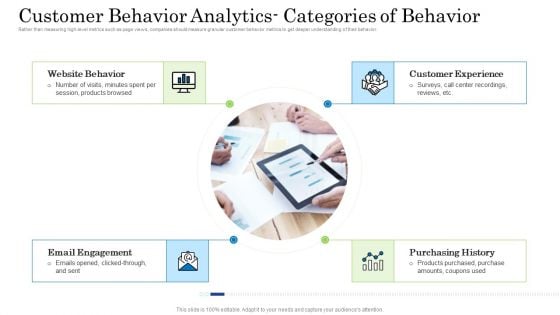
Customer Behavioral Data And Analytics Customer Behavior Analytics Categories Of Behavior Ideas PDF
Rather than measuring high level metrics such as page views, companies should measure granular customer behavior metrics to get deeper understanding of their behavior. This is a customer behavioral data and analytics customer behavior analytics categories of behavior ideas pdf template with various stages. Focus and dispense information on four stages using this creative set, that comes with editable features. It contains large content boxes to add your information on topics like website behavior, email engagement, customer experience, purchasing history. You can also showcase facts, figures, and other relevant content using this PPT layout. Grab it now.
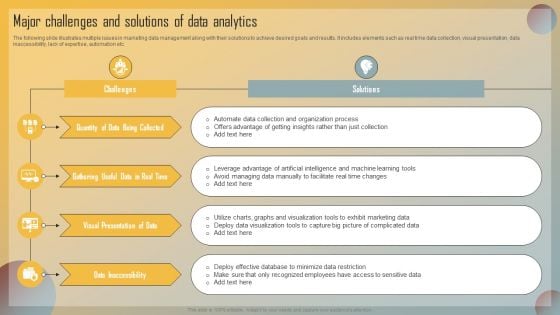
Guide For Marketing Analytics To Improve Decisions Major Challenges And Solutions Of Data Analytics Formats PDF
The following slide illustrates multiple issues in marketing data management along with their solutions to achieve desired goals and results. It includes elements such as real time data collection, visual presentation, data inaccessibility, lack of expertise, automation etc. Make sure to capture your audiences attention in your business displays with our gratis customizable Guide For Marketing Analytics To Improve Decisions Major Challenges And Solutions Of Data Analytics Formats PDF. These are great for business strategies, office conferences, capital raising or task suggestions. If you desire to acquire more customers for your tech business and ensure they stay satisfied, create your own sales presentation with these plain slides.
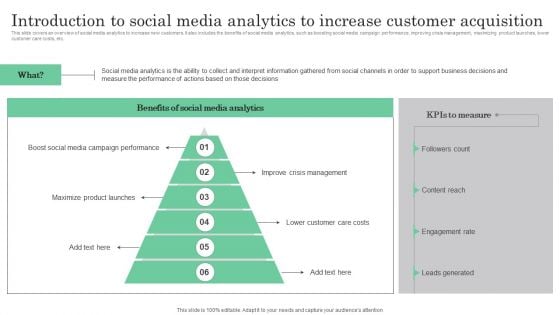
Online Marketing Analytics To Enhance Business Growth Introduction To Social Media Analytics To Increase Pictures PDF
Present like a pro with Online Marketing Analytics To Enhance Business Growth Introduction To Social Media Analytics To Increase Pictures PDF Create beautiful presentations together with your team, using our easy to use presentation slides. Share your ideas in real time and make changes on the fly by downloading our templates. So whether you are in the office, on the go, or in a remote location, you can stay in sync with your team and present your ideas with confidence. With Slidegeeks presentation got a whole lot easier. Grab these presentations today.
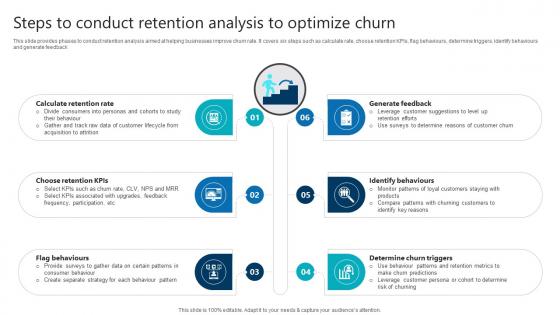
Steps To Conduct Retention Analysis To Optimize Churn Product Analytics Implementation Data Analytics V
This slide provides phases to conduct retention analysis aimed at helping businesses improve churn rate. It covers six steps such as calculate rate, choose retention KPIs, flag behaviours, determine triggers, identify behaviours and generate feedback This Steps To Conduct Retention Analysis To Optimize Churn Product Analytics Implementation Data Analytics V is perfect for any presentation, be it in front of clients or colleagues. It is a versatile and stylish solution for organizing your meetings. The Steps To Conduct Retention Analysis To Optimize Churn Product Analytics Implementation Data Analytics V features a modern design for your presentation meetings. The adjustable and customizable slides provide unlimited possibilities for acing up your presentation. Slidegeeks has done all the homework before launching the product for you. So, do not wait, grab the presentation templates today This slide provides phases to conduct retention analysis aimed at helping businesses improve churn rate. It covers six steps such as calculate rate, choose retention KPIs, flag behaviours, determine triggers, identify behaviours and generate feedback
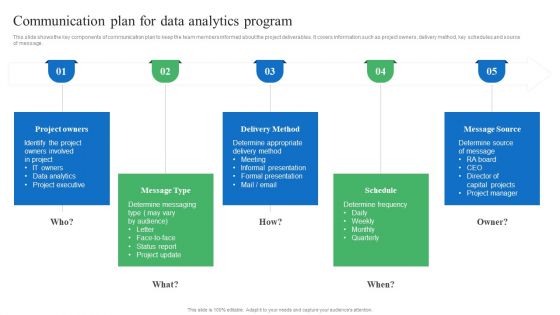
Toolkit For Data Science And Analytics Transition Communication Plan For Data Analytics Program Designs PDF
This slide shows the key components of communication plan to keep the team members informed about the project deliverables. It covers information such as project owners, delivery method, key schedules and source of message. There are so many reasons you need a Toolkit For Data Science And Analytics Transition Communication Plan For Data Analytics Program Designs PDF. The first reason is you can not spend time making everything from scratch, Thus, Slidegeeks has made presentation templates for you too. You can easily download these templates from our website easily.
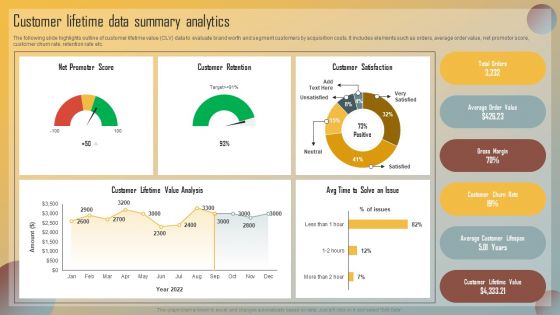
Guide For Marketing Analytics To Improve Decisions Customer Lifetime Data Summary Analytics Structure PDF
The following slide highlights outline of customer lifetime value CLV data to evaluate brand worth and segment customers by acquisition costs. It includes elements such as orders, average order value, net promotor score, customer churn rate, retention rate etc. Find a pre designed and impeccable Guide For Marketing Analytics To Improve Decisions Customer Lifetime Data Summary Analytics Structure PDF. The templates can ace your presentation without additional effort. You can download these easy to edit presentation templates to make your presentation stand out from others. So, what are you waiting for Download the template from Slidegeeks today and give a unique touch to your presentation.
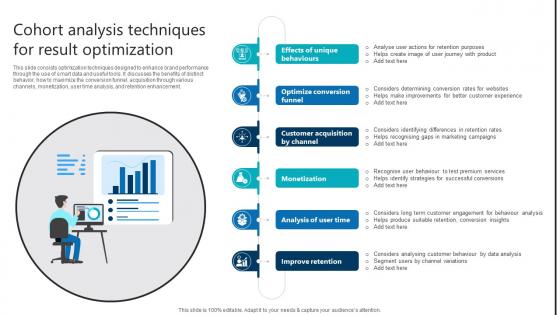
Cohort Analysis Techniques For Result Optimization Product Analytics Implementation Data Analytics V
This slide consists optimization techniques designed to enhance brand performance through the use of smart data and useful tools. It discusses the benefits of distinct behavior, how to maximize the conversion funnel, acquisition through various channels, monetization, user time analysis, and retention enhancement. Whether you have daily or monthly meetings, a brilliant presentation is necessary. Cohort Analysis Techniques For Result Optimization Product Analytics Implementation Data Analytics V can be your best option for delivering a presentation. Represent everything in detail using Cohort Analysis Techniques For Result Optimization Product Analytics Implementation Data Analytics V and make yourself stand out in meetings. The template is versatile and follows a structure that will cater to your requirements. All the templates prepared by Slidegeeks are easy to download and edit. Our research experts have taken care of the corporate themes as well. So, give it a try and see the results. This slide consists optimization techniques designed to enhance brand performance through the use of smart data and useful tools. It discusses the benefits of distinct behavior, how to maximize the conversion funnel, acquisition through various channels, monetization, user time analysis, and retention enhancement.
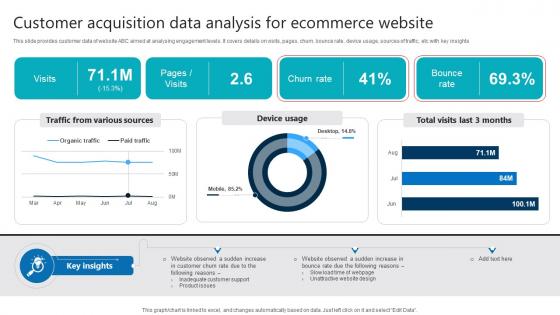
Customer Acquisition Data Analysis For Ecommerce Website Product Analytics Implementation Data Analytics V
This slide provides customer data of website ABC aimed at analysing engagement levels. It covers details on visits, pages, churn, bounce rate, device usage, sources of traffic, etc with key insights If you are looking for a format to display your unique thoughts, then the professionally designed Customer Acquisition Data Analysis For Ecommerce Website Product Analytics Implementation Data Analytics V is the one for you. You can use it as a Google Slides template or a PowerPoint template. Incorporate impressive visuals, symbols, images, and other charts. Modify or reorganize the text boxes as you desire. Experiment with shade schemes and font pairings. Alter, share or cooperate with other people on your work. Download Customer Acquisition Data Analysis For Ecommerce Website Product Analytics Implementation Data Analytics V and find out how to give a successful presentation. Present a perfect display to your team and make your presentation unforgettable. This slide provides customer data of website ABC aimed at analysing engagement levels. It covers details on visits, pages, churn, bounce rate, device usage, sources of traffic, etc with key insights
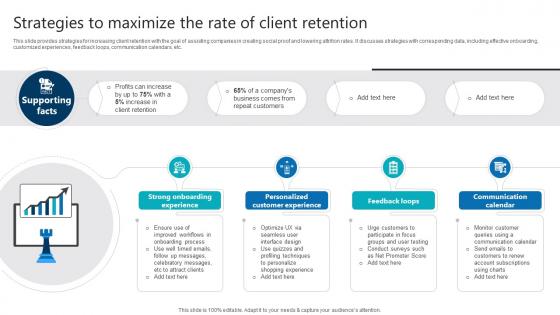
Strategies To Maximize The Rate Of Client Retention Product Analytics Implementation Data Analytics V
This slide provides strategies for increasing client retention with the goal of assisting companies in creating social proof and lowering attrition rates. It discusses strategies with corresponding data, including effective onboarding, customized experiences, feedback loops, communication calendars, etc. Explore a selection of the finest Strategies To Maximize The Rate Of Client Retention Product Analytics Implementation Data Analytics V here. With a plethora of professionally designed and pre-made slide templates, you can quickly and easily find the right one for your upcoming presentation. You can use our Strategies To Maximize The Rate Of Client Retention Product Analytics Implementation Data Analytics V to effectively convey your message to a wider audience. Slidegeeks has done a lot of research before preparing these presentation templates. The content can be personalized and the slides are highly editable. Grab templates today from Slidegeeks. This slide provides strategies for increasing client retention with the goal of assisting companies in creating social proof and lowering attrition rates. It discusses strategies with corresponding data, including effective onboarding, customized experiences, feedback loops, communication calendars, etc.
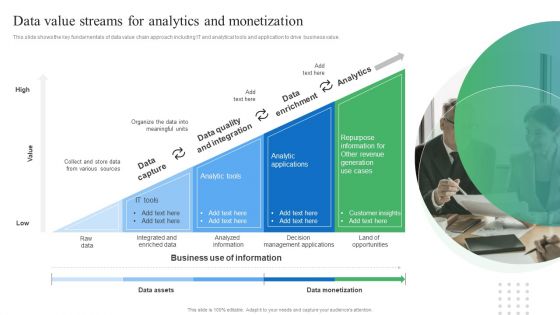
Toolkit For Data Science And Analytics Transition Data Value Streams For Analytics And Monetization Formats PDF
This slide shows the key fundamentals of data value chain approach including IT and analytical tools and application to drive business value. Present like a pro with Toolkit For Data Science And Analytics Transition Data Value Streams For Analytics And Monetization Formats PDF Create beautiful presentations together with your team, using our easy to use presentation slides. Share your ideas in real time and make changes on the fly by downloading our templates. So whether you are in the office, on the go, or in a remote location, you can stay in sync with your team and present your ideas with confidence. With Slidegeeks presentation got a whole lot easier. Grab these presentations today.
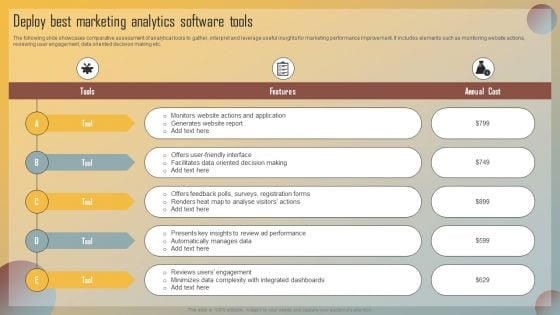
Guide For Marketing Analytics To Improve Decisions Deploy Best Marketing Analytics Software Tools Information PDF
The following slide showcases comparative assessment of analytical tools to gather, interpret and leverage useful insights for marketing performance improvement. It includes elements such as monitoring website actions, reviewing user engagement, data oriented decision making etc. Want to ace your presentation in front of a live audience Our Guide For Marketing Analytics To Improve Decisions Deploy Best Marketing Analytics Software Tools Information PDF can help you do that by engaging all the users towards you. Slidegeeks experts have put their efforts and expertise into creating these impeccable powerpoint presentations so that you can communicate your ideas clearly. Moreover, all the templates are customizable, and easy to edit and downloadable. Use these for both personal and commercial use.
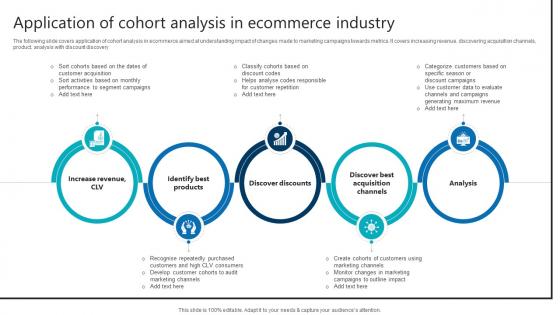
Application Of Cohort Analysis In Ecommerce Industry Product Analytics Implementation Data Analytics V
The following slide covers application of cohort analysis in ecommerce aimed at understanding impact of changes made to marketing campaigns towards metrics. It covers increasing revenue, discovering acquisition channels, product, analysis with discount discovery Boost your pitch with our creative Application Of Cohort Analysis In Ecommerce Industry Product Analytics Implementation Data Analytics V. Deliver an awe-inspiring pitch that will mesmerize everyone. Using these presentation templates you will surely catch everyones attention. You can browse the ppts collection on our website. We have researchers who are experts at creating the right content for the templates. So you do not have to invest time in any additional work. Just grab the template now and use them. The following slide covers application of cohort analysis in ecommerce aimed at understanding impact of changes made to marketing campaigns towards metrics. It covers increasing revenue, discovering acquisition channels, product, analysis with discount discovery

Case Study Trend Analysis For Telecommunications Business Product Analytics Implementation Data Analytics V
This slide provides a case study highlighting use of trend analysis in a telecom company to improve its sales. It covers challenges faced, initiatives undertaken and outcomes on costs and sales Slidegeeks is here to make your presentations a breeze with Case Study Trend Analysis For Telecommunications Business Product Analytics Implementation Data Analytics V With our easy-to-use and customizable templates, you can focus on delivering your ideas rather than worrying about formatting. With a variety of designs to choose from, you are sure to find one that suits your needs. And with animations and unique photos, illustrations, and fonts, you can make your presentation pop. So whether you are giving a sales pitch or presenting to the board, make sure to check out Slidegeeks first This slide provides a case study highlighting use of trend analysis in a telecom company to improve its sales. It covers challenges faced, initiatives undertaken and outcomes on costs and sales
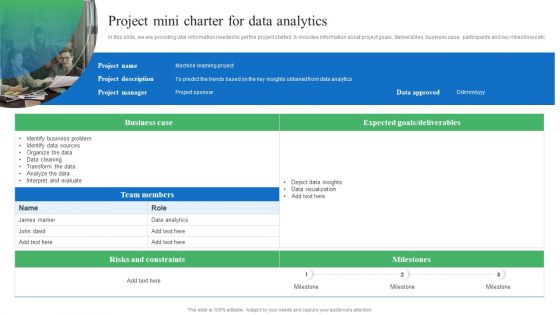
Toolkit For Data Science And Analytics Transition Project Mini Charter For Data Analytics Pictures PDF
In this slide, we are providing vital information needed to get the project started. It includes information about project goals, deliverables, business case, participants and key milestones etc. Welcome to our selection of the Toolkit For Data Science And Analytics Transition Project Mini Charter For Data Analytics Pictures PDF. These are designed to help you showcase your creativity and bring your sphere to life. Planning and Innovation are essential for any business that is just starting out. This collection contains the designs that you need for your everyday presentations. All of our PowerPoints are 100 percent editable, so you can customize them to suit your needs. This multi purpose template can be used in various situations. Grab these presentation templates today.
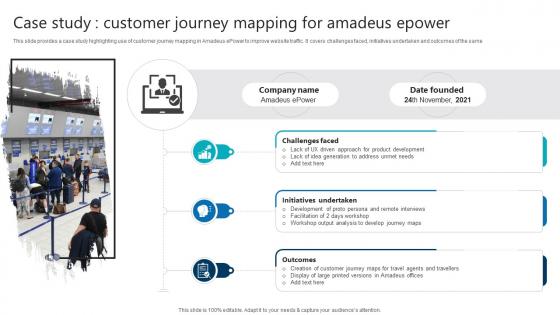
Case Study Customer Journey Mapping For Amadeus Epower Product Analytics Implementation Data Analytics V
This slide provides a case study highlighting use of customer journey mapping in Amadeus ePower to improve website traffic. It covers challenges faced, initiatives undertaken and outcomes of the samePresent like a pro with Case Study Customer Journey Mapping For Amadeus Epower Product Analytics Implementation Data Analytics V. Create beautiful presentations together with your team, using our easy-to-use presentation slides. Share your ideas in real-time and make changes on the fly by downloading our templates. So whether you are in the office, on the go, or in a remote location, you can stay in sync with your team and present your ideas with confidence. With Slidegeeks presentation got a whole lot easier. Grab these presentations today. This slide provides a case study highlighting use of customer journey mapping in Amadeus ePower to improve website traffic. It covers challenges faced, initiatives undertaken and outcomes of the same
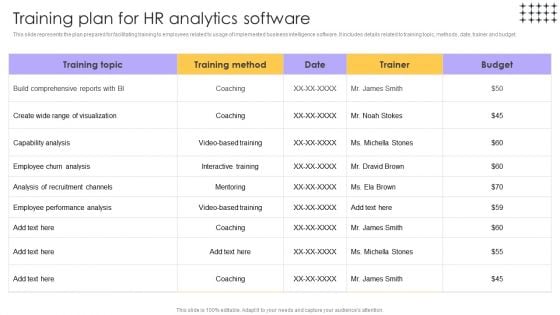
Tools For HR Business Analytics Training Plan For HR Analytics Software Inspiration PDF
This slide represents the plan prepared for facilitating training to employees related to usage of implemented business intelligence software. It includes details related to training topic, methods, date, trainer and budget. Slidegeeks has constructed Tools For HR Business Analytics Training Plan For HR Analytics Software Inspiration PDF after conducting extensive research and examination. These presentation templates are constantly being generated and modified based on user preferences and critiques from editors. Here, you will find the most attractive templates for a range of purposes while taking into account ratings and remarks from users regarding the content. This is an excellent jumping-off point to explore our content and will give new users an insight into our top-notch PowerPoint Templates.
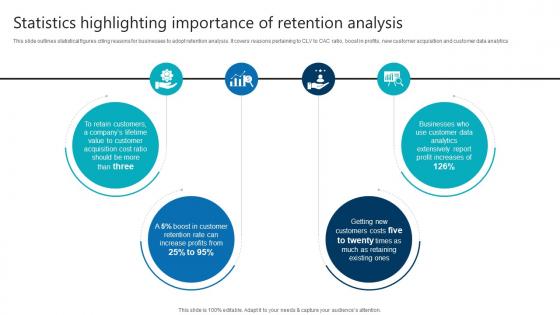
Statistics Highlighting Importance Of Retention Analysis Product Analytics Implementation Data Analytics V
This slide outlines statistical figures citing reasons for businesses to adopt retention analysis. It covers reasons pertaining to CLV to CAC ratio, boost in profits, new customer acquisition and customer data analyticsAre you in need of a template that can accommodate all of your creative concepts This one is crafted professionally and can be altered to fit any style. Use it with Google Slides or PowerPoint. Include striking photographs, symbols, depictions, and other visuals. Fill, move around, or remove text boxes as desired. Test out color palettes and font mixtures. Edit and save your work, or work with colleagues. Download Statistics Highlighting Importance Of Retention Analysis Product Analytics Implementation Data Analytics V and observe how to make your presentation outstanding. Give an impeccable presentation to your group and make your presentation unforgettable. This slide outlines statistical figures citing reasons for businesses to adopt retention analysis. It covers reasons pertaining to CLV to CAC ratio, boost in profits, new customer acquisition and customer data analytics
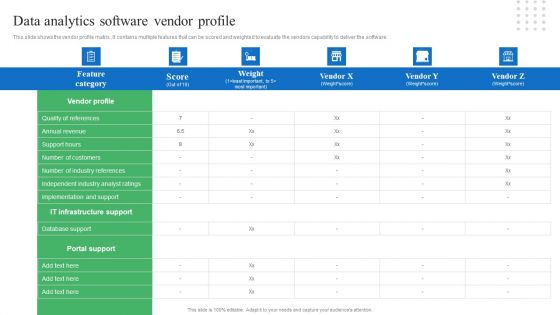
Toolkit For Data Science And Analytics Transition Data Analytics Software Vendor Profile Themes PDF
This slide shows the vendor profile matrix. It contains multiple features that can be scored and weighted to evaluate the vendors capability to deliver the software. Slidegeeks is here to make your presentations a breeze with Toolkit For Data Science And Analytics Transition Data Analytics Software Vendor Profile Themes PDF With our easy to use and customizable templates, you can focus on delivering your ideas rather than worrying about formatting. With a variety of designs to choose from, you are sure to find one that suits your needs. And with animations and unique photos, illustrations, and fonts, you can make your presentation pop. So whether you are giving a sales pitch or presenting to the board, make sure to check out Slidegeeks first.
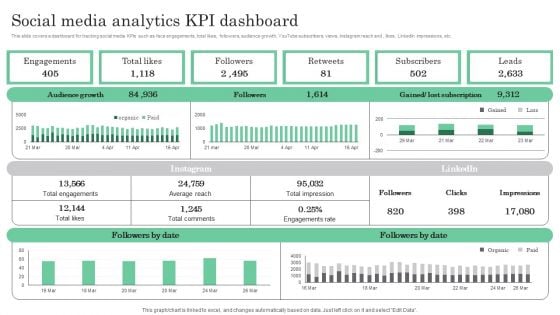
Online Marketing Analytics To Enhance Business Growth Social Media Analytics KPI Dashboard Brochure PDF
This slide covers a dashboard for tracking social media KPIs such as face engagements, total likes, followers, audience growth, YouTube subscribers, views, Instagram reach and , likes, LinkedIn impressions, etc. Slidegeeks is here to make your presentations a breeze with Online Marketing Analytics To Enhance Business Growth Social Media Analytics KPI Dashboard Brochure PDF With our easy to use and customizable templates, you can focus on delivering your ideas rather than worrying about formatting. With a variety of designs to choose from, you are sure to find one that suits your needs. And with animations and unique photos, illustrations, and fonts, you can make your presentation pop. So whether you are giving a sales pitch or presenting to the board, make sure to check out Slidegeeks first.
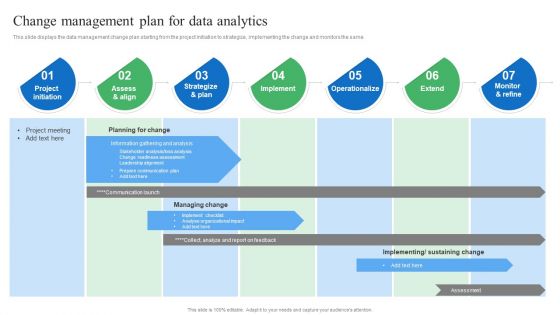
Toolkit For Data Science And Analytics Transition Change Management Plan For Data Analytics Structure PDF
This slide displays the data management change plan starting from the project initiation to strategize, implementing the change and monitors the same. Do you know about Slidesgeeks Toolkit For Data Science And Analytics Transition Change Management Plan For Data Analytics Structure PDF These are perfect for delivering any kind od presentation. Using it, create PowerPoint presentations that communicate your ideas and engage audiences. Save time and effort by using our pre designed presentation templates that are perfect for a wide range of topic. Our vast selection of designs covers a range of styles, from creative to business, and are all highly customizable and easy to edit. Download as a PowerPoint template or use them as Google Slides themes.
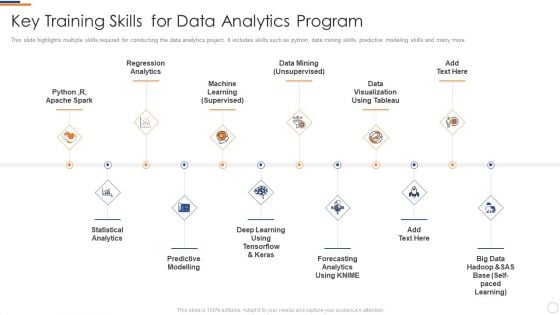
Business Intelligence And Big Key Training Skills For Data Analytics Program Guidelines PDF
This slide highlights multiple skills required for conducting the data analytics project. It includes skills such as python, data mining skills, predictive modeling skills and many more. This is a business intelligence and big key training skills for data analytics program guidelines pdf template with various stages. Focus and dispense information on twelve stages using this creative set, that comes with editable features. It contains large content boxes to add your information on topics like regression analytics, data mining, data visualization using tableau, statistical analytics, predictive modelling. You can also showcase facts, figures, and other relevant content using this PPT layout. Grab it now.
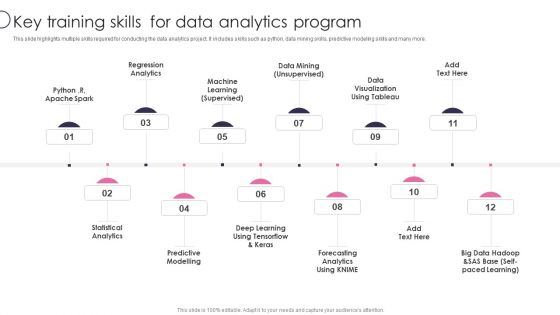
Information Transformation Process Toolkit Key Training Skills For Data Analytics Program Professional PDF
This slide highlights multiple skills required for conducting the data analytics project. It includes skills such as python, data mining skills, predictive modeling skills and many more. This is a Information Transformation Process Toolkit Key Training Skills For Data Analytics Program Professional PDF template with various stages. Focus and dispense information on tweleve stages using this creative set, that comes with editable features. It contains large content boxes to add your information on topics like Statistical Analytics, Regression Analytics, Predictive Modelling. You can also showcase facts, figures, and other relevant content using this PPT layout. Grab it now.
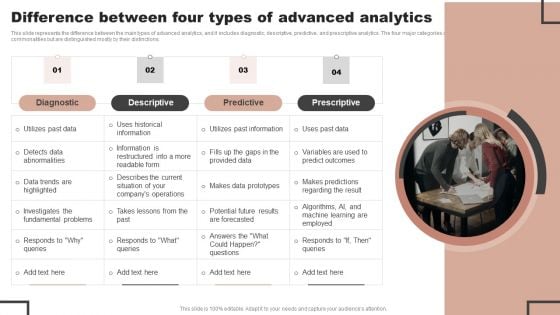
Forecast Analysis Technique IT Difference Between Four Types Of Advanced Analytics Brochure PDF
This slide represents the difference between the main types of advanced analytics, and it includes diagnostic, descriptive, predictive, and prescriptive analytics. The four major categories of advanced analytics share certain commonalities but are distinguished mostly by their distinctions. There are so many reasons you need a Forecast Analysis Technique IT Difference Between Four Types Of Advanced Analytics Brochure PDF. The first reason is you can not spend time making everything from scratch, Thus, Slidegeeks has made presentation templates for you too. You can easily download these templates from our website easily.
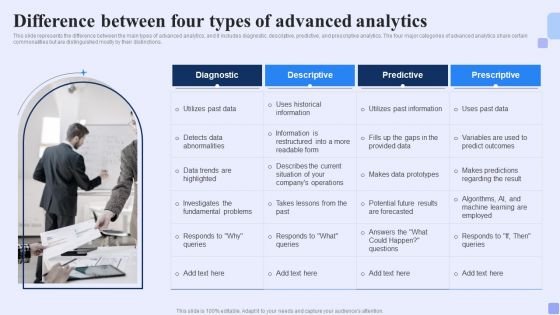
Difference Between Four Types Of Advanced Analytics Forward Looking Analysis IT Template PDF
This slide represents the difference between the main types of advanced analytics, and it includes diagnostic, descriptive, predictive, and prescriptive analytics. The four major categories of advanced analytics share certain commonalities but are distinguished mostly by their distinctions.There are so many reasons you need a Difference Between Four Types Of Advanced Analytics Forward Looking Analysis IT Template PDF. The first reason is you can notspend time making everything from scratch, Thus, Slidegeeks has made presentation templates for you too. You can easily download these templates from our website easily.
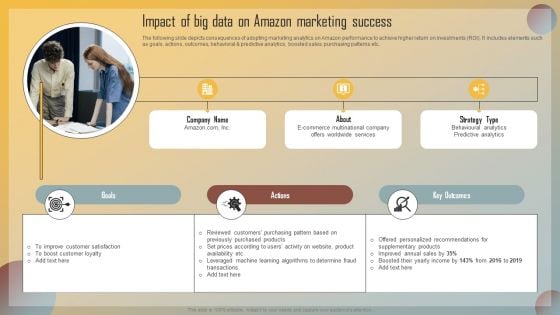
Guide For Marketing Analytics To Improve Decisions Impact Of Big Data On Amazon Marketing Success Summary PDF
The following slide depicts consequences of adopting marketing analytics on Amazon performance to achieve higher return on investments ROI. It includes elements such as goals, actions, outcomes, behavioral and predictive analytics, boosted sales, purchasing patterns etc. Slidegeeks is here to make your presentations a breeze with Guide For Marketing Analytics To Improve Decisions Impact Of Big Data On Amazon Marketing Success Summary PDF With our easy to use and customizable templates, you can focus on delivering your ideas rather than worrying about formatting. With a variety of designs to choose from, you are sure to find one that suits your needs. And with animations and unique photos, illustrations, and fonts, you can make your presentation pop. So whether you are giving a sales pitch or presenting to the board, make sure to check out Slidegeeks first.
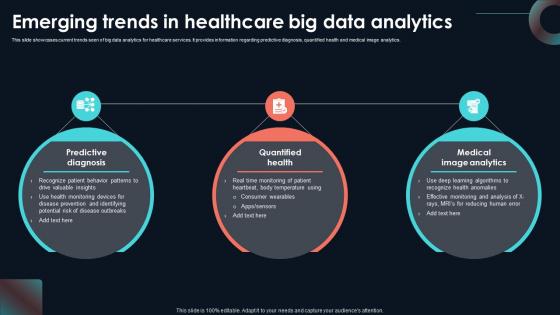
Emerging Trends In Healthcare Big Developing Strategic Insights Using Big Data Analytics SS V
This slide showcases current trends seen of big data analytics for healthcare services. It provides information regarding predictive diagnosis, quantified health and medical image analytics. Are you searching for a Emerging Trends In Healthcare Big Developing Strategic Insights Using Big Data Analytics SS V that is uncluttered, straightforward, and original Its easy to edit, and you can change the colors to suit your personal or business branding. For a presentation that expresses how much effort you have put in, this template is ideal With all of its features, including tables, diagrams, statistics, and lists, its perfect for a business plan presentation. Make your ideas more appealing with these professional slides. Download Emerging Trends In Healthcare Big Developing Strategic Insights Using Big Data Analytics SS V from Slidegeeks today. This slide showcases current trends seen of big data analytics for healthcare services. It provides information regarding predictive diagnosis, quantified health and medical image analytics.
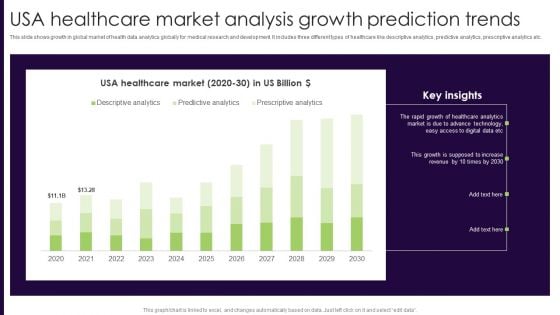
USA Healthcare Market Analysis Growth Prediction Trends Inspiration PDF
This slide shows growth in global market of health data analytics globally for medical research and development. It includes three different types of healthcare like descriptive analytics, predictive analytics, prescriptive analytics etc. Pitch your topic with ease and precision using this USA Healthcare Market Analysis Growth Prediction Trends Inspiration PDF. This layout presents information on USA Healthcare Market Analysis, Growth Prediction Trends. It is also available for immediate download and adjustment. So, changes can be made in the color, design, graphics or any other component to create a unique layout.
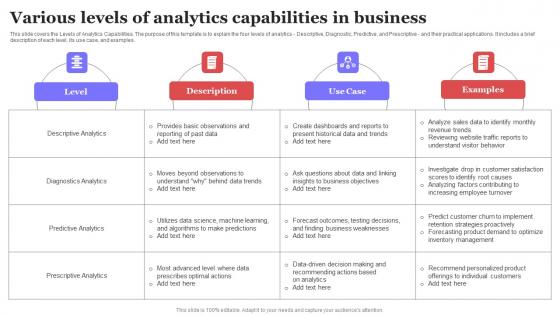
Various Levels Of Analytics Capabilities In Business Ppt Ideas Inspiration PDF
This slide covers the Levels of Analytics Capabilities. The purpose of this template is to explain the four levels of analytics Descriptive, Diagnostic, Predictive, and Prescriptive and their practical applications. It includes a brief description of each level, its use case, and examples. Pitch your topic with ease and precision using this Various Levels Of Analytics Capabilities In Business Ppt Ideas Inspiration PDF. This layout presents information on Analytics Descriptive, Diagnostic, Predictive. It is also available for immediate download and adjustment. So, changes can be made in the color, design, graphics or any other component to create a unique layout. This slide covers the Levels of Analytics Capabilities. The purpose of this template is to explain the four levels of analytics Descriptive, Diagnostic, Predictive, and Prescriptive and their practical applications. It includes a brief description of each level, its use case, and examples.
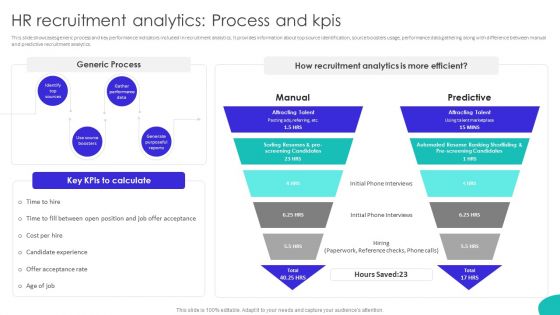
Improving Technology Based HR Recruitment Analytics Process And Kpis Designs PDF
This slide showcases generic process and key performance indicators included in recruitment analytics. It provides information about top source identification, source boosters usage, performance data gathering along with difference between manual and predictive recruitment analytics. Are you in need of a template that can accommodate all of your creative concepts This one is crafted professionally and can be altered to fit any style. Use it with Google Slides or PowerPoint. Include striking photographs, symbols, depictions, and other visuals. Fill, move around, or remove text boxes as desired. Test out color palettes and font mixtures. Edit and save your work, or work with colleagues. Download Improving Technology Based HR Recruitment Analytics Process And Kpis Designs PDF and observe how to make your presentation outstanding. Give an impeccable presentation to your group and make your presentation unforgettable.
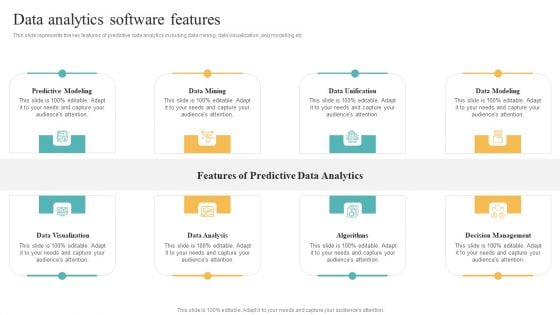
Transformation Toolkit Competitive Intelligence Information Analysis Data Analytics Software Features Template PDF
This slide represents the key features of predictive data analytics including data mining, data visualization, and modelling etc. Coming up with a presentation necessitates that the majority of the effort goes into the content and the message you intend to convey. The visuals of a PowerPoint presentation can only be effective if it supplements and supports the story that is being told. Keeping this in mind our experts created Transformation Toolkit Competitive Intelligence Information Analysis Data Analytics Software Features Template PDF to reduce the time that goes into designing the presentation. This way, you can concentrate on the message while our designers take care of providing you with the right template for the situation.
Benefits Offered By Analytics System To Business Ppt PowerPoint Presentation Professional Icon PDF
Presenting benefits offered by analytics system to business ppt powerpoint presentation professional icon pdf to dispense important information. This template comprises four stages. It also presents valuable insights into the topics including predictive modeling, better decision making, more accessible analytics. This is a completely customizable PowerPoint theme that can be put to use immediately. So, download it and address the topic impactfully.
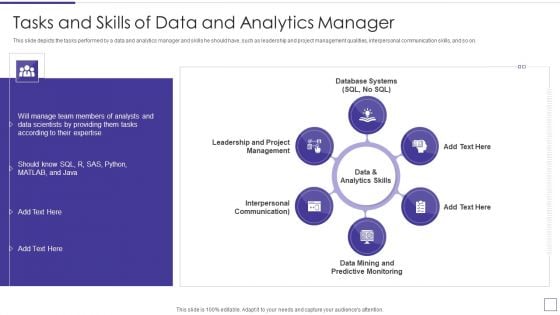
Data Mining Implementation Tasks And Skills Of Data And Analytics Manager Graphics PDF
This slide depicts the tasks performed by a data and analytics manager and skills he should have, such as leadership and project management qualities, interpersonal communication skills, and so on. This is a data mining implementation tasks and skills of data and analytics manager graphics pdf template with various stages. Focus and dispense information on six stages using this creative set, that comes with editable features. It contains large content boxes to add your information on topics like interpersonal communication, mining and predictive monitoring, data and analytics skills You can also showcase facts, figures, and other relevant content using this PPT layout. Grab it now.

Projection Model Difference Between Four Types Of Advanced Analytics Portrait PDF
This slide represents the difference between the main types of advanced analytics, and it includes diagnostic, descriptive, predictive, and prescriptive analytics. The four major categories of advanced analytics share certain commonalities but are distinguished mostly by their distinctions. Are you in need of a template that can accommodate all of your creative concepts This one is crafted professionally and can be altered to fit any style. Use it with Google Slides or PowerPoint. Include striking photographs, symbols, depictions, and other visuals. Fill, move around, or remove text boxes as desired. Test out color palettes and font mixtures. Edit and save your work, or work with colleagues. Download Projection Model Difference Between Four Types Of Advanced Analytics Portrait PDF and observe how to make your presentation outstanding. Give an impeccable presentation to your group and make your presentation unforgettable.
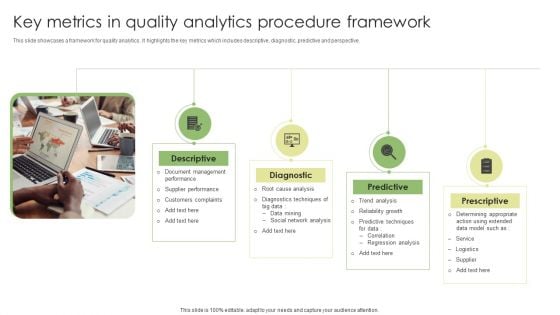
Key Metrics In Quality Analytics Procedure Framework Slides PDF
This slide showcases a framework for quality analytics. It highlights the key metrics which includes descriptive, diagnostic, predictive and perspective. Persuade your audience using this Key Metrics In Quality Analytics Procedure Framework Slides PDF. This PPT design covers four stages, thus making it a great tool to use. It also caters to a variety of topics including Descriptive, Predictive, Diagnostic. Download this PPT design now to present a convincing pitch that not only emphasizes the topic but also showcases your presentation skills.
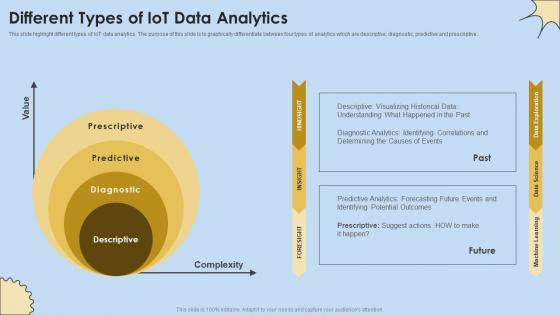
Different Types Of IoT Data Analytics Internet Of Things Analysis Mockup Pdf
This slide highlight different types of IoT data analytics. The purpose of this slide is to graphically differentiate between four types of analytics which are descriptive, diagnostic, predictive and prescriptive. Are you in need of a template that can accommodate all of your creative concepts This one is crafted professionally and can be altered to fit any style. Use it with Google Slides or PowerPoint. Include striking photographs, symbols, depictions, and other visuals. Fill, move around, or remove text boxes as desired. Test out color palettes and font mixtures. Edit and save your work, or work with colleagues. Download Different Types Of IoT Data Analytics Internet Of Things Analysis Mockup Pdf and observe how to make your presentation outstanding. Give an impeccable presentation to your group and make your presentation unforgettable. This slide highlight different types of IoT data analytics. The purpose of this slide is to graphically differentiate between four types of analytics which are descriptive, diagnostic, predictive and prescriptive.
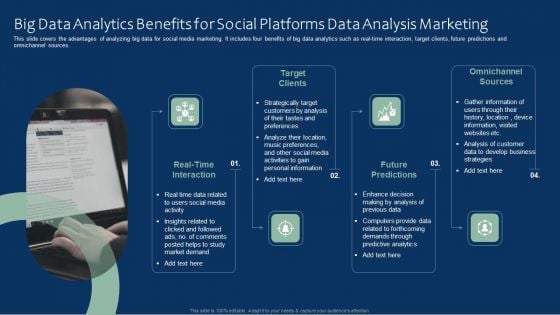
Big Data Analytics Benefits For Social Platforms Data Analysis Marketing Mockup PDF
This slide covers the advantages of analyzing big data for social media marketing. It includes four benefits of big data analytics such as real-time interaction, target clients, future predictions and omnichannel sources. Presenting Big Data Analytics Benefits For Social Platforms Data Analysis Marketing Mockup PDF to dispense important information. This template comprises four stages. It also presents valuable insights into the topics including Target Clients, Future Predictions, Omnichannel Sources. This is a completely customizable PowerPoint theme that can be put to use immediately. So, download it and address the topic impactfully.
Data Analytics IT Data Science In Healthcare Department Ppt Professional Icon PDF
This slide depicts the role of data science in healthcare departments and its benefits in different ways, such as image analysis, drug discovery, genetics and Genomics, predictive diagnosis, and NLP. Presenting data analytics it data science in healthcare department ppt professional icon pdf to provide visual cues and insights. Share and navigate important information on five stages that need your due attention. This template can be used to pitch topics like medical image analysis, drug discovery, genetics and genomics, predictive diagnosis, natural language processing. In addtion, this PPT design contains high resolution images, graphics, etc, that are easily editable and available for immediate download.
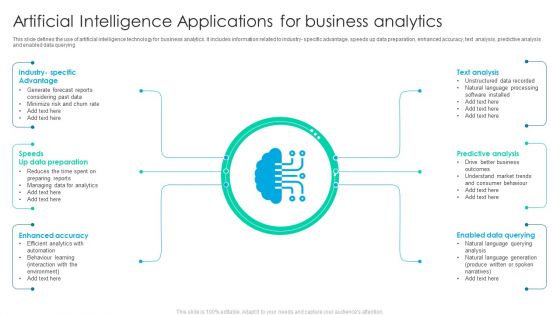
Artificial Intelligence Applications For Business Analytics Guidelines PDF
This slide defines the use of artificial intelligence technology for business analytics. It includes information related to industry- specific advantage, speeds up data preparation, enhanced accuracy, text analysis, predictive analysis and enabled data querying. Persuade your audience using this Artificial Intelligence Applications For Business Analytics Guidelines PDF. This PPT design covers six stages, thus making it a great tool to use. It also caters to a variety of topics including Industry Specific Advantage, Speeds Up Data Preparation, Enhanced Accuracy. Download this PPT design now to present a convincing pitch that not only emphasizes the topic but also showcases your presentation skills.
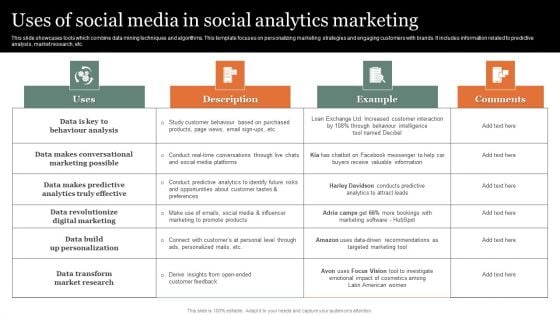
Uses Of Social Media In Social Analytics Marketing Sample PDF
This slide showcases tools which combine data mining techniques and algorithms. This template focuses on personalizing marketing strategies and engaging customers with brands. It includes information related to predictive analysis, market research, etc. Pitch your topic with ease and precision using this Uses Of Social Media In Social Analytics Marketing Sample PDF Slides. This layout presents information on Comments, Description, Analytics Marketing. It is also available for immediate download and adjustment. So, changes can be made in the color, design, graphics or any other component to create a unique layout.
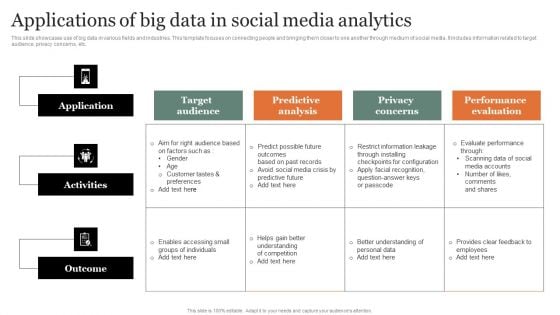
Applications Of Big Data In Social Media Analytics Graphics PDF
This slide showcases use of big data in various fields and industries. This template focuses on connecting people and bringing them closer to one another through medium of social media. It includes information related to target audience, privacy concerns, etc. Showcasing this set of slides titled Applications Of Big Data In Social Media Analytics Graphics PDF Brochure. The topics addressed in these templates are Target Audience, Predictive Analysis, Performance Evaluation. All the content presented in this PPT design is completely editable. Download it and make adjustments in color, background, font etc. as per your unique business setting.
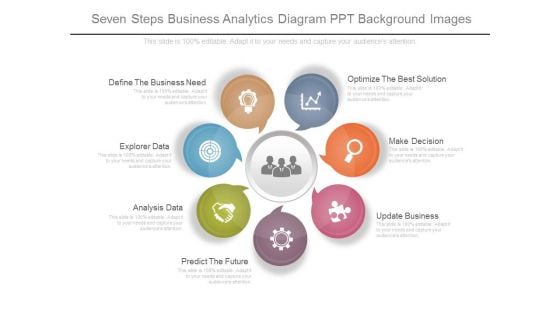
Seven Steps Business Analytics Diagram Ppt Background Images
This is a seven steps business analytics diagram ppt background images. This is a seven stage process. The stages in this process are optimize the best solution, make decision, update business, predict the future, analysis data, explorer data, define the business need.
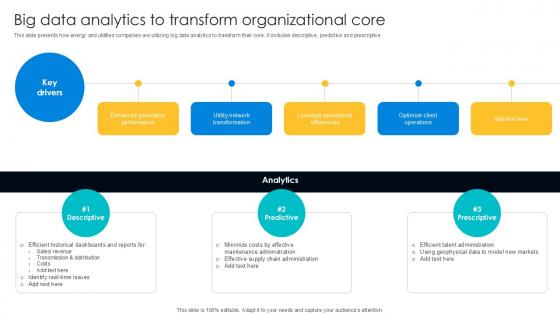
Big Data Analytics To Transform Digital Transformation Journey PPT Template DT SS V
This slide presents how energy and utilities companies are utilizing big data analytics to transform their core. It includes descriptive, predictive and prescriptive. Whether you have daily or monthly meetings, a brilliant presentation is necessary. Big Data Analytics To Transform Digital Transformation Journey PPT Template DT SS V can be your best option for delivering a presentation. Represent everything in detail using Big Data Analytics To Transform Digital Transformation Journey PPT Template DT SS V and make yourself stand out in meetings. The template is versatile and follows a structure that will cater to your requirements. All the templates prepared by Slidegeeks are easy to download and edit. Our research experts have taken care of the corporate themes as well. So, give it a try and see the results. This slide presents how energy and utilities companies are utilizing big data analytics to transform their core. It includes descriptive, predictive and prescriptive.
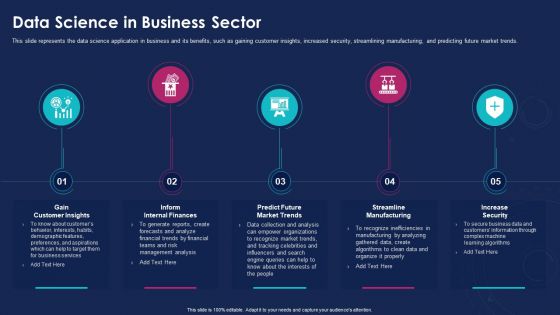
Data Analytics IT Data Science In Business Sector Ppt Ideas Template PDF
This slide represents the data science application in business and its benefits, such as gaining customer insights, increased security, streamlining manufacturing, and predicting future market trends. Presenting data analytics it data science in business sector ppt ideas template pdf to provide visual cues and insights. Share and navigate important information on five stages that need your due attention. This template can be used to pitch topics like gain customer insights, inform internal finances, predict future market trends, streamline manufacturing, increase security. In addtion, this PPT design contains high resolution images, graphics, etc, that are easily editable and available for immediate download.
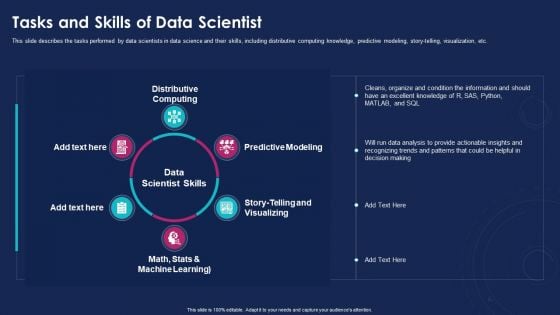
Data Analytics IT Tasks And Skills Of Data Scientist Ppt Slides Information PDF
This slide describes the tasks performed by data scientists in data science and their skills, including distributive computing knowledge, predictive modeling, story-telling, visualization, etc. This is a data analytics it tasks and skills of data scientist ppt slides information pdf template with various stages. Focus and dispense information on six stages using this creative set, that comes with editable features. It contains large content boxes to add your information on topics like distributive computing, math, stats and machine learning, story-telling and visualizing, predictive modeling. You can also showcase facts, figures, and other relevant content using this PPT layout. Grab it now.
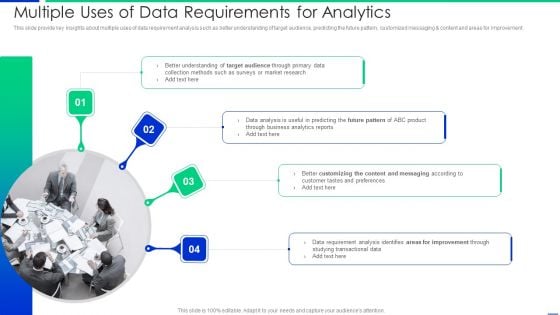
Multiple Uses Of Data Requirements For Analytics Pictures PDF
This slide provide key insights about multiple uses of data requirement analysis such as better understanding of target audience, predicting the future pattern, customized messaging and content and areas for improvement. Presenting multiple uses of data requirements for analytics pictures pdf to dispense important information. This template comprises four stages. It also presents valuable insights into the topics including analysis, customer, requirement. This is a completely customizable PowerPoint theme that can be put to use immediately. So, download it and address the topic impactfully.
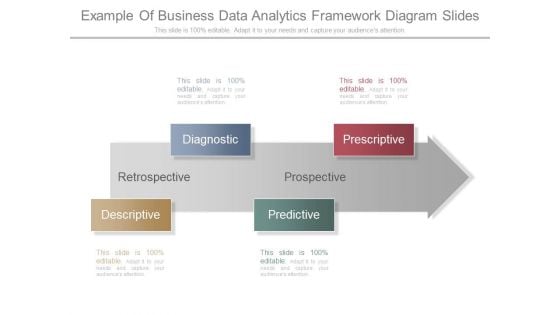
Example Of Business Data Analytics Framework Diagram Slides
This is a example of business data analytics framework diagram slides. This is a four stage process. The stages in this process are diagnostic, descriptive, predictive, prescriptive, retrospective, prospective.
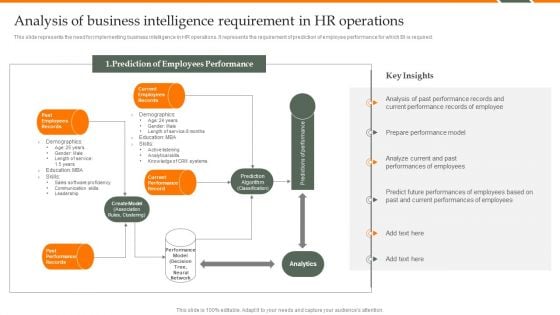
Human Resource Analytics Analysis Of Business Intelligence Requirement Template PDF
This slide represents the need for implementing business intelligence in HR operations. It represents the requirement of prediction of employee performance for which BI is required. Do you know about Slidesgeeks Human Resource Analytics Analysis Of Business Intelligence Requirement Template PDF These are perfect for delivering any kind od presentation. Using it, create PowerPoint presentations that communicate your ideas and engage audiences. Save time and effort by using our pre-designed presentation templates that are perfect for a wide range of topic. Our vast selection of designs covers a range of styles, from creative to business, and are all highly customizable and easy to edit. Download as a PowerPoint template or use them as Google Slides themes.

Role Of Big Data Analytics In Retail Process Developing Strategic Insights Using Big Data Analytics SS V
This slide showcases need of big data analytics to optimize retail operations and improve overall business revenue. It provides information regarding strategic decisions, predicting trends and market assessment. The best PPT templates are a great way to save time, energy, and resources. Slidegeeks have 100 percent editable powerpoint slides making them incredibly versatile. With these quality presentation templates, you can create a captivating and memorable presentation by combining visually appealing slides and effectively communicating your message. Download Role Of Big Data Analytics In Retail Process Developing Strategic Insights Using Big Data Analytics SS V from Slidegeeks and deliver a wonderful presentation. This slide showcases need of big data analytics to optimize retail operations and improve overall business revenue. It provides information regarding strategic decisions, predicting trends and market assessment.


 Continue with Email

 Home
Home


