Presentation Agenda
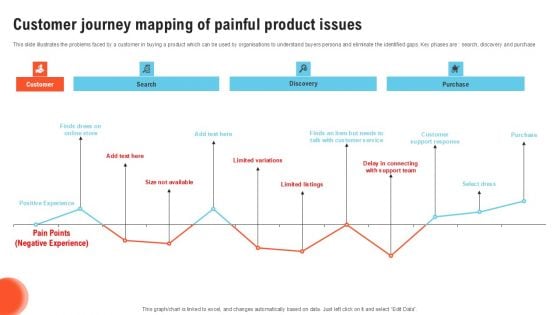
Customer Journey Mapping Of Painful Product Issues Portrait PDF
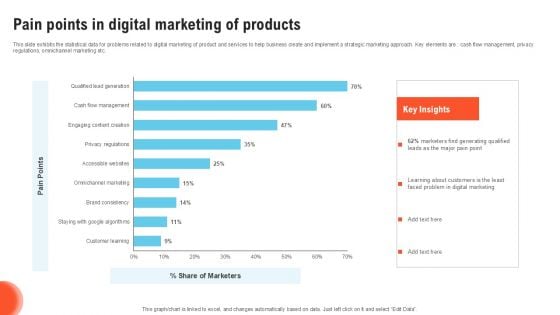
Pain Points In Digital Marketing Of Products Graphics PDF
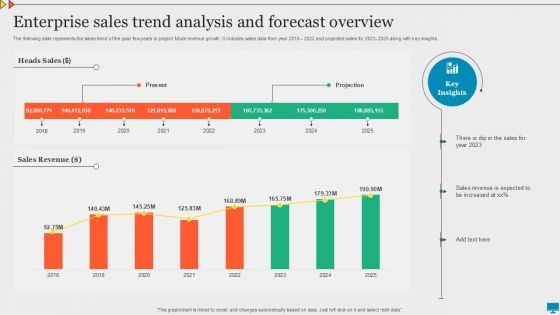
Enterprise Sales Trend Analysis And Forecast Overview Summary PDF
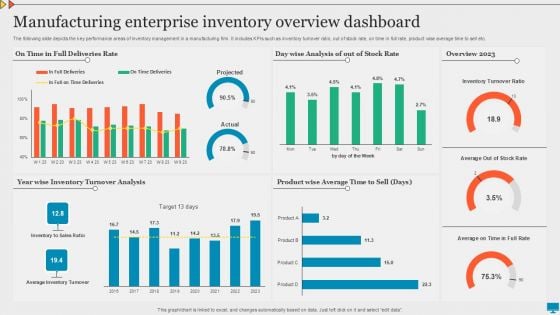
Manufacturing Enterprise Inventory Overview Dashboard Graphics PDF
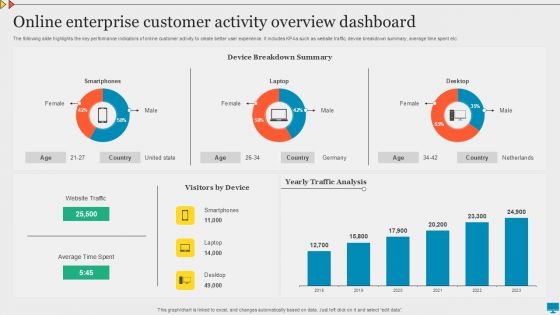
Online Enterprise Customer Activity Overview Dashboard Download PDF
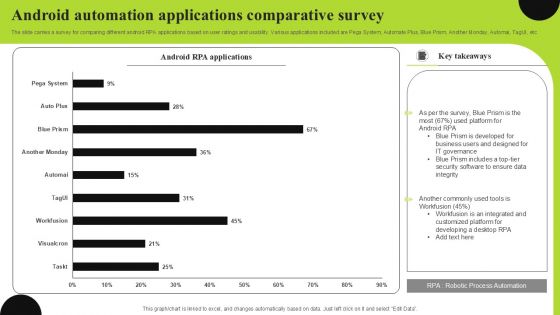
Android Automation Applications Comparative Survey Pictures PDF
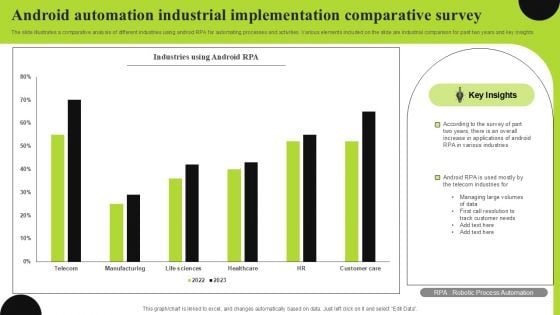
Android Automation Industrial Implementation Comparative Survey Formats PDF
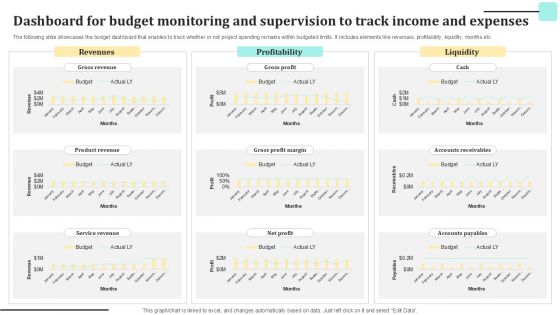
Dashboard For Budget Monitoring And Supervision To Track Income And Expenses Guidelines PDF
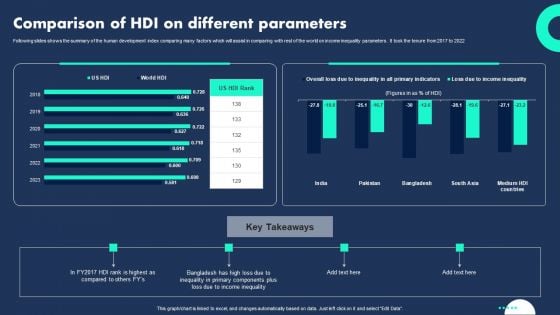
Comparison Of HDI On Different Parameters Diagrams PDF
Following slides shows the summary of the human development index comparing many factors which will assist in comparing with rest of the world on income inequality parameters . It took the tenure from 2017 to 2022. Showcasing this set of slides titled Comparison Of HDI On Different Parameters Diagrams PDF. The topics addressed in these templates are Inequality Primary Components, Plus Loss Income Inequality, Different Parameters . All the content presented in this PPT design is completely editable. Download it and make adjustments in color, background, font etc. as per your unique business setting.
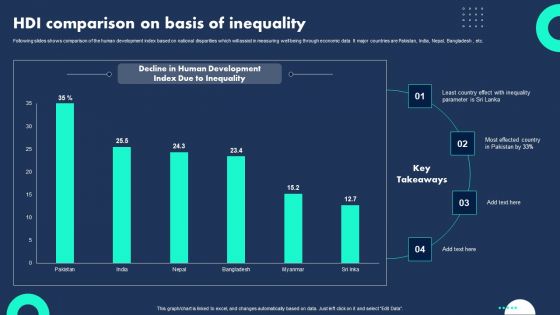
HDI Comparison On Basis Of Inequality Infographics PDF
Following slides shows comparison of the human development index based on national disparities which will assist in measuring well being through economic data It major countries are Pakistan, India, Nepal, Bangladesh , etc. Showcasing this set of slides titled HDI Comparison On Basis Of Inequality Infographics PDF. The topics addressed in these templates are Country Effect, Most Effected Country, Human Development. All the content presented in this PPT design is completely editable. Download it and make adjustments in color, background, font etc. as per your unique business setting.
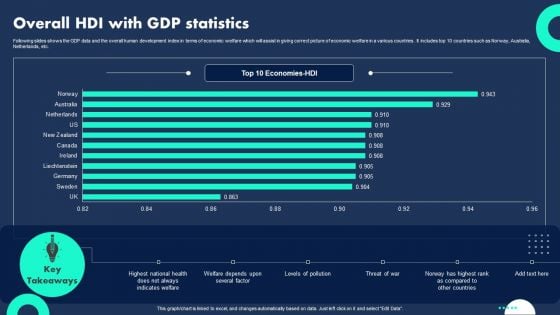
Overall HDI With Gdp Statistics Professional PDF
Following slides shows the GDP data and the overall human development index in terms of economic welfare which will assist in giving correct picture of economic welfare in a various countries . It includes top 10 countries such as Norway, Australia, Netherlands, etc. Showcasing this set of slides titled Overall HDI With Gdp Statistics Professional PDF. The topics addressed in these templates are Indicates Welfare, Welfare Depends, Levels Pollution. All the content presented in this PPT design is completely editable. Download it and make adjustments in color, background, font etc. as per your unique business setting.
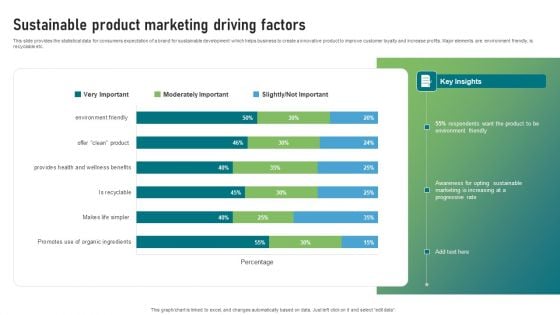
Sustainable Product Marketing Driving Factors Clipart PDF
This slide provides the statistical data for consumers expectation of a brand for sustainable development which helps business to create a innovative product to improve customer loyalty and increase profits. Major elements are environment friendly, is recyclable etc. Showcasing this set of slides titled Sustainable Product Marketing Driving Factors Clipart PDF. The topics addressed in these templates are Respondents, Environment Friendly, Awareness For Opting Sustainable. All the content presented in this PPT design is completely editable. Download it and make adjustments in color, background, font etc. as per your unique business setting.
Dashboard For Enterprise Recruitment With Time To Hire And Fill Icons PDF
In this slide corporate staffing dashboard highlights important recruitment KPIs to review application trends and candidate response to job vacancy. It further includes details about application, review, assessment, interview, etc. Showcasing this set of slides titled Dashboard For Enterprise Recruitment With Time To Hire And Fill Icons PDF. The topics addressed in these templates are Key Metrics, Experienced Ratio, Applicants. All the content presented in this PPT design is completely editable. Download it and make adjustments in color, background, font etc. as per your unique business setting.

Enterprise Recruitment Dashboard With Cost Per Hire Graphics PDF
The following slide showcases KPI dashboard to get real- time insights about efficiency of corporate staffing process in the organization. It includes elements such as hired, days to fill, sources contribution, etc. Pitch your topic with ease and precision using this Enterprise Recruitment Dashboard With Cost Per Hire Graphics PDF. This layout presents information on Enterprise, Contribution, Cost. It is also available for immediate download and adjustment. So, changes can be made in the color, design, graphics or any other component to create a unique layout.
Enterprise Recruitment Dashboard With Shortlisted And Hired Candidates Icons PDF
The following slide showcases dashboard to track status of corporate staffing activities in organization for HR department. It includes KPIs such as total applicants, time and cost to hire, applicant details, etc. Showcasing this set of slides titled Enterprise Recruitment Dashboard With Shortlisted And Hired Candidates Icons PDF. The topics addressed in these templates are Shortlisted candidates, Hired Candidates, Rejected Candidates. All the content presented in this PPT design is completely editable. Download it and make adjustments in color, background, font etc. as per your unique business setting.
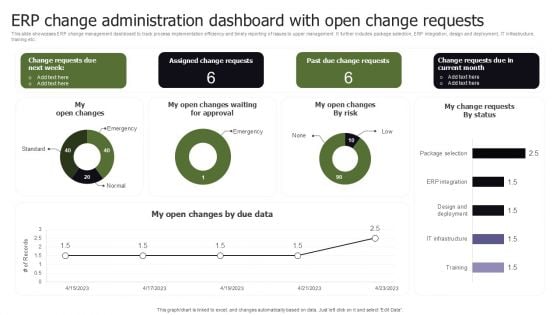
ERP Change Administration Dashboard With Open Change Requests Wd Topics PDF

Emerging Investment Opportunities In Green Financing Themes PDF
This slide brings forth the emerging investment opportunities for financial brands to shift their operations to attract new customers and retain old ones while protecting the planet and ensuring sustainable operations. Key elements are customer needs gap analysis, communication gap and in demand financial products Showcasing this set of slides titled Emerging Investment Opportunities In Green Financing Themes PDF. The topics addressed in these templates are Trust, Products, Analysis. All the content presented in this PPT design is completely editable. Download it and make adjustments in color, background, font etc. as per your unique business setting.
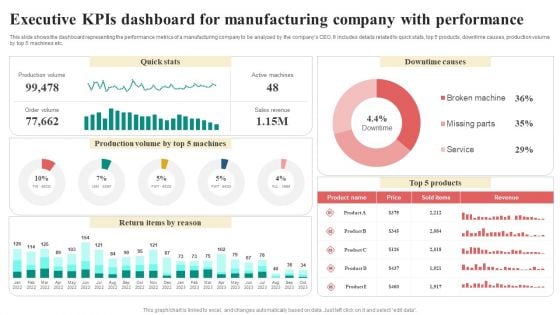
Executive Kpis Dashboard For Manufacturing Company With Performance Infographics PDF
This slide shows the dashboard representing the performance metrics of a manufacturing company to be analyzed by the companys CEO. It includes details related to quick stats, top 5 products, downtime causes, production volume by top 5 machines etc. Showcasing this set of slides titled Executive Kpis Dashboard For Manufacturing Company With Performance Infographics PDF. The topics addressed in these templates are Return Items By Reason, Quick Stats, Downtime Causes, Revenue. All the content presented in this PPT design is completely editable. Download it and make adjustments in color, background, font etc. as per your unique business setting.
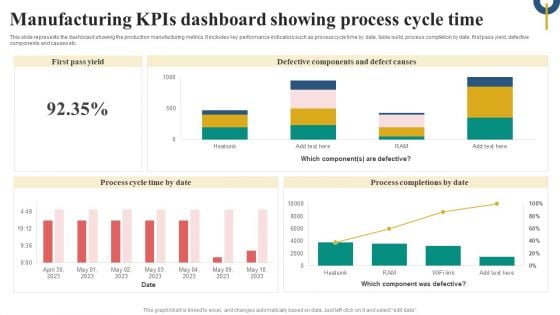
Manufacturing Kpis Dashboard Showing Process Cycle Time Microsoft PDF
This slide represents the dashboard showing the production manufacturing metrics. It includes key performance indicators such as process cycle time by date, table build, process completion by date, first pass yield, defective components and causes etc. Pitch your topic with ease and precision using this Manufacturing Kpis Dashboard Showing Process Cycle Time Microsoft PDF. This layout presents information on Defective Components Defect Causes, Process Cycle, Time By Date, Process Completions By Date. It is also available for immediate download and adjustment. So, changes can be made in the color, design, graphics or any other component to create a unique layout.
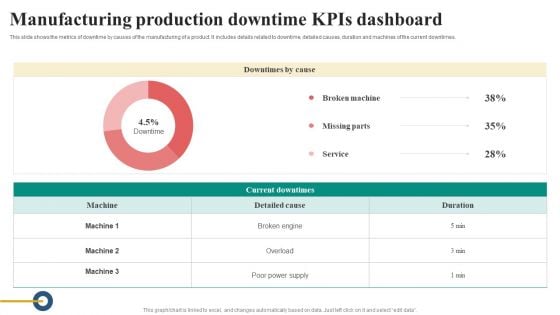
Manufacturing Production Downtime Kpis Dashboard Diagrams PDF
This slide shows the metrics of downtime by causes of the manufacturing of a product. It includes details related to downtime, detailed causes, duration and machines of the current downtimes. Pitch your topic with ease and precision using this Manufacturing Production Downtime Kpis Dashboard Diagrams PDF. This layout presents information on Details Related To Downtime, Detailed Causes, Duration And Machines, Current Downtimes. It is also available for immediate download and adjustment. So, changes can be made in the color, design, graphics or any other component to create a unique layout.
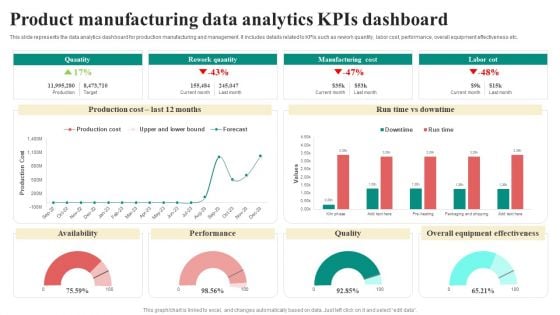
Product Manufacturing Data Analytics Kpis Dashboard Guidelines PDF
This slide represents the data analytics dashboard for production manufacturing and management. It includes details related to KPIs such as rework quantity, labor cost, performance, overall equipment effectiveness etc. Showcasing this set of slides titled Product Manufacturing Data Analytics Kpis Dashboard Guidelines PDF. The topics addressed in these templates are Quantity, Rework Quantity, Manufacturing Cost, Labor Cot. All the content presented in this PPT design is completely editable. Download it and make adjustments in color, background, font etc. as per your unique business setting.
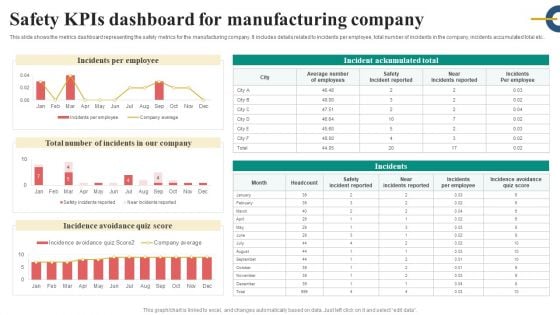
Safety Kpis Dashboard For Manufacturing Company Slides PDF
This slide shows the metrics dashboard representing the safety metrics for the manufacturing company. It includes details related to incidents per employee, total number of incidents in the company, incidents accumulated total etc.. Pitch your topic with ease and precision using this Safety Kpis Dashboard For Manufacturing Company Slides PDF. This layout presents information on Incidents Per Employee, Safety Incident Reported, Incidence Avoidance Quiz Score. It is also available for immediate download and adjustment. So, changes can be made in the color, design, graphics or any other component to create a unique layout.
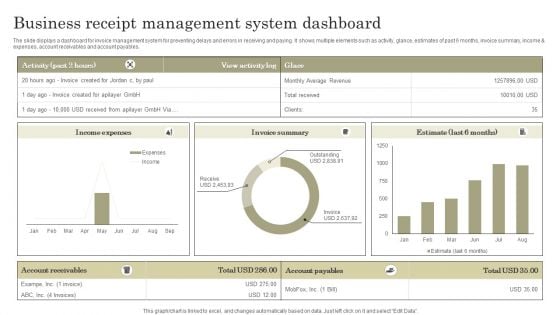
Business Receipt Management System Dashboard Portrait PDF
The slide displays a dashboard for invoice management system for preventing delays and errors in receiving and paying. It shows multiple elements such as activity, glance, estimates of past 6 months, invoice summary, income and expenses, account receivables and account payables. Showcasing this set of slides titled Business Receipt Management System Dashboard Portrait PDF. The topics addressed in these templates are Income expenses, Invoice summary, Estimate. All the content presented in this PPT design is completely editable. Download it and make adjustments in color, background, font etc. as per your unique business setting.
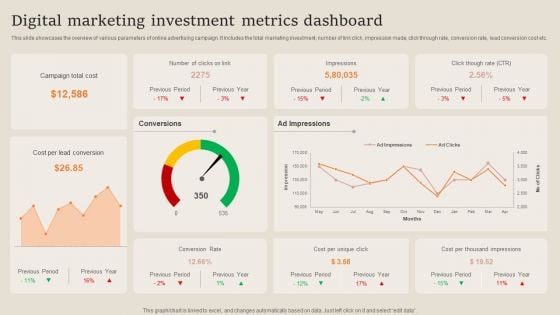
Digital Marketing Investment Metrics Dashboard Professional PDF
This slide showcases the overview of various parameters of online advertising campaign. It includes the total marketing investment, number of link click, impression made, click through rate, conversion rate, lead conversion cost etc. Showcasing this set of slides titled Digital Marketing Investment Metrics Dashboard Professional PDF. The topics addressed in these templates are Campaign Total Cost, Cost Per Lead Conversion, Investment Metrics Dashboard. All the content presented in this PPT design is completely editable. Download it and make adjustments in color, background, font etc. as per your unique business setting.
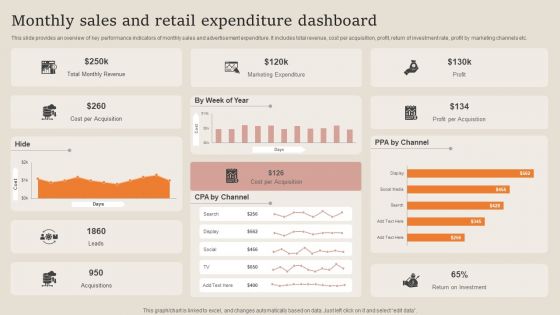
Monthly Sales And Retail Expenditure Dashboard Summary PDF
This slide provides an overview of key performance indicators of monthly sales and advertisement expenditure. It includes total revenue, cost per acquisition, profit, return of investment rate, profit by marketing channels etc. Pitch your topic with ease and precision using this Monthly Sales And Retail Expenditure Dashboard Summary PDF. This layout presents information on Marketing Expenditure, Revenue, Cost Per Acquisition. It is also available for immediate download and adjustment. So, changes can be made in the color, design, graphics or any other component to create a unique layout.

Retail Expenditure Dashboard And Performance Dashboard Formats PDF
This slide enables to track quarterly performance and return on marketing expenditure of online marketing executed by an organization. It includes source wise performance report , return on investment, sales funnel, average order value report etc. Pitch your topic with ease and precision using this Retail Expenditure Dashboard And Performance Dashboard Formats PDF. This layout presents information on Return On Investment, Product Sales, Revenue. It is also available for immediate download and adjustment. So, changes can be made in the color, design, graphics or any other component to create a unique layout.
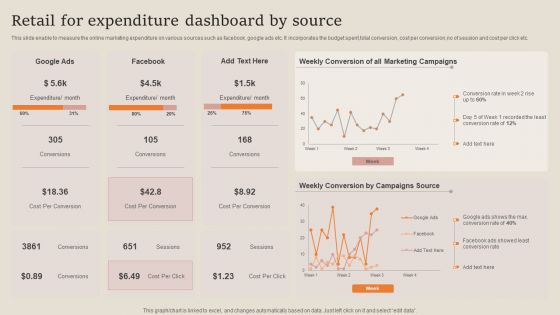
Retail For Expenditure Dashboard By Source Professional PDF
This slide enable to measure the online marketing expenditure on various sources such as facebook, google ads etc. It incorporates the budget spent,total conversion, cost per conversion,no of session and cost per click etc. Pitch your topic with ease and precision using this Retail For Expenditure Dashboard By Source Professional PDF. This layout presents information on Campaigns Source, Conversion Rate, Marketing Campaigns. It is also available for immediate download and adjustment. So, changes can be made in the color, design, graphics or any other component to create a unique layout.
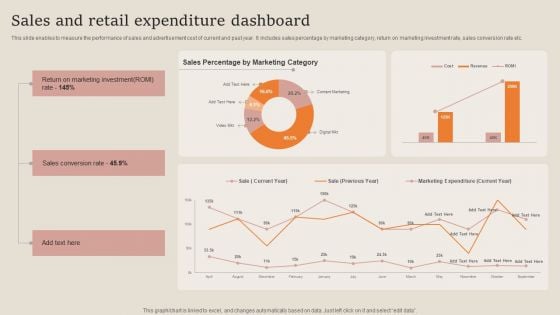
Sales And Retail Expenditure Dashboard Guidelines PDF
This slide enables to measure the performance of sales and advertisement cost of current and past year. It includes sales percentage by marketing category, return on marketing investment rate, sales conversion rate etc. Pitch your topic with ease and precision using this Sales And Retail Expenditure Dashboard Guidelines PDF. This layout presents information on Sales Conversion Rate, Marketing Investment. It is also available for immediate download and adjustment. So, changes can be made in the color, design, graphics or any other component to create a unique layout.
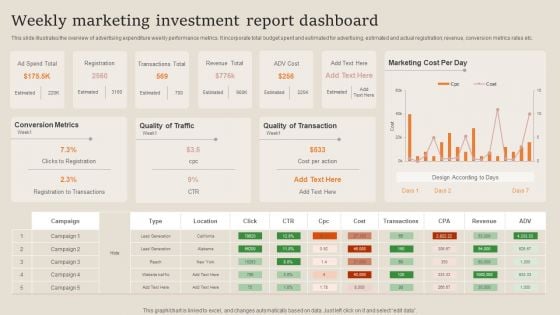
Weekly Marketing Investment Report Dashboard Ideas PDF
This slide illustrates the overview of advertising expenditure weekly performance metrics. It incorporate total budget spent and estimated for advertising, estimated and actual registration, revenue, conversion metrics rates etc. Showcasing this set of slides titled Weekly Marketing Investment Report Dashboard Ideas PDF. The topics addressed in these templates are Conversion Metrics, Quality Of Traffic, Quality Of Transaction. All the content presented in this PPT design is completely editable. Download it and make adjustments in color, background, font etc. as per your unique business setting.
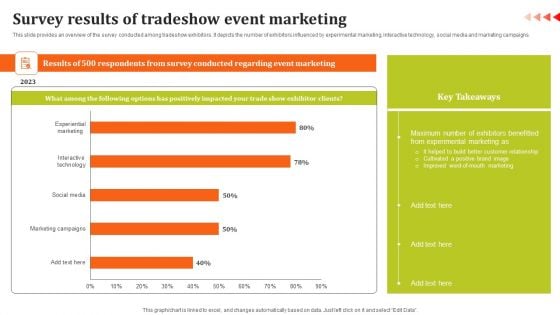
Survey Results Of Tradeshow Event Marketing Diagrams PDF
This slide provides an overview of the survey conducted among tradeshow exhibitors. It depicts the number of exhibitors influenced by experimental marketing, interactive technology, social media and marketing campaigns. Get a simple yet stunning designed Survey Results Of Tradeshow Event Marketing Diagrams PDF. It is the best one to establish the tone in your meetings. It is an excellent way to make your presentations highly effective. So, download this PPT today from Slidegeeks and see the positive impacts. Our easy to edit Survey Results Of Tradeshow Event Marketing Diagrams PDF can be your go to option for all upcoming conferences and meetings. So, what are you waiting for Grab this template today.
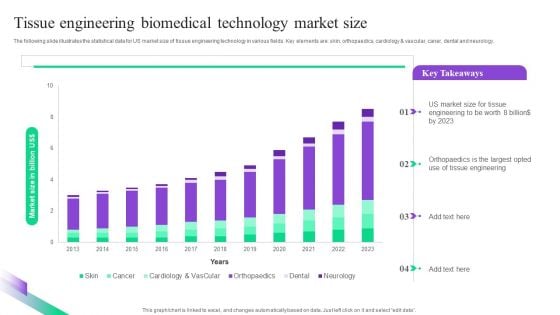
Tissue Engineering Biomedical Technology Market Size Summary PDF
The following slide illustrates the statistical data for US market size of tissue engineering technology in various fields. Key elements are skin, orthopaedics, cardiology and vascular, caner, dental and neurology. Pitch your topic with ease and precision using this Tissue Engineering Biomedical Technology Market Size Summary PDF. This layout presents information on Tissue, Engineering, Market Size. It is also available for immediate download and adjustment. So, changes can be made in the color, design, graphics or any other component to create a unique layout.
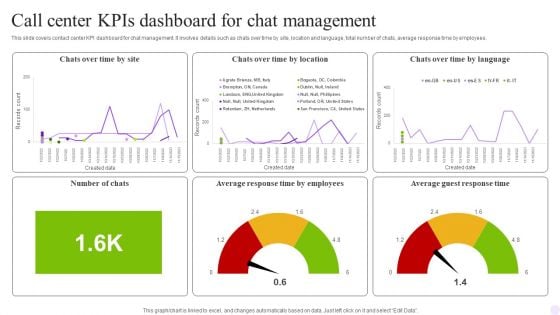
Call Center Kpis Dashboard For Chat Management Graphics PDF
This slide covers contact center KPI dashboard for chat management. It involves details such as chats over time by site, location and language, total number of chats, average response time by employees. Showcasing this set of slides titled Call Center Kpis Dashboard For Chat Management Graphics PDF. The topics addressed in these templates are Management, Employees, Chats. All the content presented in this PPT design is completely editable. Download it and make adjustments in color, background, font etc. as per your unique business setting.
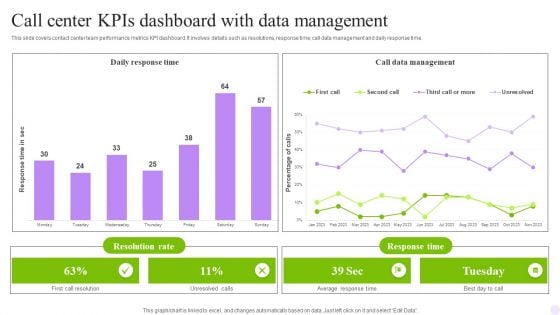
Call Center Kpis Dashboard With Data Management Infographics PDF
This slide covers contact center metrics KPI dashboard with call data details. It involves details such as total number of contacts handled, product sales, repeated calls and contact handles per day. Pitch your topic with ease and precision using this Call Center Kpis Dashboard With Data Management Infographics PDF. This layout presents information on Achieved, Contacts Handled, Repeated Calls. It is also available for immediate download and adjustment. So, changes can be made in the color, design, graphics or any other component to create a unique layout.
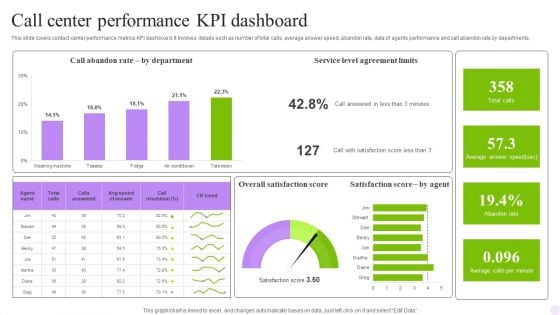
Call Center Performance KPI Dashboard Formats PDF
This slide covers contact center performance metrics KPI dashboard. It involves details such as number of total calls, average answer speed, abandon rate, data of agents performance and call abandon rate by departments. Showcasing this set of slides titled Call Center Performance KPI Dashboard Formats PDF. The topics addressed in these templates are Department, Dashboard, Agreement Limits. All the content presented in this PPT design is completely editable. Download it and make adjustments in color, background, font etc. as per your unique business setting.
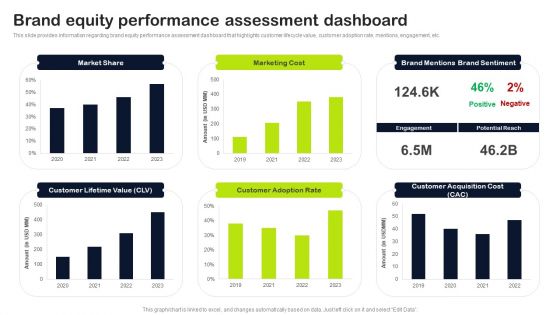
Key Elements Of Strategic Brand Administration Brand Equity Performance Assessment Dashboard Elements PDF
This slide provides information regarding brand equity performance assessment dashboard that highlights customer lifecycle value, customer adoption rate, mentions, engagement, etc. Get a simple yet stunning designed Key Elements Of Strategic Brand Administration Brand Equity Performance Assessment Dashboard Elements PDF. It is the best one to establish the tone in your meetings. It is an excellent way to make your presentations highly effective. So, download this PPT today from Slidegeeks and see the positive impacts. Our easy-to-edit Key Elements Of Strategic Brand Administration Brand Equity Performance Assessment Dashboard Elements PDF can be your go-to option for all upcoming conferences and meetings. So, what are you waiting for Grab this template today.
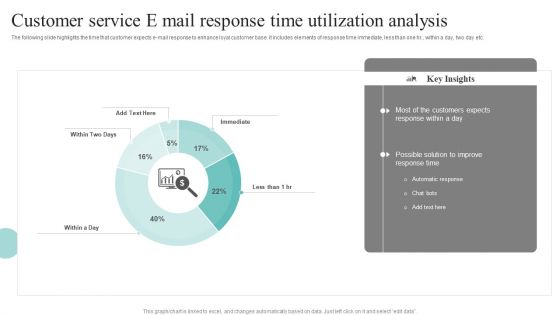
Customer Service E Mail Response Time Utilization Analysis Portrait PDF
The following slide highlights the time that customer expects e-mail response to enhance loyal customer base. It includes elements of response time immediate, less than one hr., within a day, two day etc. Pitch your topic with ease and precision using this Customer Service E Mail Response Time Utilization Analysis Portrait PDF. This layout presents information on Customer Service, E Mail Response, Time Utilization Analysis. It is also available for immediate download and adjustment. So, changes can be made in the color, design, graphics or any other component to create a unique layout.
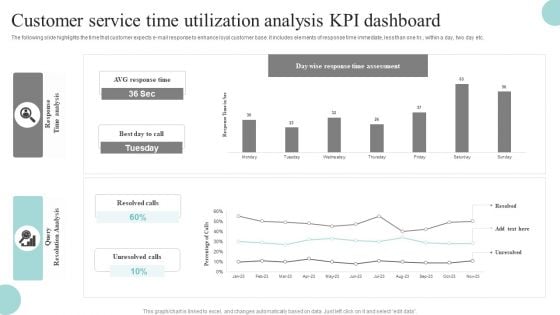
Customer Service Time Utilization Analysis Kpi Dashboard Designs PDF
The following slide highlights the time that customer expects e-mail response to enhance loyal customer base. It includes elements of response time immediate, less than one hr., within a day, two day etc. Showcasing this set of slides titled Customer Service Time Utilization Analysis Kpi Dashboard Designs PDF. The topics addressed in these templates are Customer Service, Time Utilization Analysis, KPI Dashboard. All the content presented in this PPT design is completely editable. Download it and make adjustments in color, background, font etc. as per your unique business setting.
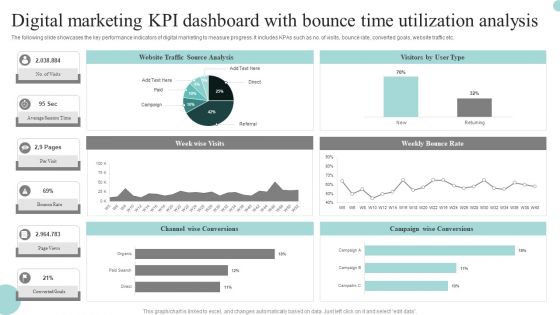
Digital Marketing Kpi Dashboard With Bounce Time Utilization Analysis Graphics PDF
The following slide showcases the key performance indicators of digital marketing to measure progress. It includes KPAs such as no. of visits, bounce rate, converted goals, website traffic etc. Pitch your topic with ease and precision using this Digital Marketing Kpi Dashboard With Bounce Time Utilization Analysis Graphics PDF. This layout presents information on Digital Marketing, KPI Dashboard, Bounce Time Utilization Analysis. It is also available for immediate download and adjustment. So, changes can be made in the color, design, graphics or any other component to create a unique layout.
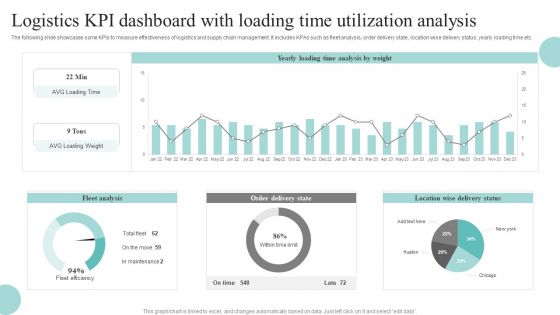
Logistics KPI Dashboard With Loading Time Utilization Analysis Download PDF
The following slide showcases some KPIs to measure effectiveness of logistics and supply chain management. It includes KPAs such as fleet analysis, order delivery state, location wise delivery status, yearly loading time etc. Pitch your topic with ease and precision using this Logistics KPI Dashboard With Loading Time Utilization Analysis Download PDF. This layout presents information on Fleet Analysis, Order Delivery State, Location Wise Delivery Status. It is also available for immediate download and adjustment. So, changes can be made in the color, design, graphics or any other component to create a unique layout.
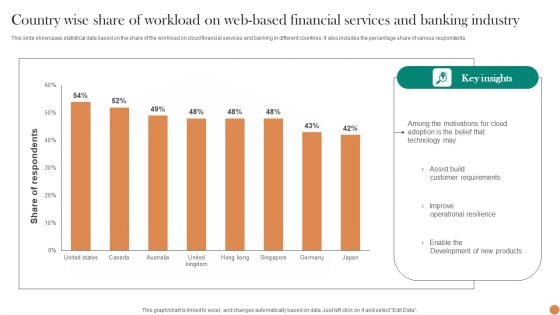
Country Wise Share Of Workload On Web Based Financial Services And Banking Industry Slides PDF
This slide showcases statistical data based on the share of the workload on cloud financial services and banking in different countries. It also includes the percentage share of various respondents. Showcasing this set of slides titled Country Wise Share Of Workload On Web Based Financial Services And Banking Industry Slides PDF. The topics addressed in these templates are Country Wise Share, Workload Web Based Financial, Services And Banking Industry. All the content presented in this PPT design is completely editable. Download it and make adjustments in color, background, font etc. as per your unique business setting.
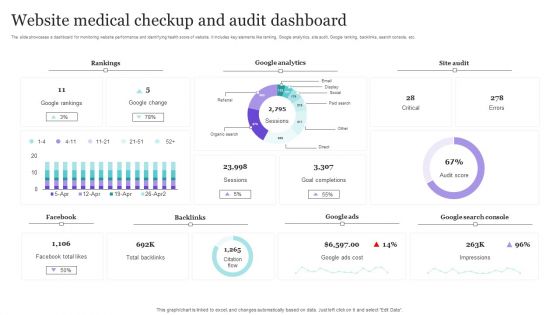
Website Medical Checkup And Audit Dashboard Background PDF
The slide showcases a dashboard for monitoring website performance and identifying health score of website. It includes key elements like ranking, Google analytics, site audit, Google ranking, backlinks, search console, etc. Showcasing this set of slides titled Website Medical Checkup And Audit Dashboard Background PDF. The topics addressed in these templates are Rankings, Google Analytics, Site Audit. All the content presented in this PPT design is completely editable. Download it and make adjustments in color, background, font etc. as per your unique business setting.
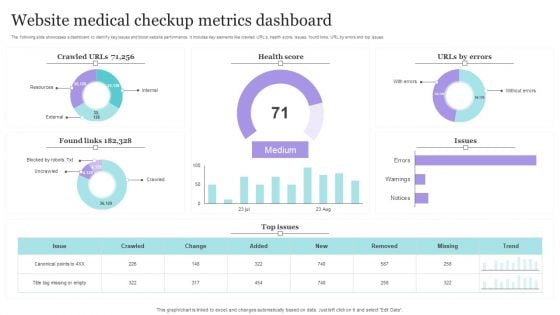
Website Medical Checkup Metrics Dashboard Introduction PDF
The following slide showcases a dashboard to identify key issues and boost website performance. It includes key elements like crawled URLs, health score, issues, found links, URL by errors and top issues. Showcasing this set of slides titled Website Medical Checkup Metrics Dashboard Introduction PDF. The topics addressed in these templates are Website Medical Checkup, Metrics Dashboard. All the content presented in this PPT design is completely editable. Download it and make adjustments in color, background, font etc. as per your unique business setting.
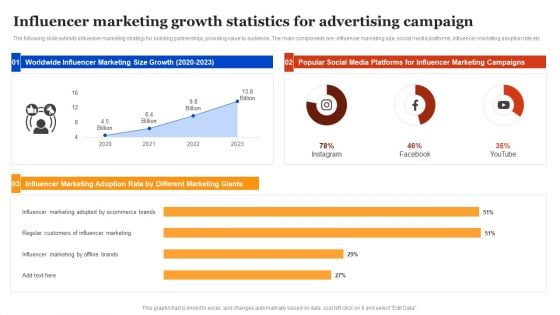
Influencer Marketing Growth Statistics For Advertising Campaign Themes PDF
The following slide exhibits influencer marketing strategy for building partnerships, providing value to audience. The main components are- influencer marketing size, social media platforms, influencer marketing adoption rate etc. Pitch your topic with ease and precision using this Influencer Marketing Growth Statistics For Advertising Campaign Themes PDF. This layout presents information on Marketing Giants, Campaign, Influencer. It is also available for immediate download and adjustment. So, changes can be made in the color, design, graphics or any other component to create a unique layout.
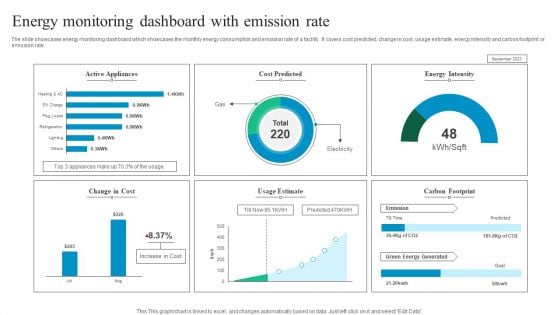
Energy Monitoring Dashboard With Emission Rate Mockup PDF
The slide showcases energy monitoring dashboard which showcases the monthly energy consumption and emission rate of a facility. It covers cost predicted, change in cost, usage estimate, energy intensity and carbon footprint or emission rate. Pitch your topic with ease and precision using this Energy Monitoring Dashboard With Emission Rate Mockup PDF. This layout presents information on Active Appliances, Cost Predicted, Energy Intensity. It is also available for immediate download and adjustment. So, changes can be made in the color, design, graphics or any other component to create a unique layout.
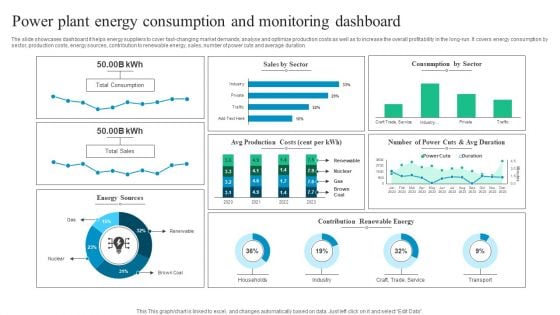
Power Plant Energy Consumption And Monitoring Dashboard Diagrams PDF
The slide showcases dashboard it helps energy suppliers to cover fast-changing market demands, analyse and optimize production costs as well as to increase the overall profitability in the long-run. It covers energy consumption by sector, production costs, energy sources, contribution to renewable energy, sales, number of power cuts and average duration. Pitch your topic with ease and precision using this Power Plant Energy Consumption And Monitoring Dashboard Diagrams PDF. This layout presents information on Power Plant Energy Consumption, Monitoring Dashboard. It is also available for immediate download and adjustment. So, changes can be made in the color, design, graphics or any other component to create a unique layout.
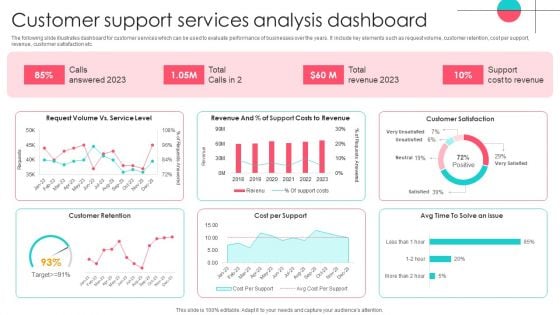
Customer Support Services Analysis Dashboard Template PDF
The following slide illustrates dashboard for customer services which can be used to evaluate performance of businesses over the years. It include key elements such as request volume, customer retention, cost per support, revenue, customer satisfaction etc. Showcasing this set of slides titled Customer Support Services Analysis Dashboard Template PDF. The topics addressed in these templates are Customer Support Services, Analysis Dashboard. All the content presented in this PPT design is completely editable. Download it and make adjustments in color, background, font etc. as per your unique business setting.

IT Cyber Threat Prevention Technology Market Topics PDF

Multiple Challenges Of Business Cyber Threat Prevention Sample PDF
The following slide represent the statistical data of various cyber safety challenges reported by business and organizations which helps to determine the most vulnerable one. Major areas are information security, business agility, automation, integration, etc. Showcasing this set of slides titled Multiple Challenges Of Business Cyber Threat Prevention Sample PDF. The topics addressed in these templates are Key Takeaways, Cyber Safety, Prevention. All the content presented in this PPT design is completely editable. Download it and make adjustments in color, background, font etc. as per your unique business setting.
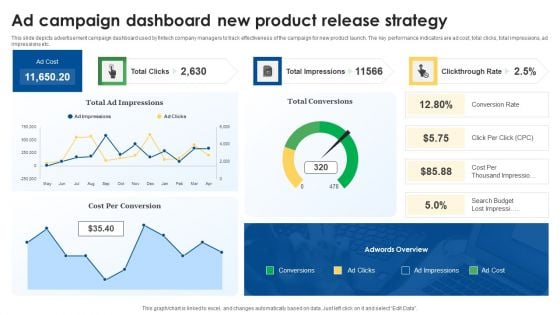
Ad Campaign Dashboard New Product Release Strategy Guidelines PDF
This slide depicts advertisement campaign dashboard used by fintech company managers to track effectiveness of the campaign for new product launch. The key performance indicators are ad cost, total clicks, total impressions, ad impressions etc. Pitch your topic with ease and precision using this Ad Campaign Dashboard New Product Release Strategy Guidelines PDF. This layout presents information on Impressions, Conversion, Strategy. It is also available for immediate download and adjustment. So, changes can be made in the color, design, graphics or any other component to create a unique layout.

Monthly Product Sales Analysis Dashboard Infographics PDF
This slide illustrates a dashboard for product sales review to measure to help business monitor and improve productivity, employee engagement and meet revenue targets. It covers product names with sales reps, lead conversion, response time and outbound calls. Showcasing this set of slides titled Monthly Product Sales Analysis Dashboard Infographics PDF. The topics addressed in these templates are Lead Conversion Rate, Outbound Calls, Sales Analysis Dashboard. All the content presented in this PPT design is completely editable. Download it and make adjustments in color, background, font etc. as per your unique business setting.
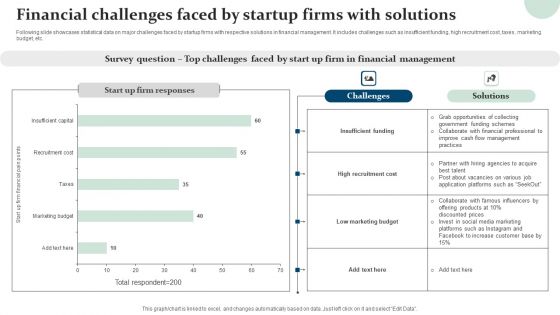
Financial Challenges Faced By Startup Firms With Solutions Slides PDF
Following slide showcases statistical data on major challenges faced by startup firms with respective solutions in financial management. It includes challenges such as insufficient funding, high recruitment cost, taxes, marketing budget, etc. Pitch your topic with ease and precision using this Financial Challenges Faced By Startup Firms With Solutions Slides PDF. This layout presents information on Insufficient Funding, High Recruitment Cost, Low Marketing Budget. It is also available for immediate download and adjustment. So, changes can be made in the color, design, graphics or any other component to create a unique layout.
KPI Dashboard For Tracking Financial Management Challenges Download PDF
Following slide demonstrates KPI dashboard for monitoring business cash flow management pain points to improve organisation financial performance. It includes elements such as quick ratio, current ration, annual cash balance, monthly cash balance, accounts receivable and payables, etc. Showcasing this set of slides titled KPI Dashboard For Tracking Financial Management Challenges Download PDF. The topics addressed in these templates are Monthly Cash Flow, Account Payable By Days, Annual Revenue, Annual Cost, Annual Net Profits. All the content presented in this PPT design is completely editable. Download it and make adjustments in color, background, font etc. as per your unique business setting.
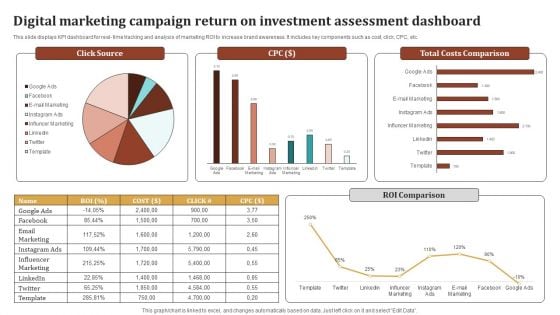
Digital Marketing Campaign Return On Investment Assessment Dashboard Ideas PDF
This slide displays KPI dashboard for real- time tracking and analysis of marketing ROI to increase brand awareness. It includes key components such as cost, click, CPC, etc. Showcasing this set of slides titled Digital Marketing Campaign Return On Investment Assessment Dashboard Ideas PDF. The topics addressed in these templates are Influencer Marketing, Email Marketing, Total Costs Comparison, Roi Comparison. All the content presented in this PPT design is completely editable. Download it and make adjustments in color, background, font etc. as per your unique business setting.
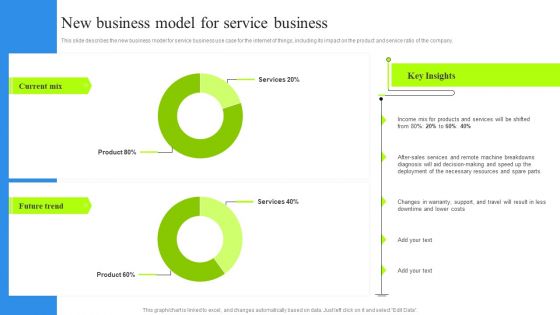
New Business Model For Service Business Themes PDF
This slide describes the new business model for service business use case for the internet of things, including its impact on the product and service ratio of the company. Get a simple yet stunning designed New Business Model For Service Business Themes PDF. It is the best one to establish the tone in your meetings. It is an excellent way to make your presentations highly effective. So, download this PPT today from Slidegeeks and see the positive impacts. Our easy-to-edit New Business Model For Service Business Themes PDF can be your go-to option for all upcoming conferences and meetings. So, what are you waiting for Grab this template today.
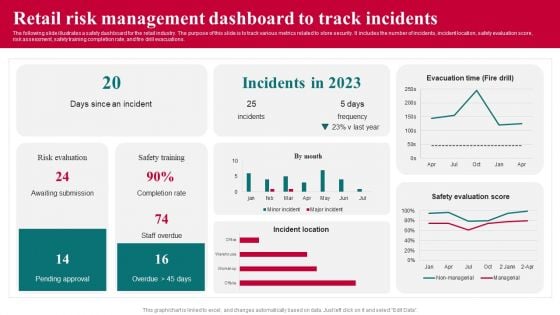
Retail Risk Management Dashboard To Track Incidents Professional PDF
The following slide illustrates a safety dashboard for the retail industry. The purpose of this slide is to track various metrics related to store security. It includes the number of incidents, incident location, safety evaluation score,risk assessment, safety training completion rate, and fire drill evacuations. Showcasing this set of slides titled Retail Risk Management Dashboard To Track Incidents Professional PDF. The topics addressed in these templates are Risk Evaluation, Retail Risk Management Dashboard, Track Incidents. All the content presented in this PPT design is completely editable. Download it and make adjustments in color, background, font etc. as per your unique business setting.
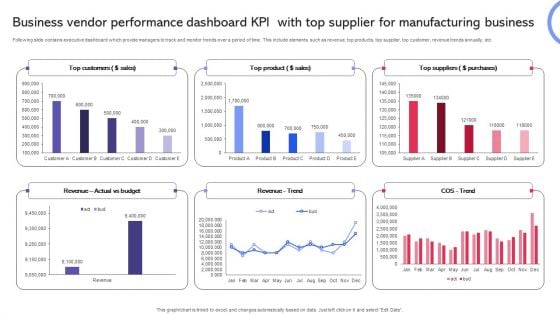
Business Vendor Performance Dashboard KPI With Top Supplier For Manufacturing Business Information PDF
Following slide contains executive dashboard which provide managers to track and monitor trends over a period of time. This include elements such as revenue, top products, top supplier, top customer, revenue trends annually, etc. Showcasing this set of slides titled Business Vendor Performance Dashboard KPI With Top Supplier For Manufacturing Business Information PDF. The topics addressed in these templates are Customers, Product, Sales. All the content presented in this PPT design is completely editable. Download it and make adjustments in color, background, font etc. as per your unique business setting.
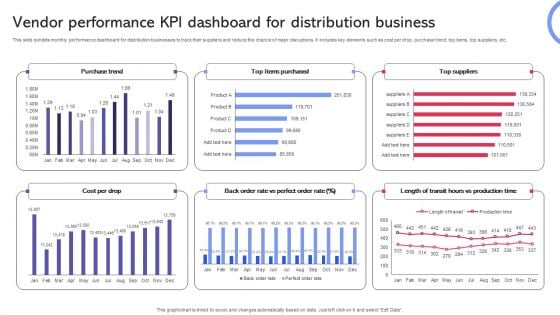
Vendor Performance KPI Dashboard For Distribution Business Formats PDF
This slide exhibits monthly performance dashboard for distribution businesses to track their suppliers and reduce the chance of major disruptions. It includes key elements such as cost per drop, purchase trend, top items, top suppliers, etc. Showcasing this set of slides titled Vendor Performance KPI Dashboard For Distribution Business Formats PDF. The topics addressed in these templates are Purchase Trend, Suppliers, Distribution Business. All the content presented in this PPT design is completely editable. Download it and make adjustments in color, background, font etc. as per your unique business setting.

Vendor Performance KPI With Rejection Rate Inspiration PDF
This slide exhibits supplier dashboard which allows organisation to monitor level of dependency towards supplier and analyse the quality of each of them. It includes elements such as number of suppliers currently, compliance rate, rejection rate, etc. Pitch your topic with ease and precision using this Vendor Performance KPI With Rejection Rate Inspiration PDF. This layout presents information on Vendor Performance KPI, Rejection Rate. It is also available for immediate download and adjustment. So, changes can be made in the color, design, graphics or any other component to create a unique layout.
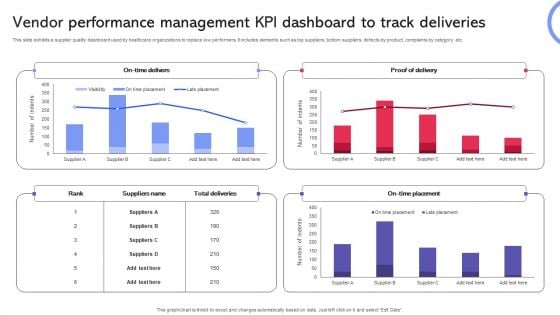
Vendor Performance Management KPI Dashboard To Track Deliveries Graphics PDF
This slide exhibits a supplier quality dashboard used by healthcare organizations to replace low performers. It includes elements such as top suppliers, bottom suppliers, defects by product, complaints by category, etc. Showcasing this set of slides titled Vendor Performance Management KPI Dashboard To Track Deliveries Graphics PDF. The topics addressed in these templates are Vendor Performance Management, KPI Dashboard, Track Deliveries. All the content presented in this PPT design is completely editable. Download it and make adjustments in color, background, font etc. as per your unique business setting.
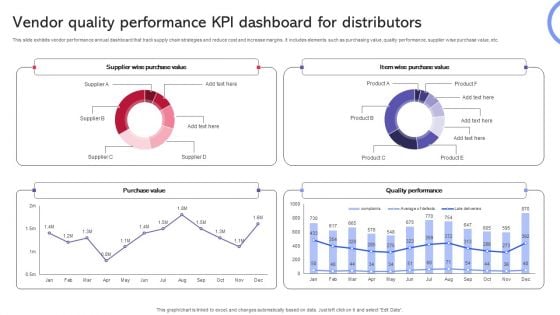
Vendor Quality Performance KPI Dashboard For Distributors Template PDF
This slide exhibits vendor performance annual dashboard that track supply chain strategies and reduce cost and increase margins. It includes elements such as purchasing value, quality performance, supplier wise purchase value, etc. Pitch your topic with ease and precision using this Vendor Quality Performance KPI Dashboard For Distributors Template PDF. This layout presents information on Purchase Value, Quality Performance, Supplier Wise Purchase Value. It is also available for immediate download and adjustment. So, changes can be made in the color, design, graphics or any other component to create a unique layout.


 Continue with Email

 Home
Home


