Presentation Kpi
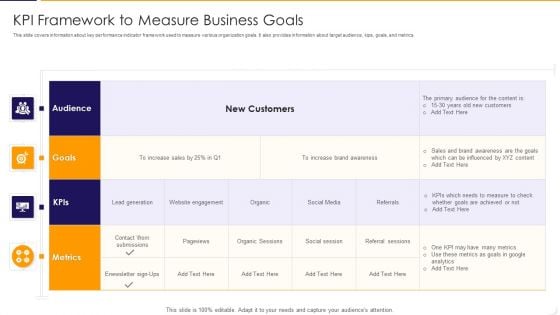
KPI Framework To Measure Business Goals Ppt PowerPoint Presentation File Background PDF
This slide covers information about key performance indicator framework used to measure various organization goals. It also provides information about target audience, kips, goals, and metrics. Showcasing this set of slides titled kpi framework to measure business goals ppt powerpoint presentation file background pdf The topics addressed in these templates are customers, awareness, sales. All the content presented in this PPT design is completely editable. Download it and make adjustments in color, background, font etc. as per your unique business setting.
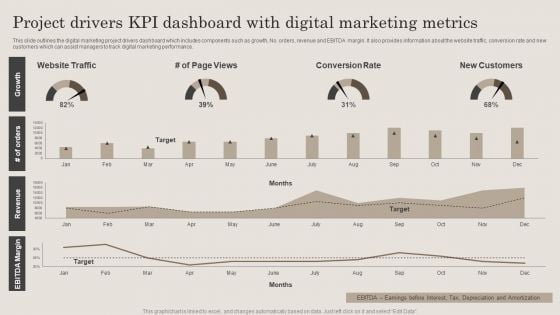
Project Drivers Kpi Dashboard With Digital Marketing Metrics Ppt PowerPoint Presentation File Clipart PDF
This slide outlines the digital marketing project drivers dashboard which includes components such as growth, No. orders, revenue and EBITDA margin. It also provides information about the website traffic, conversion rate and new customers which can assist managers to track digital marketing performance. Showcasing this set of slides titled Project Drivers Kpi Dashboard With Digital Marketing Metrics Ppt PowerPoint Presentation File Clipart PDF. The topics addressed in these templates are Website Traffic, Conversion Rate, New Customers. All the content presented in this PPT design is completely editable. Download it and make adjustments in color, background, font etc. as per your unique business setting.
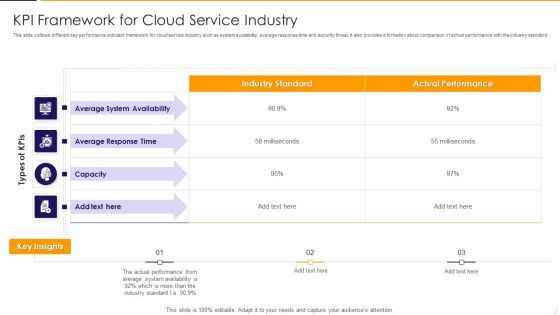
KPI Framework For Cloud Service Industry Ppt PowerPoint Presentation Gallery Styles PDF
This slide outlines different key performance indicator framework for cloud service industry such as system availability, average response time and security threat. It also provides information about comparison of actual performance with the industry standard. Pitch your topic with ease and precision using this kpi framework for cloud service industry ppt powerpoint presentation gallery styles pdf This layout presents information on average, performance, system It is also available for immediate download and adjustment. So, changes can be made in the color, design, graphics or any other component to create a unique layout.
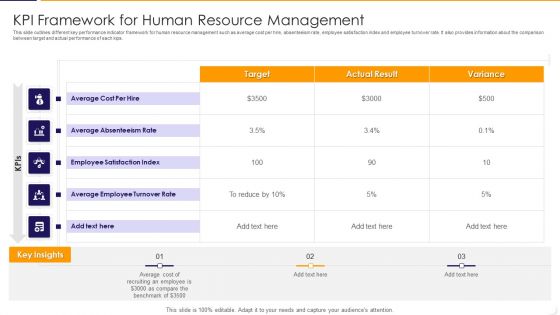
KPI Framework For Human Resource Management Ppt PowerPoint Presentation Gallery Portrait PDF
This slide outlines different key performance indicator framework for human resource management such as average cost per hire, absenteeism rate, employee satisfaction index and employee turnover rate. It also provides information about the comparison between target and actual performance of each kips. Pitch your topic with ease and precision using this kpi framework for human resource management ppt powerpoint presentation gallery portrait pdf This layout presents information on average, cost, target It is also available for immediate download and adjustment. So, changes can be made in the color, design, graphics or any other component to create a unique layout.
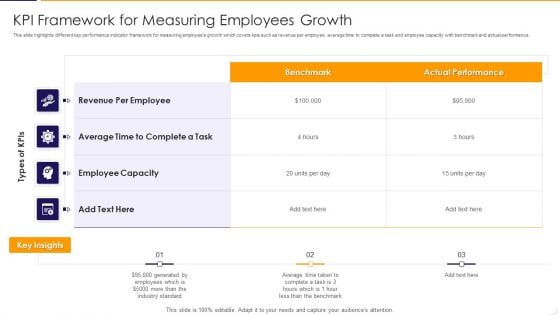
KPI Framework For Measuring Employees Growth Ppt PowerPoint Presentation File Files PDF
This slide highlights different key performance indicator framework for measuring employees growth which covers kpis such as revenue per employee, average time to complete a task and employee capacity with benchmark and actual performance. Showcasing this set of slides titled kpi framework for measuring employees growth ppt powerpoint presentation file files pdf The topics addressed in these templates are average, revenue, industry. All the content presented in this PPT design is completely editable. Download it and make adjustments in color, background, font etc. as per your unique business setting.

KPI Framework For Measuring Organizational Growth Ppt PowerPoint Presentation Gallery Template PDF
This slide outlines major key performance indicator framework for measuring organization growth. It includes kips such as return on investment, customer churn rate, employee satisfaction index, project efficiency and client retention rate. Pitch your topic with ease and precision using this kpi framework for measuring organizational growth ppt powerpoint presentation gallery template pdf This layout presents information on customer, investment, rate It is also available for immediate download and adjustment. So, changes can be made in the color, design, graphics or any other component to create a unique layout.

HR KPI Dashboard With Staff Payroll Details Ppt PowerPoint Presentation File Layout Ideas PDF
This slide represents the key performance indicator dashboard with salary details of employee working in an organisation. It includes turnover rate, pie chart of employment contract and status, bar graph based on employee gender. Showcasing this set of slides titled HR KPI Dashboard With Staff Payroll Details Ppt PowerPoint Presentation File Layout Ideas PDF. The topics addressed in these templates are Turnover Rate, Absenteeism Rate, Permanent Rate. All the content presented in this PPT design is completely editable. Download it and make adjustments in color, background, font etc. as per your unique business setting.
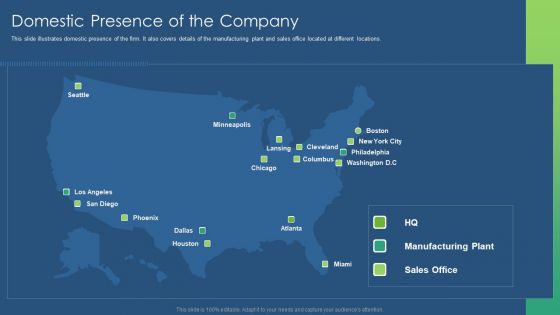
Sustainability Calculation With KPI Domestic Presence Of The Company Ppt PowerPoint Presentation File Introduction PDF
This slide illustrates domestic presence of the firm. It also covers details of the manufacturing plant and sales office located at different locations. This is a sustainability calculation with kpi domestic presence of the company ppt powerpoint presentation file introduction pdf template with various stages. Focus and dispense information on one stages using this creative set, that comes with editable features. It contains large content boxes to add your information on topics like domestic presence of the company. You can also showcase facts, figures, and other relevant content using this PPT layout. Grab it now.
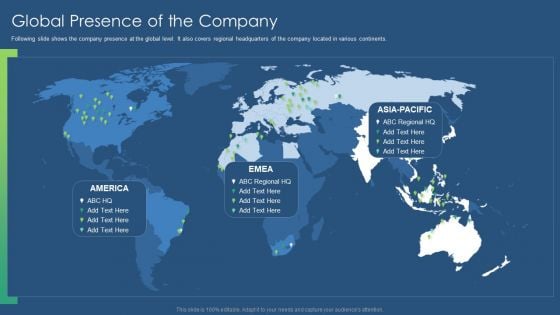
Sustainability Calculation With KPI Global Presence Of The Company Ppt PowerPoint Presentation Gallery Guide PDF
Following slide shows the company presence at the global level. It also covers regional headquarters of the company located in various continents. This is a sustainability calculation with kpi global presence of the company ppt powerpoint presentation gallery guide pdf template with various stages. Focus and dispense information on one stages using this creative set, that comes with editable features. It contains large content boxes to add your information on topics like global presence of the company. You can also showcase facts, figures, and other relevant content using this PPT layout. Grab it now.
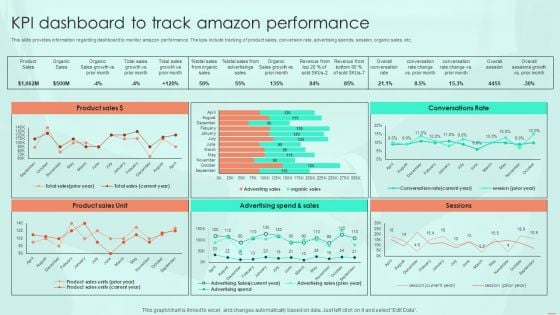
KPI Dashboard To Track Amazon Performance Ppt PowerPoint Presentation File Background Images PDF
This slide provides information regarding dashboard to monitor amazon performance. The kpis include tracking of product sales, conversion rate, advertising spends, session, organic sales, etc. Are you in need of a template that can accommodate all of your creative concepts This one is crafted professionally and can be altered to fit any style. Use it with Google Slides or PowerPoint. Include striking photographs, symbols, depictions, and other visuals. Fill, move around, or remove text boxes as desired. Test out color palettes and font mixtures. Edit and save your work, or work with colleagues. Download KPI Dashboard To Track Amazon Performance Ppt PowerPoint Presentation File Background Images PDF and observe how to make your presentation outstanding. Give an impeccable presentation to your group and make your presentation unforgettable.
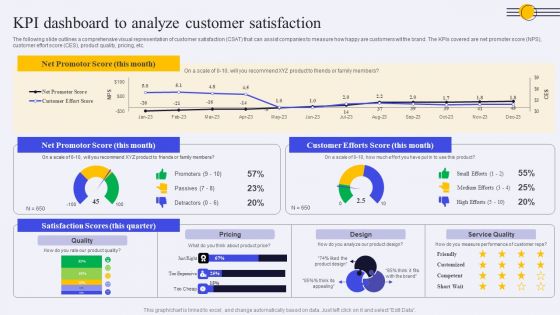
KPI Dashboard To Analyze Customer Satisfaction Ppt PowerPoint Presentation File Infographic Template PDF
The following slide outlines a comprehensive visual representation of customer satisfaction CSAT that can assist companies to measure how happy are customers wit the brand. The KPIs covered are net promoter score NPS, customer effort score CES, product quality, pricing, etc. Coming up with a presentation necessitates that the majority of the effort goes into the content and the message you intend to convey. The visuals of a PowerPoint presentation can only be effective if it supplements and supports the story that is being told. Keeping this in mind our experts created KPI Dashboard To Analyze Customer Satisfaction Ppt PowerPoint Presentation File Infographic Template PDF to reduce the time that goes into designing the presentation. This way, you can concentrate on the message while our designers take care of providing you with the right template for the situation.
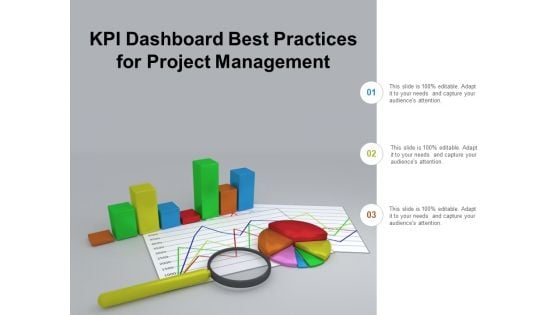
Kpi Dashboard Best Practices For Project Management Ppt Powerpoint Presentation Outline Samples
This is a kpi dashboard best practices for project management ppt powerpoint presentation outline samples. This is a three stage process. The stages in this process are business metrics, business kpi, business dashboard.
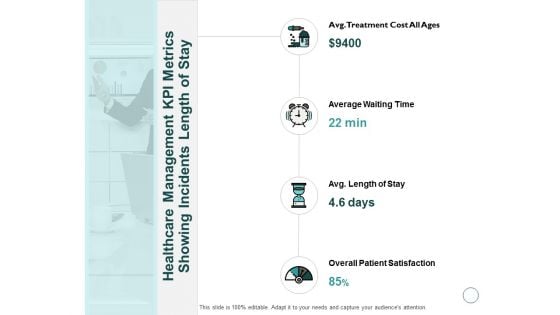
Healthcare Management KPI Metrics Showing Incidents Length Of Stay Ppt PowerPoint Presentation Outline Maker
Presenting this set of slides with name healthcare management kpi metrics showing incidents length of stay ppt powerpoint presentation outline maker. This is a four stage process. The stages in this process are business, management, planning, strategy, marketing. This is a completely editable PowerPoint presentation and is available for immediate download. Download now and impress your audience.
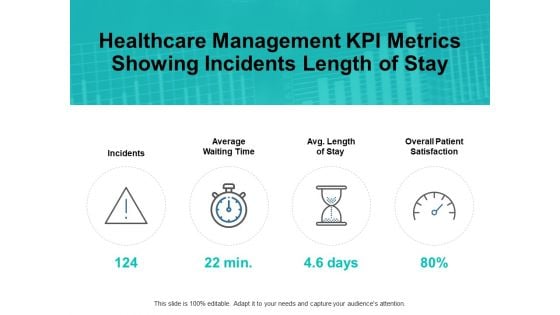
Healthcare Management Kpi Metrics Showing Incidents Length Of Stay Ppt PowerPoint Presentation Summary Background Images
Presenting this set of slides with name healthcare management kpi metrics showing incidents length of stay ppt powerpoint presentation summary background images. This is a four stage process. The stages in this process are process, business, management, planning, strategy. This is a completely editable PowerPoint presentation and is available for immediate download. Download now and impress your audience.
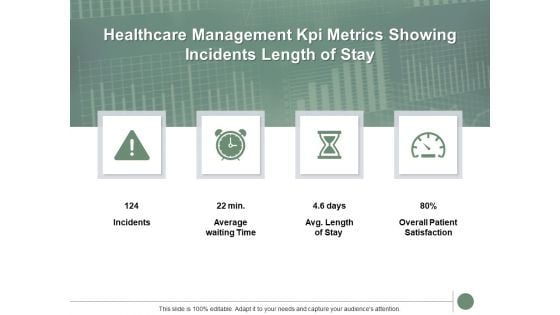
Healthcare Management Kpi Metrics Showing Incidents Length Of Stay Ppt PowerPoint Presentation Layout
Presenting this set of slides with name healthcare management kpi metrics showing incidents length of stay ppt powerpoint presentation layout. This is a four stage process. The stages in this process are incidents, satisfaction, compare, dashboard, threat. This is a completely editable PowerPoint presentation and is available for immediate download. Download now and impress your audience.
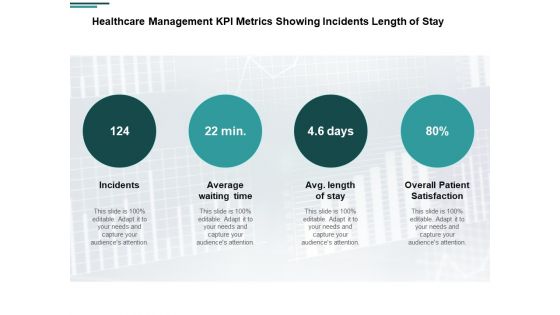
Healthcare Management KPI Metrics Showing Incidents Length Of Stay Ppt PowerPoint Presentation Layouts Graphic Images
Presenting this set of slides with name healthcare management kpi metrics showing incidents length of stay ppt powerpoint presentation layouts graphic images. This is a four stage process. The stages in this process are incidents, average waiting time, overall patient satisfaction, management, marketing. This is a completely editable PowerPoint presentation and is available for immediate download. Download now and impress your audience.
Healthcare Management KPI Metrics Showing Incidents Length Of Stay Ppt PowerPoint Presentation Icon Background
Presenting this set of slides with name healthcare management kpi metrics showing incidents length of stay ppt powerpoint presentation icon background. This is a four stage process. The stages in this process are incidents, average waiting time, overall patient satisfaction, management, marketing. This is a completely editable PowerPoint presentation and is available for immediate download. Download now and impress your audience.
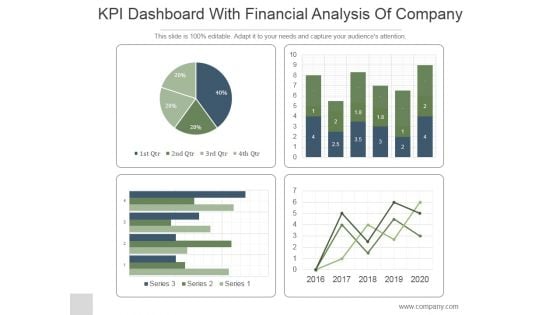
KPI Dashboard With Financial Analysis Of Company Ppt PowerPoint Presentation Backgrounds
This is a kpi dashboard with financial analysis of company ppt powerpoint presentation backgrounds. This is a four stage process. The stages in this process are business, strategy, marketing, line graph, finance.

Retail KPI Dashboard Showing Revenue Vs Units Sold Ppt PowerPoint Presentation Professional Smartart
This is a retail kpi dashboard showing revenue vs units sold ppt powerpoint presentation professional smartart. This is a four stage process. The stages in this process are finance, analysis, business, investment, marketing.
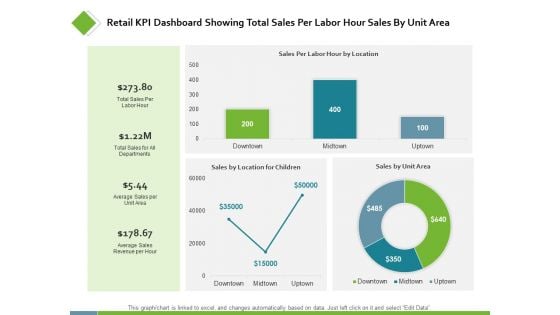
Retail KPI Dashboard Showing Total Sales Per Labor Ppt PowerPoint Presentation Styles Examples
This is a retail kpi dashboard showing total sales per labor ppt powerpoint presentation styles examples. This is a three stage process. The stages in this process are finance, analysis, business, investment, marketing.
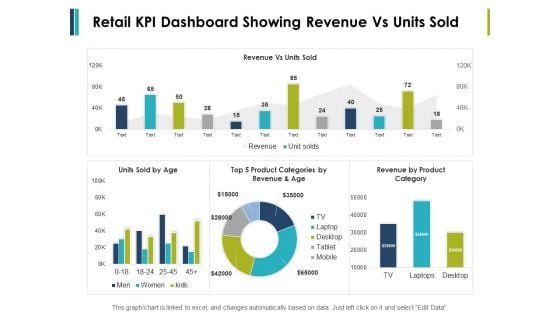
Retail Kpi Dashboard Showing Revenue Vs Units Sold Ppt PowerPoint Presentation File Formats
This is a retail kpi dashboard showing revenue vs units sold ppt powerpoint presentation file formats. This is a three stage process. The stages in this process are finance, marketing, management, investment, analysis.
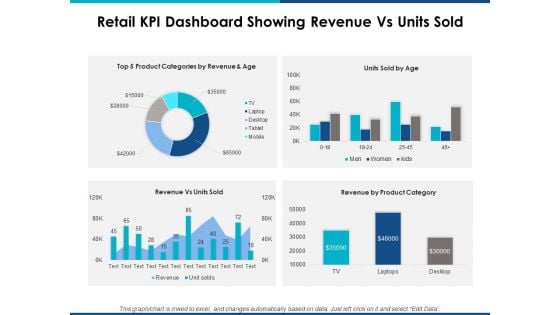
Retail Kpi Dashboard Showing Revenue Vs Units Sold Ppt Powerpoint Presentation Layouts Show
This is a retail kpi dashboard showing revenue vs units sold ppt powerpoint presentation layouts show. This is a four stage process. The stages in this process are finance, marketing, management, investment, analysis.
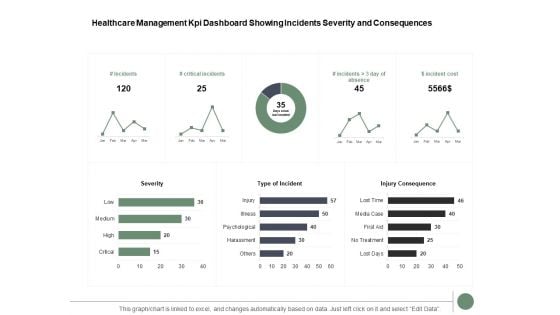
Healthcare Management Kpi Dashboard Showing Incidents Severity And Consequences Ppt PowerPoint Presentation Inspiration Summary
Presenting this set of slides with name healthcare management kpi dashboard showing incidents severity and consequences ppt powerpoint presentation inspiration summary. The topics discussed in these slides are bar graph, finance, marketing, analysis, investment. This is a completely editable PowerPoint presentation and is available for immediate download. Download now and impress your audience.
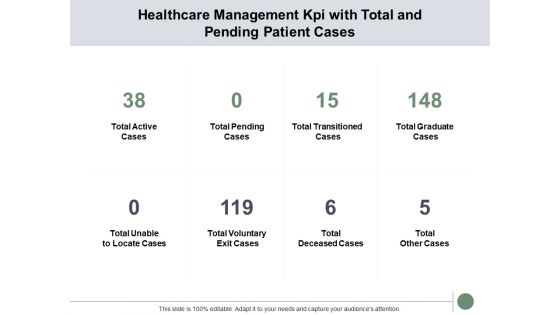
Healthcare Management Kpi With Total And Pending Patient Cases Ppt PowerPoint Presentation Model Background Image
Presenting this set of slides with name healthcare management kpi with total and pending patient cases ppt powerpoint presentation model background image. This is a eight stage process. The stages in this process are business, planning, strategy, marketing, management. This is a completely editable PowerPoint presentation and is available for immediate download. Download now and impress your audience.
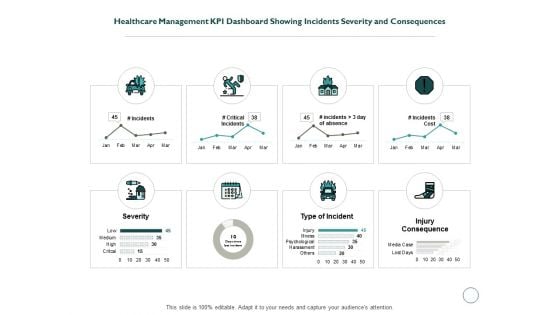
Healthcare Management KPI Dashboard Showing Incidents Severity And Consequences Ppt PowerPoint Presentation Inspiration Example File
Presenting this set of slides with name healthcare management kpi dashboard showing incidents severity and consequences ppt powerpoint presentation inspiration example file. The topics discussed in these slides are finance, marketing, management, investment, analysis. This is a completely editable PowerPoint presentation and is available for immediate download. Download now and impress your audience.
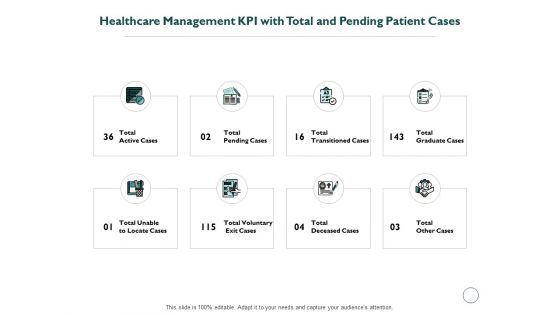
Healthcare Management KPI With Total And Pending Patient Cases Ppt PowerPoint Presentation Outline Background Image
Presenting this set of slides with name healthcare management kpi with total and pending patient cases ppt powerpoint presentation outline background image. This is a eight stage process. The stages in this process are business, management, planning, strategy, marketing. This is a completely editable PowerPoint presentation and is available for immediate download. Download now and impress your audience.
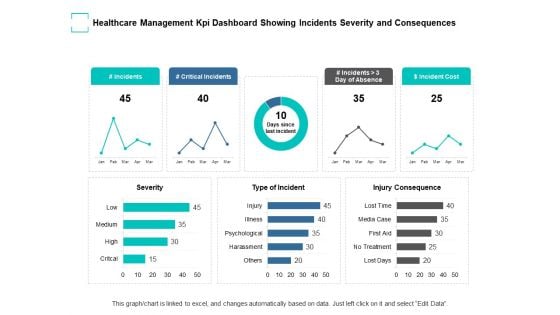
Healthcare Management Kpi Dashboard Showing Incidents Severity And Consequences Ppt PowerPoint Presentation Ideas Sample
Presenting this set of slides with name healthcare management kpi dashboard showing incidents severity and consequences ppt powerpoint presentation ideas sample. The topics discussed in these slides are business, planning, strategy, marketing, management. This is a completely editable PowerPoint presentation and is available for immediate download. Download now and impress your audience.
Healthcare Management Kpi With Total And Pending Patient Cases Ppt PowerPoint Presentation File Icon
Presenting this set of slides with name healthcare management kpi with total and pending patient cases ppt powerpoint presentation file icon. The topics discussed in these slides are business, planning, strategy, marketing, management. This is a completely editable PowerPoint presentation and is available for immediate download. Download now and impress your audience.
Healthcare Management KPI Dashboard Showing Incidents Severity And Consequences Ppt PowerPoint Presentation Icon Model
Presenting this set of slides with name healthcare management kpi dashboard showing incidents severity and consequences ppt powerpoint presentation icon model. The topics discussed in these slides are finance, marketing, management, investment, analysis. This is a completely editable PowerPoint presentation and is available for immediate download. Download now and impress your audience.
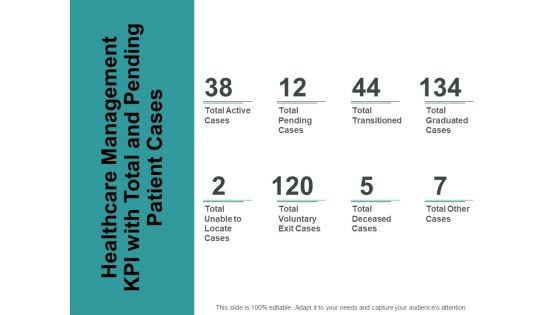
Healthcare Management KPI With Total And Pending Patient Cases Ppt PowerPoint Presentation Portfolio Information
Presenting this set of slides with name healthcare management kpi with total and pending patient cases ppt powerpoint presentation portfolio information. The topics discussed in these slides are active, pending, transitioned, graduated, voluntary. This is a completely editable PowerPoint presentation and is available for immediate download. Download now and impress your audience.
Healthcare Management KPI Dashboard Showing Incidents Severity And Consequences Ppt PowerPoint Presentation Icon Structure
Presenting this set of slides with name healthcare management kpi dashboard showing incidents severity and consequences ppt powerpoint presentation icon structure. The topics discussed in these slides are incidents, severity, injury consequence, management, marketing. This is a completely editable PowerPoint presentation and is available for immediate download. Download now and impress your audience.

Healthcare Management KPI With Total And Pending Patient Cases Ppt PowerPoint Presentation Layouts Topics
Presenting this set of slides with name healthcare management kpi with total and pending patient cases ppt powerpoint presentation layouts topics. This is a eight stage process. The stages in this process are active, pending, transitioned, graduated, deceased. This is a completely editable PowerPoint presentation and is available for immediate download. Download now and impress your audience.
Sustainability Calculation With KPI Long Term Goals Of The Company Ppt PowerPoint Presentation Gallery Icon PDF
This slide shows long term goals set by the firm. Goals covered are to enlist the company fortune 500, to acquire product market share in US alone and to become top FMCG company in North America. Presenting sustainability calculation with kpi long term goals of the company ppt powerpoint presentation gallery icon pdf to provide visual cues and insights. Share and navigate important information on five stages that need your due attention. This template can be used to pitch topics like long term goals of the company. In addtion, this PPT design contains high resolution images, graphics, etc, that are easily editable and available for immediate download.
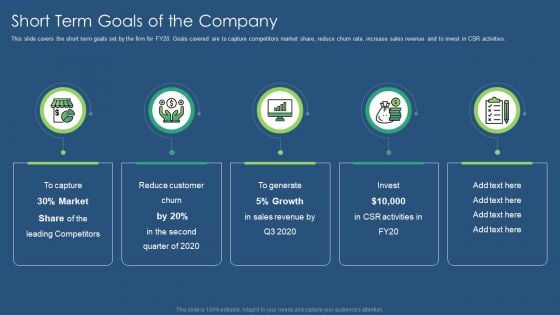
Sustainability Calculation With KPI Short Term Goals Of The Company Ppt PowerPoint Presentation File Rules PDF
This slide covers the short term goals set by the firm for FY20. Goals covered are to capture competitors market share, reduce churn rate, increase sales revenue and to invest in CSR activities. Presenting sustainability calculation with kpi short term goals of the company ppt powerpoint presentation file rules pdf to provide visual cues and insights. Share and navigate important information on five stages that need your due attention. This template can be used to pitch topics like short term goals of the company. In addtion, this PPT design contains high resolution images, graphics, etc, that are easily editable and available for immediate download.
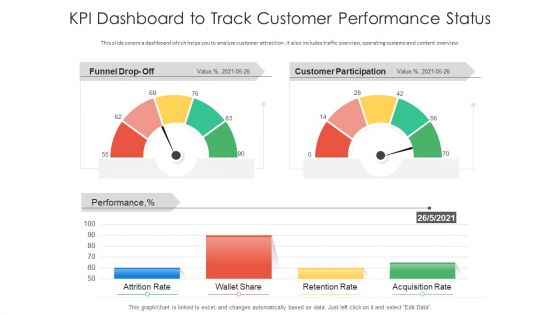
Kpi Dashboard To Track Customer Performance Status Ppt PowerPoint Presentation Inspiration Shapes PDF
Pitch your topic with ease and precision using this kpi dashboard to track customer performance status ppt powerpoint presentation inspiration shapes pdf. This layout presents information on attrition rate, wallet share, retention rate. It is also available for immediate download and adjustment. So, changes can be made in the color, design, graphics or any other component to create a unique layout.
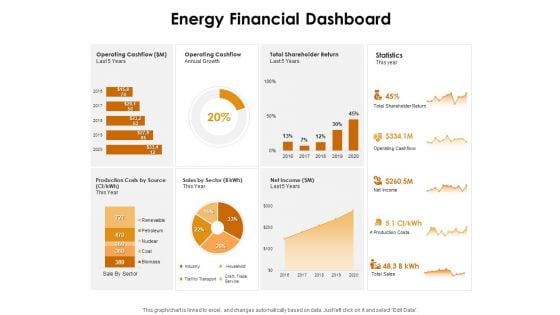
KPI Dashboards Per Industry Energy Financial Dashboard Ppt PowerPoint Presentation Professional Example File PDF
Deliver and pitch your topic in the best possible manner with this kpi dashboards per industry energy financial dashboard ppt powerpoint presentation professional example file pdf. Use them to share invaluable insights on operating cashflow, total shareholder return, production costs source, sales sector, net income and impress your audience. This template can be altered and modified as per your expectations. So, grab it now.
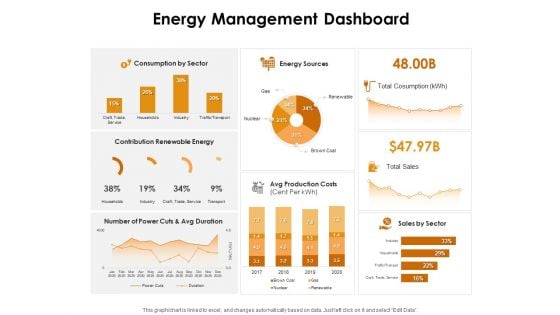
KPI Dashboards Per Industry Energy Management Dashboard Ppt PowerPoint Presentation Infographics Background PDF
Deliver an awe-inspiring pitch with this creative kpi dashboards per industry energy management dashboard ppt powerpoint presentation infographics background pdf bundle. Topics like consumption sector, energy sources, contribution renewable energy, avg production costs, sales sector can be discussed with this completely editable template. It is available for immediate download depending on the needs and requirements of the user.
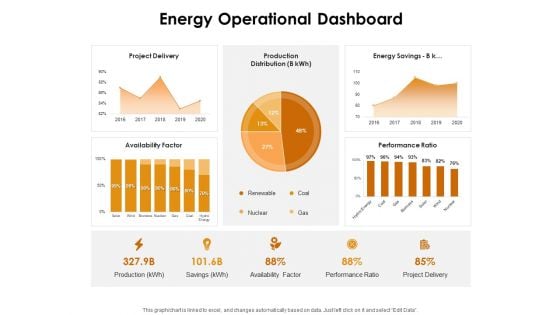
KPI Dashboards Per Industry Energy Operational Dashboard Ppt PowerPoint Presentation Outline Shapes PDF
Deliver and pitch your topic in the best possible manner with this kpi dashboards per industry energy operational dashboard ppt powerpoint presentation outline shapes pdf. Use them to share invaluable insights on project delivery, production distribution, energy savings, availability factor, coal, gas and impress your audience. This template can be altered and modified as per your expectations. So, grab it now.
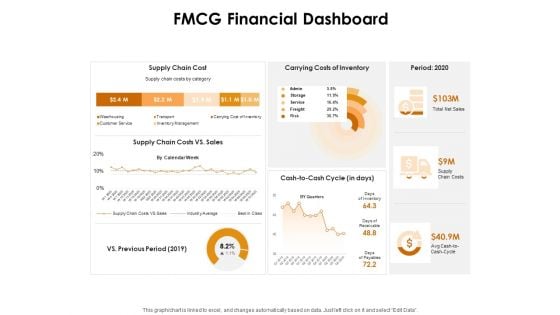
KPI Dashboards Per Industry FMCG Financial Dashboard Ppt PowerPoint Presentation Outline Information PDF
Deliver an awe-inspiring pitch with this creative kpi dashboards per industry fmcg financial dashboard ppt powerpoint presentation outline information pdf bundle. Topics like supply chain cost, carrying costs of inventory, period 2020, supply chain costs vs sales can be discussed with this completely editable template. It is available for immediate download depending on the needs and requirements of the user.
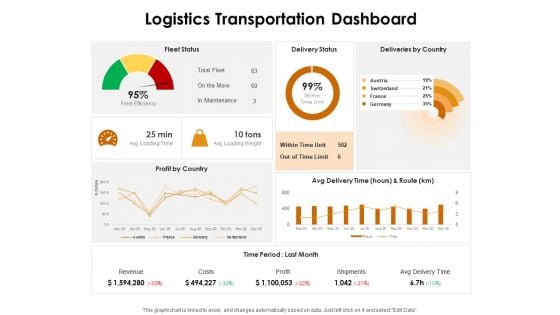
KPI Dashboards Per Industry Logistics Transportation Dashboard Ppt PowerPoint Presentation Portfolio Show PDF
Deliver an awe-inspiring pitch with this creative kpi dashboards per industry logistics transportation dashboard ppt powerpoint presentation portfolio show pdf bundle. Topics like fleet status, delivery status, delivery country, profit country, avg delivery time hours and route can be discussed with this completely editable template. It is available for immediate download depending on the needs and requirements of the user.
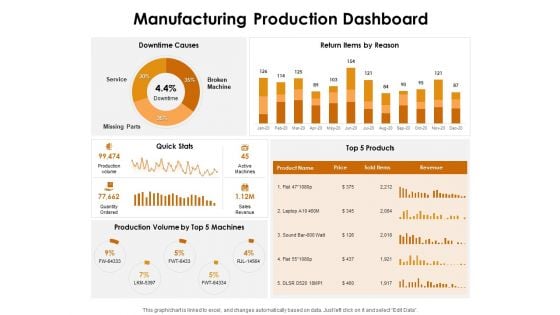
KPI Dashboards Per Industry Manufacturing Production Dashboard Ppt PowerPoint Presentation Portfolio Shapes PDF
Deliver an awe-inspiring pitch with this creative kpi dashboards per industry manufacturing production dashboard ppt powerpoint presentation portfolio shapes pdf bundle. Topics like downtime causes, return items reason, quick stats, top 5 products, production volume top 5 machines can be discussed with this completely editable template. It is available for immediate download depending on the needs and requirements of the user.
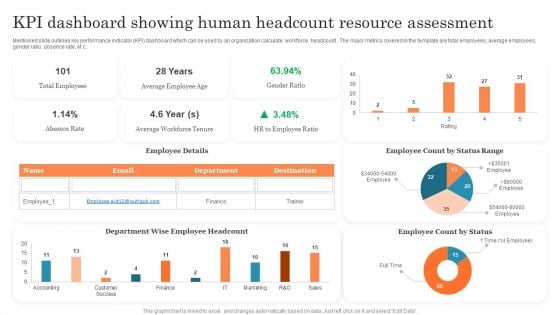
KPI Dashboard Showing Human Headcount Resource Assessment Ppt PowerPoint Presentation Outline PDF
Mentioned slide outlines key performance indicator KPI dashboard which can be used by an organization calculate workforce headcount . The major metrics covered in the template are total employees, average employees, gender ratio, absence rate, etc. Pitch your topic with ease and precision using this KPI Dashboard Showing Human Headcount Resource Assessment Ppt PowerPoint Presentation Outline PDF. This layout presents information on Total Employees, Average Employee, Employee Count. It is also available for immediate download and adjustment. So, changes can be made in the color, design, graphics or any other component to create a unique layout.
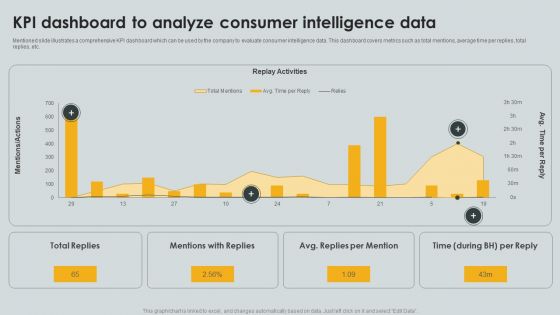
KPI Dashboard To Analyze Consumer Intelligence Data Ppt PowerPoint Presentation File Portfolio PDF
Mentioned slide illustrates a comprehensive KPI dashboard which can be used by the company to evaluate consumer intelligence data. This dashboard covers metrics such as total mentions, average time per replies, total replies, etc. Pitch your topic with ease and precision using this KPI Dashboard To Analyze Consumer Intelligence Data Ppt PowerPoint Presentation File Portfolio PDF. This layout presents information on Replay Activities, Total Replies, Mentions Replies. It is also available for immediate download and adjustment. So, changes can be made in the color, design, graphics or any other component to create a unique layout.
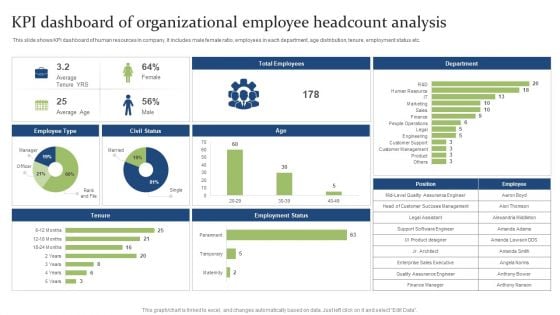
KPI Dashboard Of Organizational Employee Headcount Analysis Ppt PowerPoint Presentation Styles Show PDF
This slide shows KPI dashboard of human resources in company. It includes male female ratio, employees in each department, age distribution, tenure, employment status etc. Showcasing this set of slides titled KPI Dashboard Of Organizational Employee Headcount Analysis Ppt PowerPoint Presentation Styles Show PDF. The topics addressed in these templates are Support Software, Engineer Success, Sales Executive. All the content presented in this PPT design is completely editable. Download it and make adjustments in color, background, font etc. as per your unique business setting.
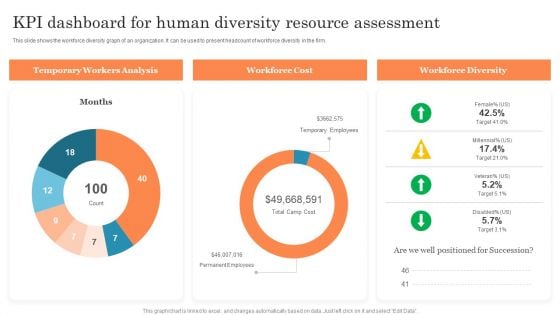
KPI Dashboard For Human Diversity Resource Assessment Ppt PowerPoint Presentation Model Vector PDF
This slide shows the workforce diversity graph of an organization. It can be used to present headcount of workforce diversity in the firm. Showcasing this set of slides titled KPI Dashboard For Human Diversity Resource Assessment Ppt PowerPoint Presentation Model Vector PDF. The topics addressed in these templates are Temporary Workers, Temporary Employees, Workforce Diversity. All the content presented in this PPT design is completely editable. Download it and make adjustments in color, background, font etc. as per your unique business setting.
KPI Dashboards Per Industry Retail Store Dashboard Ppt PowerPoint Presentation Icon Grid PDF
Deliver an awe-inspiring pitch with this creative kpi dashboards per industry retail store dashboard ppt powerpoint presentation icon grid pdf bundle. Topics like total customers and visitors, avg price and units per transaction, out stock items, sales city, top 5 articles by sold items, top 5 articles revenue can be discussed with this completely editable template. It is available for immediate download depending on the needs and requirements of the user.
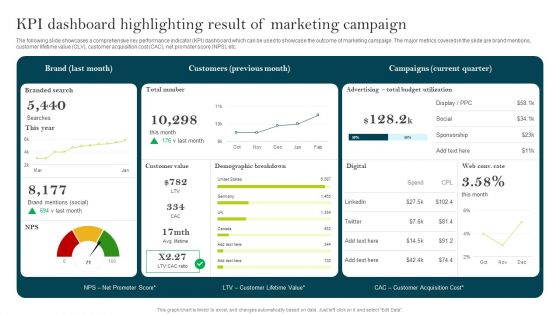
KPI Dashboard Highlighting Result Of Marketing Campaign Ppt PowerPoint Presentation Diagram Lists PDF
The following slide showcases a comprehensive key performance indicator KPI dashboard which can be used to showcase the outcome of marketing campaign. The major metrics covered in the slide are brand mentions, customer lifetime value CLV, customer acquisition cost CAC, net promoter score NPS, etc. Are you in need of a template that can accommodate all of your creative concepts This one is crafted professionally and can be altered to fit any style. Use it with Google Slides or PowerPoint. Include striking photographs, symbols, depictions, and other visuals. Fill, move around, or remove text boxes as desired. Test out color palettes and font mixtures. Edit and save your work, or work with colleagues. Download KPI Dashboard Highlighting Result Of Marketing Campaign Ppt PowerPoint Presentation Diagram Lists PDF and observe how to make your presentation outstanding. Give an impeccable presentation to your group and make your presentation unforgettable.
Kpi Dashboard For Tracking Shareholder Value Maximization Ppt PowerPoint Presentation File Icon PDF
This slide showcases the KPI dashboard that would help the business organization to track shareholder and companys valuation. It includes parameters such as total dividend growth rate, total capital return, share count reduced, etc. Retrieve professionally designed Kpi Dashboard For Tracking Shareholder Value Maximization Ppt PowerPoint Presentation File Icon PDF to effectively convey your message and captivate your listeners. Save time by selecting pre made slideshows that are appropriate for various topics, from business to educational purposes. These themes come in many different styles, from creative to corporate, and all of them are easily adjustable and can be edited quickly. Access them as PowerPoint templates or as Google Slides themes. You do not have to go on a hunt for the perfect presentation because Slidegeeks got you covered from everywhere.
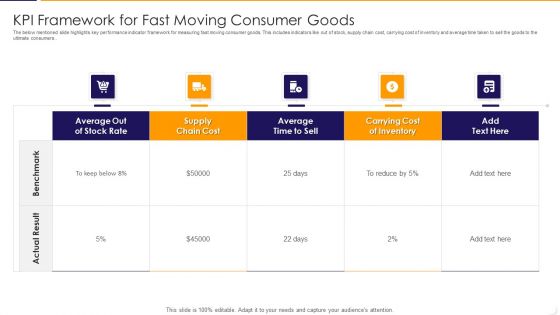
KPI Framework For Fast Moving Consumer Goods Ppt PowerPoint Presentation File Show PDF
The below mentioned slide highlights key performance indicator framework for measuring fast moving consumer goods. This includes indicators like out of stock, supply chain cost, carrying cost of inventory and average time taken to sell the goods to the ultimate consumers. Pitch your topic with ease and precision using this kpi framework for fast moving consumer goods ppt powerpoint presentation file show pdf This layout presents information on average, stock rate, cost It is also available for immediate download and adjustment. So, changes can be made in the color, design, graphics or any other component to create a unique layout.
KPI Framework For Customer Acquisition And Retention Ppt PowerPoint Presentation Icon Diagrams PDF
This slide illustrates key performance indicator framework for customer acquisition and retention such as customer churn rate, customer lifetime value, repeat purchase rate and customer acquisition cost. It also provides information about comparison of standard and actual performance of kips. Showcasing this set of slides titled kpi framework for customer acquisition and retention ppt powerpoint presentation icon diagrams pdf The topics addressed in these templates are customer, value, acquisition cost. All the content presented in this PPT design is completely editable. Download it and make adjustments in color, background, font etc. as per your unique business setting.
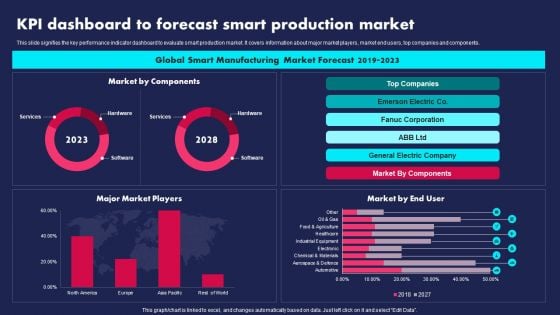
KPI Dashboard To Forecast Smart Production Market Ppt PowerPoint Presentation Gallery Visual Aids PDF
This slide signifies the key performance indicator dashboard to evaluate smart production market. It covers information about major market players, market end users, top companies and components. Pitch your topic with ease and precision using this KPI Dashboard To Forecast Smart Production Market Ppt PowerPoint Presentation Gallery Visual Aids PDF. This layout presents information on Global Smart Manufacturing, Market Forecast, 2019 To 2023. It is also available for immediate download and adjustment. So, changes can be made in the color, design, graphics or any other component to create a unique layout.
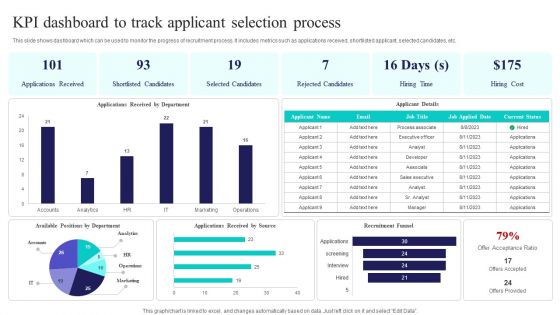
Kpi Dashboard To Track Applicant Selection Process Ppt PowerPoint Presentation File Graphics Template PDF
This slide shows dashboard which can be used to monitor the progress of recruitment process. It includes metrics such as applications received, shortlisted applicant, selected candidates, etc. Pitch your topic with ease and precision using this Kpi Dashboard To Track Applicant Selection Process Ppt PowerPoint Presentation File Graphics Template PDF. This layout presents information on Applications Received, Shortlisted Candidates, Selected Candidates. It is also available for immediate download and adjustment. So, changes can be made in the color, design, graphics or any other component to create a unique layout.
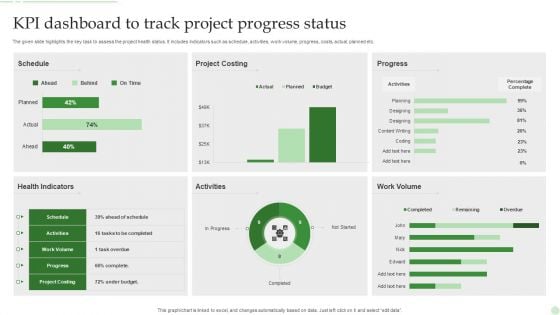
KPI Dashboard To Track Project Progress Status Ppt PowerPoint Presentation Gallery Maker PDF
The given slide highlights the key task to assess the project health status. It includes indicators such as schedule, activities, work volume, progress, costs, actual, planned etc. Showcasing this set of slides titled KPI Dashboard To Track Project Progress Status Ppt PowerPoint Presentation Gallery Maker PDF. The topics addressed in these templates are Schedule, Project Costing, Progress, Activities. All the content presented in this PPT design is completely editable. Download it and make adjustments in color, background, font etc. as per your unique business setting.

KPI Dashboard To Track First Time Leads Ppt PowerPoint Presentation File Pictures PDF
The following slide showcases dashboard which can help businesses assess information about newly generated leads. It provides information about leads, permissions gained by source, revenue, sales closed, MailChimp, email, ads, etc. Take your projects to the next level with our ultimate collection of KPI Dashboard To Track First Time Leads Ppt PowerPoint Presentation File Pictures PDF. Slidegeeks has designed a range of layouts that are perfect for representing task or activity duration, keeping track of all your deadlines at a glance. Tailor these designs to your exact needs and give them a truly corporate look with your own brand colors they will make your projects stand out from the rest.
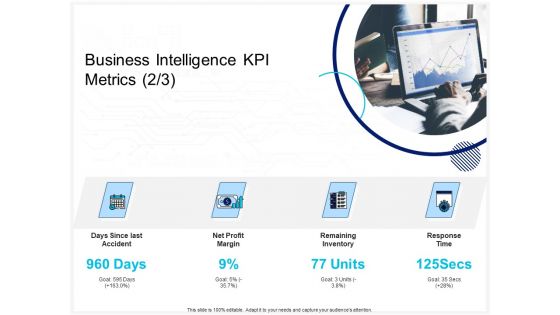
Enterprise Problem Solving And Intellect Business Intelligence KPI Metrics Profit Ppt PowerPoint Presentation Infographic Template Portrait PDF
Presenting this set of slides with name enterprise problem solving and intellect business intelligence kpi metrics profit ppt powerpoint presentation infographic template portrait pdf. This is a four stage process. The stages in this process are days since last accident, net profit margin, remaining inventory, response time. This is a completely editable PowerPoint presentation and is available for immediate download. Download now and impress your audience.
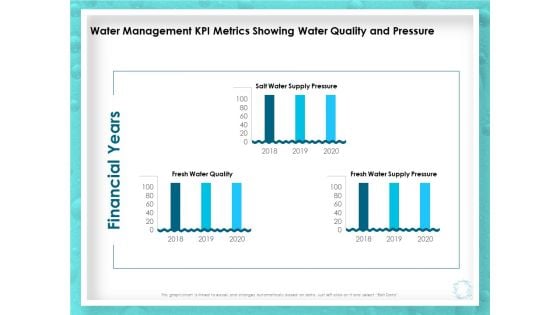
WQM System Water Management KPI Metrics Showing Water Quality And Pressure Ppt PowerPoint Presentation Model Example File PDF
Presenting this set of slides with name wqm system water management kpi metrics showing water quality and pressure ppt powerpoint presentation model example file pdf. The topics discussed in these slides are financial years, fresh water quality, fresh water supply pressure, salt water supply pressure, 2018 to 2020. This is a completely editable PowerPoint presentation and is available for immediate download. Download now and impress your audience.
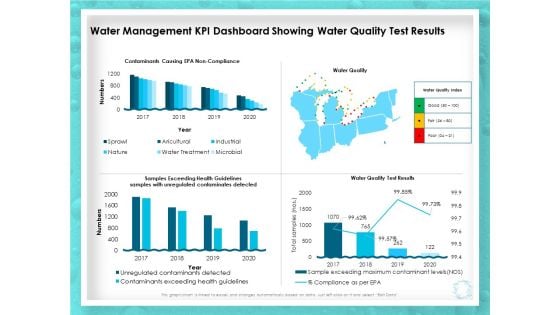
WQM System Water Management KPI Dashboard Showing Water Quality Test Results Ppt PowerPoint Presentation Outline Portfolio PDF
Presenting this set of slides with name wqm system water management kpi dashboard showing water quality test results ppt powerpoint presentation outline portfolio pdf. The topics discussed in these slides are contaminants causing epa non compliance, water quality, water quality test results, samples exceeding health guidelines. This is a completely editable PowerPoint presentation and is available for immediate download. Download now and impress your audience.

Communication KPI Dashboard With KPI Comparison Ideas PDF
Pitch your topic with ease and precision using this Communication KPI Dashboard With KPI Comparison Ideas PDF This layout presents information on Increase In Brand, Employees Knowledge, Vision Statement It is also available for immediate download and adjustment. So, changes can be made in the color, design, graphics or any other component to create a unique layout.
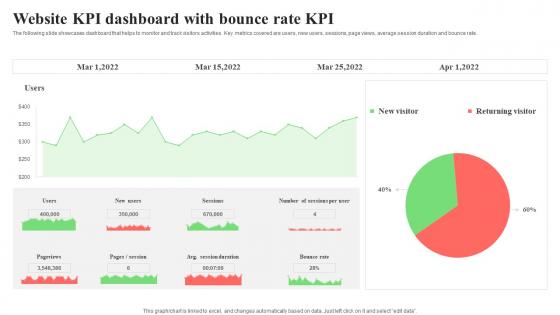
Website KPI Dashboard With Bounce Rate KPI Formats Pdf
The following slide showcases dashboard that helps to monitor and track visitors activities. Key metrics covered are users, new users, sessions, page views, average session duration and bounce rate. Pitch your topic with ease and precision using this Website KPI Dashboard With Bounce Rate KPI Formats Pdf. This layout presents information on Page Views, Average Session Duration, Bounce Rate. It is also available for immediate download and adjustment. So, changes can be made in the color, design, graphics or any other component to create a unique layout. The following slide showcases dashboard that helps to monitor and track visitors activities. Key metrics covered are users, new users, sessions, page views, average session duration and bounce rate.
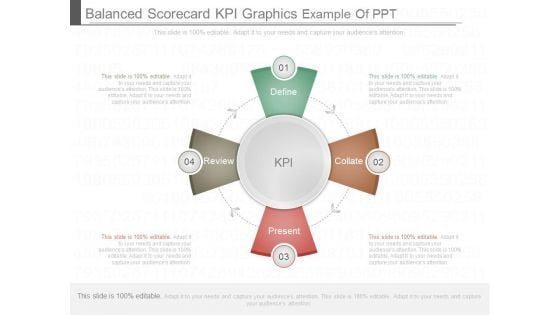
Balanced Scorecard Kpi Graphics Example Of Ppt
This is a balanced scorecard kpi graphics example of ppt. This is a four stage process. The stages in this process are define, review, present, collate. Kpi.

 Home
Home