Price Comparison
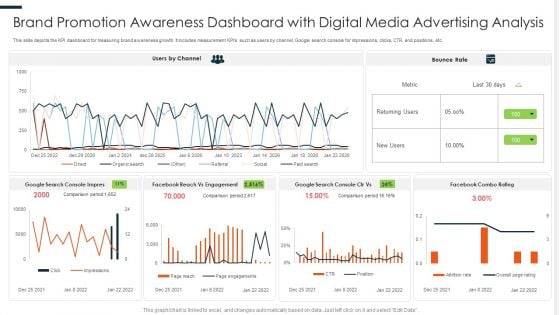
Brand Promotion Awareness Dashboard With Digital Media Advertising Analysis Ppt PowerPoint Presentation Design Ideas PDF
This slide depicts the KPI dashboard for measuring brand awareness growth. It includes measurement KPIs such as users by channel, Google search console for impressions, clicks, CTR, and positions, etc. Pitch your topic with ease and precision using this Brand Promotion Awareness Dashboard With Digital Media Advertising Analysis Ppt PowerPoint Presentation Design Ideas PDF. This layout presents information on Console Impress, Reach Engagement, Combo Rating. It is also available for immediate download and adjustment. So, changes can be made in the color, design, graphics or any other component to create a unique layout.
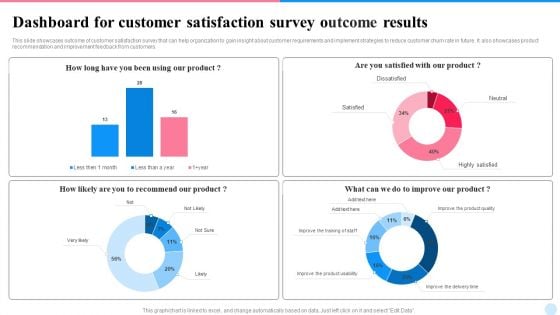
Dashboard For Customer Satisfaction Survey Outcome Results Topics PDF
This slide showcases outcome of customer satisfaction survey that can help organization to gain insight about customer requirements and implement strategies to reduce customer churn rate in future. It also showcases product recommendation and improvement feedback from customers. Pitch your topic with ease and precision using this Dashboard For Customer Satisfaction Survey Outcome Results Topics PDF. This layout presents information on Dashboard, Customer Satisfaction, Survey Outcome Results. It is also available for immediate download and adjustment. So, changes can be made in the color, design, graphics or any other component to create a unique layout.
Weekly Customer Grievance Tracking Dashboard Designs PDF
This slide showcases dashboard that can help organization to identify the open and overdue status of customer grievance . It can guide managers to resolve the complaints and issues within stipulated time for customer satisfaction. Pitch your topic with ease and precision using this Weekly Customer Grievance Tracking Dashboard Designs PDF. This layout presents information on Average, Traffic Analysis, Customer Satisfaction Ratings. It is also available for immediate download and adjustment. So, changes can be made in the color, design, graphics or any other component to create a unique layout.
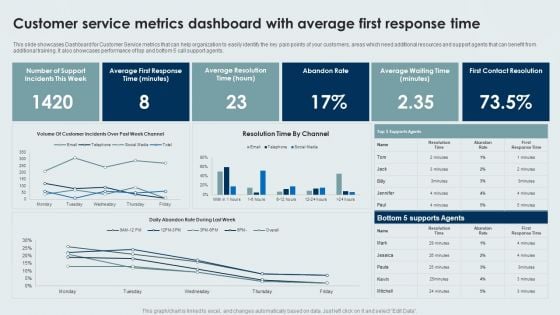
Customer Service Metrics Dashboard With Average First Response Time Background PDF
This slide showcases Dashboard for Customer Service metrics that can help organization to easily identify the key pain points of your customers, areas which need additional resources and support agents that can benefit from additional training. It also showcases performance of top and bottom 5 call support agents. Pitch your topic with ease and precision using this Customer Service Metrics Dashboard With Average First Response Time Background PDF. This layout presents information on Average, Abandon Rate, Contact Resolution. It is also available for immediate download and adjustment. So, changes can be made in the color, design, graphics or any other component to create a unique layout.
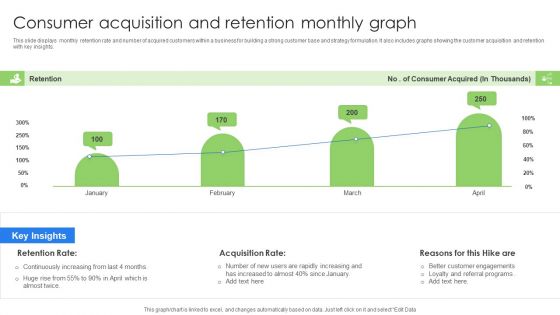
Consumer Acquisition And Retention Monthly Graph Background PDF
This slide displays monthly retention rate and number of acquired customers within a business for building a strong customer base and strategy formulation. It also includes graphs showing the customer acquisition and retention with key insights. Pitch your topic with ease and precision using this Consumer Acquisition And Retention Monthly Graph Background PDF. This layout presents information on Consumer Acquisition, Retention Monthly Graph. It is also available for immediate download and adjustment. So, changes can be made in the color, design, graphics or any other component to create a unique layout.
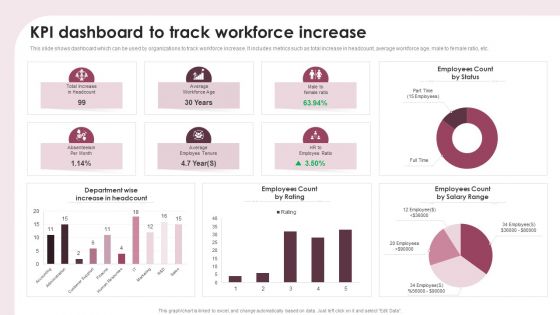
KPI Dashboard To Track Workforce Increase Ppt Show Portfolio PDF
This slide shows dashboard which can be used by organizations to track workforce increase. It includes metrics such as total increase in headcount, average workforce age, male to female ratio, etc. Pitch your topic with ease and precision using this KPI Dashboard To Track Workforce Increase Ppt Show Portfolio PDF. This layout presents information on Department Wise, Increase Headcount, Employees Count Rating. It is also available for immediate download and adjustment. So, changes can be made in the color, design, graphics or any other component to create a unique layout.
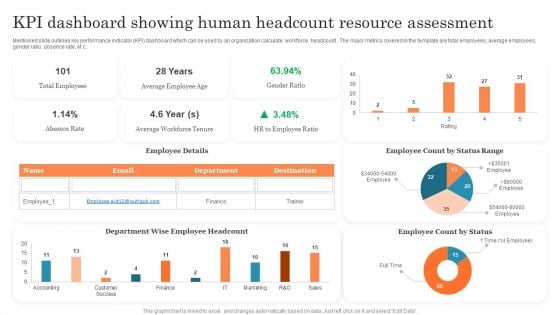
KPI Dashboard Showing Human Headcount Resource Assessment Ppt PowerPoint Presentation Outline PDF
Mentioned slide outlines key performance indicator KPI dashboard which can be used by an organization calculate workforce headcount . The major metrics covered in the template are total employees, average employees, gender ratio, absence rate, etc. Pitch your topic with ease and precision using this KPI Dashboard Showing Human Headcount Resource Assessment Ppt PowerPoint Presentation Outline PDF. This layout presents information on Total Employees, Average Employee, Employee Count. It is also available for immediate download and adjustment. So, changes can be made in the color, design, graphics or any other component to create a unique layout.
Consumer Journey Mapping Techniques Dashboard For Tracking Customer Service Team Performance Summary PDF
This slide covers the KPI dashboard for analyzing the performance of client support department. It includes metrics such as first call resolution, unresolved calls, average response rate, the best day to call, average time to solve issues, etc. Pitch your topic with ease and precision using this Consumer Journey Mapping Techniques Dashboard For Tracking Customer Service Team Performance Summary PDF. This layout presents information on Dashboard For Tracking Customer, Service Team Performance. It is also available for immediate download and adjustment. So, changes can be made in the color, design, graphics or any other component to create a unique layout.
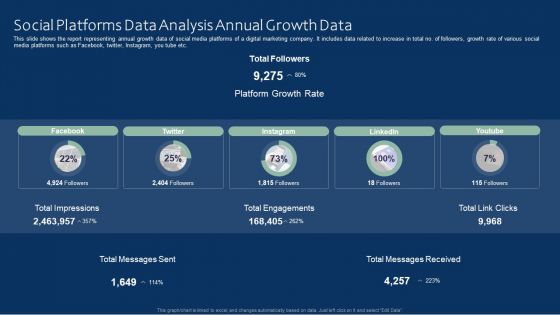
Social Platforms Data Analysis Annual Growth Data Ideas PDF
This slide shows the report representing annual growth data of social media platforms of a digital marketing company. It includes data related to increase in total no. of followers, growth rate of various social media platforms such as Facebook, twitter, Instagram, you tube etc. Pitch your topic with ease and precision using this Social Platforms Data Analysis Annual Growth Data Ideas PDF. This layout presents information on Social Platforms Data Analysis, Annual Growth Data. It is also available for immediate download and adjustment. So, changes can be made in the color, design, graphics or any other component to create a unique layout.
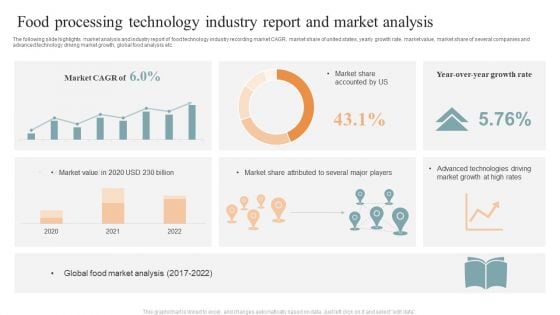
Food Processing Technology Industry Report And Market Analysis Brochure PDF
The following slide highlights market analysis and industry report of food technology industry recording market CAGR, market share of united states, yearly growth rate, market value, market share of several companies and advanced technology driving market growth, global food analysis etc. Pitch your topic with ease and precision using this Food Processing Technology Industry Report And Market Analysis Brochure PDF. This layout presents information on Market CAGR, Market Share Accounted, Global Food, Market Analysis. It is also available for immediate download and adjustment. So, changes can be made in the color, design, graphics or any other component to create a unique layout.
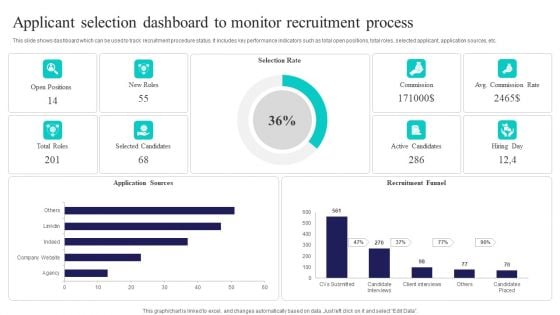
Applicant Selection Dashboard To Monitor Recruitment Process Sample PDF
This slide shows dashboard which can be used to track recruitment procedure status. It includes key performance indicators such as total open positions, total roles, selected applicant, application sources, etc. Pitch your topic with ease and precision using this Applicant Selection Dashboard To Monitor Recruitment Process Sample PDF. This layout presents information on Selection Rate, Recruitment Funnel, Application Sources. It is also available for immediate download and adjustment. So, changes can be made in the color, design, graphics or any other component to create a unique layout.
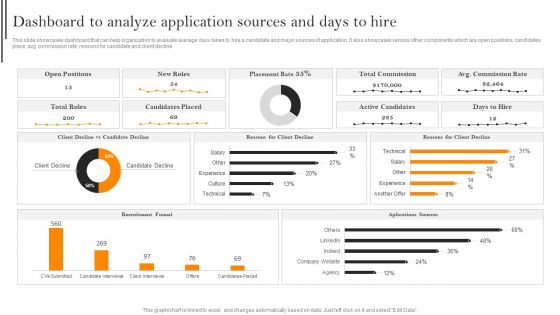
Dashboard To Analyze Application Sources And Days To Hire Template PDF
This slide showcases dashboard that can help organization to evaluate average days taken to hire a candidate and major sources of application. It also showcases various other components which are open positions, candidates place, avg commission rate, reasons for candidate and client decline. Find a pre designed and impeccable Dashboard To Analyze Application Sources And Days To Hire Template PDF. The templates can ace your presentation without additional effort. You can download these easy to edit presentation templates to make your presentation stand out from others. So, what are you waiting for Download the template from Slidegeeks today and give a unique touch to your presentation.
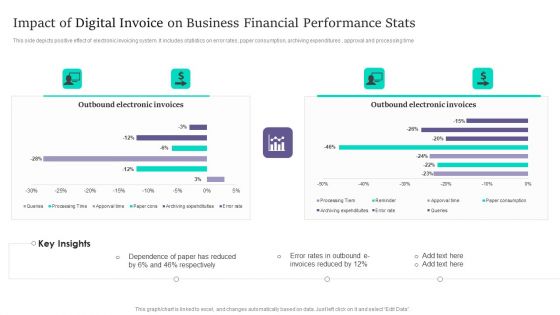
Impact Of Digital Invoice On Business Financial Performance Stats Infographics PDF
This side depicts positive effect of electronic invoicing system. It includes statistics on error rates, paper consumption, archiving expenditures , approval and processing time. Pitch your topic with ease and precision using this Impact Of Digital Invoice On Business Financial Performance Stats Infographics PDF. This layout presents information on Impact Of Digital Invoice, Business Financial Performance Stats. It is also available for immediate download and adjustment. So, changes can be made in the color, design, graphics or any other component to create a unique layout.
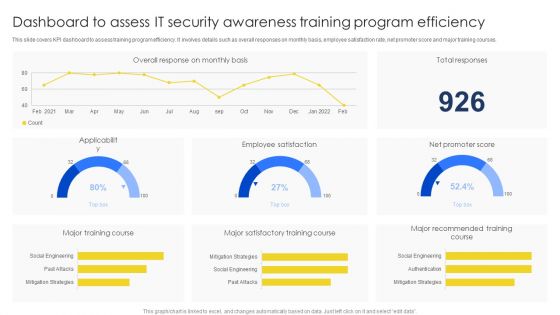
Dashboard To Assess IT Security Awareness Training Program Efficiency Brochure PDF
This slide covers KPI dashboard to assess training program efficiency. It involves details such as overall responses on monthly basis, employee satisfaction rate, net promoter score and major training courses. Pitch your topic with ease and precision using this Dashboard To Assess IT Security Awareness Training Program Efficiency Brochure PDF. This layout presents information on Major Training Course, Major Satisfactory, Training Course. It is also available for immediate download and adjustment. So, changes can be made in the color, design, graphics or any other component to create a unique layout.
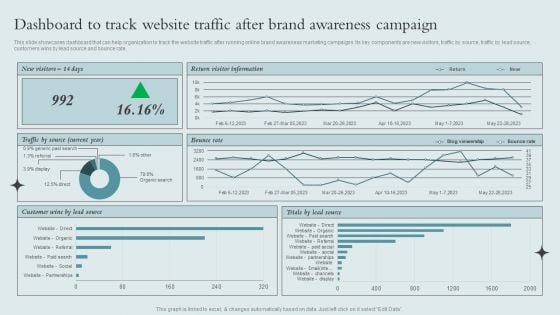
Brand Awareness Strategy Dashboard To Track Website Traffic After Brand Awareness Rules PDF
This slide showcases dashboard that can help organization to track the website traffic after running online brand awareness marketing campaigns. Its key components are new visitors, traffic by source, traffic by lead source, customers wins by lead source and bounce rate. From laying roadmaps to briefing everything in detail, our templates are perfect for you. You can set the stage with your presentation slides. All you have to do is download these easy-to-edit and customizable templates. Brand Awareness Strategy Dashboard To Track Website Traffic After Brand Awareness Rules PDF will help you deliver an outstanding performance that everyone would remember and praise you for. Do download this presentation today.
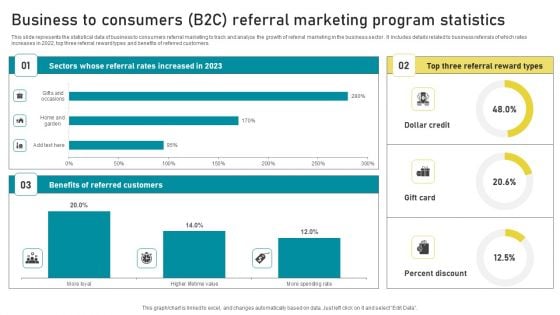
Business To Consumers B2C Referral Marketing Program Statistics Information PDF
This slide represents the statistical data of business to consumers referral marketing to track and analyze the growth of referral marketing in the business sector . It includes details related to business referrals of which rates increases in 2022, top three referral reward types and benefits of referred customers. Pitch your topic with ease and precision using this Business To Consumers B2C Referral Marketing Program Statistics Information PDF. This layout presents information on Top Three Referral, Reward Types, Dollar Credit, Percent Discount, Gift Card. It is also available for immediate download and adjustment. So, changes can be made in the color, design, graphics or any other component to create a unique layout.
Safety And Health Kpis For Tracking Performance Graph Mockup PDF
This slide represents graph showing key performance indicators tracked by companies for assessment of safety and health performance of their workplace. It includes key metrics such as workforce awareness, safety meetings held, recordable injuries, lost work days, compliance, severity rates etc. Pitch your topic with ease and precision using this Safety And Health Kpis For Tracking Performance Graph Mockup PDF. This layout presents information on Safety And Health, Kpis For Tracking, Performance Graph. It is also available for immediate download and adjustment. So, changes can be made in the color, design, graphics or any other component to create a unique layout.
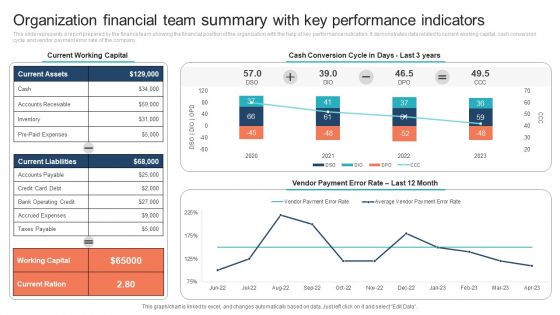
Organization Financial Team Summary With Key Performance Indicators Clipart PDF
This slide represents a report prepared by the finance team showing the financial position of the organization with the help of key performance indicators. It demonstrates data related to current working capital, cash conversion cycle and vendor payment error rate of the company. Pitch your topic with ease and precision using this Organization Financial Team Summary With Key Performance Indicators Clipart PDF. This layout presents information on Current Working Capital, Cash Conversion Cycle. It is also available for immediate download and adjustment. So, changes can be made in the color, design, graphics or any other component to create a unique layout.
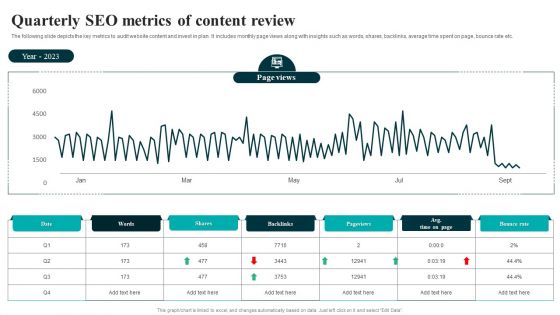
Quarterly SEO Metrics Of Content Review Structure PDF
The following slide depicts the key metrics to audit website content and invest in plan. It includes monthly page views along with insights such as words, shares, backlinks, average time spent on page, bounce rate etc. Pitch your topic with ease and precision using this Quarterly SEO Metrics Of Content Review Structure PDF. This layout presents information on Quarterly SEO, Metrics Of Content Review. It is also available for immediate download and adjustment. So, changes can be made in the color, design, graphics or any other component to create a unique layout.
Robotic Process Automation Metrics Tracker With Work Item Statistics Information PDF
This slide covers the RPA dashboard for analysing process data status. It also includes process details such as run success rate, inputs, processing, fail, output, robotic run minutes, total value generated, work items processed. Pitch your topic with ease and precision using this Robotic Process Automation Metrics Tracker With Work Item Statistics Information PDF. This layout presents information on Robotic Process Automation, Metrics Tracker, Work Item Statistics. It is also available for immediate download and adjustment. So, changes can be made in the color, design, graphics or any other component to create a unique layout.
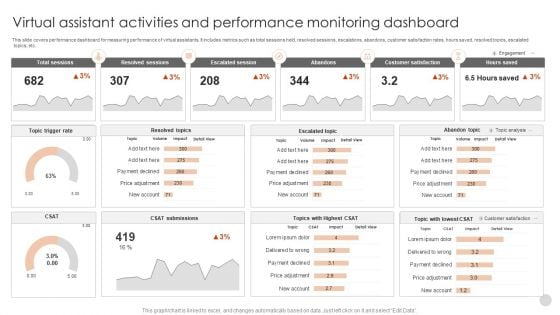
Virtual Assistant Activities And Performance Monitoring Dashboard Guidelines PDF
This slide covers performance dashboard for measuring performance of virtual assistants. It includes metrics such as total sessions held, resolved sessions, escalations, abandons, customer satisfaction rates, hours saved, resolved topics, escalated topics, etc.Pitch your topic with ease and precision using this Virtual Assistant Activities And Performance Monitoring Dashboard Guidelines PDF. This layout presents information on Total Sessions, Resolved Sessions, Escalated Session. It is also available for immediate download and adjustment. So, changes can be made in the color, design, graphics or any other component to create a unique layout.
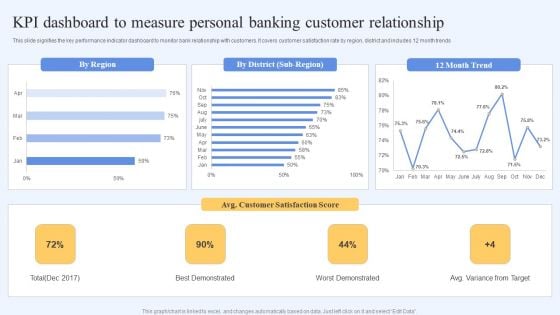
Kpi Dashboard To Measure Personal Banking Customer Relationship Themes PDF
This slide signifies the key performance indicator dashboard to monitor bank relationship with customers. It covers customer satisfaction rate by region, district and includes 12 month trends. Pitch your topic with ease and precision using this Kpi Dashboard To Measure Personal Banking Customer Relationship Themes PDF. This layout presents information on Customer Satisfaction, Best Demonstrated, Worst Demonstrated. It is also available for immediate download and adjustment. So, changes can be made in the color, design, graphics or any other component to create a unique layout.
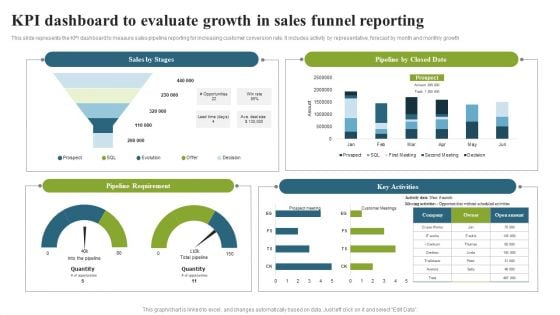
KPI Dashboard To Evaluate Growth In Sales Funnel Reporting Topics PDF
This slide represents the KPI dashboard to measure sales pipeline reporting for increasing customer conversion rate. It includes activity by representative, forecast by month and monthly growth. Pitch your topic with ease and precision using this KPI Dashboard To Evaluate Growth In Sales Funnel Reporting Topics PDF. This layout presents information on Pipeline Requirement, Key Activities, Pipeline Closed Date. It is also available for immediate download and adjustment. So, changes can be made in the color, design, graphics or any other component to create a unique layout.
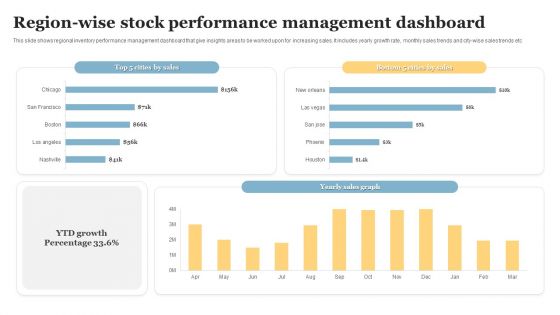
Region Wise Stock Performance Management Dashboard Introduction PDF
This slide shows regional inventory performance management dashboard that give insights areas to be worked upon for increasing sales. It includes yearly growth rate, monthly sales trends and city wise sales trends etc. Pitch your topic with ease and precision using this Region Wise Stock Performance Management Dashboard Introduction PDF. This layout presents information on Stock Performance, Management Dashboard. It is also available for immediate download and adjustment. So, changes can be made in the color, design, graphics or any other component to create a unique layout.
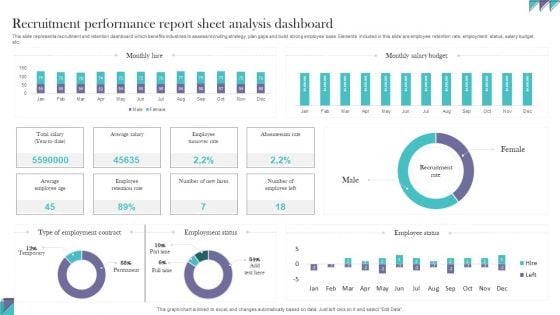
Recruitment Performance Report Sheet Analysis Dashboard Information PDF
This slide represents recruitment and retention dashboard which benefits industries to assess recruiting strategy, plan gaps and build strong employee base. Elements included in this slide are employee retention rate, employment status, salary budget, etc. Pitch your topic with ease and precision using this Recruitment Performance Report Sheet Analysis Dashboard Information PDF. This layout presents information onRecruitment Performance, Report Sheet Analysis. It is also available for immediate download and adjustment. So, changes can be made in the color, design, graphics or any other component to create a unique layout.
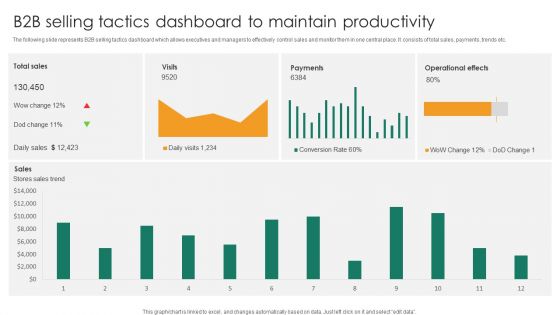
B2b Selling Tactics Dashboard To Maintain Productivity Introduction PDF
The following slide represents B2B selling tactics dashboard which allows executives and managers to effectively control sales and monitor them in one central place. It consists of total sales, payments, trends etc.Pitch your topic with ease and precision using this B2b Selling Tactics Dashboard To Maintain Productivity Introduction PDF. This layout presents information on Operational Effects, Stores Sales Trend, Conversion Rate. It is also available for immediate download and adjustment. So, changes can be made in the color, design, graphics or any other component to create a unique layout.
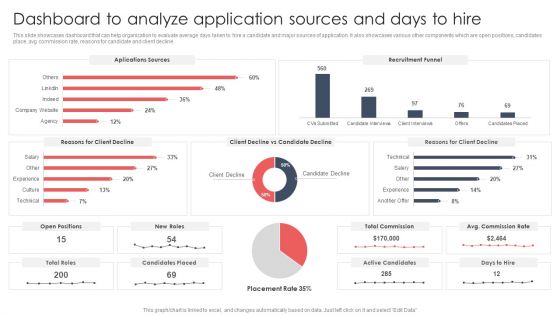
Screening And Staffing Dashboard To Analyze Application Sources And Days To Hire Sample PDF
This slide showcases dashboard that can help organization to evaluate average days taken to hire a candidate and major sources of application. It also showcases various other components which are open positions, candidates place, avg commission rate, reasons for candidate and client decline. From laying roadmaps to briefing everything in detail, our templates are perfect for you. You can set the stage with your presentation slides. All you have to do is download these easy-to-edit and customizable templates. Screening And Staffing Dashboard To Analyze Application Sources And Days To Hire Sample PDF will help you deliver an outstanding performance that everyone would remember and praise you for. Do download this presentation today.
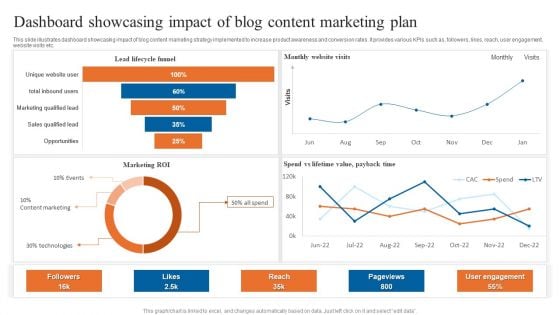
Dashboard Showcasing Impact Of Blog Content Marketing Plan Summary PDF
This slide illustrates dashboard showcasing impact of blog content marketing strategy implemented to increase product awareness and conversion rates. It provides various KPIs such as, followers, likes, reach, user engagement, website visits etc. Pitch your topic with ease and precision using this Dashboard Showcasing Impact Of Blog Content Marketing Plan Summary PDF. This layout presents information on User Engagement, Monthly Website Visits, Spend Lifetime Value, Payback Time. It is also available for immediate download and adjustment. So, changes can be made in the color, design, graphics or any other component to create a unique layout.
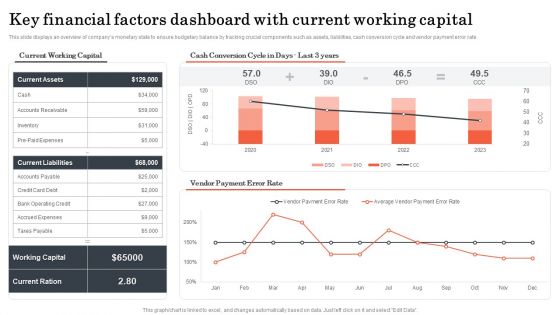
Key Financial Factors Dashboard With Current Working Capital Introduction PDF
This slide displays an overview of companys monetary state to ensure budgetary balance by tracking crucial components such as assets, liabilities, cash conversion cycle and vendor payment error rate. Showcasing this set of slides titled Key Financial Factors Dashboard With Current Working Capital Introduction PDF. The topics addressed in these templates are Key Financial Factors, Dashboard With Current, Working Capital. All the content presented in this PPT design is completely editable. Download it and make adjustments in color, background, font etc. as per your unique business setting.
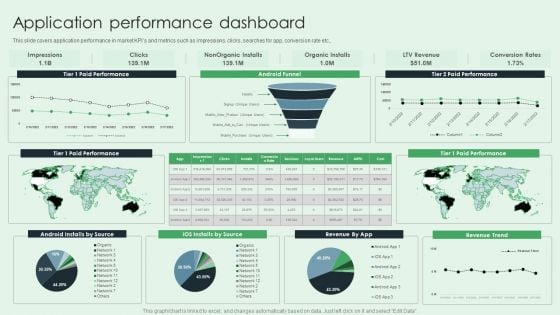
Selling App Development Launch And Marketing Application Performance Dashboard Inspiration PDF
This slide covers application performance in market KPIs and metrics such as impressions, clicks, searches for app, conversion rate etc. This Selling App Development Launch And Marketing Application Performance Dashboard Inspiration PDF from Slidegeeks makes it easy to present information on your topic with precision. It provides customization options, so you can make changes to the colors, design, graphics, or any other component to create a unique layout. It is also available for immediate download, so you can begin using it right away. Slidegeeks has done good research to ensure that you have everything you need to make your presentation stand out. Make a name out there for a brilliant performance.
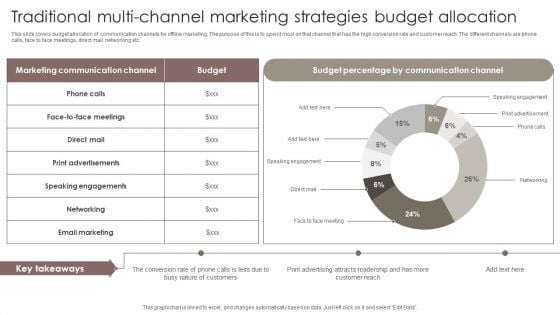
Traditional Multi Channel Marketing Strategies Budget Allocation Diagrams PDF
This slide covers budget allocation of communication channels for offline marketing. The purpose of this is to spend most on that channel that has the high conversion rate and customer reach. The different channels are phone calls, face to face meetings, direct mail, networking etc. Pitch your topic with ease and precision using this Traditional Multi Channel Marketing Strategies Budget Allocation Diagrams PDF. This layout presents information on Communication Channel, Budget Percentage, Speaking Engagements. It is also available for immediate download and adjustment. So, changes can be made in the color, design, graphics or any other component to create a unique layout.
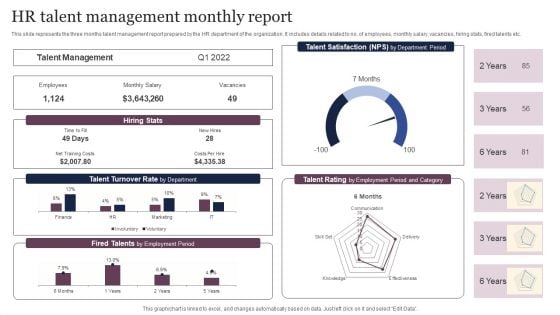
HR Talent Management Monthly Report Inspiration PDF
This slide represents the three months talent management report prepared by the HR department of the organization. It includes details related to no. of employees, monthly salary, vacancies, hiring stats, fired talents etc. Pitch your topic with ease and precision using this HR Talent Management Monthly Report Inspiration PDF. This layout presents information on Talent Management, Talent Turnover Rate, Employment Period. It is also available for immediate download and adjustment. So, changes can be made in the color, design, graphics or any other component to create a unique layout.
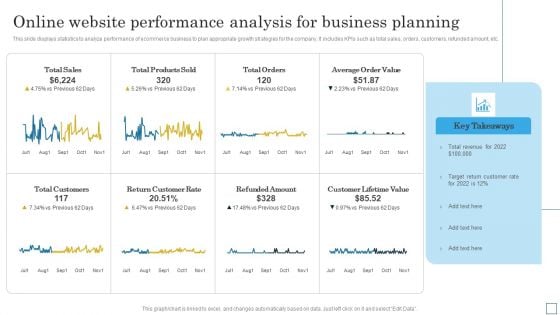
Online Website Performance Analysis For Business Planning Slides PDF
This slide displays statistics to analyze performance of ecommerce business to plan appropriate growth strategies for the company. It includes KPIs such as total sales, orders, customers, refunded amount, etc. Pitch your topic with ease and precision using this Online Website Performance Analysis For Business Planning Slides PDF. This layout presents information on Revenue, Customer Rate, Target. It is also available for immediate download and adjustment. So, changes can be made in the color, design, graphics or any other component to create a unique layout.
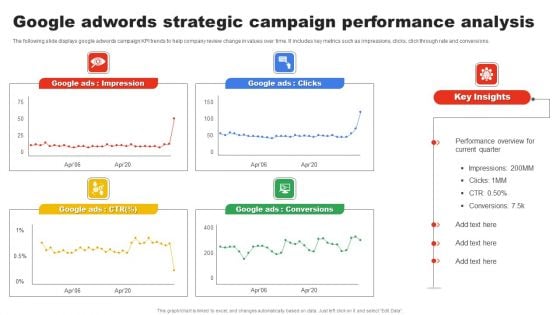
Google Adwords Strategic Campaign Performance Analysis Download PDF
The following slide displays google adwords campaign KPI trends to help company review change in values over time. It includes key metrics such as impressions, clicks, click through rate and conversions. Pitch your topic with ease and precision using this Google Adwords Strategic Campaign Performance Analysis Download PDF. This layout presents information on Google Ads Impression, Google Ads Clicks, Google Ads Conversions. It is also available for immediate download and adjustment. So, changes can be made in the color, design, graphics or any other component to create a unique layout.
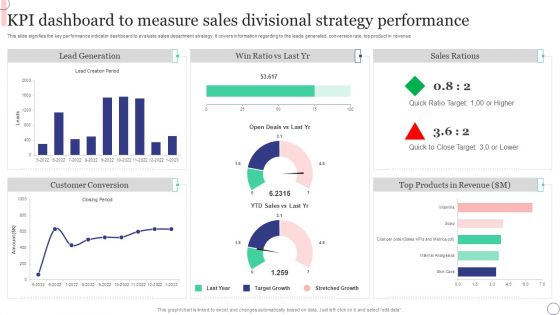
KPI Dashboard To Measure Sales Divisional Strategy Performance Microsoft PDF
This slide signifies the key performance indicator dashboard to evaluate sales department strategy. It covers information regarding to the leads generated, conversion rate, top product in revenue. Pitch your topic with ease and precision using this KPI Dashboard To Measure Sales Divisional Strategy Performance Microsoft PDF. This layout presents information on Sales Rations, Lead Generation, Customer Conversion. It is also available for immediate download and adjustment. So, changes can be made in the color, design, graphics or any other component to create a unique layout.
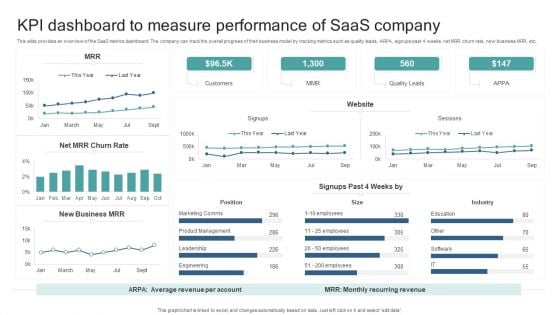
KPI Dashboard To Measure Performance Of Saas Company Introduction PDF
This slide provides an overview of the SaaS metrics dashboard. The company can track the overall progress of their business model by tracking metrics such as quality leads, ARPA, signups past 4 weeks, net MRR churn rate, new business MRR, etc. Pitch your topic with ease and precision using this KPI Dashboard To Measure Performance Of Saas Company Introduction PDF. This layout presents information on Industry, Position, Customers, Quality Leads. It is also available for immediate download and adjustment. So, changes can be made in the color, design, graphics or any other component to create a unique layout.
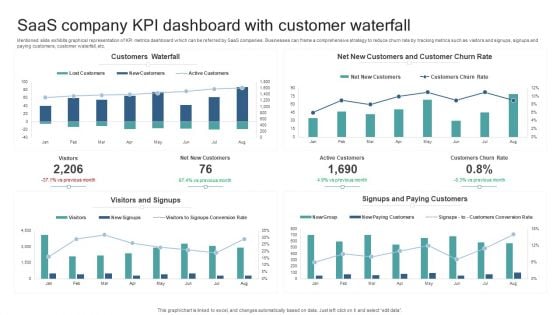
Saas Company KPI Dashboard With Customer Waterfall Slides PDF
Mentioned slide exhibits graphical representation of KPI metrics dashboard which can be referred by SaaS companies. Businesses can frame a comprehensive strategy to reduce churn rate by tracking metrics such as visitors and signups, signups and paying customers, customer waterfall, etc. Pitch your topic with ease and precision using this Saas Company KPI Dashboard With Customer Waterfall Slides PDF. This layout presents information on Customers Waterfall, Visitors And Signups, Signups And Paying Customers. It is also available for immediate download and adjustment. So, changes can be made in the color, design, graphics or any other component to create a unique layout.
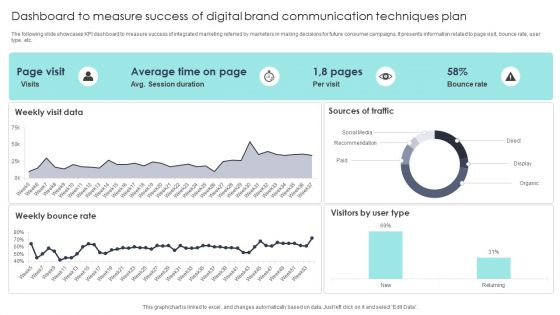
Dashboard To Measure Success Of Digital Brand Communication Techniques Plan Themes PDF
The following slide showcases KPI dashboard to measure success of integrated marketing referred by marketers in making decisions for future consumer campaigns. It presents information related to page visit, bounce rate, user type, etc. Pitch your topic with ease and precision using this Dashboard To Measure Success Of Digital Brand Communication Techniques Plan Themes PDF. This layout presents information on Sources Of Traffic, Social Media, Brand Communication Techniques Plan. It is also available for immediate download and adjustment. So, changes can be made in the color, design, graphics or any other component to create a unique layout.
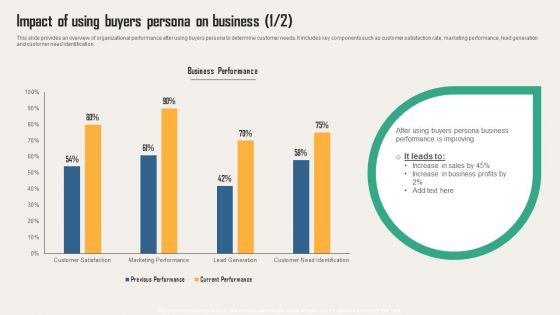
Creating Customer Personas For Customizing Impact Of Using Buyers Persona On Business Download PDF
This slide provides an overview of organizational performance after using buyers persona to determine customer needs. It includes key components such as customer satisfaction rate, marketing performance, lead generation and customer need identification. Make sure to capture your audiences attention in your business displays with our gratis customizable Creating Customer Personas For Customizing Impact Of Using Buyers Persona On Business Download PDF. These are great for business strategies, office conferences, capital raising or task suggestions. If you desire to acquire more customers for your tech business and ensure they stay satisfied, create your own sales presentation with these plain slides.
Data Expansion Trends For Global Home Ware Market Icons PDF
This slide shows data growth trends for home ware industry that presents incremental growth, CAGR and other figures etc. It include figure next year growth and incremental growth etc. Pitch your topic with ease and precision using this Data Expansion Trends For Global Home Ware Market Icons PDF. This layout presents information on Incremental Growth Figures, Growth Rate Predicted, Fragmented Market Model. It is also available for immediate download and adjustment. So, changes can be made in the color, design, graphics or any other component to create a unique layout.
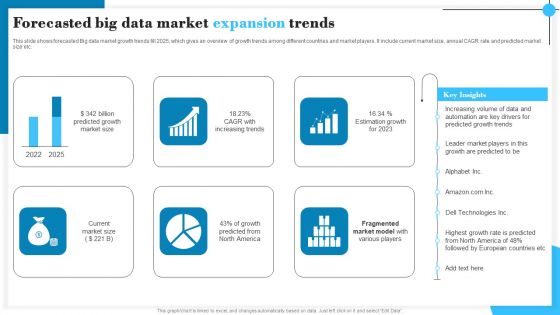
Forecasted Big Data Market Expansion Trends Download PDF
This slide shows forecasted Big data market growth trends till 2025, which gives an overview of growth trends among different countries and market players. It include current market size, annual CAGR rate and predicted market size etc. Pitch your topic with ease and precision using this Forecasted Big Data Market Expansion Trends Download PDF. This layout presents information on Billion Predicted Growth, Increasing Trends, Estimation Growth. It is also available for immediate download and adjustment. So, changes can be made in the color, design, graphics or any other component to create a unique layout.
Umbrella Branding Measures To Boost Brand Awareness Product Branding Performance Tracking Dashboard Information PDF
This slide provides information regarding product branding performance tracking dashboard in terms of revenues, new customers, customer satisfaction rate. This Umbrella Branding Measures To Boost Brand Awareness Product Branding Performance Tracking Dashboard Information PDF from Slidegeeks makes it easy to present information on your topic with precision. It provides customization options, so you can make changes to the colors, design, graphics, or any other component to create a unique layout. It is also available for immediate download, so you can begin using it right away. Slidegeeks has done good research to ensure that you have everything you need to make your presentation stand out. Make a name out there for a brilliant performance.
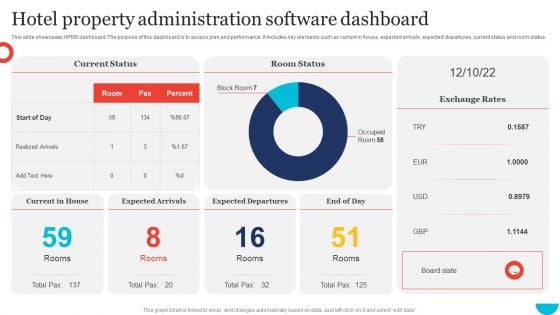
Hotel Property Administration Software Dashboard Guidelines PDF
This slide showcases HPMS dashboard. The purpose of this dashboard is to access plan and performance. It includes key elements such as current in house, expected arrivals, expected departures, current status and room status. Pitch your topic with ease and precision using this Hotel Property Administration Software Dashboard Guidelines PDF. This layout presents information on Current Status, Room Status, Exchange Rates. It is also available for immediate download and adjustment. So, changes can be made in the color, design, graphics or any other component to create a unique layout.
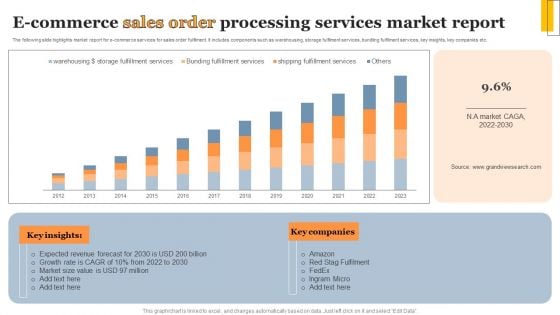
E Commerce Sales Order Processing Services Market Report Structure PDF
The following slide highlights market report for e-commerce services for sales order fulfilment. It includes components such as warehousing, storage fulfilment services, bundling fulfilment services, key insights, key companies etc. Showcasing this set of slides titled E Commerce Sales Order Processing Services Market Report Structure PDF. The topics addressed in these templates are Expected Revenue Forecast, Growth Rate, Market Size Value. All the content presented in this PPT design is completely editable. Download it and make adjustments in color, background, font etc. as per your unique business setting.
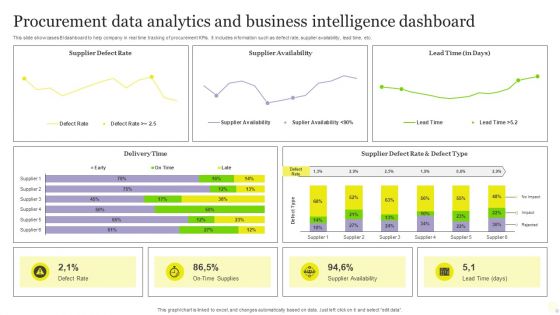
Procurement Data Analytics And Business Intelligence Dashboard Pictures PDF
This slide showcases BI dashboard to help company in real time tracking of procurement KPIs. It includes information such as defect rate, supplier availability, lead time, etc. Pitch your topic with ease and precision using this Procurement Data Analytics And Business Intelligence Dashboard Pictures PDF. This layout presents information on Procurement Data Analytics, Business Intelligence Dashboard. It is also available for immediate download and adjustment. So, changes can be made in the color, design, graphics or any other component to create a unique layout.
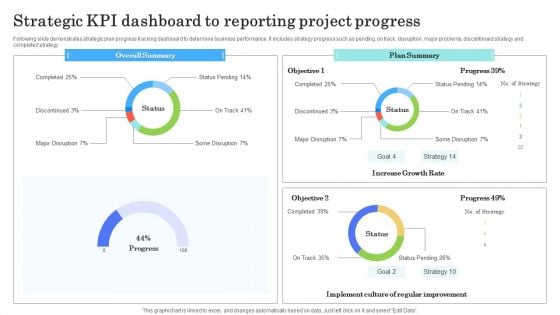
Strategic Kpi Dashboard To Reporting Project Progress Sample PDF
Following slide demonstrates strategic plan progress tracking dashboard to determine business performance. It includes strategy progress such as pending, on track, disruption, major problems, discontinued strategy and completed strategy Pitch your topic with ease and precision using this Strategic Kpi Dashboard To Reporting Project Progress Sample PDF. This layout presents information on Overall Summary, Plan Summary, Growth Rate. It is also available for immediate download and adjustment. So, changes can be made in the color, design, graphics or any other component to create a unique layout.
Application Performance Dashboard Ppt Icon Template PDF
This slide covers application performance in market KPIs and metrics such as impressions, clicks, searches for app, conversion rate etc. This Application Performance Dashboard Ppt Icon Template PDF from Slidegeeks makes it easy to present information on your topic with precision. It provides customization options, so you can make changes to the colors, design, graphics, or any other component to create a unique layout. It is also available for immediate download, so you can begin using it right away. Slidegeeks has done good research to ensure that you have everything you need to make your presentation stand out. Make a name out there for a brilliant performance.
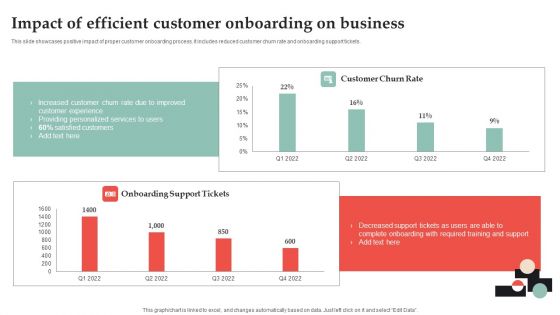
Customer Onboarding Journey Optimization Plan Impact Of Efficient Customer Graphics PDF
This slide showcases positive impact of proper customer onboarding process. It includes reduced customer churn rate and onboarding support tickets. This Customer Onboarding Journey Optimization Plan Impact Of Efficient Customer Graphics PDF from Slidegeeks makes it easy to present information on your topic with precision. It provides customization options, so you can make changes to the colors, design, graphics, or any other component to create a unique layout. It is also available for immediate download, so you can begin using it right away. Slidegeeks has done good research to ensure that you have everything you need to make your presentation stand out. Make a name out there for a brilliant performance.
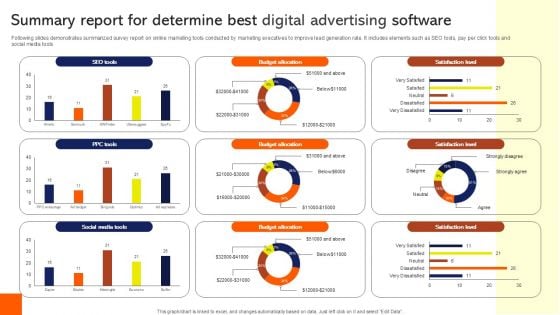
Summary Report For Determine Best Digital Advertising Software Survey SS
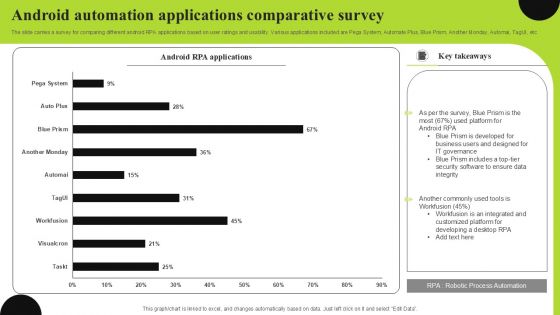
Android Automation Applications Comparative Survey Pictures PDF
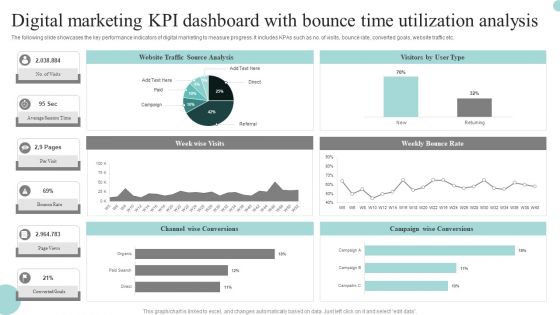
Digital Marketing Kpi Dashboard With Bounce Time Utilization Analysis Graphics PDF
The following slide showcases the key performance indicators of digital marketing to measure progress. It includes KPAs such as no. of visits, bounce rate, converted goals, website traffic etc. Pitch your topic with ease and precision using this Digital Marketing Kpi Dashboard With Bounce Time Utilization Analysis Graphics PDF. This layout presents information on Digital Marketing, KPI Dashboard, Bounce Time Utilization Analysis. It is also available for immediate download and adjustment. So, changes can be made in the color, design, graphics or any other component to create a unique layout.

IT Cyber Threat Prevention Technology Market Topics PDF
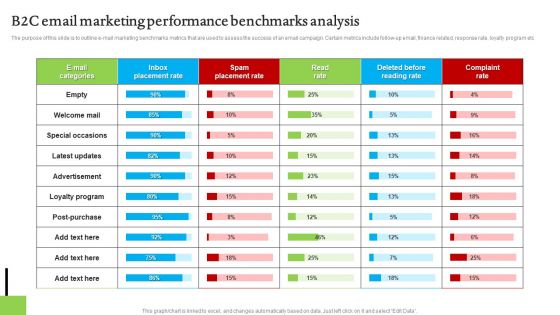
B2C Email Marketing Performance Benchmarks Analysis Topics PDF
The purpose of this slide is to outline e-mail marketing benchmarks metrics that are used to assess the success of an email campaign. Certain metrics include follow-up email, finance related, response rate, loyalty program etc. Pitch your topic with ease and precision using this B2C Email Marketing Performance Benchmarks Analysis Topics PDF. This layout presents information on Advertisement, Loyalty Program, Performance Benchmarks Analysis. It is also available for immediate download and adjustment. So, changes can be made in the color, design, graphics or any other component to create a unique layout.
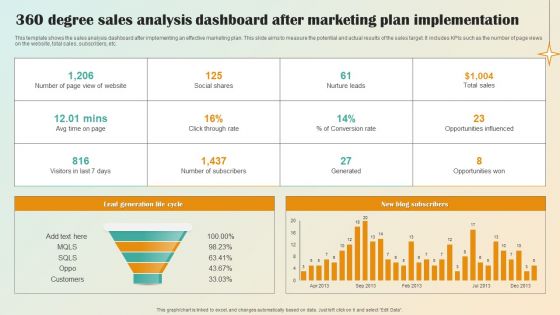
360 Degree Sales Analysis Dashboard After Marketing Plan Implementation Pictures PDF
This template shows the sales analysis dashboard after implementing an effective marketing plan. This slide aims to measure the potential and actual results of the sales target. It includes KPIs such as the number of page views on the website, total sales, subscribers, etc.Pitch your topic with ease and precision using this 360 Degree Sales Analysis Dashboard After Marketing Plan Implementation Pictures PDF. This layout presents information on Lead Generation Life, Conversion Rate. It is also available for immediate download and adjustment. So, changes can be made in the color, design, graphics or any other component to create a unique layout.
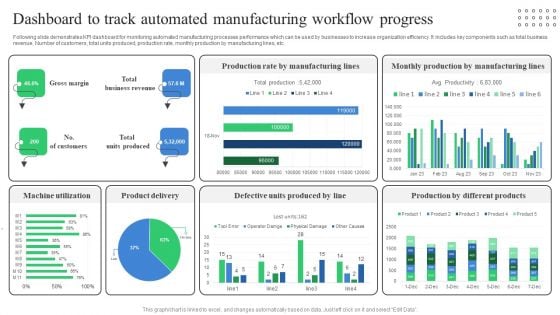
Dashboard To Track Automated Manufacturing Workflow Progress Professional PDF
Following slide demonstrates KPI dashboard for monitoring automated manufacturing processes performance which can be used by businesses to increase organization efficiency. It includes key components such as total business revenue, Number of customers, total units produced, production rate, monthly production by manufacturing lines, etc. Showcasing this set of slides titled Dashboard To Track Automated Manufacturing Workflow Progress Professional PDF. The topics addressed in these templates are Machine Utilization, Product Delivery, Defective Units Produced. All the content presented in this PPT design is completely editable. Download it and make adjustments in color, background, font etc. as per your unique business setting.
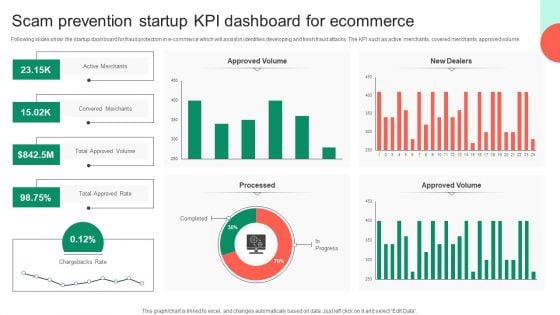
Scam Prevention Startup KPI Dashboard For Ecommerce Themes PDF
Following slides show the startup dashboard for fraud protection in e-commerce which will assist in identifies developing and fresh fraud attacks. The KPI such as active merchants, covered merchants, approved volume. Pitch your topic with ease and precision using this Scam Prevention Startup KPI Dashboard For Ecommerce Themes PDF. This layout presents information on Approved Volume, Chargebacks Rate, Kpi Dashboard For Ecommerce. It is also available for immediate download and adjustment. So, changes can be made in the color, design, graphics or any other component to create a unique layout.
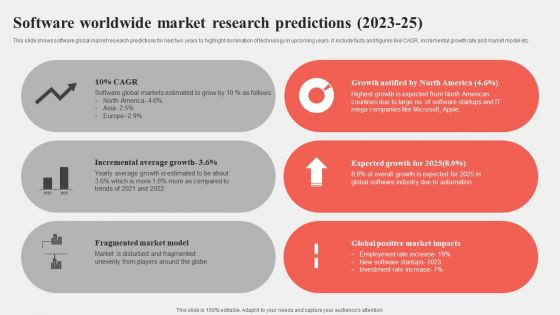
Software Worldwide Market Research Predictions 2023 25 Graphics PDF
This slide shows software global market research predictions for next two years to highlight domination of technology in upcoming years. It include facts and figures like CAGR, incremental growth rate and market model etc Pitch your topic with ease and precision using this Software Worldwide Market Research Predictions 2023 25 Graphics PDF. This layout presents information on Average Growth, Market Model, Market Impacts. It is also available for immediate download and adjustment. So, changes can be made in the color, design, graphics or any other component to create a unique layout.
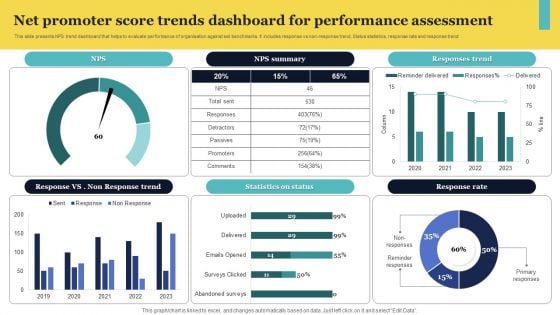
Net Promoter Score Trends Dashboard For Performance Assessment Elements PDF
This slide presents NPS trend dashboard that helps to evaluate performance of organisation against set benchmarks. It includes response vs non-response trend, Status statistics, response rate and response trend Pitch your topic with ease and precision using this Net Promoter Score Trends Dashboard For Performance Assessment Elements PDF. This layout presents information on Response Trend, Summary, Status. It is also available for immediate download and adjustment. So, changes can be made in the color, design, graphics or any other component to create a unique layout.
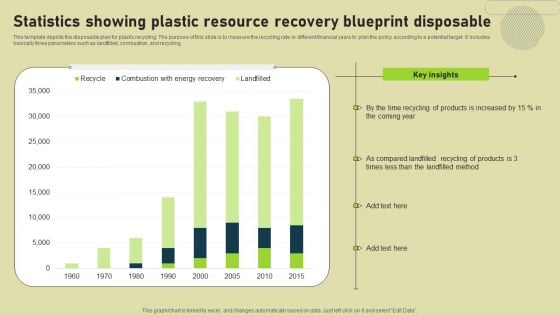
Statistics Showing Plastic Resource Recovery Blueprint Disposable Elements PDF
This template depicts the disposable plan for plastic recycling. The purpose of this slide is to measure the recycling rate in different financial years to plan the policy according to a potential target. It includes basically three parameters such as landfilled, combustion, and recycling. Pitch your topic with ease and precision using this Statistics Showing Plastic Resource Recovery Blueprint Disposable Elements PDF. This layout presents information on Products, Key Insights, Resource Recovery Blueprint Disposable. It is also available for immediate download and adjustment. So, changes can be made in the color, design, graphics or any other component to create a unique layout.
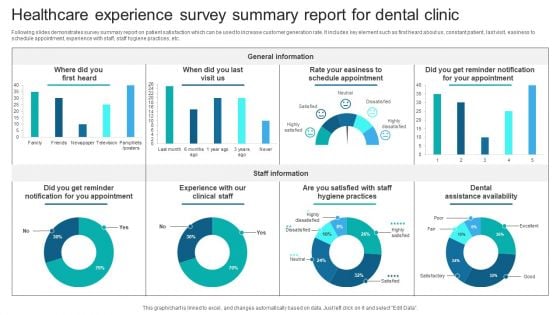
Healthcare Experience Survey Summary Report For Dental Clinic Survey SS
Following slides demonstrates survey summary report on patient satisfaction which can be used to increase customer generation rate. It includes key element such as first heard about us, constant patient, last visit, easiness to schedule appointment, experience with staff, staff hygiene practices, etc. Pitch your topic with ease and precision using this Healthcare Experience Survey Summary Report For Dental Clinic Survey SS. This layout presents information on General Information, Staff Information, Easiness To Schedule Appointment, Dental Assistance Availability, Staff Hygiene Practices. It is also available for immediate download and adjustment. So, changes can be made in the color, design, graphics or any other component to create a unique layout.


 Continue with Email

 Home
Home


