Price Comparison
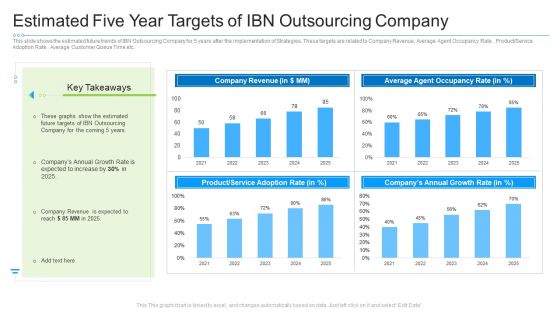
Estimated Five Year Targets Of Ibn Outsourcing Company Professional PDF
This slide shows the estimated future trends of IBN Outsourcing Company for 5 years after the implementation of Strategies. These targets are related to Company Revenue, Average Agent Occupancy Rate , Product or Service Adoption Rate , Average Customer Queue Time etc. Deliver an awe-inspiring pitch with this creative estimated five year targets of ibn outsourcing company professional pdf. bundle. Topics like company revenue, annual growth rate, outsourcing can be discussed with this completely editable template. It is available for immediate download depending on the needs and requirements of the user.
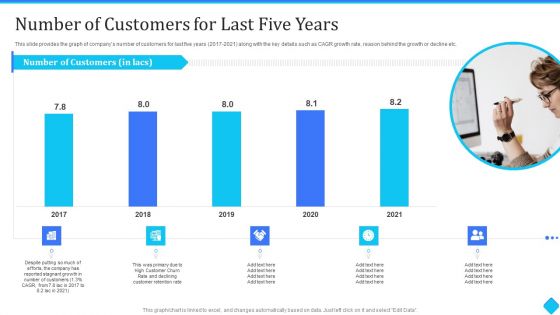
User Onboarding Process Development Number Of Customers For Last Five Years Rules PDF
This slide provides the graph of companys number of customers for last five years 2017-2021 along with the key details such as CAGR growth rate, reason behind the growth or decline etc. Deliver an awe-inspiring pitch with this creative User Onboarding Process Development Number Of Customers For Last Five Years Rules PDF bundle. Topics like customer churn rate, customer retention rate, growth can be discussed with this completely editable template. It is available for immediate download depending on the needs and requirements of the user.
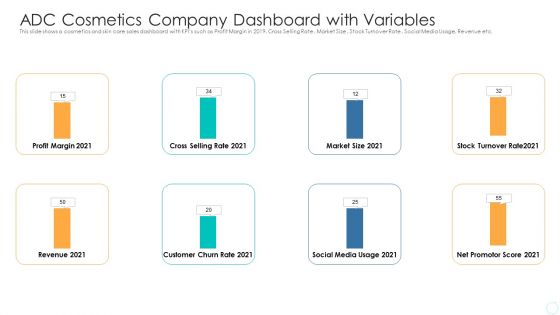
ADC Cosmetics Company Dashboard With Variables Formats PDF
This slide shows a cosmetics and skin care sales dashboard with KPIs such as Profit Margin in 2021, Cross Selling Rate , Market Size, Stock Turnover Rate , Social Media Usage, Revenue etc. Deliver an awe-inspiring pitch with this creative adc cosmetics company dashboard with variables formats pdf bundle. Topics like profit margin, cross selling rate, market size, revenue, social media can be discussed with this completely editable template. It is available for immediate download depending on the needs and requirements of the user.
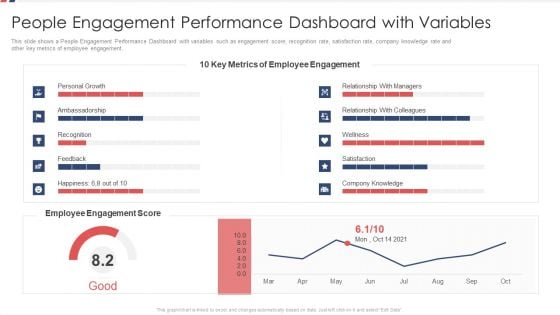
People Engagement Performance Dashboard With Variables Ppt Gallery Example File PDF
This slide shows a People Engagement Performance Dashboard with variables such as engagement score, recognition rate, satisfaction rate, company knowledge rate and other key metrics of employee engagement. Deliver and pitch your topic in the best possible manner with this people engagement performance dashboard with variables ppt gallery example file pdf. Use them to share invaluable insights on personal growth, employee engagement score, employee engagement metrics and impress your audience. This template can be altered and modified as per your expectations. So, grab it now.
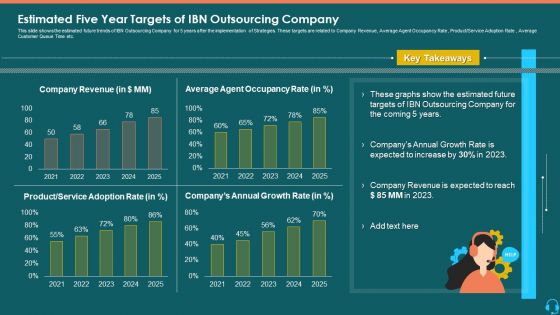
Estimated Five Year Targets Of IBN Outsourcing Company Designs PDF
This slide shows the estimated future trends of IBN Outsourcing Company for 5 years after the implementation of Strategies. These targets are related to Company Revenue, Average Agent Occupancy Rate, Product or Service Adoption Rate , Average Customer Queue Time etc. Deliver an awe-inspiring pitch with this creative estimated five year targets of ibn outsourcing company designs pdf bundle. Topics like company revenue, product, service adoption rate can be discussed with this completely editable template. It is available for immediate download depending on the needs and requirements of the user.
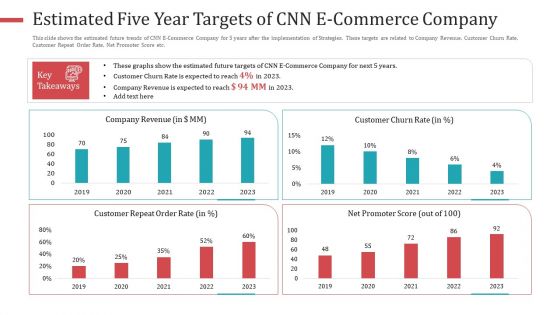
Estimated Five Year Targets Of CNN E Commerce Company Diagrams PDF
This slide shows the estimated future trends of CNN E Commerce Company for 5 years after the implementation of Strategies. These targets are related to Company Revenue, Customer Churn Rate, Customer Repeat Order Rate, Net Promoter Score etc. Deliver and pitch your topic in the best possible manner with this estimated five year targets of CNN e commerce company diagrams pdf. Use them to share invaluable insights on company revenue, customer repeat order rate, net promoter score, 2019 to 2023 and impress your audience. This template can be altered and modified as per your expectations. So, grab it now.
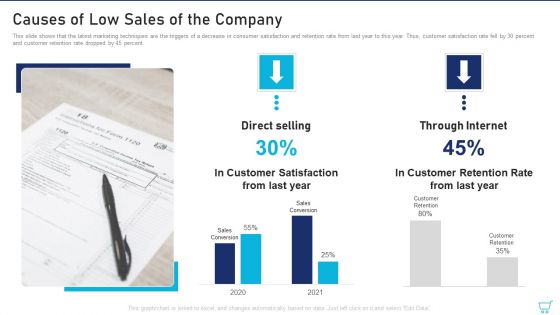
Causes Of Low Sales Of The Company Ppt Layouts Show PDF
This slide shows that the latest marketing techniques are the triggers of a decrease in consumer satisfaction and retention rate from last year to this year. Thus, customer satisfaction rate fell by 30 percent and customer retention rate dropped by 45 percent. Deliver an awe inspiring pitch with this creative causes of low sales of the company ppt layouts show pdf bundle. Topics like customer retention, direct selling, customer satisfaction can be discussed with this completely editable template. It is available for immediate download depending on the needs and requirements of the user.
Experiential Retail Plan Tracking Essential Retail Store Activities Dashboard Retention Information PDF
This slide provides details regarding the dashboard for tracking retail store activities in terms of customer retention, rate of return, volume sales, etc. Deliver an awe inspiring pitch with this creative experiential retail plan tracking essential retail store activities dashboard retention information pdf bundle. Topics like rate of return, rate of return by category, customer retention, number of new and returning customers can be discussed with this completely editable template. It is available for immediate download depending on the needs and requirements of the user.
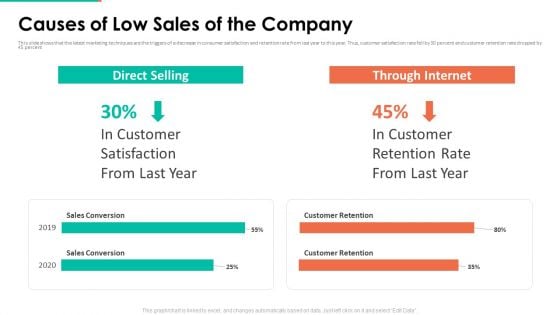
Upselling Technique Additional Product Causes Of Low Sales Of The Company Inspiration PDF
This slide shows that the latest marketing techniques are the triggers of a decrease in consumer satisfaction and retention rate from last year to this year. Thus, customer satisfaction rate fell by 30 percent and customer retention rate dropped by 45 percent Deliver and pitch your topic in the best possible manner with this upselling technique additional product causes of low sales of the company inspiration pdf. Use them to share invaluable insights on customer, satisfaction, direct selling and impress your audience. This template can be altered and modified as per your expectations. So, grab it now.
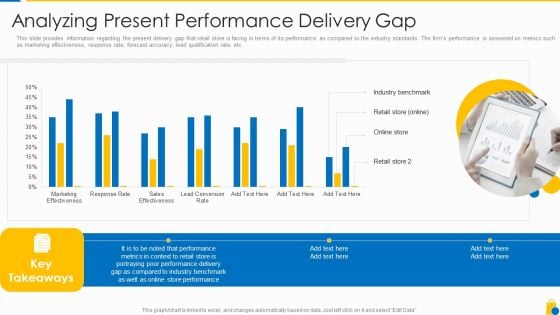
Retailing Approaches For Excellent End User Engagement And Experiences Analyzing Present Performance Delivery Gap Information PDF
This slide provides information regarding the present delivery gap that retail store is facing in terms of its performance as compared to the industry standards. The firms performance is assessed on metrics such as marketing effectiveness, response rate, forecast accuracy, lead qualification rate, etc. Deliver an awe inspiring pitch with this creative retailing approaches for excellent end user engagement and experiences analyzing present performance delivery gap information pdf bundle. Topics like marketing effectiveness, sales effectiveness, lead conversion rate can be discussed with this completely editable template. It is available for immediate download depending on the needs and requirements of the user.
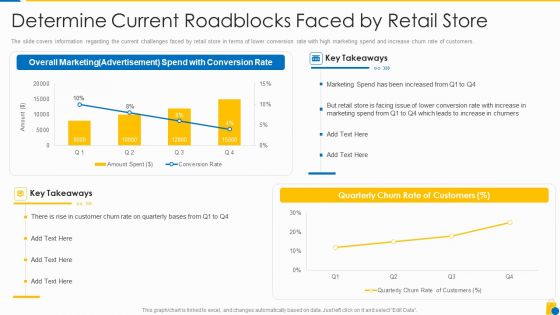
Retailing Approaches For Excellent End User Engagement And Experiences Determine Current Slides PDF
The slide covers information regarding the current challenges faced by retail store in terms of lower conversion rate with high marketing spend and increase churn rate of customers. Deliver an awe inspiring pitch with this creative retailing approaches for excellent end user engagement and experiences determine current slides pdf bundle. Topics like overall marketing, quarterly churn rate, retail store is facing can be discussed with this completely editable template. It is available for immediate download depending on the needs and requirements of the user.
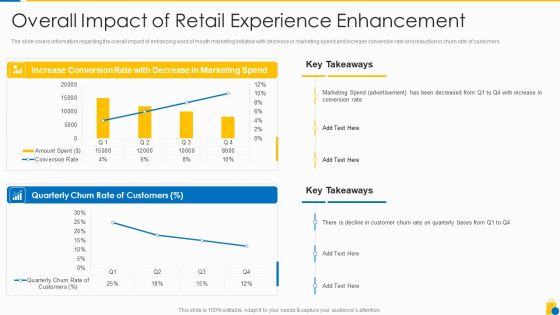
Retailing Approaches For Excellent End User Engagement And Experiences Overall Impact Graphics PDF
The slide covers information regarding the overall impact of enhancing word of mouth marketing initiative with decrease in marketing spend and increase conversion rate and reduction in churn rate of customers.Deliver an awe inspiring pitch with this creative retailing approaches for excellent end user engagement and experiences overall impact graphics pdf bundle. Topics like increase conversion, decrease in marketing spend, quarterly churn rate can be discussed with this completely editable template. It is available for immediate download depending on the needs and requirements of the user.
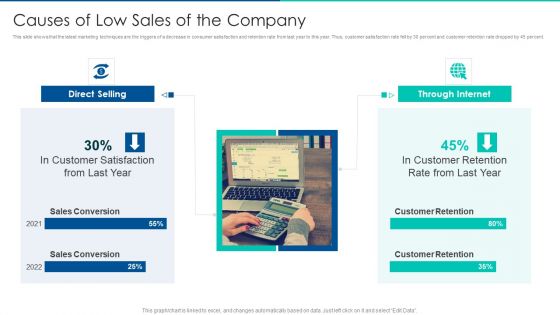
Sales Promotion Of Upgraded Product Through Upselling Causes Of Low Sales Of The Company Infographics PDF
This slide shows that the latest marketing techniques are the triggers of a decrease in consumer satisfaction and retention rate from last year to this year. Thus, customer satisfaction rate fell by 30 percent and customer retention rate dropped by 45 percent. Deliver an awe inspiring pitch with this creative sales promotion of upgraded product through upselling causes of low sales of the company infographics pdf bundle. Topics like direct selling, through internet can be discussed with this completely editable template. It is available for immediate download depending on the needs and requirements of the user.

Quality Assurance Model For Agile IT Forecasted Impact Of Adopting Agile Model Themes PDF
Mentioned slide portrays forecasted companys project success rate after adopting agile mode. Here the graph indicates that success rate will get increased to 73 percent in 2023. Deliver and pitch your topic in the best possible manner with this quality assurance model for agile it forecasted impact of adopting agile model themes pdf. Use them to share invaluable insights on success rate, it project, 2022 to 2023 and impress your audience. This template can be altered and modified as per your expectations. So, grab it now.

Actively Influencing Customers Analyzing Present Performance Delivery Gap Inspiration PDF
This slide provides information regarding the present delivery gap that firm is facing in terms of its performance as compared to the industry standards. The firms performance is assessed on metrics such as marketing effectiveness, response rate, forecast accuracy, lead qualification rate, etc. Deliver an awe inspiring pitch with this creative Actively Influencing Customers Analyzing Present Performance Delivery Gap Inspiration PDF bundle. Topics like Performance Metrics, Marketing Effectiveness, Response Rate, Sales Effectiveness can be discussed with this completely editable template. It is available for immediate download depending on the needs and requirements of the user.
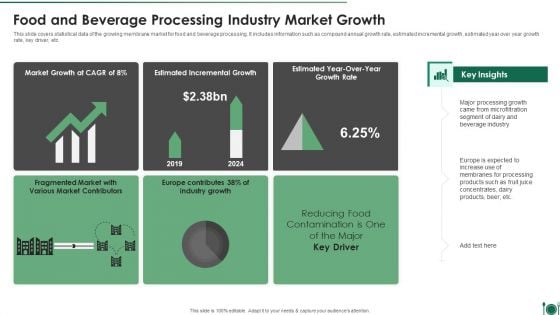
Food And Beverage Processing Industry Market Growth Themes PDF
This slide covers statistical data of the growing membrane market for food and beverage processing. It includes information such as compound annual growth rate, estimated incremental growth, estimated year over year growth rate, key driver, etc. Showcasing this set of slides titled Food And Beverage Processing Industry Market Growth Themes PDF. The topics addressed in these templates are Market Growth, Estimated Incremental Growth, Growth Rate. All the content presented in this PPT design is completely editable. Download it and make adjustments in color, background, font etc. as per your unique business setting.
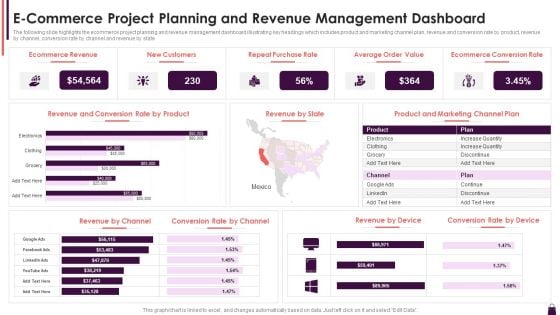
E Commerce Project Planning And Revenue Management Dashboard Introduction PDF
The following slide highlights the ecommerce project planning and revenue management dashboard illustrating key headings which includes product and marketing channel plan, revenue and conversion rate by product, revenue by channel, conversion rate by channel and revenue by state. Showcasing this set of slides titled E Commerce Project Planning And Revenue Management Dashboard Introduction PDF. The topics addressed in these templates are New Customers, Ecommerce Revenue, Repeat Purchase Rate. All the content presented in this PPT design is completely editable. Download it and make adjustments in color, background, font etc. as per your unique business setting.
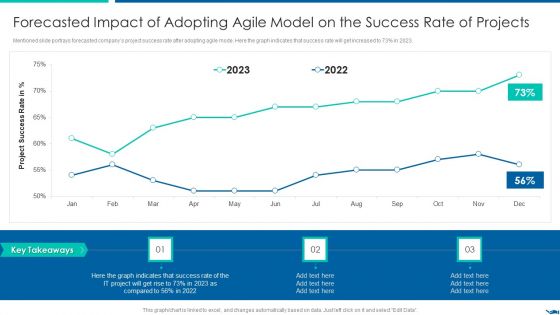
Project QA Through Agile Methodology IT Forecasted Impact Of Adopting Agile Model Microsoft PDF
Mentioned slide portrays forecasted companys project success rate after adopting agile mode. Here the graph indicates that success rate will get increased to 73percent in 2023.Deliver an awe inspiring pitch with this creative Project QA Through Agile Methodology IT Forecasted Impact Of Adopting Agile Model Microsoft PDF bundle. Topics like Forecasted Impact Of Adopting Agile Model On The Success Rate Of Projects can be discussed with this completely editable template. It is available for immediate download depending on the needs and requirements of the user.
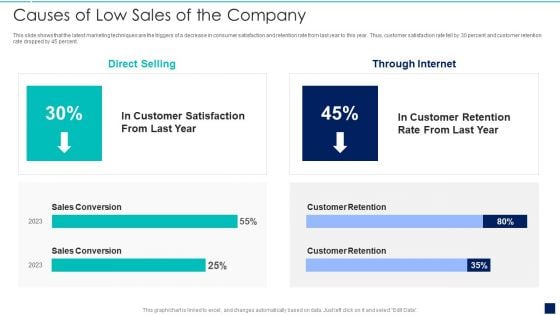
Influence Buyers To Purchase Additional High Causes Of Low Sales Of The Company Topics PDF
This slide shows that the latest marketing techniques are the triggers of a decrease in consumer satisfaction and retention rate from last year to this year. Thus, customer satisfaction rate fell by 30 percent and customer retention rate dropped by 45 percent.Deliver an awe inspiring pitch with this creative Influence Buyers To Purchase Additional High Causes Of Low Sales Of The Company Topics PDF bundle. Topics like Sales Conversion, Customer Retention, Direct Selling can be discussed with this completely editable template. It is available for immediate download depending on the needs and requirements of the user.
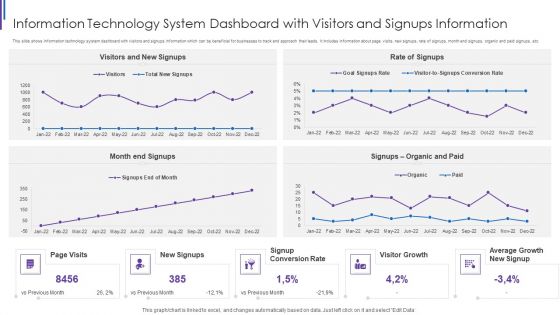
Information Technology System Dashboard With Visitors And Signups Information Guidelines PDF
This slide shows information technology system dashboard with visitors and signups information which can be beneficial for businesses to track and approach their leads. It includes information about page visits, new signups, rate of signups, month end signups, organic and paid signups, etc. Showcasing this set of slides titled Information Technology System Dashboard With Visitors And Signups Information Guidelines PDF. The topics addressed in these templates are Rate Of Signups, Month End Signups, Signup Conversion Rate, Visitors And New. All the content presented in this PPT design is completely editable. Download it and make adjustments in color, background, font etc. as per your unique business setting.
Essential Merchandise Store Activities Tracking Dashboard Merchandise Playbook Topics PDF
This slide provides details regarding the dashboard for tracking retail store activities in terms of customer retention, rate of return, volume sales, rate of return, number of new and returning customers, etc. Deliver an awe inspiring pitch with this creative Essential Merchandise Store Activities Tracking Dashboard Merchandise Playbook Topics PDF bundle. Topics like Rate Return Customer, Customer Retention Number, New And Returning can be discussed with this completely editable template. It is available for immediate download depending on the needs and requirements of the user.
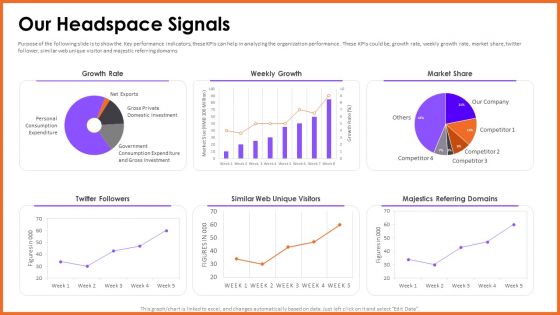
Headspace Fund Raising Pitch Deck Our Headspace Signals Microsoft PDF
Purpose of the following slide is to show the Key performance indicators, these KPIs can help in analyzing the organization performance . These KPIs could be growth rate, weekly growth rate, market share, twitter follower, similar web unique visitor and majestic referring domains.Deliver and pitch your topic in the best possible manner with this Headspace Fund Raising Pitch Deck Our Headspace Signals Microsoft PDF. Use them to share invaluable insights on Growth Rate, Weekly Growth, Referring Domains and impress your audience. This template can be altered and modified as per your expectations. So, grab it now.
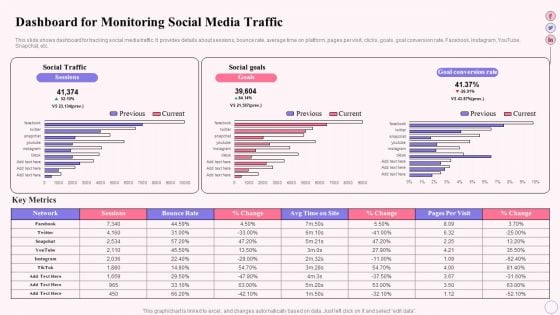
Integrating Social Media Tactics Dashboard For Monitoring Social Media Traffic Ideas PDF
This slide shows dashboard for tracking social media traffic. It provides details about sessions, bounce rate, average time on platform, pages per visit, clicks, goals, goal conversion rate, Facebook, Instagram, YouTube, Snapchat, etc. Deliver and pitch your topic in the best possible manner with this Integrating Social Media Tactics Dashboard For Monitoring Social Media Traffic Ideas PDF. Use them to share invaluable insights on Social Traffic, Social Goals, Goal Conversion Rate and impress your audience. This template can be altered and modified as per your expectations. So, grab it now.
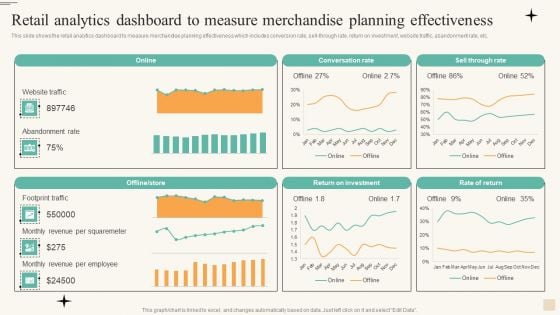
Retail Analytics Dashboard To Measure Merchandise Planning Effectiveness Microsoft PDF
This slide shows the retail analytics dashboard to measure merchandise planning effectiveness which includes conversion rate, sell through rate, return on investment, website traffic, abandonment rate, etc. Make sure to capture your audiences attention in your business displays with our gratis customizable Retail Analytics Dashboard To Measure Merchandise Planning Effectiveness Microsoft PDF. These are great for business strategies, office conferences, capital raising or task suggestions. If you desire to acquire more customers for your tech business and ensure they stay satisfied, create your own sales presentation with these plain slides.
Survey Report On Global Voluntary Attrition Tracking By Function Background PDF
This slide depicts survey outcomes on turnover rates based on different functions. It includes survey based on multiple functions such as IT, legal, R and D, public sector, customer support, marketing, HR, sales and finance. along with overall global rates. Showcasing this set of slides titled Survey Report On Global Voluntary Attrition Tracking By Function Background PDF. The topics addressed in these templates are Finance Function, Global Turnover Rates. All the content presented in this PPT design is completely editable. Download it and make adjustments in color, background, font etc. as per your unique business setting.
Dashboard For Tracking Website Performance Consumer Contact Point Guide Brochure PDF
This slide covers the KPI dashboard for analyzing the company website. It includes metrics such as conversions, conversion rate, sessions, stickiness, bounce rate, engagement, etc. Slidegeeks has constructed Dashboard For Tracking Website Performance Consumer Contact Point Guide Brochure PDF after conducting extensive research and examination. These presentation templates are constantly being generated and modified based on user preferences and critiques from editors. Here, you will find the most attractive templates for a range of purposes while taking into account ratings and remarks from users regarding the content. This is an excellent jumping-off point to explore our content and will give new users an insight into our top-notch PowerPoint Templates.
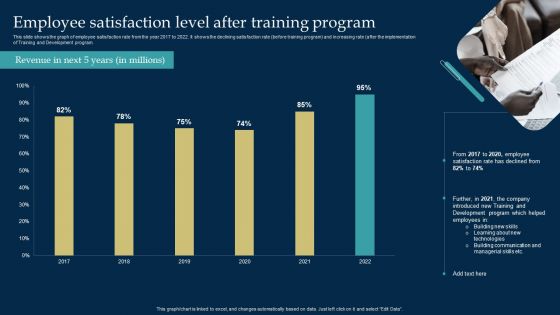
Employee Training And Development Strategy Employee Satisfaction Level After Training Program Rules PDF
This slide shows the graph of employee satisfaction rate from the year 2017 to 2022. It shows the declining satisfaction rate before training program and increasing rate after the implementation of Training and Development program. There are so many reasons you need a Employee Training And Development Strategy Employee Satisfaction Level After Training Program Rules PDF. The first reason is you can not spend time making everything from scratch, Thus, Slidegeeks has made presentation templates for you too. You can easily download these templates from our website easily.
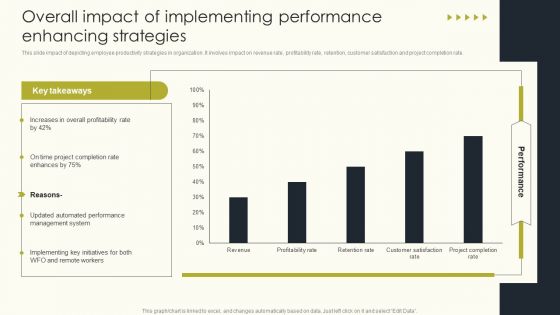
Overall Impact Of Implementing Performance Enhancing Strategies Employee Performance Formats PDF
This slide impact of depicting employee productivity strategies in organization. It involves impact on revenue rate, profitability rate, retention, customer satisfaction and project completion rate. Boost your pitch with our creative Overall Impact Of Implementing Performance Enhancing Strategies Employee Performance Formats PDF. Deliver an awe-inspiring pitch that will mesmerize everyone. Using these presentation templates you will surely catch everyones attention. You can browse the ppts collection on our website. We have researchers who are experts at creating the right content for the templates. So you do not have to invest time in any additional work. Just grab the template now and use them.

Email Marketing Campaign Outcomes Results And Campaign Performance Dashboard Slides PDF
This slide covers the dashboard for analyzing the results of email campaign. It includes information related to the emails sent, delivery rate, click rate, etc. Showcasing this set of slides titled Email Marketing Campaign Outcomes Results And Campaign Performance Dashboard Slides PDF. The topics addressed in these templates are Opens And Clicks Rates, Other Information, Bounces . All the content presented in this PPT design is completely editable. Download it and make adjustments in color, background, font etc. as per your unique business setting.
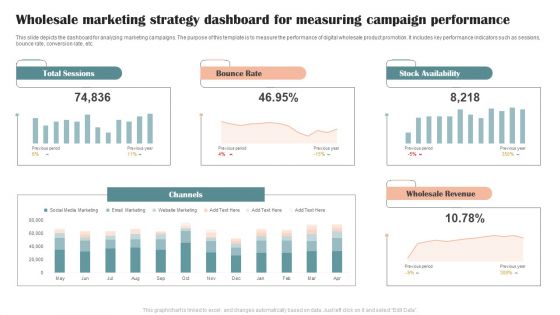
Wholesale Marketing Strategy Dashboard For Measuring Campaign Performance Graphics PDF
This slide depicts the dashboard for analyzing marketing campaigns. The purpose of this template is to measure the performance of digital wholesale product promotion. It includes key performance indicators such as sessions, bounce rate, conversion rate, etc. Showcasing this set of slides titled Wholesale Marketing Strategy Dashboard For Measuring Campaign Performance Graphics PDF. The topics addressed in these templates are Total Sessions, Bounce Rate, Stock Availability. All the content presented in this PPT design is completely editable. Download it and make adjustments in color, background, font etc. as per your unique business setting.
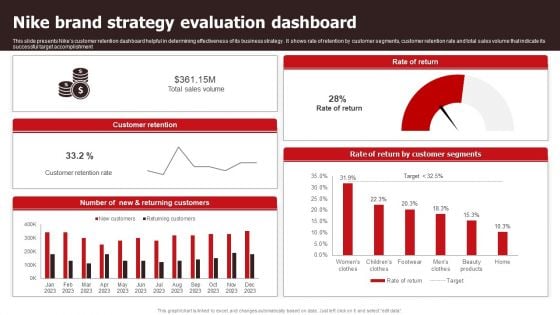
Nike Brand Strategy Evaluation Dashboard Sample PDF
This slide presents Nikes customer retention dashboard helpful in determining effectiveness of its business strategy . It shows rate of retention by customer segments, customer retention rate and total sales volume that indicate its successful target accomplishment. Showcasing this set of slides titled Nike Brand Strategy Evaluation Dashboard Sample PDF. The topics addressed in these templates are Sales Volume, Customer Retention Rate . All the content presented in this PPT design is completely editable. Download it and make adjustments in color, background, font etc. as per your unique business setting.
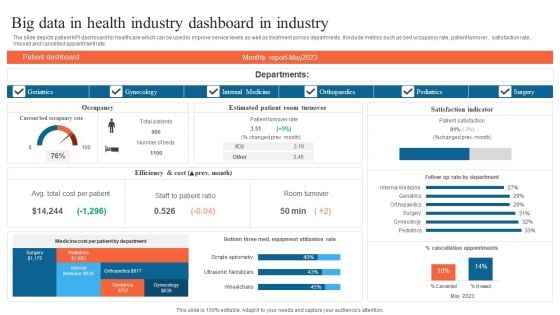
Big Data In Health Industry Dashboard In Industry Summary PDF
The slide depicts patient KPI dashboard for healthcare which can be used to improve service levels as well as treatment across departments. It include metrics such as bed occupancy rate, patient turnover, satisfaction rate, missed and cancelled appointment rate. Showcasing this set of slides titled Big Data In Health Industry Dashboard In Industry Summary PDF. The topics addressed in these templates are Geriatrics, Gynecology, Internal Medicine. All the content presented in this PPT design is completely editable. Download it and make adjustments in color, background, font etc. as per your unique business setting.
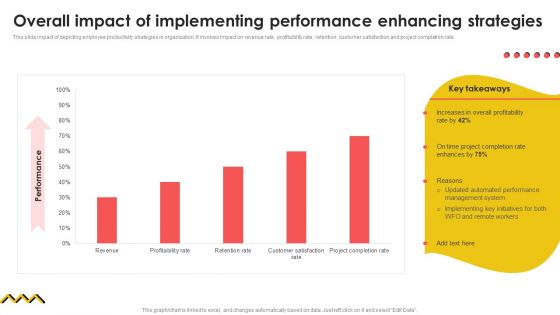
Overall Impact Of Implementing Performance Enhancing Strategies Summary PDF
This slide impact of depicting employee productivity strategies in organization. It involves impact on revenue rate, profitability rate, retention, customer satisfaction and project completion rate. Take your projects to the next level with our ultimate collection of Overall Impact Of Implementing Performance Enhancing Strategies Summary PDF. Slidegeeks has designed a range of layouts that are perfect for representing task or activity duration, keeping track of all your deadlines at a glance. Tailor these designs to your exact needs and give them a truly corporate look with your own brand colors they will make your projects stand out from the rest.
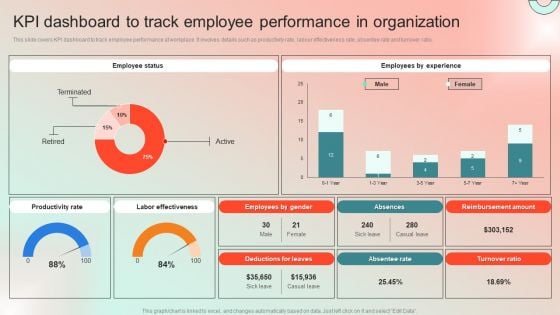
KPI Dashboard To Track Employee Performance In Organization Demonstration PDF
This slide covers KPI dashboard to track employee performance at workplace. It involves details such as productivity rate, labour effectiveness rate, absentee rate and turnover ratio. Take your projects to the next level with our ultimate collection of KPI Dashboard To Track Employee Performance In Organization Demonstration PDF. Slidegeeks has designed a range of layouts that are perfect for representing task or activity duration, keeping track of all your deadlines at a glance. Tailor these designs to your exact needs and give them a truly corporate look with your own brand colors they will make your projects stand out from the rest.
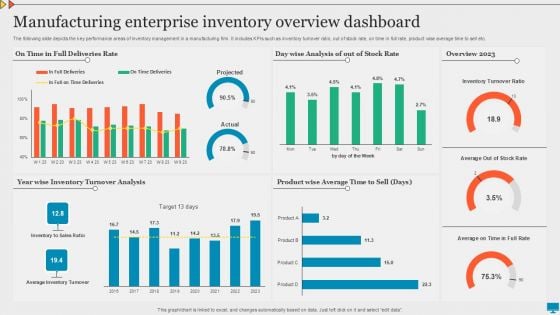
Manufacturing Enterprise Inventory Overview Dashboard Graphics PDF
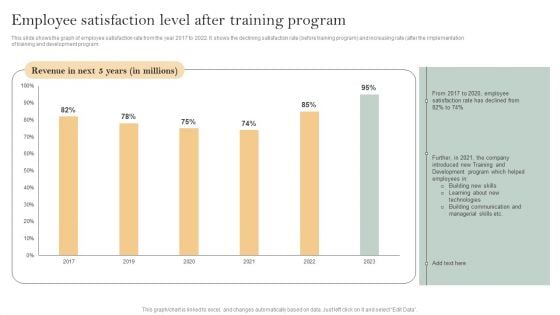
Skill Enhancement Plan Employee Satisfaction Level After Training Program Guidelines PDF
This slide shows the graph of employee satisfaction rate from the year 2017 to 2022. It shows the declining satisfaction rate before training program and increasing rate after the implementation of training and development program. If your project calls for a presentation, then Slidegeeks is your go-to partner because we have professionally designed, easy-to-edit templates that are perfect for any presentation. After downloading, you can easily edit Skill Enhancement Plan Employee Satisfaction Level After Training Program Guidelines PDF and make the changes accordingly. You can rearrange slides or fill them with different images. Check out all the handy templates
Optimizing Consumer Lead Nurturing Procedure Lead Generation Dashboard For Tracking Introduction PDF
This slide covers the KPI dashboard for tracking lead conversion rates. It includes metrics such as visitors, average session rate, per visit, bounce rate, page views, etc. Create an editable Optimizing Consumer Lead Nurturing Procedure Lead Generation Dashboard For Tracking Introduction PDF that communicates your idea and engages your audience. Whether youre presenting a business or an educational presentation, pre designed presentation templates help save time. Optimizing Consumer Lead Nurturing Procedure Lead Generation Dashboard For Tracking Introduction PDF is highly customizable and very easy to edit, covering many different styles from creative to business presentations. Slidegeeks has creative team members who have crafted amazing templates. So, go and get them without any delay.

Call Center Kpis Agent Performance Dashboard Clipart PDF
This slide covers contact center agent performance metrics KPI dashboard. It involves metrics such as number of calls, average response time, average hold time, daily average transfer rate and agents with most hold time and transfer rate. Showcasing this set of slides titled Call Center Kpis Agent Performance Dashboard Clipart PDF. The topics addressed in these templates are Transfer Rate, Call Center, Hold Time. All the content presented in this PPT design is completely editable. Download it and make adjustments in color, background, font etc. as per your unique business setting.
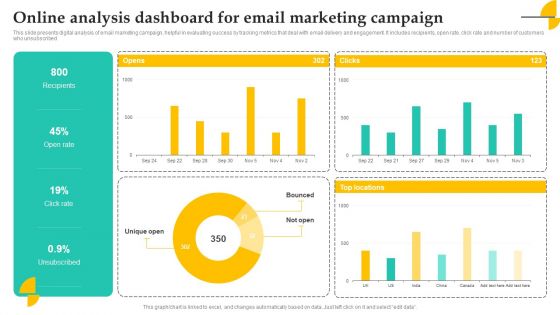
Online Analysis Dashboard For Email Marketing Campaign Elements PDF
This slide presents digital analysis of email marketing campaign, helpful in evaluating success by tracking metrics that deal with email delivery and engagement. It includes recipients, open rate, click rate and number of customers who unsubscribed Showcasing this set of slides titled Online Analysis Dashboard For Email Marketing Campaign Elements PDF. The topics addressed in these templates are Recipients, Open Rate, Campaign. All the content presented in this PPT design is completely editable. Download it and make adjustments in color, background, font etc. as per your unique business setting.
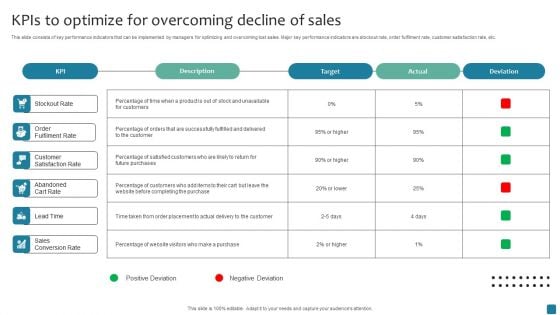
Kpis To Optimize For Overcoming Decline Of Sales Mockup PDF
This slide consists of key performance indicators that can be implemented by managers for optimizing and overcoming lost sales. Major key performance indicators are stockout rate, order fulfilment rate, customer satisfaction rate, etc. Showcasing this set of slides titled Kpis To Optimize For Overcoming Decline Of Sales Mockup PDF. The topics addressed in these templates are Target, Actual, Deviation. All the content presented in this PPT design is completely editable. Download it and make adjustments in color, background, font etc. as per your unique business setting.
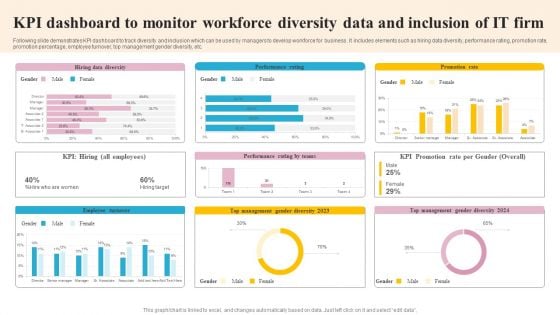
KPI Dashboard To Monitor Workforce Diversity Data And Inclusion Of IT Firm Slides PDF
Following slide demonstrates KPI dashboard to track diversity and inclusion which can be used by managers to develop workforce for business . It includes elements such as hiring data diversity, performance rating, promotion rate, promotion percentage, employee turnover, top management gender diversity, etc. Showcasing this set of slides titled KPI Dashboard To Monitor Workforce Diversity Data And Inclusion Of IT Firm Slides PDF. The topics addressed in these templates are Employee Turnover, Management, Promotion Rate. All the content presented in this PPT design is completely editable. Download it and make adjustments in color, background, font etc. as per your unique business setting.
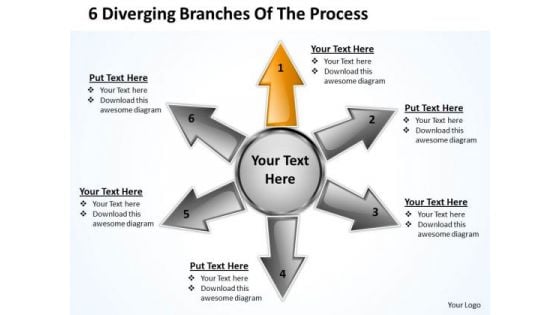
6 Diverging Branches Of The Process Ppt Circular Flow Chart PowerPoint Slides
We present our 6 diverging branches of the process ppt Circular Flow Chart PowerPoint Slides.Present our Business PowerPoint Templates because this template can project the path to sucess that you have charted. Use our Shapes PowerPoint Templates because Our PowerPoint Templates and Slides will let your words and thoughts hit bullseye everytime. Download our Success PowerPoint Templates because you can Decorate it with your well wrapped ideas and colourful thoughts. Download and present our Arrows PowerPoint Templates because this is an amazing graphic to pin-point the manner and processes for them to follow in order to interconnect with each other. Download our Process and Flows PowerPoint Templates because the key criteria for necessary infrastructure are at your finger tips. Radiate this knowledge to the group and see their eyes light up.Use these PowerPoint slides for presentations relating to Arrow, Background, Center, Chart, Clip, Communication, Competition, Computer, Concept, Connect, Connection, Diagram, Direction, Group, Illustration, Information, Network, Process, Progress, Purpose, Strategy, Symbol, Target. The prominent colors used in the PowerPoint template are Orange, Gray, White. People tell us our 6 diverging branches of the process ppt Circular Flow Chart PowerPoint Slides are Radiant. Customers tell us our Clip PowerPoint templates and PPT Slides will impress their bosses and teams. People tell us our 6 diverging branches of the process ppt Circular Flow Chart PowerPoint Slides are Ultra. Professionals tell us our Concept PowerPoint templates and PPT Slides are Graceful. Customers tell us our 6 diverging branches of the process ppt Circular Flow Chart PowerPoint Slides are specially created by a professional team with vast experience. They diligently strive to come up with the right vehicle for your brilliant Ideas. Use our Center PowerPoint templates and PPT Slides are No-nonsense. With our 6 Diverging Branches Of The Process Ppt Circular Flow Chart PowerPoint Slides there is no sitting on the fence. The audience will see a definite choice ahead.
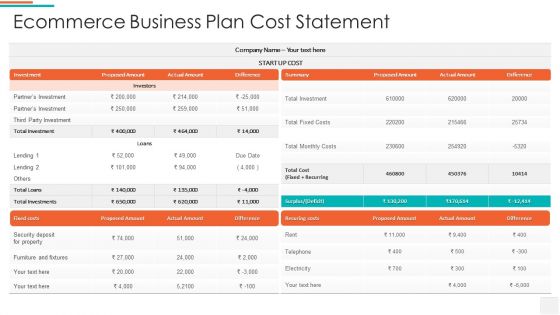
Ecommerce Business Plan Cost Statement Demonstration PDF
Pitch your topic with ease and precision using this ecommerce business plan cost statement demonstration pdf. This layout presents information on investments, security. It is also available for immediate download and adjustment. So, changes can be made in the color, design, graphics or any other component to create a unique layout.
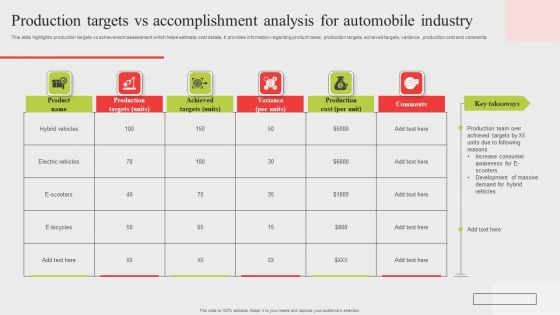
Production Targets Vs Accomplishment Analysis For Automobile Industry Portrait PDF
This slide highlights production targets vs achievement assessment which helps estimate cost details. It provides information regarding product name, production targets, achieved targets, variance , production cost and comments. Showcasing this set of slides titled Production Targets Vs Accomplishment Analysis For Automobile Industry Portrait PDF. The topics addressed in these templates are Product Name, Achieved Targets, Variance. All the content presented in this PPT design is completely editable. Download it and make adjustments in color, background, font etc. as per your unique business setting.
Facebook Marketing Plan Dashboard For Tracking Facebook Post Performance Strategy SS V
Facebook Marketing Techniques Dashboard For Tracking Facebook Post Strategy SS V
The following slide outlines dashboard through which advertisers can manage Facebook post performance and optimize their marketing strategy. Information covered in this slide is related to key metrics such as impressions per post, engagement rate, click-through rate CTR , likes, etc. If you are looking for a format to display your unique thoughts, then the professionally designed Facebook Marketing Techniques Dashboard For Tracking Facebook Post Strategy SS V is the one for you. You can use it as a Google Slides template or a PowerPoint template. Incorporate impressive visuals, symbols, images, and other charts. Modify or reorganize the text boxes as you desire. Experiment with shade schemes and font pairings. Alter, share or cooperate with other people on your work. Download Facebook Marketing Techniques Dashboard For Tracking Facebook Post Strategy SS V and find out how to give a successful presentation. Present a perfect display to your team and make your presentation unforgettable. The following slide outlines dashboard through which advertisers can manage Facebook post performance and optimize their marketing strategy. Information covered in this slide is related to key metrics such as impressions per post, engagement rate, click-through rate CTR , likes, etc.
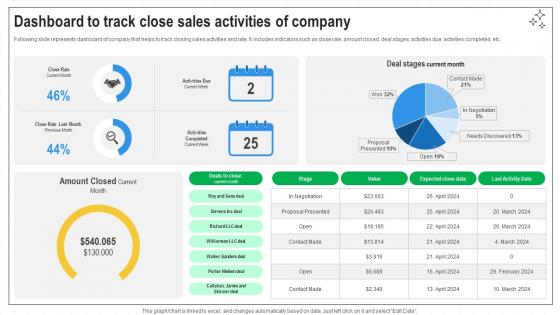
Closing Techniques To Seal Dashboard To Track Close Sales Activities Of Company SA SS V
Following slide represents dashboard of company that helps to track closing sales activities and rate. It includes indicators such as close rate, amount closed, deal stages, activities due, activities completed, etc. If you are looking for a format to display your unique thoughts, then the professionally designed Closing Techniques To Seal Dashboard To Track Close Sales Activities Of Company SA SS V is the one for you. You can use it as a Google Slides template or a PowerPoint template. Incorporate impressive visuals, symbols, images, and other charts. Modify or reorganize the text boxes as you desire. Experiment with shade schemes and font pairings. Alter, share or cooperate with other people on your work. Download Closing Techniques To Seal Dashboard To Track Close Sales Activities Of Company SA SS V and find out how to give a successful presentation. Present a perfect display to your team and make your presentation unforgettable. Following slide represents dashboard of company that helps to track closing sales activities and rate. It includes indicators such as close rate, amount closed, deal stages, activities due, activities completed, etc.
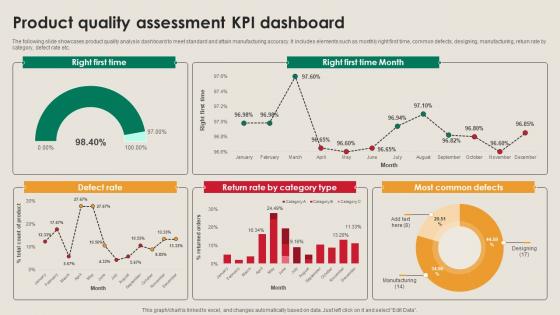
Product Quality Assessment KPI Dashboard Manufacturing Strategy Driving Industry 4 0
The following slide showcases product quality analysis dashboard to meet standard and attain manufacturing accuracy. It includes elements such as monthly right first time, common defects, designing, manufacturing, return rate by category, defect rate etc. If you are looking for a format to display your unique thoughts, then the professionally designed Product Quality Assessment KPI Dashboard Manufacturing Strategy Driving Industry 4 0 is the one for you. You can use it as a Google Slides template or a PowerPoint template. Incorporate impressive visuals, symbols, images, and other charts. Modify or reorganize the text boxes as you desire. Experiment with shade schemes and font pairings. Alter, share or cooperate with other people on your work. Download Product Quality Assessment KPI Dashboard Manufacturing Strategy Driving Industry 4 0 and find out how to give a successful presentation. Present a perfect display to your team and make your presentation unforgettable. The following slide showcases product quality analysis dashboard to meet standard and attain manufacturing accuracy. It includes elements such as monthly right first time, common defects, designing, manufacturing, return rate by category, defect rate etc.
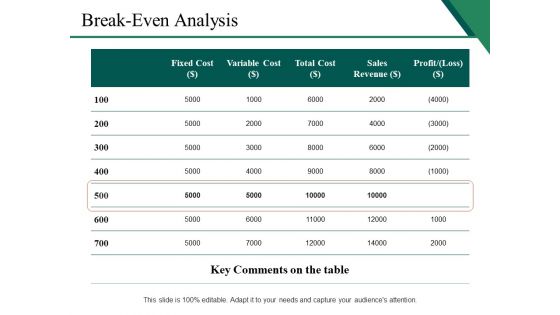
Break Even Analysis Ppt PowerPoint Presentation Pictures Good
This is a break even analysis ppt powerpoint presentation pictures good. This is a five stage process. The stages in this process are key comments on the table, units of output, fixed cost, variable cost, sales revenue.
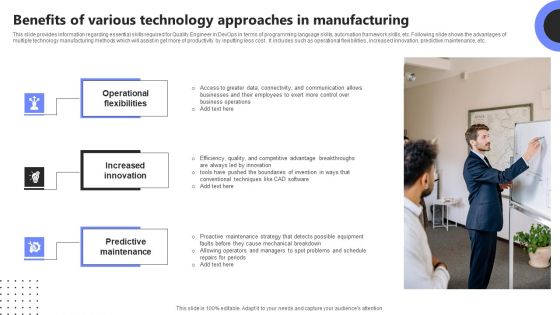
Benefits Of Various Technology Approaches In Manufacturing Summary PDF
This slide provides information regarding essential skills required for Quality Engineer in DevOps in terms of programming language skills, automation framework skills, etc. Following slide shows the advantages of multiple technology manufacturing methods which will assist in get more of productivity by inputting less cost . It includes such as operational flexibilities , increased innovation, predictive maintenance, etc. Presenting Benefits Of Various Technology Approaches In Manufacturing Summary PDF to dispense important information. This template comprises three stages. It also presents valuable insights into the topics including Operational Flexibilities, Increased Innovation, Predictive Maintenance. This is a completely customizable PowerPoint theme that can be put to use immediately. So, download it and address the topic impactfully.
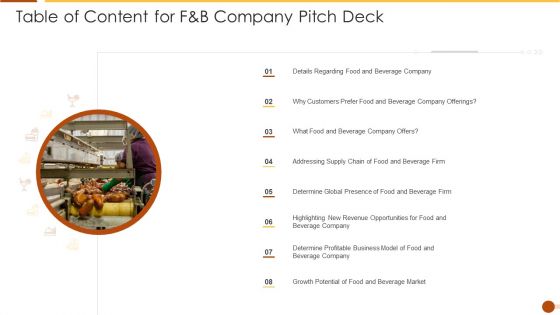
Table Of Content For F And B Company Pitch Deck Template PDF
Deliver and pitch your topic in the best possible manner with this table of content for f and b company pitch deck template pdf. Use them to share invaluable insights on details regarding, customers prefer, addressing supply chain and impress your audience. This template can be altered and modified as per your expectations. So, grab it now.
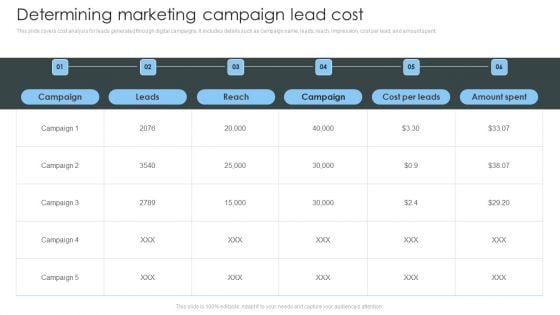
Consumer Lead Generation Process Determining Marketing Campaign Lead Cost Mockup PDF
This slide covers cost analysis for leads generated through digital campaigns. It includes details such as campaign name, leads, reach, impression, cost per lead, and amount spent. Do you have to make sure that everyone on your team knows about any specific topic I yes, then you should give Consumer Lead Generation Process Determining Marketing Campaign Lead Cost Mockup PDF a try. Our experts have put a lot of knowledge and effort into creating this impeccable Consumer Lead Generation Process Determining Marketing Campaign Lead Cost Mockup PDF. You can use this template for your upcoming presentations, as the slides are perfect to represent even the tiniest detail. You can download these templates from the Slidegeeks website and these are easy to edit. So grab these today.
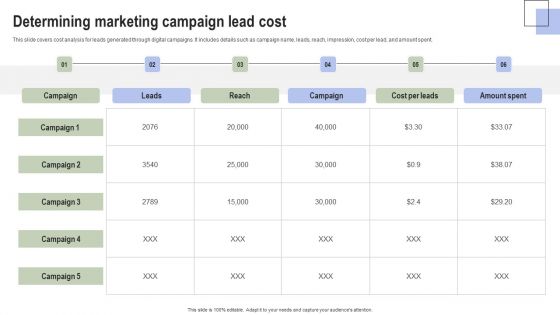
Optimizing Consumer Lead Nurturing Procedure Determining Marketing Campaign Lead Cost Rules PDF
This slide covers cost analysis for leads generated through digital campaigns. It includes details such as campaign name, leads, reach, impression, cost per lead, and amount spent. Crafting an eye catching presentation has never been more straightforward. Let your presentation shine with this tasteful yet straightforward Optimizing Consumer Lead Nurturing Procedure Determining Marketing Campaign Lead Cost Rules PDF template. It offers a minimalistic and classy look that is great for making a statement. The colors have been employed intelligently to add a bit of playfulness while still remaining professional. Construct the ideal Optimizing Consumer Lead Nurturing Procedure Determining Marketing Campaign Lead Cost Rules PDF that effortlessly grabs the attention of your audience. Begin now and be certain to wow your customers.
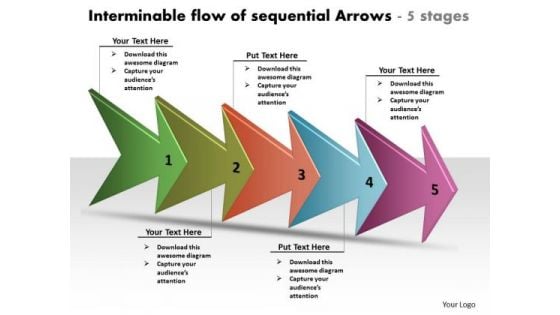
Interminable Flow Of Sequential Arrows 5 Stages Process Chart Template PowerPoint Templates
We present our interminable flow of sequential arrows 5 stages process chart template PowerPoint templates.Use our Arrows PowerPoint Templates because,This slide helps you to give your team an overview of your capability and insight into the minute details of the overall picture highlighting the interdependence at every operational level. Use our Shapes PowerPoint Templates because, This can explain the various related aspects of these varied tracks and how they will, on hitting their own targets, cumulatively contribute to hitting GOLD. Use our Signs PowerPoint Templates because, This will helps you to explore the minutest detail of each concept and follow the trail to its conclusion. Use our Business PowerPoint Templates because,It helps you to explain your plans in all earnest to your colleagues and raise the bar for all. Use our Process and Flows PowerPoint Templates because,You can Educate your listeners on the means to keep it ticking over.Use these PowerPoint slides for presentations relating to Algorithm, arrow, arrows, block, business, chart, connection, design, development, diagram, direction, element, flow, flowchart, graph, kind, linear, management, of, organization, process, program, section, segment, set, sign, solution, strategy, symbol. The prominent colors used in the PowerPoint template are Pink, Blue, Orange. People tell us our interminable flow of sequential arrows 5 stages process chart template PowerPoint templates are Magical. The feedback we get is that our connection PowerPoint templates and PPT Slides are Fun. People tell us our interminable flow of sequential arrows 5 stages process chart template PowerPoint templates are readymade to fit into any presentation structure. Presenters tell us our design PowerPoint templates and PPT Slides are Splendid. The feedback we get is that our interminable flow of sequential arrows 5 stages process chart template PowerPoint templates are designed by professionals Professionals tell us our arrows PowerPoint templates and PPT Slides are the best it can get when it comes to presenting. Make your competition seem feeble with our Interminable Flow Of Sequential Arrows 5 Stages Process Chart Template PowerPoint Templates. Just download, type and present.
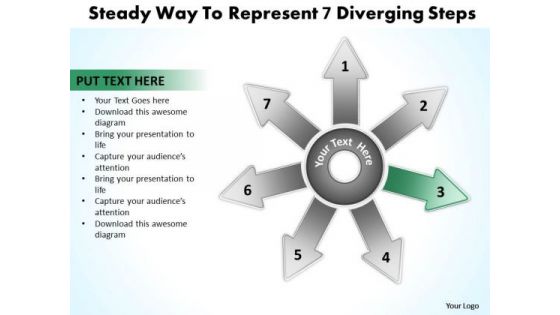
Steady Way To Represent 7 Diverging Steps Circular Chart PowerPoint Slides
We present our steady way to represent 7 diverging steps Circular Chart PowerPoint Slides.Present our Business PowerPoint Templates because spell out your advertising plans to increase market share. The feedback has been positive and productive. Download and present our Shapes PowerPoint Templates because you can Raise your Company stocks at the Opening Bell. Download our Success PowerPoint Templates because the success of your venture depends on the performance of every team member. Use our Process and Flows PowerPoint Templates because you should explain the process by which you intend to right it. Present our Arrows PowerPoint Templates because you know what it takes to keep it fit and healthy.Use these PowerPoint slides for presentations relating to Arrow, Background, Center, Chart, Clip, Communication, Competition, Computer, Concept, Connect, Connection, Diagram, Direction, Group, Illustration, Information, Network, Process, Progress, Purpose, Strategy, Symbol, Target. The prominent colors used in the PowerPoint template are Green dark , Gray, White. People tell us our steady way to represent 7 diverging steps Circular Chart PowerPoint Slides are Handsome. People tell us our Computer PowerPoint templates and PPT Slides are Precious. The feedback we get is that our steady way to represent 7 diverging steps Circular Chart PowerPoint Slides are Detailed. Presenters tell us our Communication PowerPoint templates and PPT Slides are Appealing. Customers tell us our steady way to represent 7 diverging steps Circular Chart PowerPoint Slides are Glamorous. The feedback we get is that our Computer PowerPoint templates and PPT Slides are Precious. Examine the facts in all their combinations. Run the comb through with our Steady Way To Represent 7 Diverging Steps Circular Chart PowerPoint Slides.
Steady Way To Represent 7 Diverging Steps Circular Flow Chart PowerPoint Slides
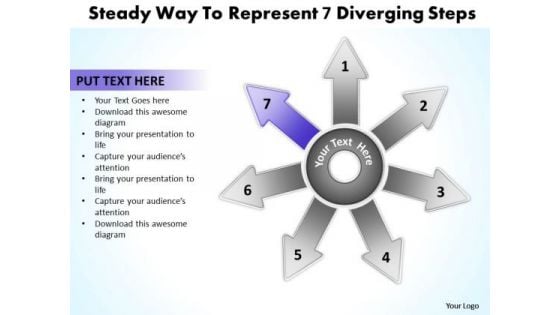
We present our steady way to represent 7 diverging steps Circular Flow Chart PowerPoint Slides.Download our Business PowerPoint Templates because you have selected your team man for man. Download and present our Shapes PowerPoint Templates because it gives you really bright ideas. Present our Success PowerPoint Templates because the success of your venture depends on the performance of every team member. Present our Process and Flows PowerPoint Templates because Our PowerPoint Templates and Slides will let Your superior ideas hit the target always and everytime. Download our Arrows PowerPoint Templates because like your thoughts arrows are inherently precise and true.Use these PowerPoint slides for presentations relating to Arrow, Background, Center, Chart, Clip, Communication, Competition, Computer, Concept, Connect, Connection, Diagram, Direction, Group, Illustration, Information, Network, Process, Progress, Purpose, Strategy, Symbol, Target. The prominent colors used in the PowerPoint template are Purple, Gray, White. People tell us our steady way to represent 7 diverging steps Circular Flow Chart PowerPoint Slides are effectively colour coded to prioritise your plans They automatically highlight the sequence of events you desire. People tell us our Communication PowerPoint templates and PPT Slides are Excellent. The feedback we get is that our steady way to represent 7 diverging steps Circular Flow Chart PowerPoint Slides are Wistful. Presenters tell us our Center PowerPoint templates and PPT Slides are Pretty. Customers tell us our steady way to represent 7 diverging steps Circular Flow Chart PowerPoint Slides are Majestic. The feedback we get is that our Clip PowerPoint templates and PPT Slides will help you be quick off the draw. Just enter your specific text and see your points hit home. Our Steady Way To Represent 7 Diverging Steps Circular Flow Chart PowerPoint Slides make good companions. They also are dependable allies.
6 Diverging Branches Of The Process Circular Flow Chart PowerPoint Slides
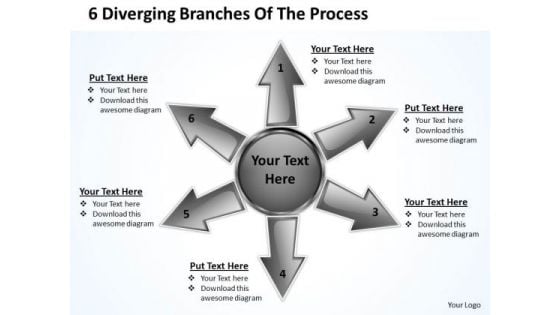
We present our 6 diverging branches of the process Circular Flow Chart PowerPoint Slides.Use our Business PowerPoint Templates because you can Lead your flock steadily to greater heights. Look around at the vast potential of achievement around you. Present our Shapes PowerPoint Templates because colours generate instant reactions in our brains. Download and present our Success PowerPoint Templates because it depicts that Original thinking is the need of the hour. Use our Arrows PowerPoint Templates because this will helps you to explore the minutest detail of each concept and follow the trail to its conclusion. Present our Process and Flows PowerPoint Templates because they are truly some of the wonders of our life.Use these PowerPoint slides for presentations relating to Arrow, Background, Center, Chart, Clip, Communication, Competition, Computer, Concept, Connect, Connection, Diagram, Direction, Group, Illustration, Information, Network, Process, Progress, Purpose, Strategy, Symbol, Target. The prominent colors used in the PowerPoint template are Black, Gray, White. People tell us our 6 diverging branches of the process Circular Flow Chart PowerPoint Slides are Upbeat. Customers tell us our Center PowerPoint templates and PPT Slides are Luxurious. People tell us our 6 diverging branches of the process Circular Flow Chart PowerPoint Slides are second to none. Professionals tell us our Center PowerPoint templates and PPT Slides are Glamorous. Customers tell us our 6 diverging branches of the process Circular Flow Chart PowerPoint Slides are Glamorous. Use our Computer PowerPoint templates and PPT Slides are Pleasant. Our 6 Diverging Branches Of The Process Circular Flow Chart PowerPoint Slides will be an extension of you. You will accept them as your alter ego.
Domestic Financial Planning Budget Plan Ppt PowerPoint Presentation Pictures Visuals PDF
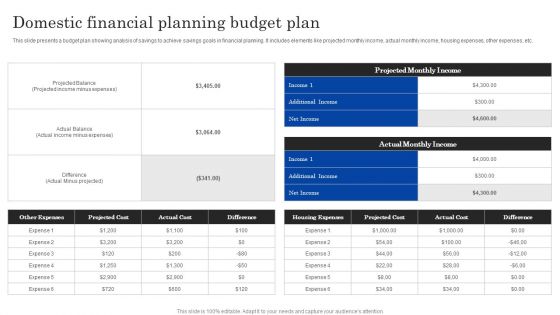
This slide presents a budget plan showing analysis of savings to achieve savings goals in financial planning. It includes elements like projected monthly income, actual monthly income, housing expenses, other expenses, etc.Showcasing this set of slides titled Domestic Financial Planning Budget Plan Ppt PowerPoint Presentation Pictures Visuals PDF. The topics addressed in these templates are Income Minus, Projected Cost, Housing Expenses. All the content presented in this PPT design is completely editable. Download it and make adjustments in color, background, font etc. as per your unique business setting.
Information Technology Department Annual Budget Rules PDF
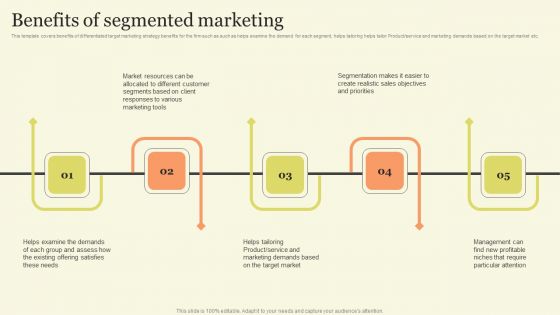
Marketing Techniques For Increasing Target Audience Benefits Of Segmented Marketing Download PDF
This template covers benefits of differentiated target marketing strategy benefits for the firm such as such as helps examine the demand for each segment, helps tailoring helps tailor Product or service and marketing demands based on the target market etc. Do you know about Slidesgeeks Marketing Techniques For Increasing Target Audience Benefits Of Segmented Marketing Download PDF These are perfect for delivering any kind od presentation. Using it, create PowerPoint presentations that communicate your ideas and engage audiences. Save time and effort by using our pre designed presentation templates that are perfect for a wide range of topic. Our vast selection of designs covers a range of styles, from creative to business, and are all highly customizable and easy to edit. Download as a PowerPoint template or use them as Google Slides themes.


 Continue with Email

 Home
Home


