Price Table
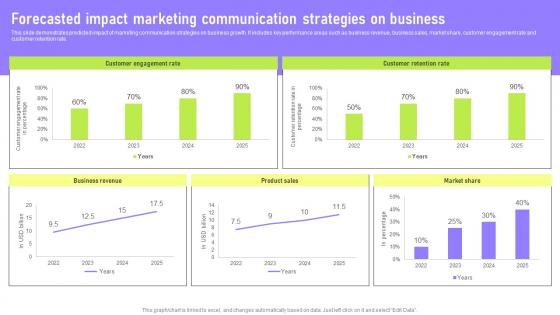
Forecasted Impact Deployment Of Marketing Communication Demonstration Pdf
This slide demonstrates predicted impact of marketing communication strategies on business growth. It includes key performance areas such as business revenue, business sales, market share, customer engagement rate and customer retention rate. Do you have an important presentation coming up Are you looking for something that will make your presentation stand out from the rest Look no further than Forecasted Impact Deployment Of Marketing Communication Demonstration Pdf. With our professional designs, you can trust that your presentation will pop and make delivering it a smooth process. And with Slidegeeks, you can trust that your presentation will be unique and memorable. So why wait Grab Forecasted Impact Deployment Of Marketing Communication Demonstration Pdf today and make your presentation stand out from the rest. This slide demonstrates predicted impact of marketing communication strategies on business growth. It includes key performance areas such as business revenue, business sales, market share, customer engagement rate and customer retention rate.
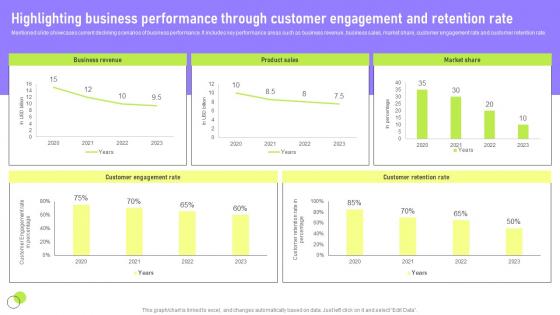
Highlighting Business Performance Deployment Of Marketing Communication Elements Pdf
Mentioned slide showcases current declining scenarios of business performance. It includes key performance areas such as business revenue, business sales, market share, customer engagement rate and customer retention rate. Find highly impressive Highlighting Business Performance Deployment Of Marketing Communication Elements Pdf on Slidegeeks to deliver a meaningful presentation. You can save an ample amount of time using these presentation templates. No need to worry to prepare everything from scratch because Slidegeeks experts have already done a huge research and work for you. You need to download Highlighting Business Performance Deployment Of Marketing Communication Elements Pdf for your upcoming presentation. All the presentation templates are 100 percent editable and you can change the color and personalize the content accordingly. Download now. Mentioned slide showcases current declining scenarios of business performance. It includes key performance areas such as business revenue, business sales, market share, customer engagement rate and customer retention rate.
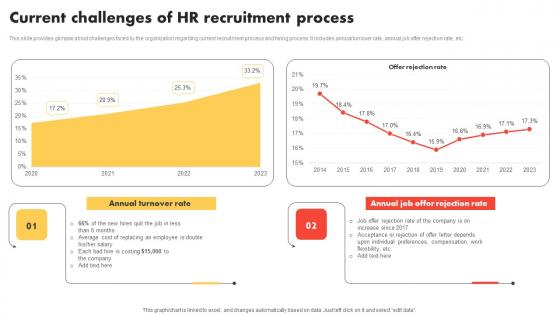
Current Challenges Of HR Modern And Advanced HR Recruitment Themes Pdf
This slide provides glimpse about challenges faced by the organization regarding current recruitment process and hiring process. It includes annual turnover rate, annual job offer rejection rate, etc. Do you have to make sure that everyone on your team knows about any specific topic I yes, then you should give Current Challenges Of HR Modern And Advanced HR Recruitment Themes Pdf a try. Our experts have put a lot of knowledge and effort into creating this impeccable Current Challenges Of HR Modern And Advanced HR Recruitment Themes Pdf. You can use this template for your upcoming presentations, as the slides are perfect to represent even the tiniest detail. You can download these templates from the Slidegeeks website and these are easy to edit. So grab these today. This slide provides glimpse about challenges faced by the organization regarding current recruitment process and hiring process. It includes annual turnover rate, annual job offer rejection rate, etc.
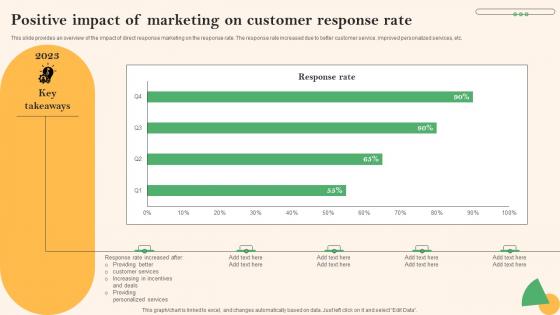
Positive Impact Of Marketing On Customer Response Social Media Marketing To Boost Inspiration Pdf
This slide provides an overview of the impact of direct response marketing on the response rate. The response rate increased due to better customer service, improved personalized services, etc. Create an editable Positive Impact Of Marketing On Customer Response Social Media Marketing To Boost Inspiration Pdf that communicates your idea and engages your audience. Whether you are presenting a business or an educational presentation, pre-designed presentation templates help save time. Positive Impact Of Marketing On Customer Response Social Media Marketing To Boost Inspiration Pdf is highly customizable and very easy to edit, covering many different styles from creative to business presentations. Slidegeeks has creative team members who have crafted amazing templates. So, go and get them without any delay. This slide provides an overview of the impact of direct response marketing on the response rate. The response rate increased due to better customer service, improved personalized services, etc.
Facebook And Twitter For Customer Support Video Conferencing In Corporate Demonstration Pdf
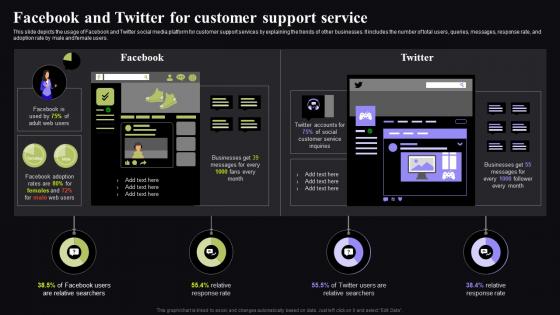
This slide depicts the usage of Facebook and Twitter social media platform for customer support services by explaining the trends of other businesses. It includes the number of total users, queries, messages, response rate, and adoption rate by male and female users. From laying roadmaps to briefing everything in detail, our templates are perfect for you. You can set the stage with your presentation slides. All you have to do is download these easy-to-edit and customizable templates. Facebook And Twitter For Customer Support Video Conferencing In Corporate Demonstration Pdf will help you deliver an outstanding performance that everyone would remember and praise you for. Do download this presentation today. This slide depicts the usage of Facebook and Twitter social media platform for customer support services by explaining the trends of other businesses. It includes the number of total users, queries, messages, response rate, and adoption rate by male and female users.
Client Feedback Strategies Customer Service Concerns Faced By The Company Brochure Pdf
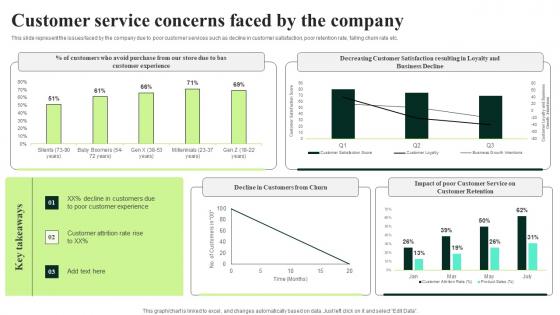
This slide represent the issues faced by the company due to poor customer services such as decline in customer satisfaction, poor retention rate, falling churn rate etc. Make sure to capture your audiences attention in your business displays with our gratis customizable Client Feedback Strategies Customer Service Concerns Faced By The Company Brochure Pdf. These are great for business strategies, office conferences, capital raising or task suggestions. If you desire to acquire more customers for your tech business and ensure they stay satisfied, create your own sales presentation with these plain slides. This slide represent the issues faced by the company due to poor customer services such as decline in customer satisfaction, poor retention rate, falling churn rate etc.
Impact Of Implementing Record Music Industry Marketing Plan To Enhance Brand Image Information Pdf
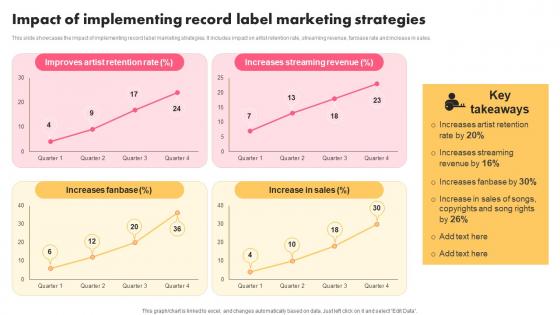
This slide showcases the impact of implementing record label marketing strategies. It includes impact on artist retention rate, streaming revenue, fanbase rate and increase in sales. Are you in need of a template that can accommodate all of your creative concepts This one is crafted professionally and can be altered to fit any style. Use it with Google Slides or PowerPoint. Include striking photographs, symbols, depictions, and other visuals. Fill, move around, or remove text boxes as desired. Test out color palettes and font mixtures. Edit and save your work, or work with colleagues. Download Impact Of Implementing Record Music Industry Marketing Plan To Enhance Brand Image Information Pdf and observe how to make your presentation outstanding. Give an impeccable presentation to your group and make your presentation unforgettable. This slide showcases the impact of implementing record label marketing strategies. It includes impact on artist retention rate, streaming revenue, fanbase rate and increase in sales.
Impact Of Brand Advocacy Training Internal Branding Strategy For Enhanced Advocacy Rules Pdf
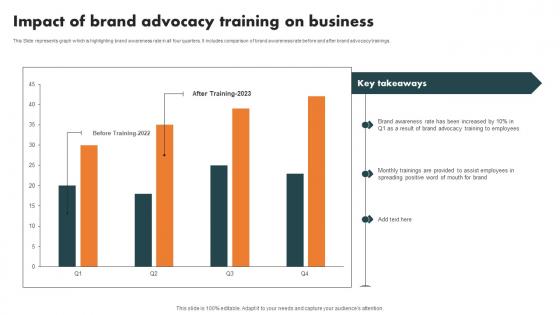
This Slide represents graph which is highlighting brand awareness rate in all four quarters. It includes comparison of brand awareness rate before and after brand advocacy trainings. Present like a pro with Impact Of Brand Advocacy Training Internal Branding Strategy For Enhanced Advocacy Rules Pdf Create beautiful presentations together with your team, using our easy to use presentation slides. Share your ideas in real time and make changes on the fly by downloading our templates. So whether you are in the office, on the go, or in a remote location, you can stay in sync with your team and present your ideas with confidence. With Slidegeeks presentation got a whole lot easier. Grab these presentations today. This Slide represents graph which is highlighting brand awareness rate in all four quarters. It includes comparison of brand awareness rate before and after brand advocacy trainings.
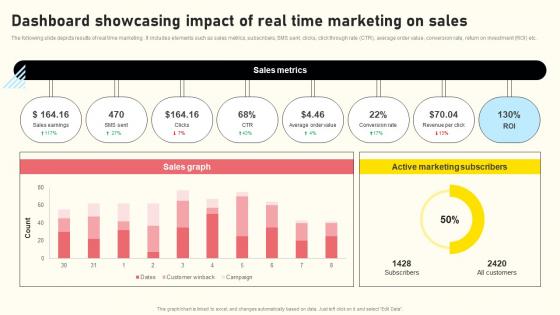
Effective Real Time Marketing Principles Dashboard Showcasing Impact Of Real Microsoft Pdf
The following slide depicts results of real time marketing . It includes elements such as sales metrics, subscribers, SMS sent, clicks, click through rate CTR, average order value, conversion rate, return on investment ROI etc. Create an editable Effective Real Time Marketing Principles Dashboard Showcasing Impact Of Real Microsoft Pdf that communicates your idea and engages your audience. Whether you are presenting a business or an educational presentation, pre-designed presentation templates help save time. Effective Real Time Marketing Principles Dashboard Showcasing Impact Of Real Microsoft Pdf is highly customizable and very easy to edit, covering many different styles from creative to business presentations. Slidegeeks has creative team members who have crafted amazing templates. So, go and get them without any delay. The following slide depicts results of real time marketing . It includes elements such as sales metrics, subscribers, SMS sent, clicks, click through rate CTR, average order value, conversion rate, return on investment ROI etc.
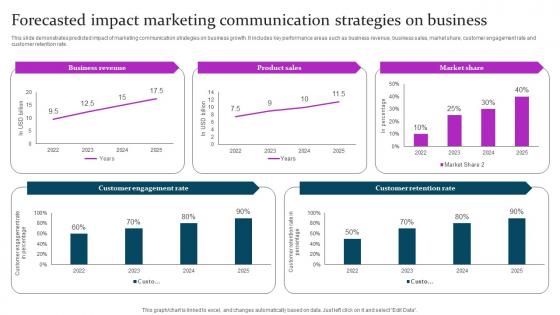
Forecasted Impact Marketing Mix Communication Guide Client Summary Pdf
This slide demonstrates predicted impact of marketing communication strategies on business growth. It includes key performance areas such as business revenue, business sales, market share, customer engagement rate and customer retention rate. From laying roadmaps to briefing everything in detail, our templates are perfect for you. You can set the stage with your presentation slides. All you have to do is download these easy to edit and customizable templates. Forecasted Impact Marketing Mix Communication Guide Client Summary Pdf will help you deliver an outstanding performance that everyone would remember and praise you for. Do download this presentation today. This slide demonstrates predicted impact of marketing communication strategies on business growth. It includes key performance areas such as business revenue, business sales, market share, customer engagement rate and customer retention rate.
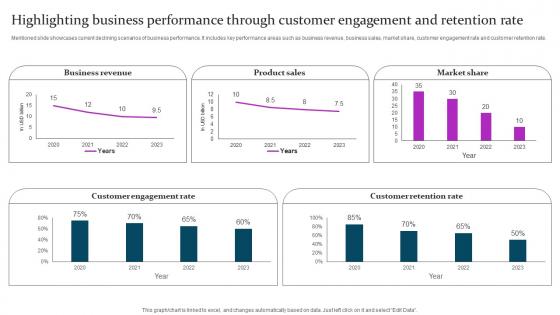
Highlighting Business Performance Marketing Mix Communication Guide Client Elements Pdf
Mentioned slide showcases current declining scenarios of business performance. It includes key performance areas such as business revenue, business sales, market share, customer engagement rate and customer retention rate. Slidegeeks is here to make your presentations a breeze with Highlighting Business Performance Marketing Mix Communication Guide Client Elements Pdf With our easy to use and customizable templates, you can focus on delivering your ideas rather than worrying about formatting. With a variety of designs to choose from, you are sure to find one that suits your needs. And with animations and unique photos, illustrations, and fonts, you can make your presentation pop. So whether you are giving a sales pitch or presenting to the board, make sure to check out Slidegeeks first Mentioned slide showcases current declining scenarios of business performance. It includes key performance areas such as business revenue, business sales, market share, customer engagement rate and customer retention rate.
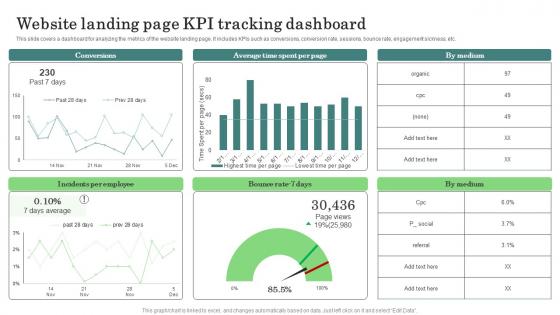
Website Landing Page KPI Major Promotional Analytics Future Trends Microsoft Pdf
This slide covers a dashboard for analyzing the metrics of the website landing page. It includes KPIs such as conversions, conversion rate, sessions, bounce rate, engagement sickness, etc. Do you have to make sure that everyone on your team knows about any specific topic I yes, then you should give Website Landing Page KPI Major Promotional Analytics Future Trends Microsoft Pdf a try. Our experts have put a lot of knowledge and effort into creating this impeccable Website Landing Page KPI Major Promotional Analytics Future Trends Microsoft Pdf. You can use this template for your upcoming presentations, as the slides are perfect to represent even the tiniest detail. You can download these templates from the Slidegeeks website and these are easy to edit. So grab these today This slide covers a dashboard for analyzing the metrics of the website landing page. It includes KPIs such as conversions, conversion rate, sessions, bounce rate, engagement sickness, etc.
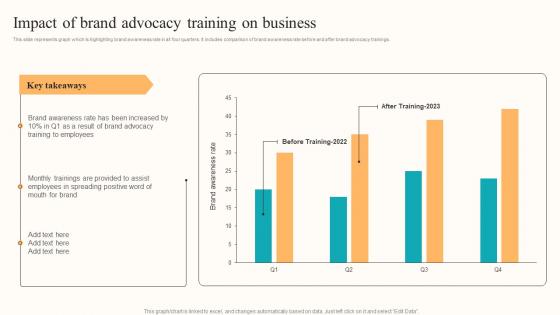
Impact Of Brand Advocacy Developing Employee Centric Marketing Program Background Pdf
This slide represents graph which is highlighting brand awareness rate in all four quarters. It includes comparison of brand awareness rate before and after brand advocacy trainings. Do you have an important presentation coming up Are you looking for something that will make your presentation stand out from the rest Look no further than Impact Of Brand Advocacy Developing Employee Centric Marketing Program Background Pdf. With our professional designs, you can trust that your presentation will pop and make delivering it a smooth process. And with Slidegeeks, you can trust that your presentation will be unique and memorable. So why wait Grab Impact Of Brand Advocacy Developing Employee Centric Marketing Program Background Pdf today and make your presentation stand out from the rest This slide represents graph which is highlighting brand awareness rate in all four quarters. It includes comparison of brand awareness rate before and after brand advocacy trainings.
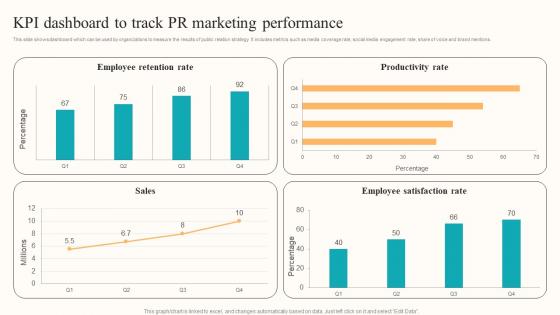
KPI Dashboard Track PR Developing Employee Centric Marketing Program Designs Pdf
This slide shows dashboard which can be used by organizations to measure the results of public relation strategy. It includes metrics such as media coverage rate, social media engagement rate, share of voice and brand mentions. This KPI Dashboard Track PR Developing Employee Centric Marketing Program Designs Pdf is perfect for any presentation, be it in front of clients or colleagues. It is a versatile and stylish solution for organizing your meetings. The KPI Dashboard Track PR Developing Employee Centric Marketing Program Designs Pdf features a modern design for your presentation meetings. The adjustable and customizable slides provide unlimited possibilities for acing up your presentation. Slidegeeks has done all the homework before launching the product for you. So, do not wait, grab the presentation templates today This slide shows dashboard which can be used by organizations to measure the results of public relation strategy. It includes metrics such as media coverage rate, social media engagement rate, share of voice and brand mentions.
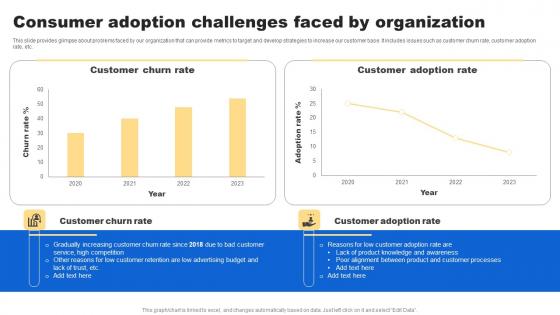
Consumer Adoption Challenges Analyzing Customer Buying Behavior Enhance Conversion Background Pdf
This slide provides glimpse about problems faced by our organization that can provide metrics to target and develop strategies to increase our customer base. It includes issues such as customer churn rate, customer adoption rate, etc. From laying roadmaps to briefing everything in detail, our templates are perfect for you. You can set the stage with your presentation slides. All you have to do is download these easy to edit and customizable templates. Consumer Adoption Challenges Analyzing Customer Buying Behavior Enhance Conversion Background Pdf will help you deliver an outstanding performance that everyone would remember and praise you for. Do download this presentation today. This slide provides glimpse about problems faced by our organization that can provide metrics to target and develop strategies to increase our customer base. It includes issues such as customer churn rate, customer adoption rate, etc.
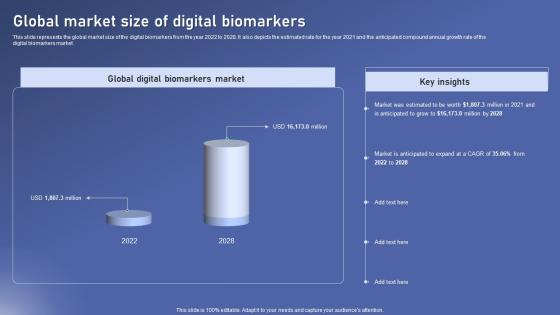
Global Market Size Of Digital Biomedical Data Science And Health Informatics Microsoft Pdf
This slide represents the global market size of the digital biomarkers from the year 2022 to 2028. It also depicts the estimated rate for the year 2021 and the anticipated compound annual growth rate of the digital biomarkers market. The best PPT templates are a great way to save time, energy, and resources. Slidegeeks have 100 percent editable powerpoint slides making them incredibly versatile. With these quality presentation templates, you can create a captivating and memorable presentation by combining visually appealing slides and effectively communicating your message. Download Global Market Size Of Digital Biomedical Data Science And Health Informatics Microsoft Pdf from Slidegeeks and deliver a wonderful presentation. This slide represents the global market size of the digital biomarkers from the year 2022 to 2028. It also depicts the estimated rate for the year 2021 and the anticipated compound annual growth rate of the digital biomarkers market.
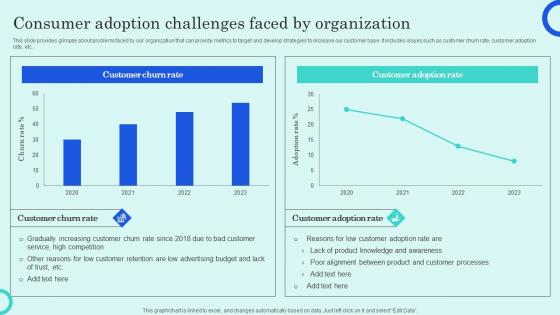
Consumer Adoption Challenges Faced By Overview Of Customer Adoption Process Portrait Pdf
This slide provides glimpse about problems faced by our organization that can provide metrics to target and develop strategies to increase our customer base. It includes issues such as customer churn rate, customer adoption rate, etc. There are so many reasons you need a Consumer Adoption Challenges Faced By Overview Of Customer Adoption Process Portrait Pdf. The first reason is you cant spend time making everything from scratch, Thus, Slidegeeks has made presentation templates for you too. You can easily download these templates from our website easily. This slide provides glimpse about problems faced by our organization that can provide metrics to target and develop strategies to increase our customer base. It includes issues such as customer churn rate, customer adoption rate, etc.
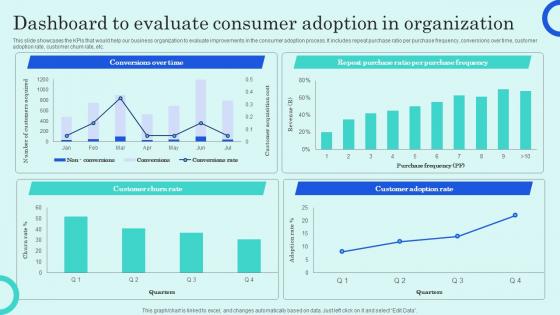
Dashboard To Evaluate Consumer Adoption In Overview Of Customer Adoption Process Microsoft Pdf
This slide showcases the KPIs that would help our business organization to evaluate improvements in the consumer adoption process. It includes repeat purchase ratio per purchase frequency, conversions over time, customer adoption rate, customer churn rate, etc. Present like a pro with Dashboard To Evaluate Consumer Adoption In Overview Of Customer Adoption Process Microsoft Pdf Create beautiful presentations together with your team, using our easy to use presentation slides. Share your ideas in real time and make changes on the fly by downloading our templates. So whether youre in the office, on the go, or in a remote location, you can stay in sync with your team and present your ideas with confidence. With Slidegeeks presentation got a whole lot easier. Grab these presentations today. This slide showcases the KPIs that would help our business organization to evaluate improvements in the consumer adoption process. It includes repeat purchase ratio per purchase frequency, conversions over time, customer adoption rate, customer churn rate, etc.
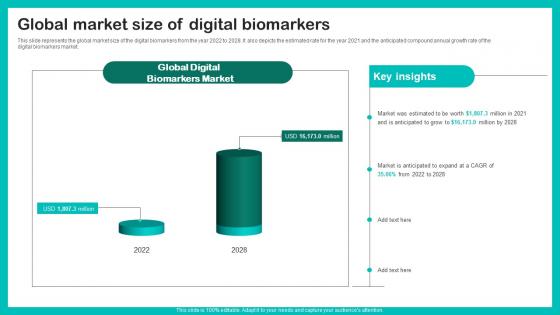
Global Market Size Of Digital Biomarkers For Personalized Health Insights Sample Pdf
This slide represents the global market size of the digital biomarkers from the year 2022 to 2028. It also depicts the estimated rate for the year 2021 and the anticipated compound annual growth rate of the digital biomarkers market. If your project calls for a presentation, then Slidegeeks is your go to partner because we have professionally designed, easy to edit templates that are perfect for any presentation. After downloading, you can easily edit Global Market Size Of Digital Biomarkers For Personalized Health Insights Sample Pdf and make the changes accordingly. You can rearrange slides or fill them with different images. Check out all the handy templates This slide represents the global market size of the digital biomarkers from the year 2022 to 2028. It also depicts the estimated rate for the year 2021 and the anticipated compound annual growth rate of the digital biomarkers market.
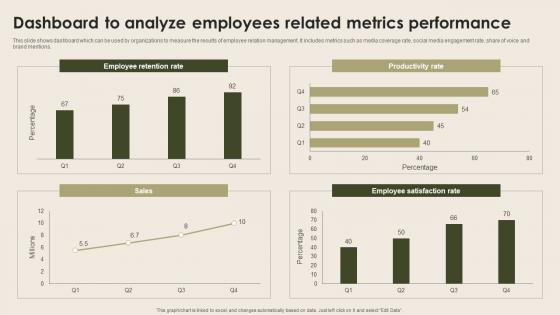
Dashboard To Analyze Employees Related Nurturing Positive Work Culture Sample Pdf
This slide shows dashboard which can be used by organizations to measure the results of employee relation management. It includes metrics such as media coverage rate, social media engagement rate, share of voice and brand mentions. Present like a pro with Dashboard To Analyze Employees Related Nurturing Positive Work Culture Sample Pdf Create beautiful presentations together with your team, using our easy-to-use presentation slides. Share your ideas in real-time and make changes on the fly by downloading our templates. So whether you are in the office, on the go, or in a remote location, you can stay in sync with your team and present your ideas with confidence. With Slidegeeks presentation got a whole lot easier. Grab these presentations today. This slide shows dashboard which can be used by organizations to measure the results of employee relation management. It includes metrics such as media coverage rate, social media engagement rate, share of voice and brand mentions.
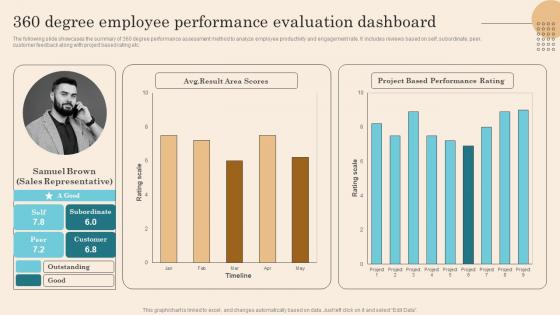
360 Degree Employee Performance Evaluation Executing Successful Staff Performance Summary Pdf
The following slide showcases the summary of 360 degree performance assessment method to analyze employee productivity and engagement rate. It includes reviews based on self, subordinate, peer, customer feedback along with project based rating etc. Find a pre designed and impeccable 360 Degree Employee Performance Evaluation Executing Successful Staff Performance Summary Pdf. The templates can ace your presentation without additional effort. You can download these easy to edit presentation templates to make your presentation stand out from others. So, what are you waiting for Download the template from Slidegeeks today and give a unique touch to your presentation. The following slide showcases the summary of 360 degree performance assessment method to analyze employee productivity and engagement rate. It includes reviews based on self, subordinate, peer, customer feedback along with project based rating etc.
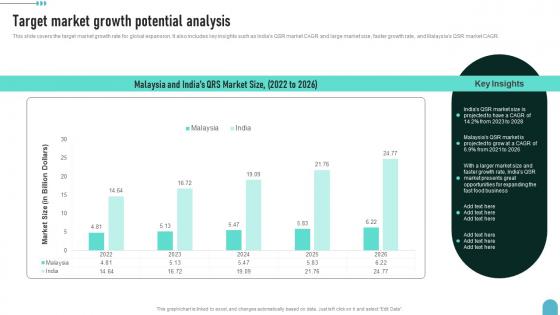
Target Market Growth Potential Analysis Enhancing Global Presence Inspiration Pdf
This slide covers the target market growth rate for global expansion. It also includes key insights such as Indias QSR market CAGR and large market size, faster growth rate, and Malaysias QSR market CAGR.Present like a pro with Target Market Growth Potential Analysis Enhancing Global Presence Inspiration Pdf Create beautiful presentations together with your team, using our easy-to-use presentation slides. Share your ideas in real-time and make changes on the fly by downloading our templates. So whether you are in the office, on the go, or in a remote location, you can stay in sync with your team and present your ideas with confidence. With Slidegeeks presentation got a whole lot easier. Grab these presentations today. This slide covers the target market growth rate for global expansion. It also includes key insights such as Indias QSR market CAGR and large market size, faster growth rate, and Malaysias QSR market CAGR.
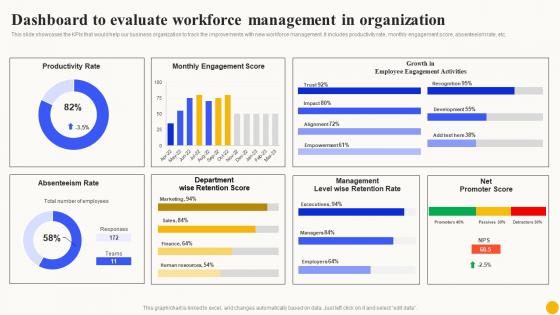
Dashboard To Evaluate Workforce Planned Workforce Enhancement Mockup Pdf
This slide showcases the KPIs that would help our business organization to track the improvements with new workforce management. It includes productivity rate, monthly engagement score, absenteeism rate, etc.Find highly impressive Dashboard To Evaluate Workforce Planned Workforce Enhancement Mockup Pdf on Slidegeeks to deliver a meaningful presentation. You can save an ample amount of time using these presentation templates. No need to worry to prepare everything from scratch because Slidegeeks experts have already done a huge research and work for you. You need to download Dashboard To Evaluate Workforce Planned Workforce Enhancement Mockup Pdf for your upcoming presentation. All the presentation templates are 100Precent editable and you can change the color and personalize the content accordingly. Download now. This slide showcases the KPIs that would help our business organization to track the improvements with new workforce management. It includes productivity rate, monthly engagement score, absenteeism rate, etc.
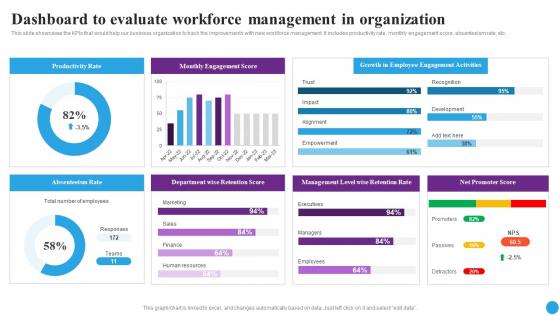
Dashboard To Evaluate Workforce Strategic Approaches To Streamline Demonstration Pdf
This slide showcases the KPIs that would help our business organization to track the improvements with new workforce management. It includes productivity rate, monthly engagement score, absenteeism rate, etc.Find highly impressive Dashboard To Evaluate Workforce Strategic Approaches To Streamline Demonstration Pdf on Slidegeeks to deliver a meaningful presentation. You can save an ample amount of time using these presentation templates. No need to worry to prepare everything from scratch because Slidegeeks experts have already done a huge research and work for you. You need to download Dashboard To Evaluate Workforce Strategic Approaches To Streamline Demonstration Pdf for your upcoming presentation. All the presentation templates are 100Precent editable and you can change the color and personalize the content accordingly. Download now. This slide showcases the KPIs that would help our business organization to track the improvements with new workforce management. It includes productivity rate, monthly engagement score, absenteeism rate, etc.
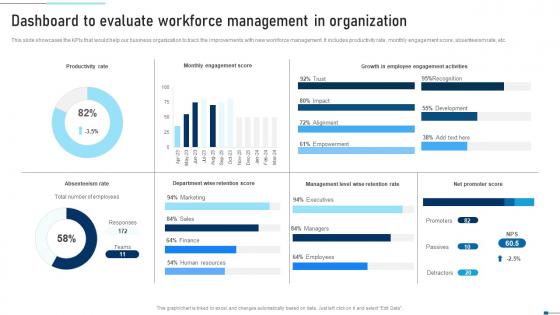
Dashboard To Evaluate Workforce Management In Strategic Talent Recruitment Diagrams Pdf
This slide showcases the KPIs that would help our business organization to track the improvements with new workforce management. It includes productivity rate, monthly engagement score, absenteeism rate, etc. Find highly impressive Dashboard To Evaluate Workforce Management In Strategic Talent Recruitment Diagrams Pdf on Slidegeeks to deliver a meaningful presentation. You can save an ample amount of time using these presentation templates. No need to worry to prepare everything from scratch because Slidegeeks experts have already done a huge research and work for you. You need to download for your upcoming presentation. All the presentation templates are 100 percent editable and you can change the color and personalize the content accordingly. Download now This slide showcases the KPIs that would help our business organization to track the improvements with new workforce management. It includes productivity rate, monthly engagement score, absenteeism rate, etc.
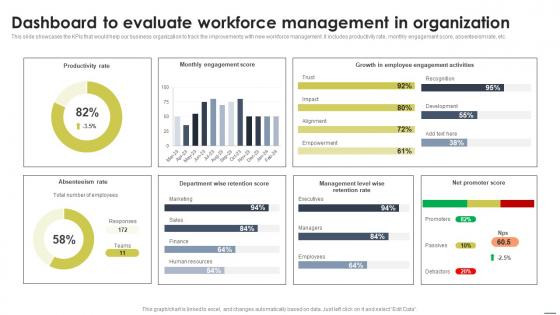
Dashboard To Evaluate Workforce Management Staff Management Approache Background Pdf
This slide showcases the KPIs that would help our business organization to track the improvements with new workforce management. It includes productivity rate, monthly engagement score, absenteeism rate, etc. Find highly impressive Dashboard To Evaluate Workforce Management Staff Management Approache Background Pdf on Slidegeeks to deliver a meaningful presentation. You can save an ample amount of time using these presentation templates. No need to worry to prepare everything from scratch because Slidegeeks experts have already done a huge research and work for you. You need to download Dashboard To Evaluate Workforce Management Staff Management Approache Background Pdf for your upcoming presentation. All the presentation templates are 100 percent editable and you can change the color and personalize the content accordingly. Download now This slide showcases the KPIs that would help our business organization to track the improvements with new workforce management. It includes productivity rate, monthly engagement score, absenteeism rate, etc.
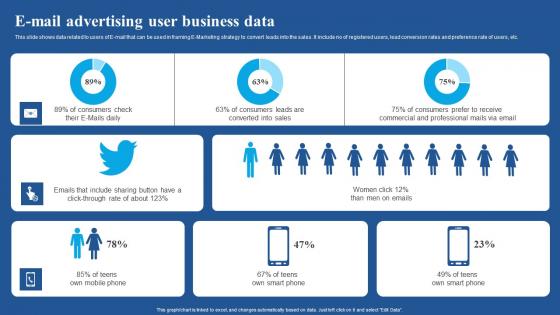
E Mail Advertising User Business Data Diagrams Pdf
This slide shows data related to users of E-mail that can be used in framing E-Marketing strategy to convert leads into the sales. It include no of registered users, lead conversion rates and preference rate of users, etc.Showcasing this set of slides titled E Mail Advertising User Business Data Diagrams Pdf The topics addressed in these templates are E Mail Advertising, User Business Data All the content presented in this PPT design is completely editable. Download it and make adjustments in color, background, font etc. as per your unique business setting. This slide shows data related to users of E mail that can be used in framing E Marketing strategy to convert leads into the sales. It include no of registered users, lead conversion rates and preference rate of users, etc.
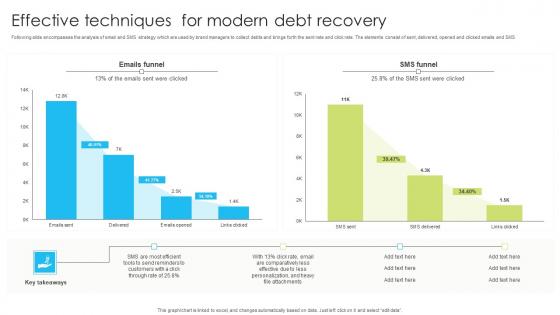
Effective Techniques For Modern Debt Recovery Sample Pdf
Following slide encompasses the analysis of email and SMS strategy which are used by brand managers to collect debts and brings forth the sent rate and click rate. The elements consist of sent, delivered, opened and clicked emails and SMS. Showcasing this set of slides titled Effective Techniques For Modern Debt Recovery Sample Pdf. The topics addressed in these templates are Effective Technique, Modern Debt Recovery, Opened And Clicked Emails. All the content presented in this PPT design is completely editable. Download it and make adjustments in color, background, font etc. as per your unique business setting. Following slide encompasses the analysis of email and SMS strategy which are used by brand managers to collect debts and brings forth the sent rate and click rate. The elements consist of sent, delivered, opened and clicked emails and SMS.
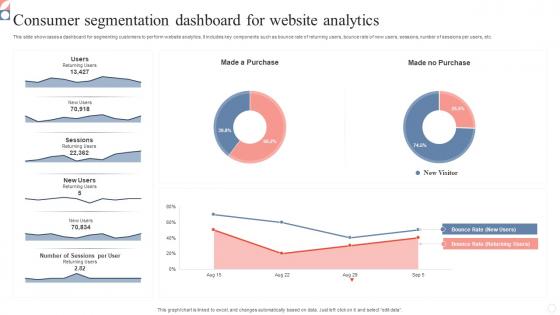
Consumer Segmentation Dashboard For Website Analytics Infographics Pdf
This slide showcases a dashboard for segmenting customers to perform website analytics. It includes key components such as bounce rate of returning users, bounce rate of new users, sessions, number of sessions per users, etc. Pitch your topic with ease and precision using this Consumer Segmentation Dashboard For Website Analytics Infographics Pdf. This layout presents information on Consumer Segmentation Dashboard, Website Analytics, Segmenting Customers. It is also available for immediate download and adjustment. So, changes can be made in the color, design, graphics or any other component to create a unique layout. This slide showcases a dashboard for segmenting customers to perform website analytics. It includes key components such as bounce rate of returning users, bounce rate of new users, sessions, number of sessions per users, etc.
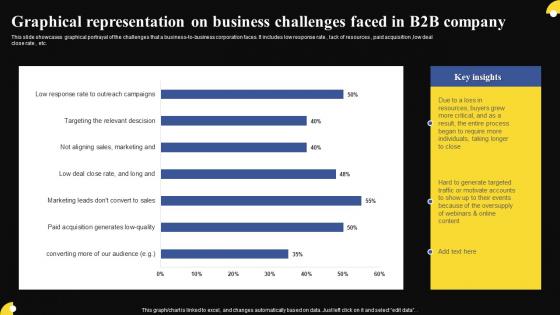
Graphical Representation On Business Challenges Faced In B2b Company Slides Pdf
This slide showcases graphical portrayal of the challenges that a business-to-business corporation faces. It includes low response rate, lack of resources, paid acquisition, low deal close rate, etc. Showcasing this set of slides titled Graphical Representation On Business Challenges Faced In B2b Company Slides Pdf The topics addressed in these templates are Graphical Representation On Business, Challenges Faced In B2B Company All the content presented in this PPT design is completely editable. Download it and make adjustments in color, background, font etc. as per your unique business setting. This slide showcases graphical portrayal of the challenges that a business-to-business corporation faces. It includes low response rate, lack of resources, paid acquisition, low deal close rate, etc.
Web Consulting Business Various Kpis For Tracking Business Performance
Mentioned slide provide insights into various key performance indicators to determine business performance. It includes KPIs such as business financials, website traffic, customer case, customer engagement, conversion rate, customer retention, customer bounce rate, employee turnover, etc. This modern and well-arranged Web Consulting Business Various Kpis For Tracking Business Performance provides lots of creative possibilities. It is very simple to customize and edit with the Powerpoint Software. Just drag and drop your pictures into the shapes. All facets of this template can be edited with Powerpoint, no extra software is necessary. Add your own material, put your images in the places assigned for them, adjust the colors, and then you can show your slides to the world, with an animated slide included. Mentioned slide provide insights into various key performance indicators to determine business performance. It includes KPIs such as business financials, website traffic, customer case, customer engagement, conversion rate, customer retention, customer bounce rate, employee turnover, etc.
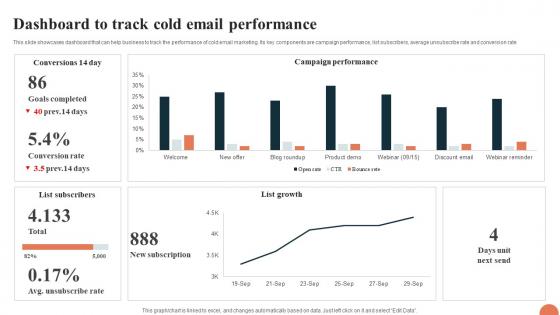
Telesales Strategy For Targeting Dashboard To Track Cold Email Performance Strategy SS V
This slide showcases dashboard that can help business to track the performance of cold email marketing. Its key components are campaign performance, list subscribers, average unsubscribe rate and conversion rate. Find highly impressive Telesales Strategy For Targeting Dashboard To Track Cold Email Performance Strategy SS V on Slidegeeks to deliver a meaningful presentation. You can save an ample amount of time using these presentation templates. No need to worry to prepare everything from scratch because Slidegeeks experts have already done a huge research and work for you. You need to download Telesales Strategy For Targeting Dashboard To Track Cold Email Performance Strategy SS V for your upcoming presentation. All the presentation templates are 100 percent editable and you can change the color and personalize the content accordingly. Download now This slide showcases dashboard that can help business to track the performance of cold email marketing. Its key components are campaign performance, list subscribers, average unsubscribe rate and conversion rate.
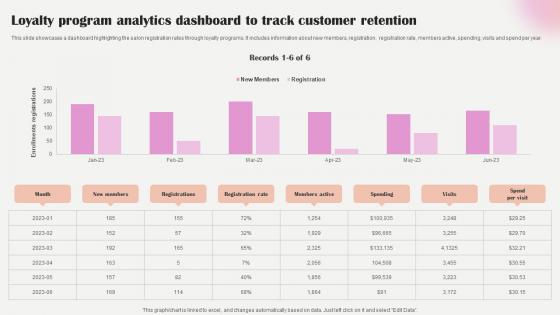
Salon Marketing Plan To Optimize Loyalty Program Analytics Dashboard To Track Strategy SS V
This slide showcases a dashboard highlighting the salon registration rates through loyalty programs. It includes information about new members, registration, registration rate, members active, spending, visits and spend per year. Get a simple yet stunning designed Salon Marketing Plan To Optimize Loyalty Program Analytics Dashboard To Track Strategy SS V. It is the best one to establish the tone in your meetings. It is an excellent way to make your presentations highly effective. So, download this PPT today from Slidegeeks and see the positive impacts. Our easy-to-edit Salon Marketing Plan To Optimize Loyalty Program Analytics Dashboard To Track Strategy SS V can be your go-to option for all upcoming conferences and meetings. So, what are you waiting for Grab this template today. This slide showcases a dashboard highlighting the salon registration rates through loyalty programs. It includes information about new members, registration, registration rate, members active, spending, visits and spend per year.

Graphical Impact Of Restaurant Marketing Strategies Create An Effective Restaurant
The slide showcases a graphical representation of promotional techniques impact on the restaurant business. It provides detailed information about brand awareness rate, website traffic, customer retention rate, and sales. Find highly impressive Graphical Impact Of Restaurant Marketing Strategies Create An Effective Restaurant on Slidegeeks to deliver a meaningful presentation. You can save an ample amount of time using these presentation templates. No need to worry to prepare everything from scratch because Slidegeeks experts have already done a huge research and work for you. You need to download Graphical Impact Of Restaurant Marketing Strategies Create An Effective Restaurant for your upcoming presentation. All the presentation templates are 100 percent editable and you can change the color and personalize the content accordingly. Download now. The slide showcases a graphical representation of promotional techniques impact on the restaurant business. It provides detailed information about brand awareness rate, website traffic, customer retention rate, and sales.

Social Media Analytics Market Outlook Cracking The Code Of Social Media
This slide represents the Social Media Analytics of the market outlook. The purpose of this slide is to outline the year over year growth rate, CAGR rate, growth momentum, market size growth of the market, etc. Slidegeeks is one of the best resources for PowerPoint templates. You can download easily and regulate Social Media Analytics Market Outlook Cracking The Code Of Social Media for your personal presentations from our wonderful collection. A few clicks is all it takes to discover and get the most relevant and appropriate templates. Use our Templates to add a unique zing and appeal to your presentation and meetings. All the slides are easy to edit and you can use them even for advertisement purposes. This slide represents the Social Media Analytics of the market outlook. The purpose of this slide is to outline the year over year growth rate, CAGR rate, growth momentum, market size growth of the market, etc.
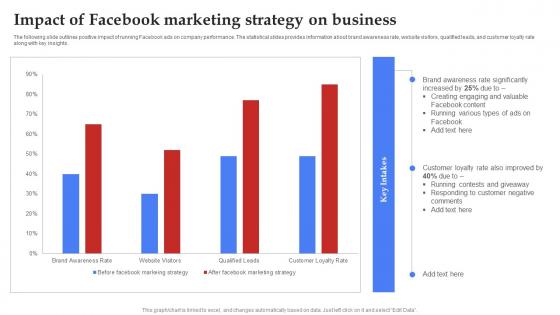
Facebook Marketing Plan Impact Of Facebook Marketing Strategy On Business Strategy SS V
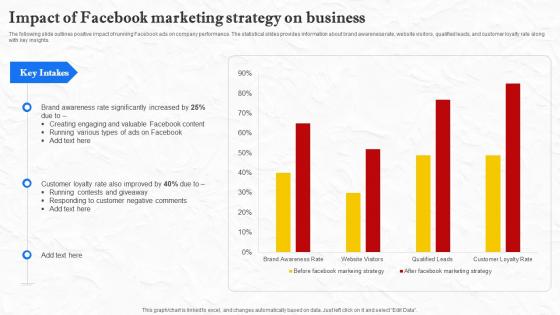
Facebook Marketing Techniques Impact Of Facebook Marketing Strategy On Business Strategy SS V
The following slide outlines positive impact of running Facebook ads on company performance. The statistical slides provides information about brand awareness rate, website visitors, qualified leads, and customer loyalty rate along with key insights. This Facebook Marketing Techniques Impact Of Facebook Marketing Strategy On Business Strategy SS V from Slidegeeks makes it easy to present information on your topic with precision. It provides customization options, so you can make changes to the colors, design, graphics, or any other component to create a unique layout. It is also available for immediate download, so you can begin using it right away. Slidegeeks has done good research to ensure that you have everything you need to make your presentation stand out. Make a name out there for a brilliant performance. The following slide outlines positive impact of running Facebook ads on company performance. The statistical slides provides information about brand awareness rate, website visitors, qualified leads, and customer loyalty rate along with key insights.

Create A Restaurant Marketing Graphical Impact Of Restaurant Marketing Strategies
The slide showcases a graphical representation of promotional techniques impact on the restaurant business. It provides detailed information about brand awareness rate, website traffic, customer retention rate, and sales. Whether you have daily or monthly meetings, a brilliant presentation is necessary. Create A Restaurant Marketing Graphical Impact Of Restaurant Marketing Strategies can be your best option for delivering a presentation. Represent everything in detail using Create A Restaurant Marketing Graphical Impact Of Restaurant Marketing Strategies and make yourself stand out in meetings. The template is versatile and follows a structure that will cater to your requirements. All the templates prepared by Slidegeeks are easy to download and edit. Our research experts have taken care of the corporate themes as well. So, give it a try and see the results. The slide showcases a graphical representation of promotional techniques impact on the restaurant business. It provides detailed information about brand awareness rate, website traffic, customer retention rate, and sales.
Managing Technical And Non Various Kpis For Tracking Business Performance
Mentioned slide provide insights into various key performance indicators to determine business performance. It includes KPIs such as business financials, website traffic, customer case, customer engagement, conversion rate, customer retention, customer bounce rate, employee turnover, etc. Make sure to capture your audiences attention in your business displays with our gratis customizable Managing Technical And Non Various Kpis For Tracking Business Performance. These are great for business strategies, office conferences, capital raising or task suggestions. If you desire to acquire more customers for your tech business and ensure they stay satisfied, create your own sales presentation with these plain slides. Mentioned slide provide insights into various key performance indicators to determine business performance. It includes KPIs such as business financials, website traffic, customer case, customer engagement, conversion rate, customer retention, customer bounce rate, employee turnover, etc.
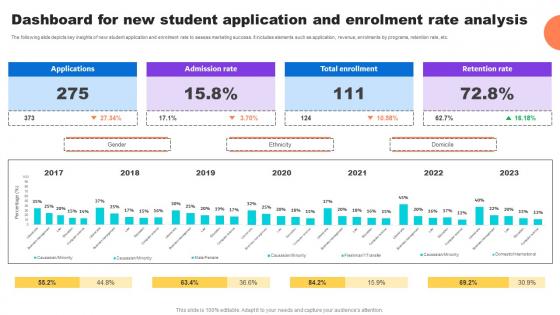
Dashboard For New Student Application And Enrolment Key Step To Implementation University Strategy SS V
The following slide depicts key insights of new student application and enrolment rate to assess marketing success. It includes elements such as application, revenue, enrolments by programs, retention rate, etc.Crafting an eye-catching presentation has never been more straightforward. Let your presentation shine with this tasteful yet straightforward Dashboard For New Student Application And Enrolment Key Step To Implementation University Strategy SS V template. It offers a minimalistic and classy look that is great for making a statement. The colors have been employed intelligently to add a bit of playfulness while still remaining professional. Construct the ideal Dashboard For New Student Application And Enrolment Key Step To Implementation University Strategy SS V that effortlessly grabs the attention of your audience Begin now and be certain to wow your customers The following slide depicts key insights of new student application and enrolment rate to assess marketing success. It includes elements such as application, revenue, enrolments by programs, retention rate, etc.
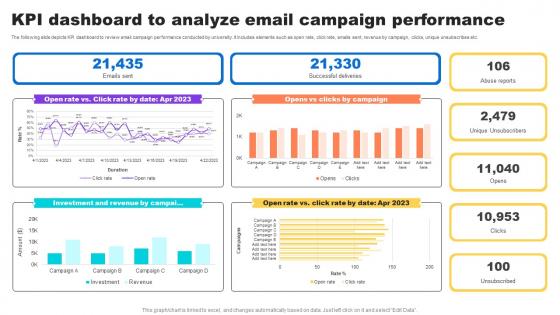
Kpi Dashboard To Analyze Email Campaign Key Step To Implementation University Strategy SS V
The following slide depicts KPI dashboard to review email campaign performance conducted by university. It includes elements such as open rate, click rate, emails sent, revenue by campaign, clicks, unique unsubscribes etc.The Kpi Dashboard To Analyze Email Campaign Key Step To Implementation University Strategy SS V is a compilation of the most recent design trends as a series of slides. It is suitable for any subject or industry presentation, containing attractive visuals and photo spots for businesses to clearly express their messages. This template contains a variety of slides for the user to input data, such as structures to contrast two elements, bullet points, and slides for written information. Slidegeeks is prepared to create an impression. The following slide depicts KPI dashboard to review email campaign performance conducted by university. It includes elements such as open rate, click rate, emails sent, revenue by campaign, clicks, unique unsubscribes etc.
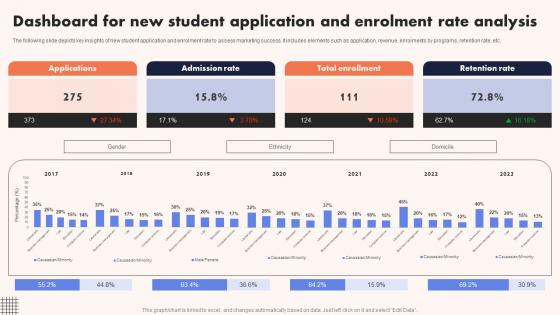
University Marketing Guide Dashboard For New Student Application And Enrolment Strategy SS V
The following slide depicts key insights of new student application and enrolment rate to assess marketing success. It includes elements such as application, revenue, enrolments by programs, retention rate, etc. Coming up with a presentation necessitates that the majority of the effort goes into the content and the message you intend to convey. The visuals of a PowerPoint presentation can only be effective if it supplements and supports the story that is being told. Keeping this in mind our experts created University Marketing Guide Dashboard For New Student Application And Enrolment Strategy SS V to reduce the time that goes into designing the presentation. This way, you can concentrate on the message while our designers take care of providing you with the right template for the situation. The following slide depicts key insights of new student application and enrolment rate to assess marketing success. It includes elements such as application, revenue, enrolments by programs, retention rate, etc.
Unlocking Potential Enhancing Team Members Performance Tracking Dashboards
This slide depicts performance tracking dashboard for project manager to analyze work being done by the team. It includes average rating for the week, total work done and weekly change, employee rating and work done. Take your projects to the next level with our ultimate collection of Unlocking Potential Enhancing Team Members Performance Tracking Dashboards. Slidegeeks has designed a range of layouts that are perfect for representing task or activity duration, keeping track of all your deadlines at a glance. Tailor these designs to your exact needs and give them a truly corporate look with your own brand colors they will make your projects stand out from the rest This slide depicts performance tracking dashboard for project manager to analyze work being done by the team. It includes average rating for the week, total work done and weekly change, employee rating and work done.
Unlocking Potential Enhancing Team Training And Development Program Tracking Dashboard
This slide depicts team development program tracking dashboard to analyze the impact of implementing training plan for the members. It includes training satisfaction rate, engagement score, drop-out rate and top 5 trainees. Find a pre-designed and impeccable Unlocking Potential Enhancing Team Training And Development Program Tracking Dashboard. The templates can ace your presentation without additional effort. You can download these easy-to-edit presentation templates to make your presentation stand out from others. So, what are you waiting for Download the template from Slidegeeks today and give a unique touch to your presentation. This slide depicts team development program tracking dashboard to analyze the impact of implementing training plan for the members. It includes training satisfaction rate, engagement score, drop-out rate and top 5 trainees.
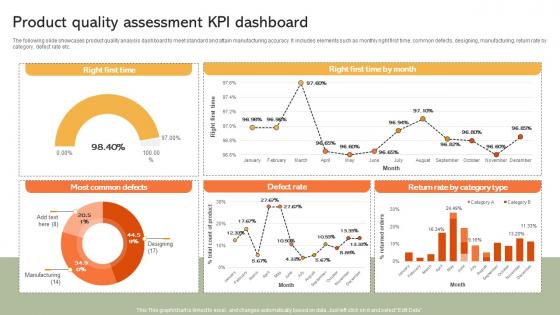
Product Quality Assessment KPI Dashboard Implementing Manufacturing Strategy SS V
The following slide showcases product quality analysis dashboard to meet standard and attain manufacturing accuracy. It includes elements such as monthly right first time, common defects, designing, manufacturing, return rate by category, defect rate etc. Take your projects to the next level with our ultimate collection of Product Quality Assessment KPI Dashboard Implementing Manufacturing Strategy SS V. Slidegeeks has designed a range of layouts that are perfect for representing task or activity duration, keeping track of all your deadlines at a glance. Tailor these designs to your exact needs and give them a truly corporate look with your own brand colors they will make your projects stand out from the rest The following slide showcases product quality analysis dashboard to meet standard and attain manufacturing accuracy. It includes elements such as monthly right first time, common defects, designing, manufacturing, return rate by category, defect rate etc.
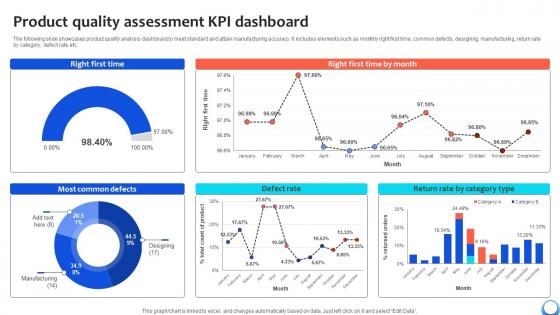
Product Quality Assessment KPI Dashboard Automating Production Process Strategy SS V
The following slide showcases product quality analysis dashboard to meet standard and attain manufacturing accuracy. It includes elements such as monthly right first time, common defects, designing, manufacturing, return rate by category, defect rate etc. Take your projects to the next level with our ultimate collection of Product Quality Assessment KPI Dashboard Automating Production Process Strategy SS V. Slidegeeks has designed a range of layouts that are perfect for representing task or activity duration, keeping track of all your deadlines at a glance. Tailor these designs to your exact needs and give them a truly corporate look with your own brand colors they will make your projects stand out from the rest The following slide showcases product quality analysis dashboard to meet standard and attain manufacturing accuracy. It includes elements such as monthly right first time, common defects, designing, manufacturing, return rate by category, defect rate etc.
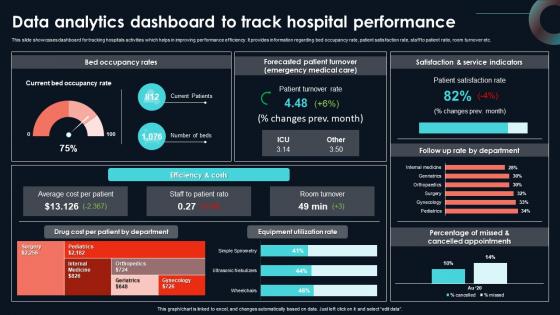
Data Analytics Dashboard To Track Hospital Developing Strategic Insights Using Big Data Analytics SS V
This slide showcases dashboard for tracking hospitals activities which helps in improving performance efficiency. It provides information regarding bed occupancy rate, patient satisfaction rate, staff to patient ratio, room turnover etc. The best PPT templates are a great way to save time, energy, and resources. Slidegeeks have 100 percent editable powerpoint slides making them incredibly versatile. With these quality presentation templates, you can create a captivating and memorable presentation by combining visually appealing slides and effectively communicating your message. Download Data Analytics Dashboard To Track Hospital Developing Strategic Insights Using Big Data Analytics SS V from Slidegeeks and deliver a wonderful presentation. This slide showcases dashboard for tracking hospitals activities which helps in improving performance efficiency. It provides information regarding bed occupancy rate, patient satisfaction rate, staff to patient ratio, room turnover etc.
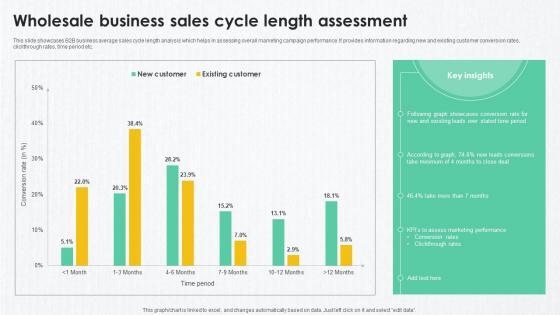
B2B Marketing Techniques Wholesale Business Sales Cycle Length Assessment
This slide showcases B2B business average sales cycle length analysis which helps in assessing overall marketing campaign performance. It provides information regarding new and existing customer conversion rates, clickthrough rates, time period etc. Slidegeeks is here to make your presentations a breeze with B2B Marketing Techniques Wholesale Business Sales Cycle Length Assessment With our easy-to-use and customizable templates, you can focus on delivering your ideas rather than worrying about formatting. With a variety of designs to choose from, you are sure to find one that suits your needs. And with animations and unique photos, illustrations, and fonts, you can make your presentation pop. So whether you are giving a sales pitch or presenting to the board, make sure to check out Slidegeeks first This slide showcases B2B business average sales cycle length analysis which helps in assessing overall marketing campaign performance. It provides information regarding new and existing customer conversion rates, clickthrough rates, time period etc.

IoT Solutions For Oil Oil And Gas Production Monitoring KPI Dashboard IoT SS V
This slide exhibits monthly performance of oil and gas production to track wellhead uptime and overall efficiency. It includes various elements such as production efficiency, well uptime, gas production rate, oil production rate, top performing gas producing wells, etc. Take your projects to the next level with our ultimate collection of IoT Solutions For Oil Oil And Gas Production Monitoring KPI Dashboard IoT SS V. Slidegeeks has designed a range of layouts that are perfect for representing task or activity duration, keeping track of all your deadlines at a glance. Tailor these designs to your exact needs and give them a truly corporate look with your own brand colors they will make your projects stand out from the rest This slide exhibits monthly performance of oil and gas production to track wellhead uptime and overall efficiency. It includes various elements such as production efficiency, well uptime, gas production rate, oil production rate, top performing gas producing wells, etc.
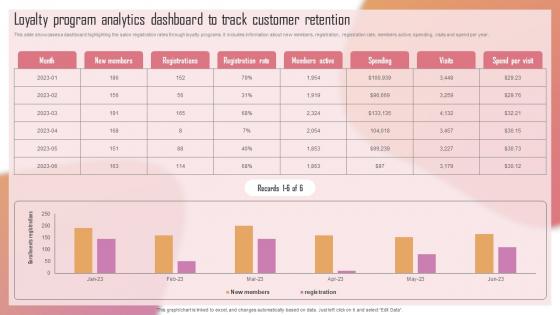
Customizing The Salon Experience Loyalty Program Analytics Dashboard To Track Customer Strategy SS V
This slide showcases a dashboard highlighting the salon registration rates through loyalty programs. It includes information about new members, registration, registration rate, members active, spending, visits and spend per year. There are so many reasons you need a Customizing The Salon Experience Loyalty Program Analytics Dashboard To Track Customer Strategy SS V. The first reason is you can not spend time making everything from scratch, Thus, Slidegeeks has made presentation templates for you too. You can easily download these templates from our website easily. This slide showcases a dashboard highlighting the salon registration rates through loyalty programs. It includes information about new members, registration, registration rate, members active, spending, visits and spend per year.
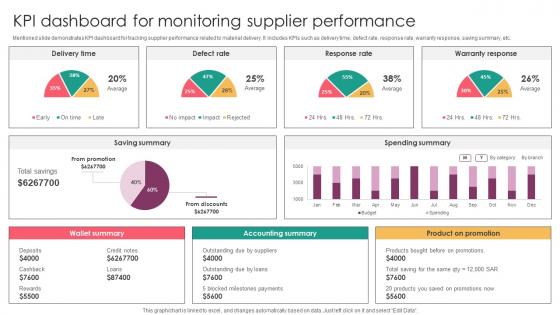
Strategic Supplier Evaluation KPI Dashboard For Monitoring Supplier Performance
Mentioned slide demonstrates KPI dashboard for tracking supplier performance related to material delivery. It includes KPIs such as delivery time, defect rate, response rate, warranty response, saving summary, etc. Formulating a presentation can take up a lot of effort and time, so the content and message should always be the primary focus. The visuals of the PowerPoint can enhance the presenters message, so our Strategic Supplier Evaluation KPI Dashboard For Monitoring Supplier Performance was created to help save time. Instead of worrying about the design, the presenter can concentrate on the message while our designers work on creating the ideal templates for whatever situation is needed. Slidegeeks has experts for everything from amazing designs to valuable content, we have put everything into Strategic Supplier Evaluation KPI Dashboard For Monitoring Supplier Performance. Mentioned slide demonstrates KPI dashboard for tracking supplier performance related to material delivery. It includes KPIs such as delivery time, defect rate, response rate, warranty response, saving summary, etc.
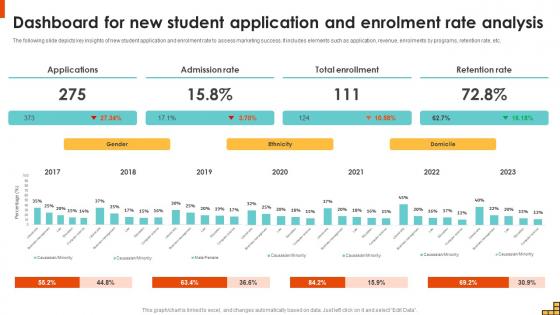
Dashboard For New Student Application And Enrolment Running Marketing Campaigns Strategy SS V
The following slide depicts key insights of new student application and enrolment rate to assess marketing success. It includes elements such as application, revenue, enrolments by programs, retention rate, etc. Crafting an eye-catching presentation has never been more straightforward. Let your presentation shine with this tasteful yet straightforward Dashboard For New Student Application And Enrolment Running Marketing Campaigns Strategy SS V template. It offers a minimalistic and classy look that is great for making a statement. The colors have been employed intelligently to add a bit of playfulness while still remaining professional. Construct the ideal Dashboard For New Student Application And Enrolment Running Marketing Campaigns Strategy SS V that effortlessly grabs the attention of your audience Begin now and be certain to wow your customers The following slide depicts key insights of new student application and enrolment rate to assess marketing success. It includes elements such as application, revenue, enrolments by programs, retention rate, etc.

KPI Dashboard To Analyze Email Campaign Performance Running Marketing Campaigns Strategy SS V
The following slide depicts KPI dashboard to review email campaign performance conducted by university. It includes elements such as open rate, click rate, emails sent, revenue by campaign, clicks, unique unsubscribes, etc. The best PPT templates are a great way to save time, energy, and resources. Slidegeeks have 100 percent editable powerpoint slides making them incredibly versatile. With these quality presentation templates, you can create a captivating and memorable presentation by combining visually appealing slides and effectively communicating your message. Download KPI Dashboard To Analyze Email Campaign Performance Running Marketing Campaigns Strategy SS V from Slidegeeks and deliver a wonderful presentation. The following slide depicts KPI dashboard to review email campaign performance conducted by university. It includes elements such as open rate, click rate, emails sent, revenue by campaign, clicks, unique unsubscribes, etc.
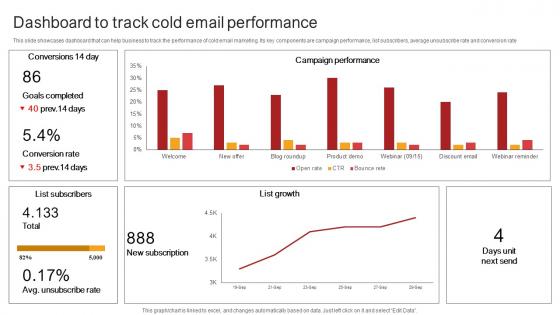
Remote Sales Plan For Dashboard To Track Cold Email Performance Strategy SS V
This slide showcases dashboard that can help business to track the performance of cold email marketing. Its key components are campaign performance, list subscribers, average unsubscribe rate and conversion rate. Slidegeeks is here to make your presentations a breeze with Remote Sales Plan For Dashboard To Track Cold Email Performance Strategy SS V With our easy-to-use and customizable templates, you can focus on delivering your ideas rather than worrying about formatting. With a variety of designs to choose from, you are sure to find one that suits your needs. And with animations and unique photos, illustrations, and fonts, you can make your presentation pop. So whether you are giving a sales pitch or presenting to the board, make sure to check out Slidegeeks first This slide showcases dashboard that can help business to track the performance of cold email marketing. Its key components are campaign performance, list subscribers, average unsubscribe rate and conversion rate.
Driving Results Designing A Team Members Performance Tracking Dashboards
This slide depicts performance tracking dashboard for project manager to analyze work being done by the team. It includes average rating for the week, total work done and weekly change, employee rating and work done. This Driving Results Designing A Team Members Performance Tracking Dashboards is perfect for any presentation, be it in front of clients or colleagues. It is a versatile and stylish solution for organizing your meetings. The Driving Results Designing A Team Members Performance Tracking Dashboards features a modern design for your presentation meetings. The adjustable and customizable slides provide unlimited possibilities for acing up your presentation. Slidegeeks has done all the homework before launching the product for you. So, do not wait, grab the presentation templates today This slide depicts performance tracking dashboard for project manager to analyze work being done by the team. It includes average rating for the week, total work done and weekly change, employee rating and work done.
Driving Results Designing A Team Training And Development Program Tracking Dashboard
This slide depicts team development program tracking dashboard to analyze the impact of implementing training plan for the members. It includes training satisfaction rate, engagement score, drop-out rate and top 5 trainees. Take your projects to the next level with our ultimate collection of Driving Results Designing A Team Training And Development Program Tracking Dashboard. Slidegeeks has designed a range of layouts that are perfect for representing task or activity duration, keeping track of all your deadlines at a glance. Tailor these designs to your exact needs and give them a truly corporate look with your own brand colors they will make your projects stand out from the rest This slide depicts team development program tracking dashboard to analyze the impact of implementing training plan for the members. It includes training satisfaction rate, engagement score, drop-out rate and top 5 trainees.
Comprehensive Guide For Website Various Kpis For Tracking Business Performance
Mentioned slide provide insights into various key performance indicators to determine business performance. It includes KPIs such as business financials, website traffic, customer case, customer engagement, conversion rate, customer retention, customer bounce rate, employee turnover, etc. Make sure to capture your audiences attention in your business displays with our gratis customizable Comprehensive Guide For Website Various Kpis For Tracking Business Performance. These are great for business strategies, office conferences, capital raising or task suggestions. If you desire to acquire more customers for your tech business and ensure they stay satisfied, create your own sales presentation with these plain slides. Mentioned slide provide insights into various key performance indicators to determine business performance. It includes KPIs such as business financials, website traffic, customer case, customer engagement, conversion rate, customer retention, customer bounce rate, employee turnover, etc.
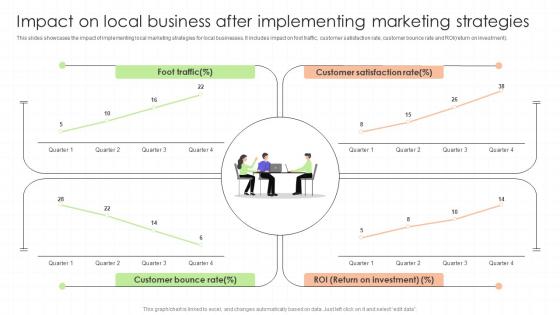
Impact On Local Business After Implementing Marketing Regional Marketing Plan To Boost Sales MKT SS
This slides showcases the impact of implementing local marketing strategies for local businesses. It includes impact on foot traffic, customer satisfaction rate, customer bounce rate and ROIreturn on investment.Present like a pro with Impact On Local Business After Implementing Marketing Regional Marketing Plan To Boost Sales MKT SS. Create beautiful presentations together with your team, using our easy-to-use presentation slides. Share your ideas in real-time and make changes on the fly by downloading our templates. So whether you are in the office, on the go, or in a remote location, you can stay in sync with your team and present your ideas with confidence. With Slidegeeks presentation got a whole lot easier. Grab these presentations today. This slides showcases the impact of implementing local marketing strategies for local businesses. It includes impact on foot traffic, customer satisfaction rate, customer bounce rate and ROIreturn on investment.

Employee Relations In Human Resource Dashboard To Analyze Employees Related Metrics Performance
This slide shows dashboard which can be used by organizations to measure the results of employee relation management. It includes metrics such as media coverage rate, social media engagement rate, share of voice and brand mentions. Present like a pro with Employee Relations In Human Resource Dashboard To Analyze Employees Related Metrics Performance. Create beautiful presentations together with your team, using our easy-to-use presentation slides. Share your ideas in real-time and make changes on the fly by downloading our templates. So whether you are in the office, on the go, or in a remote location, you can stay in sync with your team and present your ideas with confidence. With Slidegeeks presentation got a whole lot easier. Grab these presentations today. This slide shows dashboard which can be used by organizations to measure the results of employee relation management. It includes metrics such as media coverage rate, social media engagement rate, share of voice and brand mentions.
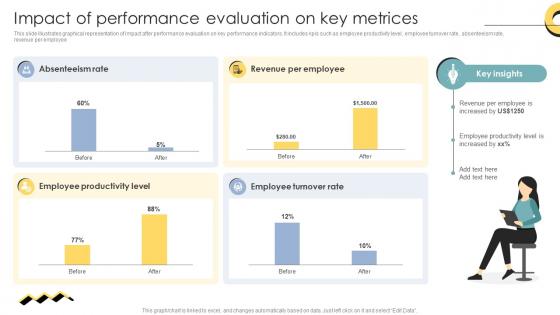
Skill Enhancement Performance Impact Of Performance Evaluation On Key Metrices
This slide illustrates graphical representation of impact after performance evaluation on key performance indicators. It includes kpis such as employee productivity level, employee turnover rate, absenteeism rate, revenue per employee. Do you have to make sure that everyone on your team knows about any specific topic I yes, then you should give Skill Enhancement Performance Impact Of Performance Evaluation On Key Metrices a try. Our experts have put a lot of knowledge and effort into creating this impeccable Skill Enhancement Performance Impact Of Performance Evaluation On Key Metrices. You can use this template for your upcoming presentations, as the slides are perfect to represent even the tiniest detail. You can download these templates from the Slidegeeks website and these are easy to edit. So grab these today This slide illustrates graphical representation of impact after performance evaluation on key performance indicators. It includes kpis such as employee productivity level, employee turnover rate, absenteeism rate, revenue per employee.


 Continue with Email

 Home
Home


