Price Table
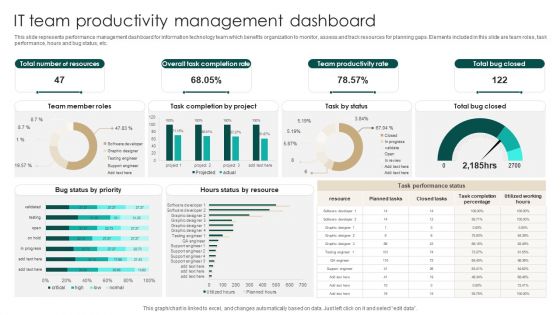
IT Team Productivity Management Dashboard Introduction PDF
This slide represents performance management dashboard for information technology team which benefits organization to monitor, assess and track resources for planning gaps. Elements included in this slide are team roles, task performance, hours and bug status, etc. Pitch your topic with ease and precision using this IT Team Productivity Management Dashboard Introduction PDF. This layout presents information on Total Number Resources, Overall Task Completion Rate, Team Productivity Rate. It is also available for immediate download and adjustment. So, changes can be made in the color, design, graphics or any other component to create a unique layout.
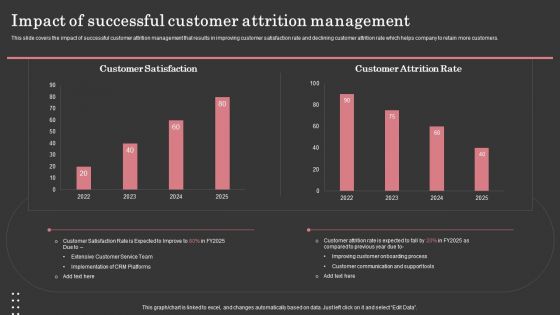
Impact Of Successful Customer Attrition Management Template PDF
This slide covers the impact of successful customer attrition management that results in improving customer satisfaction rate and declining customer attrition rate which helps company to retain more customers. This modern and well-arranged Impact Of Successful Customer Attrition Management Template PDF provides lots of creative possibilities. It is very simple to customize and edit with the Powerpoint Software. Just drag and drop your pictures into the shapes. All facets of this template can be edited with Powerpoint, no extra software is necessary. Add your own material, put your images in the places assigned for them, adjust the colors, and then you can show your slides to the world, with an animated slide included.
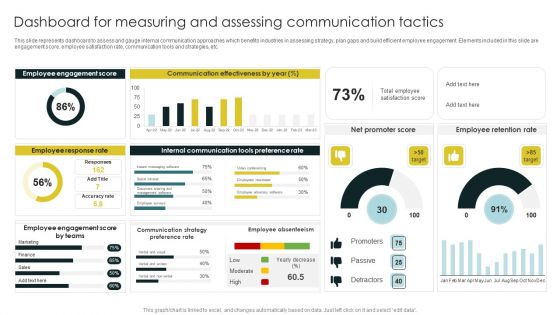
Dashboard For Measuring And Assessing Communication Tactics Information PDF
This slide represents dashboard to assess and gauge internal communication approaches which benefits industries in assessing strategy, plan gaps and build efficient employee engagement. Elements included in this slide are engagement score, employee satisfaction rate, communication tools and strategies, etc. Showcasing this set of slides titled Dashboard For Measuring And Assessing Communication Tactics Information PDF. The topics addressed in these templates are Employee Engagement, Employee Response Rate, Communication Effectiveness. All the content presented in this PPT design is completely editable. Download it and make adjustments in color, background, font etc. as per your unique business setting.

KPI Dashboard To Track Marketing Return On Investment Performance Background PDF
This slide shows key performance indicators dashboard to measure the performs of marketing campaign. It includes metrics such as campaign score, standard customers, growth rate, campaign income, etc. Showcasing this set of slides titled KPI Dashboard To Track Marketing Return On Investment Performance Background PDF. The topics addressed in these templates are Customer Distribution, Standard Customers, Growth Rate. All the content presented in this PPT design is completely editable. Download it and make adjustments in color, background, font etc. as per your unique business setting.
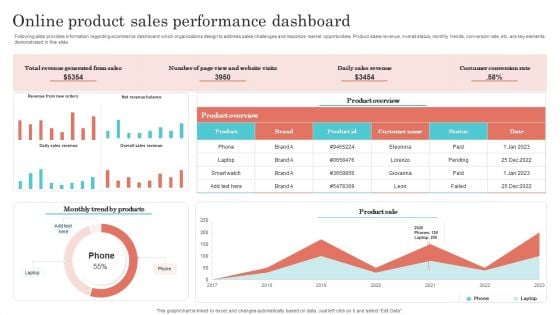
Online Product Sales Performance Dashboard Designs PDF
Following slide provides information regarding ecommerce dashboard which organizations design to address sales challenges and maximize market opportunities. Product sales revenue, overall status, monthly trends, conversion rate, etc. are key elements demonstrated in this slide. Showcasing this set of slides titled Online Product Sales Performance Dashboard Designs PDF. The topics addressed in these templates are Revenue Generated From Sales, Daily Sales Revenue, Costumer Conversion Rate. All the content presented in this PPT design is completely editable. Download it and make adjustments in color, background, font etc. as per your unique business setting.
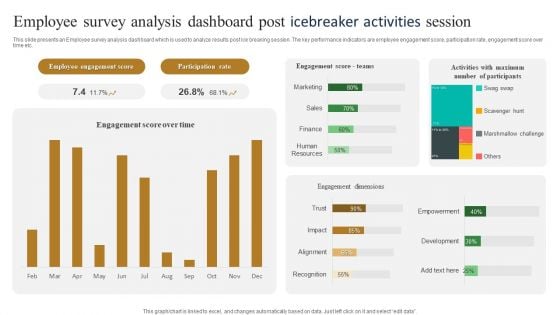
Employee Survey Analysis Dashboard Post Icebreaker Activities Session Slides PDF
This slide presents an Employee survey analysis dashboard which is used to analyze results post ice breaking session. The key performance indicators are employee engagement score, participation rate, engagement score over time etc. Pitch your topic with ease and precision using this Employee Survey Analysis Dashboard Post Icebreaker Activities Session Slides PDF. This layout presents information on Participation Rate, Employee Engagement Score. It is also available for immediate download and adjustment. So, changes can be made in the color, design, graphics or any other component to create a unique layout.
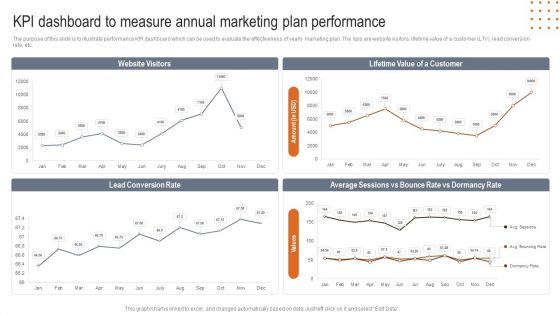
KPI Dashboard To Measure Annual Marketing Plan Performance Microsoft PDF
The purpose of this slide is to illustrate performance KPI dashboard which can be used to evaluate the effectiveness of yearly marketing plan. The kpis are website visitors, lifetime value of a customer LTV, lead conversion rate, etc. Showcasing this set of slides titled KPI Dashboard To Measure Annual Marketing Plan Performance Microsoft PDF. The topics addressed in these templates are Website Visitors, Lifetime Value Customer, Bounce Dormancy Rate. All the content presented in this PPT design is completely editable. Download it and make adjustments in color, background, font etc. as per your unique business setting.
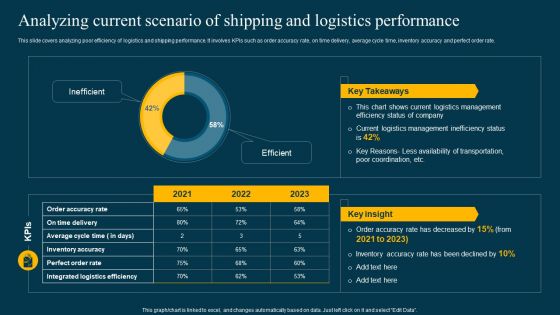
Analyzing Current Scenario Of Shipping And Logistics Performance Themes PDF
This slide covers analyzing poor efficiency of logistics and shipping performance. It involves KPIs such as order accuracy rate, on time delivery, average cycle time, inventory accuracy and perfect order rate. Create an editable Analyzing Current Scenario Of Shipping And Logistics Performance Themes PDF that communicates your idea and engages your audience. Whether youre presenting a business or an educational presentation, pre-designed presentation templates help save time. Analyzing Current Scenario Of Shipping And Logistics Performance Themes PDF is highly customizable and very easy to edit, covering many different styles from creative to business presentations. Slidegeeks has creative team members who have crafted amazing templates. So, go and get them without any delay.
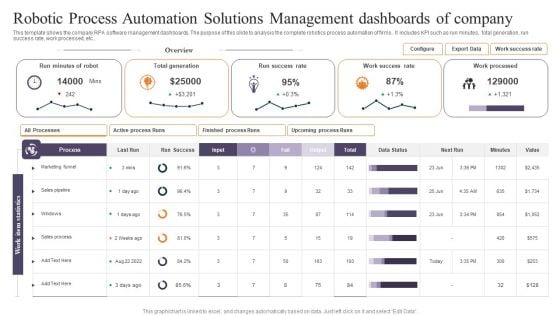
Robotic Process Automation Solutions Management Dashboards Of Company Elements PDF
This template shows the company RPA software management dashboards. The purpose of this slide to analysis the complete robotics process automation of firms . It includes KPI such as run minutes, total generation, run success rate, work processed, etc. Pitch your topic with ease and precision using this Robotic Process Automation Solutions Management Dashboards Of Company Elements PDF. This layout presents information on Minutes Of Robot, Total Generation, Success Rate. It is also available for immediate download and adjustment. So, changes can be made in the color, design, graphics or any other component to create a unique layout.
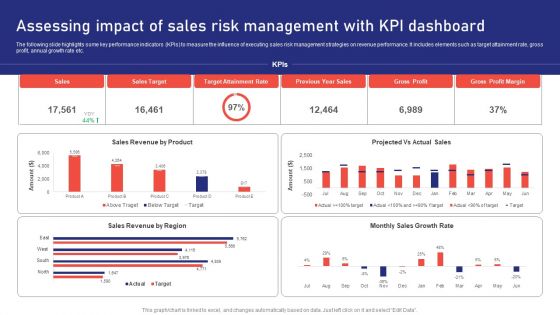
Sales Risk Assessment For Profit Maximization Assessing Impact Of Sales Risk Management With Kpi Dashboard Inspiration PDF
The following slide highlights some key performance indicators KPIs to measure the influence of executing sales risk management strategies on revenue performance. It includes elements such as target attainment rate, gross profit, annual growth rate etc. Find a pre designed and impeccable Sales Risk Assessment For Profit Maximization Assessing Impact Of Sales Risk Management With Kpi Dashboard Inspiration PDF. The templates can ace your presentation without additional effort. You can download these easy to edit presentation templates to make your presentation stand out from others. So, what are you waiting for Download the template from Slidegeeks today and give a unique touch to your presentation.
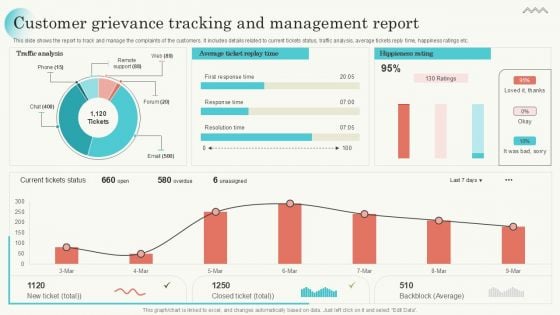
Customer Grievance Tracking And Management Report Portrait PDF
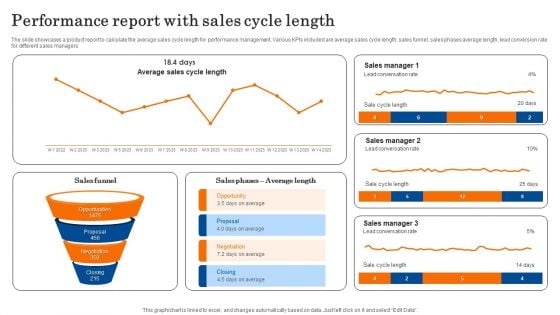
Performance Report With Sales Cycle Length Template PDF
The slide showcases a product report to calculate the average sales cycle length for performance management. Various KPIs included are average sales cycle length, sales funnel, sales phases average length, lead conversion rate for different sales managers. sPitch your topic with ease and precision using this Performance Report With Sales Cycle Length Template PDF. This layout presents information on Sales Manager, Conversation Rate, Opportunity. It is also available for immediate download and adjustment. So, changes can be made in the color, design, graphics or any other component to create a unique layout.
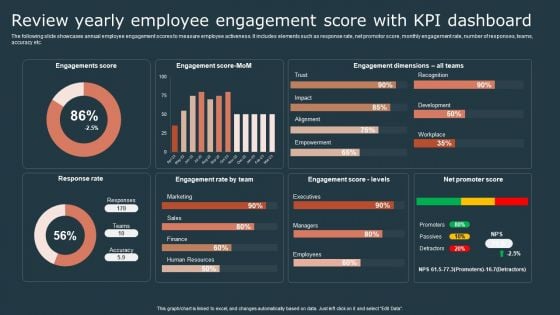
Effective Workforce Participation Action Planning Review Yearly Employee Engagement Portrait PDF
The following slide showcases annual employee engagement scores to measure employee activeness. It includes elements such as response rate, net promotor score, monthly engagement rate, number of responses, teams, accuracy etc. If your project calls for a presentation, then Slidegeeks is your go to partner because we have professionally designed, easy to edit templates that are perfect for any presentation. After downloading, you can easily edit Effective Workforce Participation Action Planning Review Yearly Employee Engagement Portrait PDF and make the changes accordingly. You can rearrange slides or fill them with different images. Check out all the handy templates.
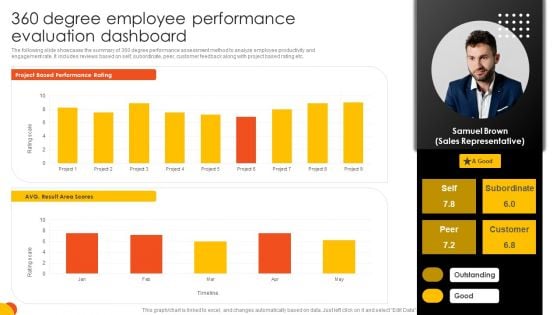
360 Degree Employee Performance Evaluation Dashboard Portrait PDF
The following slide showcases the summary of 360 degree performance assessment method to analyze employee productivity and engagement rate. It includes reviews based on self, subordinate, peer, customer feedback along with project based rating etc. Find a pre designed and impeccable 360 Degree Employee Performance Evaluation Dashboard Portrait PDF. The templates can ace your presentation without additional effort. You can download these easy to edit presentation templates to make your presentation stand out from others. So, what are you waiting for Download the template from Slidegeeks today and give a unique touch to your presentation.
Marketing Success Metrics Website Landing Page Kpi Tracking Dashboard Elements PDF
This slide covers a dashboard for analysing the metrics of the website landing page. It includes kpis such as conversions, conversion rate, sessions, bounce rate, engagement sickness, etc. From laying roadmaps to briefing everything in detail, our templates are perfect for you. You can set the stage with your presentation slides. All you have to do is download these easy-to-edit and customizable templates. Marketing Success Metrics Website Landing Page Kpi Tracking Dashboard Elements PDF will help you deliver an outstanding performance that everyone would remember and praise you for. Do download this presentation today.

KPI Dashboard Of Managing Innovative Business Project Ppt Pictures Show PDF
This slide shows the KPI dashboard of innovation project management. It covers the following KPIs such as innovation success rate, value in project, total revenue, active projects, etc. Pitch your topic with ease and precision using this KPI Dashboard Of Managing Innovative Business Project Ppt Pictures Show PDF. This layout presents information on Innovation Success Rate, Total Active Projects, Amount Mission. It is also available for immediate download and adjustment. So, changes can be made in the color, design, graphics or any other component to create a unique layout.
Yearly Status Report For Average Customer Effort Score Assessment Ppt Icon Layout Ideas PDF
The slide carries a summary report to assess average CES for predicting the customer behaviour and purchasing habits. Various elements included are average rating, yearly graphs and key takeaways. Pitch your topic with ease and precision using this Yearly Status Report For Average Customer Effort Score Assessment Ppt Icon Layout Ideas PDF. This layout presents information on Good Customer Experience, Easy To Purchase, Processes, Increase Churn Rate. It is also available for immediate download and adjustment. So, changes can be made in the color, design, graphics or any other component to create a unique layout.
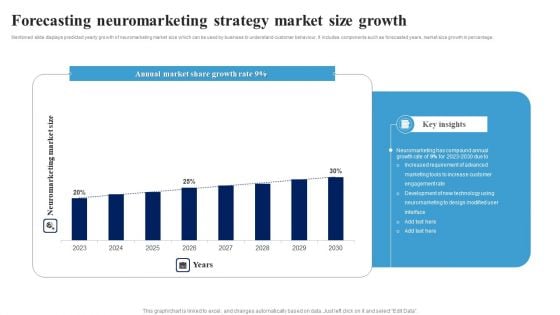
Forecasting Neuromarketing Strategy Market Size Growth Ppt Ideas Slideshow PDF
Mentioned slide displays predicted yearly growth of neuromarketing market size which can be used by business to understand customer behaviour. It includes components such as forecasted years, market size growth in percentage. Showcasing this set of slides titled Forecasting Neuromarketing Strategy Market Size Growth Ppt Ideas Slideshow PDF. The topics addressed in these templates are Annual Market Share, Growth Rate, Neuromarketing Compound, Annual Growth Rate. All the content presented in this PPT design is completely editable. Download it and make adjustments in color, background, font etc. as per your unique business setting.
Sales Performance Dashboard With Average Lead Tracking Time Background PDF
This slide showcases dashboard for sales performance that can help organization to analyze the effectiveness of sales campaigns and average response time of lead. Its key components are average contract value, average sales cycle length, follow up contract rate and sales activity. Showcasing this set of slides titled Sales Performance Dashboard With Average Lead Tracking Time Background PDF. The topics addressed in these templates are Avg Contract Value, Sales Activity, Contract Rate. All the content presented in this PPT design is completely editable. Download it and make adjustments in color, background, font etc. as per your unique business setting.
Website Leads Tracking Dashboard With Traffic Sources Infographics PDF
This slide showcases dashboard for lead generation that can help organziation to identify the traffic sources plus visitors and make changes in SEO of website. It also showcases key metrics that are bounce rate by week, visitors by user type, top channels by conversion, top campaign by conversion and top pages by conversion. Pitch your topic with ease and precision using this Website Leads Tracking Dashboard With Traffic Sources Infographics PDF. This layout presents information on Visitors User Type, Traffic Sources, Bounce Rate Week. It is also available for immediate download and adjustment. So, changes can be made in the color, design, graphics or any other component to create a unique layout.
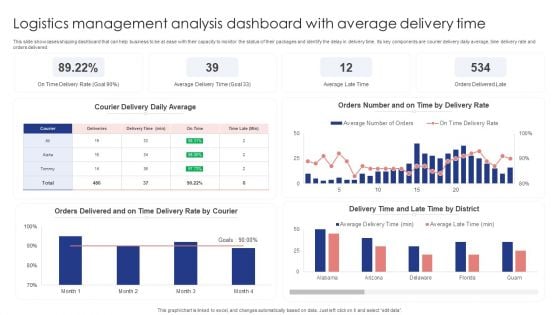
Logistics Management Analysis Dashboard With Average Delivery Time Themes PDF
This slide showcases shipping dashboard that can help business to be at ease with their capacity to monitor the status of their packages and identify the delay in delivery time. Its key components are courier delivery daily average, time delivery rate and orders delivered. Showcasing this set of slides titled Logistics Management Analysis Dashboard With Average Delivery Time Themes PDF. The topics addressed in these templates are Courier Delivery Daily Average, Delivery Rate, Orders Delivered. All the content presented in this PPT design is completely editable. Download it and make adjustments in color, background, font etc. as per your unique business setting.
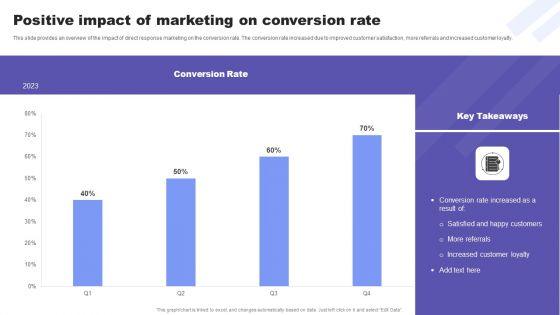
Direct Response Marketing Guide Ultimate Success Positive Impact Of Marketing On Diagrams PDF
This slide provides an overview of the impact of direct response marketing on the conversion rate. The conversion rate increased due to improved customer satisfaction, more referrals and increased customer loyalty. Make sure to capture your audiences attention in your business displays with our gratis customizable Direct Response Marketing Guide Ultimate Success Positive Impact Of Marketing On Diagrams PDF. These are great for business strategies, office conferences, capital raising or task suggestions. If you desire to acquire more customers for your tech business and ensure they stay satisfied, create your own sales presentation with these plain slides.
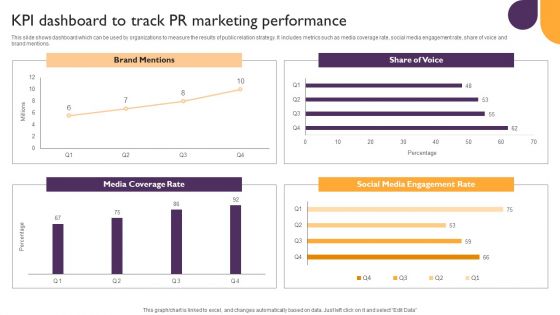
Public Relations Guide To Enhance Brand Credibility KPI Dashboard To Track PR Marketing Performance Diagrams PDF
This slide shows dashboard which can be used by organizations to measure the results of public relation strategy. It includes metrics such as media coverage rate, social media engagement rate, share of voice and brand mentions. Make sure to capture your audiences attention in your business displays with our gratis customizable Public Relations Guide To Enhance Brand Credibility KPI Dashboard To Track PR Marketing Performance Diagrams PDF. These are great for business strategies, office conferences, capital raising or task suggestions. If you desire to acquire more customers for your tech business and ensure they stay satisfied, create your own sales presentation with these plain slides.
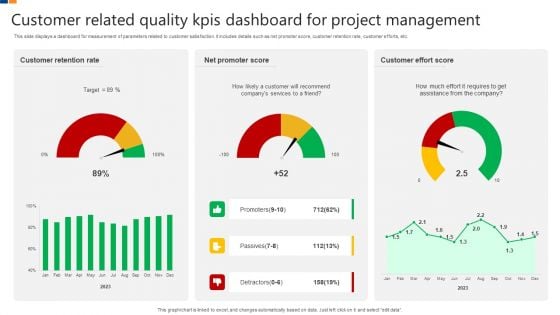
Customer Related Quality Kpis Dashboard For Project Management Brochure PDF
This slide displays a dashboard for measurement of parameters related to customer satisfaction. It includes details such as net promoter score, customer retention rate, customer efforts, etc. Showcasing this set of slides titled Customer Related Quality Kpis Dashboard For Project Management Brochure PDF. The topics addressed in these templates are Customer Retention Rate, Net Promoter Score, Customer Effort Score. All the content presented in this PPT design is completely editable. Download it and make adjustments in color, background, font etc. as per your unique business setting.
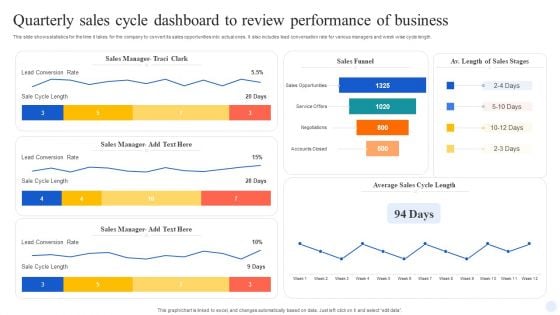
Quarterly Sales Cycle Dashboard To Review Performance Of Business Demonstration PDF
This slide shows statistics for the time it takes for the company to convert its sales opportunities into actual ones. It also includes lead conversation rate for various managers and week wise cycle length. Showcasing this set of slides titled Quarterly Sales Cycle Dashboard To Review Performance Of Business Demonstration PDF. The topics addressed in these templates are Sales Manager, Sales Funnel, Lead Conversion Rate. All the content presented in this PPT design is completely editable. Download it and make adjustments in color, background, font etc. as per your unique business setting.
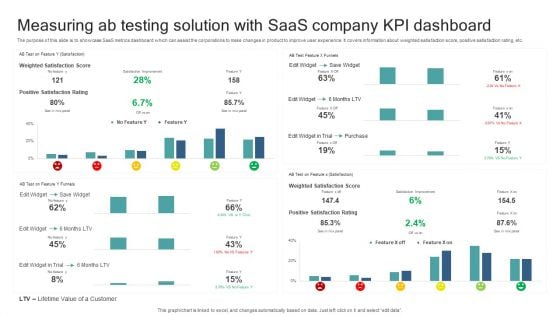
Measuring Ab Testing Solution With Saas Company KPI Dashboard Guidelines PDF
The purpose of this slide is to showcase SaaS metrics dashboard which can assist the corporations to make changes in product to improve user experience. It covers information about weighted satisfaction score, positive satisfaction rating, etc. Pitch your topic with ease and precision using this Measuring Ab Testing Solution With Saas Company KPI Dashboard Guidelines PDF. This layout presents information on Lifetime Value Customer, Positive Satisfaction Rating, Save Widget, Weighted Satisfaction Score. It is also available for immediate download and adjustment. So, changes can be made in the color, design, graphics or any other component to create a unique layout.
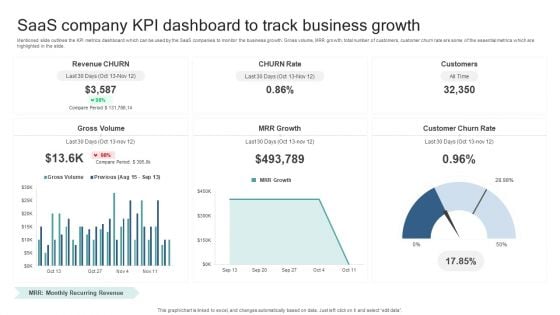
Saas Company KPI Dashboard To Track Business Growth Guidelines PDF
Mentioned slide outlines the KPI metrics dashboard which can be used by the SaaS companies to monitor the business growth. Gross volume, MRR growth, total number of customers, customer churn rate are some of the essential metrics which are highlighted in the slide. Showcasing this set of slides titled Saas Company KPI Dashboard To Track Business Growth Guidelines PDF. The topics addressed in these templates are Gross Volume, Mrr Growth, Customer Churn Rate. All the content presented in this PPT design is completely editable. Download it and make adjustments in color, background, font etc. as per your unique business setting.
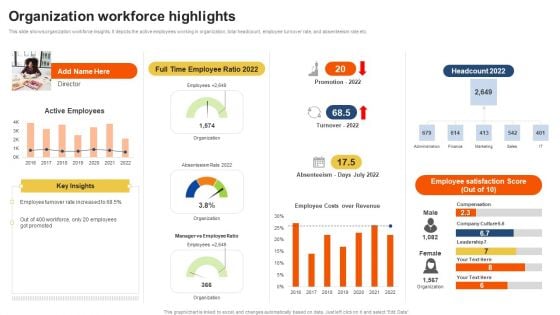
Staff Performance Evaluation Process Organization Workforce Highlights Guidelines PDF
This slide shows organization workforce insights. It depicts the active employees working in organization, total headcount, employee turnover rate, and absenteeism rate etc. Make sure to capture your audiences attention in your business displays with our gratis customizable Staff Performance Evaluation Process Organization Workforce Highlights Guidelines PDF. These are great for business strategies, office conferences, capital raising or task suggestions. If you desire to acquire more customers for your tech business and ensure they stay satisfied, create your own sales presentation with these plain slides.
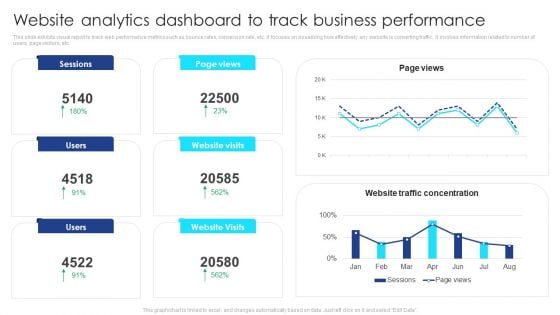
Website Analytics Dashboard To Track Business Performance Guidelines PDF
This slide exhibits visual report to track web performance metrics such as bounce rates, conversion rate, etc. It focuses on visualizing how effectively any website is converting traffic. It involves information related to number of users, page visitors, etc. Pitch your topic with ease and precision using this Website Analytics Dashboard To Track Business Performance Guidelines PDF. This layout presents information on Website Analytics, Dashboard To Track, Business Performance. It is also available for immediate download and adjustment. So, changes can be made in the color, design, graphics or any other component to create a unique layout.

Identifying And Increasing Brand Awareness Current Issues Faced By Company Diagrams PDF
This slide covers the current issues faced by company such as rise in bounce rate and low conversion rate due to low-quality content, slow loading time, ad heavy images, lack of sufficient information, poor website performance, etc. Want to ace your presentation in front of a live audience Our Identifying And Increasing Brand Awareness Current Issues Faced By Company Diagrams PDF can help you do that by engaging all the users towards you.. Slidegeeks experts have put their efforts and expertise into creating these impeccable powerpoint presentations so that you can communicate your ideas clearly. Moreover, all the templates are customizable, and easy-to-edit and downloadable. Use these for both personal and commercial use.
Cyber Security Cases Action Plan Risk Tracking Dashboard For Response Ppt PowerPoint Presentation File Graphics Example PDF
This slide highlights dashboard to identify and track security threats occurred in the company. The purpose of this template is to provide information to the management about severities of the incidents along with risk rating in form of heat map. Showcasing this set of slides titled Cyber Security Cases Action Plan Risk Tracking Dashboard For Response Ppt PowerPoint Presentation File Graphics Example PDF. The topics addressed in these templates are Risk Heat Map, Action Plan Breakdown, Risk Rating Breakdown. All the content presented in this PPT design is completely editable. Download it and make adjustments in color, background, font etc. as per your unique business setting.
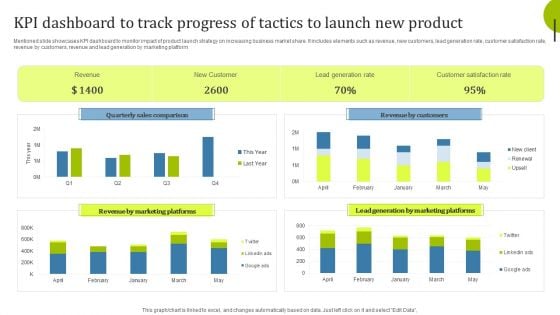
Kpi Dashboard To Track Progress Of Tactics To Launch New Product Infographics PDF
Mentioned slide showcases KPI dashboard to monitor impact of product launch strategy on increasing business market share. It includes elements such as revenue, new customers, lead generation rate, customer satisfaction rate, revenue by customers, revenue and lead generation by marketing platform. Showcasing this set of slides titled Kpi Dashboard To Track Progress Of Tactics To Launch New Product Infographics PDF. The topics addressed in these templates are Quarterly Sales Comparison, Revenue Marketing, Revenue Customers. All the content presented in this PPT design is completely editable. Download it and make adjustments in color, background, font etc. as per your unique business setting.
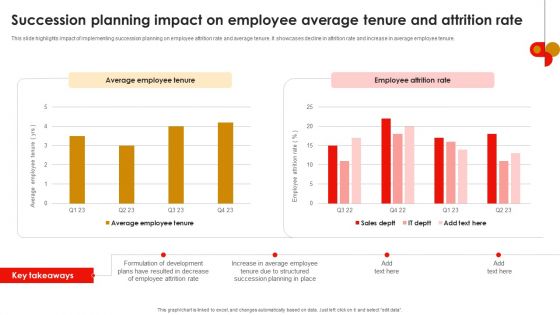
Strategic Talent Development Succession Planning Impact On Employee Average Tenure Ideas PDF
This slide highlights impact of implementing succession planning on employee attrition rate and average tenure. It showcases decline in attrition rate and increase in average employee tenure. Want to ace your presentation in front of a live audience Our Strategic Talent Development Succession Planning Impact On Employee Average Tenure Ideas PDF can help you do that by engaging all the users towards you.. Slidegeeks experts have put their efforts and expertise into creating these impeccable powerpoint presentations so that you can communicate your ideas clearly. Moreover, all the templates are customizable, and easy-to-edit and downloadable. Use these for both personal and commercial use.
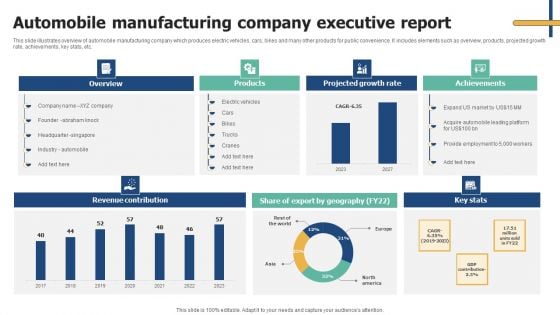
Automobile Manufacturing Company Executive Report Elements PDF
This slide illustrates overview of automobile manufacturing company which produces electric vehicles, cars, bikes and many other products for public convenience. It includes elements such as overview, products, projected growth rate, achievements, key stats, etc. Showcasing this set of slides titled Automobile Manufacturing Company Executive Report Elements PDF. The topics addressed in these templates are Overview, Products, Projected Growth Rate. All the content presented in this PPT design is completely editable. Download it and make adjustments in color, background, font etc. as per your unique business setting.
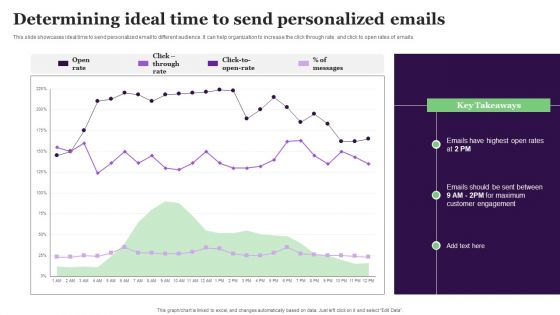
Determining Ideal Time To Send Personalized Emails Demonstration PDF
This slide showcases ideal time to send personalized email to different audience. It can help organization to increase the click through rate and click to open rates of emails. Create an editable Determining Ideal Time To Send Personalized Emails Demonstration PDF that communicates your idea and engages your audience. Whether you are presenting a business or an educational presentation, pre-designed presentation templates help save time. Determining Ideal Time To Send Personalized Emails Demonstration PDF is highly customizable and very easy to edit, covering many different styles from creative to business presentations. Slidegeeks has creative team members who have crafted amazing templates. So, go and get them without any delay.
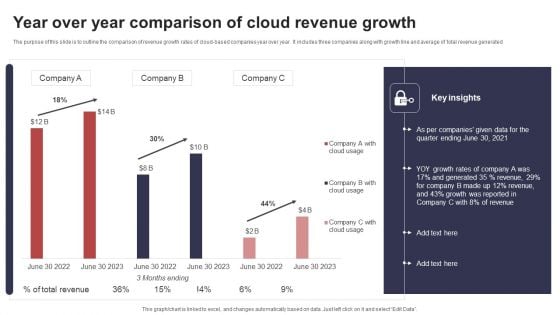
Year Over Year Comparison Of Cloud Revenue Growth Sample PDF
The purpose of this slide is to outline the comparison of revenue growth rates of cloud based companies year over year. It includes three companies along with growth line and average of total revenue generated. Showcasing this set of slides titled Year Over Year Comparison Of Cloud Revenue Growth Sample PDF. The topics addressed in these templates are Yoy Growth Rates, Generated, Growth Reported. All the content presented in this PPT design is completely editable. Download it and make adjustments in color, background, font etc. as per your unique business setting.
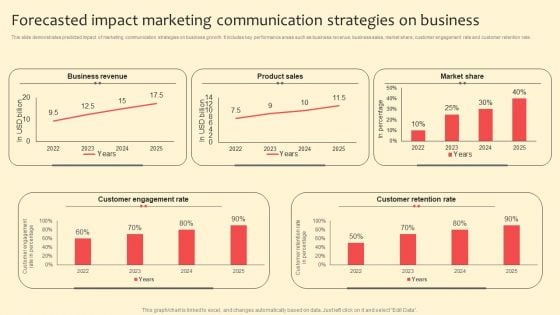
Forecasted Impact Marketing Communication Strategies On Business Structure PDF
This slide demonstrates predicted impact of marketing communication strategies on business growth. It includes key performance areas such as business revenue, business sales, market share, customer engagement rate and customer retention rate. Boost your pitch with our creative Forecasted Impact Marketing Communication Strategies On Business Structure PDF. Deliver an awe inspiring pitch that will mesmerize everyone. Using these presentation templates you will surely catch everyones attention. You can browse the ppts collection on our website. We have researchers who are experts at creating the right content for the templates. So you do not have to invest time in any additional work. Just grab the template now and use them.
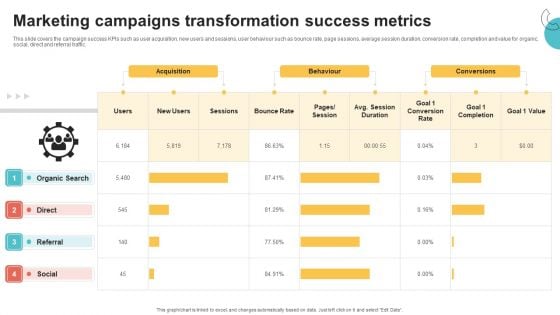
Digital Marketing Toolkit Marketing Campaigns Transformation Success Metrics Rules PDF
This slide covers the campaign success KPIs such as user acquisition, new users and sessions, user behaviour such as bounce rate, page sessions, average session duration, conversion rate, completion and value for organic, social, direct and referral traffic. Make sure to capture your audiences attention in your business displays with our gratis customizable Digital Marketing Toolkit Marketing Campaigns Transformation Success Metrics Rules PDF. These are great for business strategies, office conferences, capital raising or task suggestions. If you desire to acquire more customers for your tech business and ensure they stay satisfied, create your own sales presentation with these plain slides.
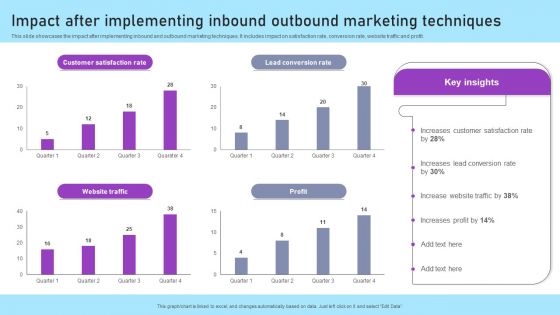
Inbound And Outbound Marketing Tactics Impact After Implementing Inbound Outbound Summary PDF
This slide showcases the impact after implementing inbound and outbound marketing techniques. It includes impact on satisfaction rate, conversion rate, website traffic and profit. Want to ace your presentation in front of a live audience Our Inbound And Outbound Marketing Tactics Impact After Implementing Inbound Outbound Summary PDF can help you do that by engaging all the users towards you. Slidegeeks experts have put their efforts and expertise into creating these impeccable powerpoint presentations so that you can communicate your ideas clearly. Moreover, all the templates are customizable, and easy to edit and downloadable. Use these for both personal and commercial use.
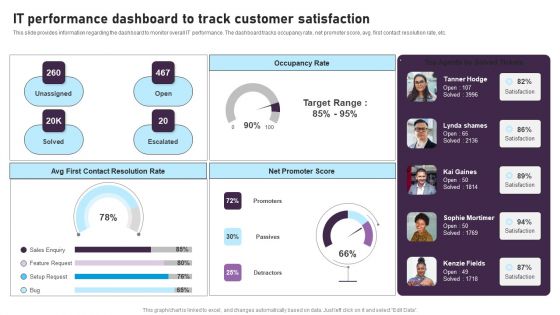
IT Performance Dashboard To Track Customer Satisfaction Designs PDF
This slide provides information regarding the dashboard to monitor overall IT performance. The dashboard tracks occupancy rate, net promoter score, avg. first contact resolution rate, etc. Crafting an eye-catching presentation has never been more straightforward. Let your presentation shine with this tasteful yet straightforward IT Performance Dashboard To Track Customer Satisfaction Designs PDF template. It offers a minimalistic and classy look that is great for making a statement. The colors have been employed intelligently to add a bit of playfulness while still remaining professional. Construct the ideal IT Performance Dashboard To Track Customer Satisfaction Designs PDF that effortlessly grabs the attention of your audience Begin now and be certain to wow your customers
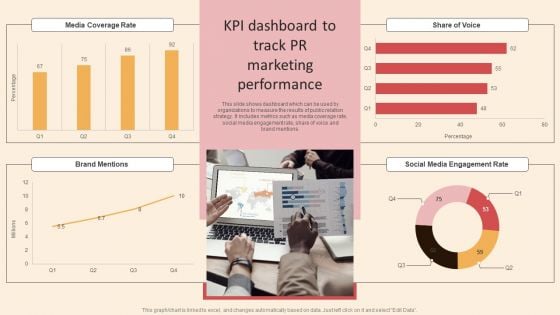
Online PR Techniques To Boost Brands Online Visibility KPI Dashboard To Track PR Marketing Summary PDF
This slide shows dashboard which can be used by organizations to measure the results of public relation strategy. It includes metrics such as media coverage rate, social media engagement rate, share of voice and brand mentions. Make sure to capture your audiences attention in your business displays with our gratis customizable Online PR Techniques To Boost Brands Online Visibility KPI Dashboard To Track PR Marketing Summary PDF. These are great for business strategies, office conferences, capital raising or task suggestions. If you desire to acquire more customers for your tech business and ensure they stay satisfied, create your own sales presentation with these plain slides.
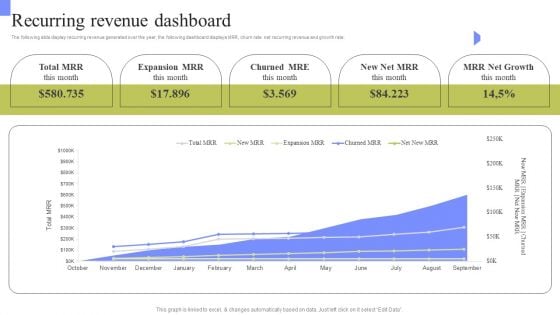
Periodic Revenue Model Recurring Revenue Dashboard Infographics PDF
The following slide display recurring revenue generated over the year, the following dashboard displays MRR, churn rate net recurring revenue and growth rate. Slidegeeks is one of the best resources for PowerPoint templates. You can download easily and regulate Periodic Revenue Model Recurring Revenue Dashboard Infographics PDF for your personal presentations from our wonderful collection. A few clicks is all it takes to discover and get the most relevant and appropriate templates. Use our Templates to add a unique zing and appeal to your presentation and meetings. All the slides are easy to edit and you can use them even for advertisement purposes.
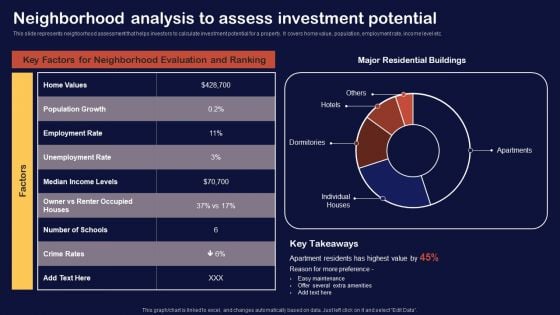
Synopsis For House Flipping Techniques Neighborhood Analysis To Assess Investment Potential Infographics PDF
This slide represents neighborhood assessment that helps investors to calculate investment potential for a property. It covers home value, population, employment rate, income level etc. Slidegeeks has constructed Synopsis For House Flipping Techniques Neighborhood Analysis To Assess Investment Potential Infographics PDF after conducting extensive research and examination. These presentation templates are constantly being generated and modified based on user preferences and critiques from editors. Here, you will find the most attractive templates for a range of purposes while taking into account ratings and remarks from users regarding the content. This is an excellent jumping off point to explore our content and will give new users an insight into our top notch PowerPoint Templates.
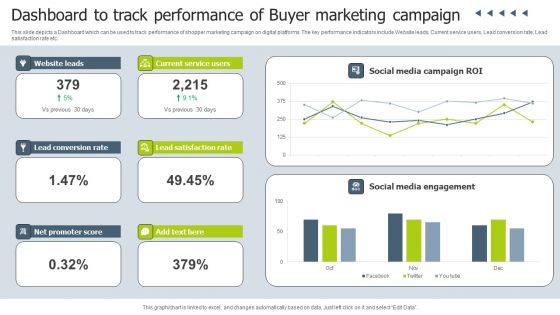
Dashboard To Track Performance Of Buyer Marketing Campaign Infographics PDF
This slide depicts a Dashboard which can be used to track performance of shopper marketing campaign on digital platforms. The key performance indicators include Website leads, Current service users, Lead conversion rate, Lead satisfaction rate etc. Pitch your topic with ease and precision using this Dashboard To Track Performance Of Buyer Marketing Campaign Infographics PDF. This layout presents information on Social Media Campaign, Social Media Engagement, Current Service Users. It is also available for immediate download and adjustment. So, changes can be made in the color, design, graphics or any other component to create a unique layout.
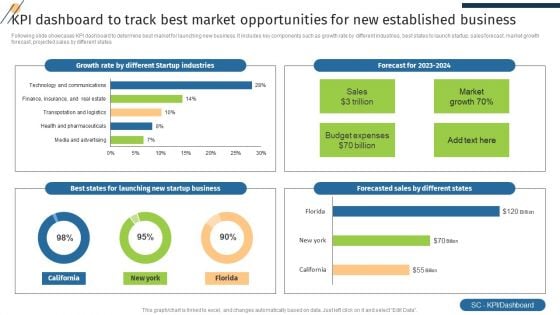
KPI Dashboard To Track Best Market Opportunities For New Established Business Pictures PDF
Following slide showcases KPI dashboard to determine best market for launching new business. It includes key components such as growth rate by different industries, best states to launch startup, sales forecast, market growth forecast, projected sales by different states. Showcasing this set of slides titled KPI Dashboard To Track Best Market Opportunities For New Established Business Pictures PDF. The topics addressed in these templates are Forecasted Sales, Growth Rate, Startup Industries. All the content presented in this PPT design is completely editable. Download it and make adjustments in color, background, font etc. as per your unique business setting.
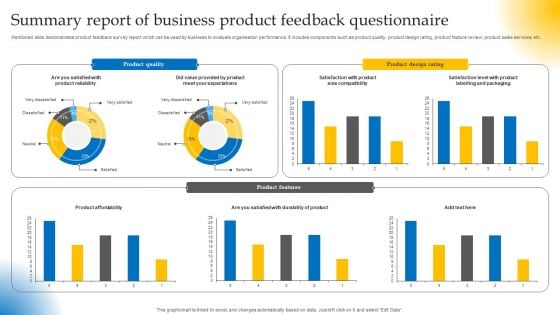
Summary Report Of Business Product Feedback Questionnaire Survey SS
Mentioned slide demonstrates product feedback survey report which can be used by business to evaluate organisation performance. It includes components such as product quality, product design rating, product feature review, product sales services, etc. Showcasing this set of slides titled Summary Report Of Business Product Feedback Questionnaire Survey SS. The topics addressed in these templates are Product Quality, Product Design Rating, Product Features. All the content presented in this PPT design is completely editable. Download it and make adjustments in color, background, font etc. as per your unique business setting.
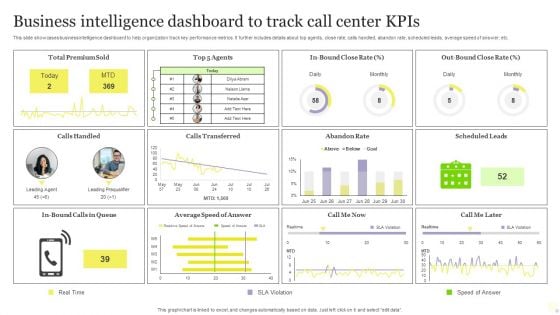
Business Intelligence Dashboard To Track Call Center Kpis Download PDF
This slide showcases business intelligence dashboard to help organization track key performance metrics. It further includes details about top agents, close rate, calls handled, abandon rate, scheduled leads, average speed of answer, etc. Pitch your topic with ease and precision using this Business Intelligence Dashboard To Track Call Center Kpis Download PDF. This layout presents information on Business Intelligence Dashboard, Track Call Center Kpis. It is also available for immediate download and adjustment. So, changes can be made in the color, design, graphics or any other component to create a unique layout.
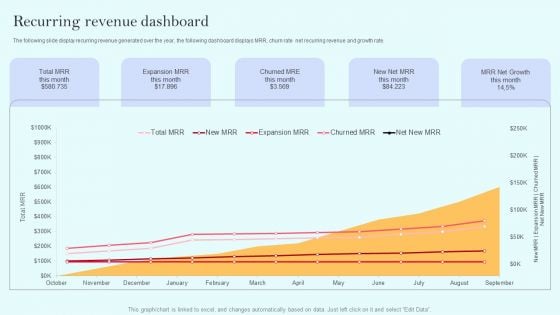
Recurring Income Generation Model Recurring Revenue Dashboard Pictures PDF
The following slide display recurring revenue generated over the year, the following dashboard displays MRR, churn rate net recurring revenue and growth rate. Explore a selection of the finest Recurring Income Generation Model Recurring Revenue Dashboard Pictures PDF here. With a plethora of professionally designed and pre made slide templates, you can quickly and easily find the right one for your upcoming presentation. You can use our Recurring Income Generation Model Recurring Revenue Dashboard Pictures PDF to effectively convey your message to a wider audience. Slidegeeks has done a lot of research before preparing these presentation templates. The content can be personalized and the slides are highly editable. Grab templates today from Slidegeeks.
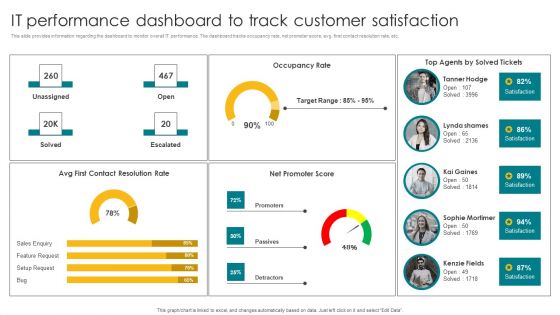
IT Performance Dashboard To Track Customer Satisfaction Elements PDF
This slide provides information regarding the dashboard to monitor overall IT performance. The dashboard tracks occupancy rate, net promoter score, avg. first contact resolution rate, etc. Boost your pitch with our creative IT Performance Dashboard To Track Customer Satisfaction Elements PDF. Deliver an awe inspiring pitch that will mesmerize everyone. Using these presentation templates you will surely catch everyones attention. You can browse the ppts collection on our website. We have researchers who are experts at creating the right content for the templates. So you do not have to invest time in any additional work. Just grab the template now and use them.
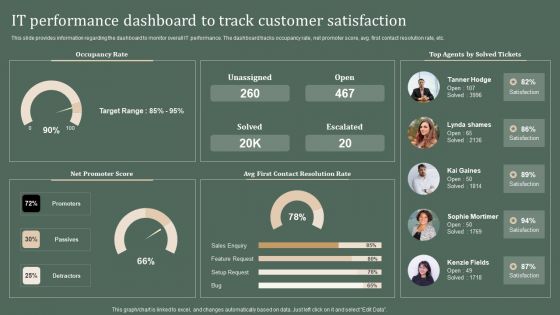
Deploying Corporate Aligned IT Strategy IT Performance Dashboard To Track Customer Satisfaction Clipart PDF
This slide provides information regarding the dashboard to monitor overall IT performance. The dashboard tracks occupancy rate, net promoter score, avg. first contact resolution rate, etc. Boost your pitch with our creative Deploying Corporate Aligned IT Strategy IT Performance Dashboard To Track Customer Satisfaction Clipart PDF. Deliver an awe inspiring pitch that will mesmerize everyone. Using these presentation templates you will surely catch everyones attention. You can browse the ppts collection on our website. We have researchers who are experts at creating the right content for the templates. So you do not have to invest time in any additional work. Just grab the template now and use them.
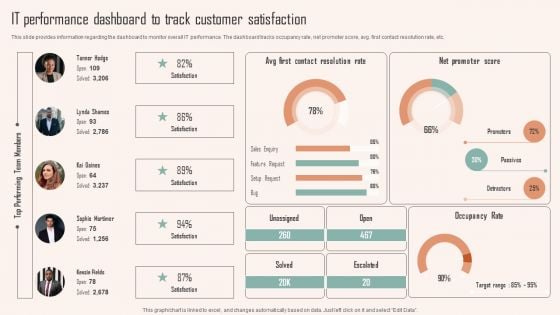
IT Performance Dashboard To Track Customer Satisfaction Ppt PowerPoint Presentation File Styles PDF
This slide provides information regarding the dashboard to monitor overall IT performance. The dashboard tracks occupancy rate, net promoter score, avg. first contact resolution rate, etc. The IT Performance Dashboard To Track Customer Satisfaction Ppt PowerPoint Presentation File Styles PDF is a compilation of the most recent design trends as a series of slides. It is suitable for any subject or industry presentation, containing attractive visuals and photo spots for businesses to clearly express their messages. This template contains a variety of slides for the user to input data, such as structures to contrast two elements, bullet points, and slides for written information. Slidegeeks is prepared to create an impression.
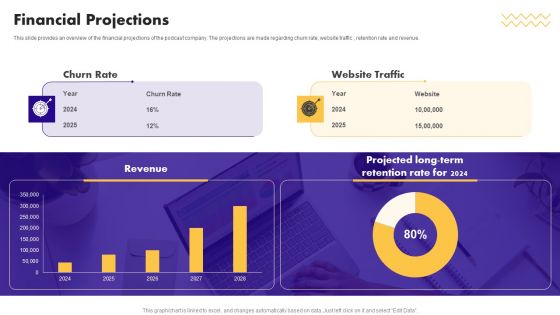
Audio Centric Firm Capital Raising Pitch Deck Financial Projections Mockup PDF
This slide provides an overview of the financial projections of the podcast company. The projections are made regarding churn rate, website traffic , retention rate and revenue. Make sure to capture your audiences attention in your business displays with our gratis customizable Audio Centric Firm Capital Raising Pitch Deck Financial Projections Mockup PDF. These are great for business strategies, office conferences, capital raising or task suggestions. If you desire to acquire more customers for your tech business and ensure they stay satisfied, create your own sales presentation with these plain slides.
Online Marketing Analytics To Enhance Business Growth Website Landing Page KPI Tracking Dashboard Sample PDF
This slide covers a dashboard for analyzing the metrics of the website landing page. It includes KPIs such as conversions, conversion rate, sessions, bounce rate, engagement sickness, etc. If your project calls for a presentation, then Slidegeeks is your go to partner because we have professionally designed, easy to edit templates that are perfect for any presentation. After downloading, you can easily edit Online Marketing Analytics To Enhance Business Growth Website Landing Page KPI Tracking Dashboard Sample PDF and make the changes accordingly. You can rearrange slides or fill them with different images. Check out all the handy templates
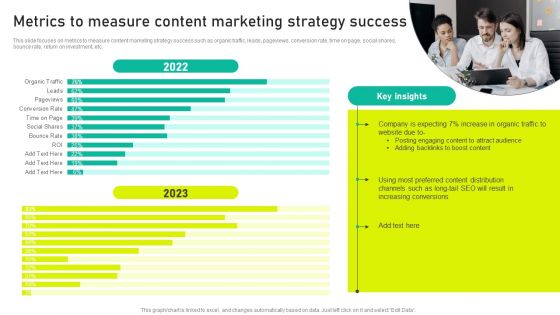
Metrics To Measure Content Marketing Strategy Success Ppt Infographic Template Files PDF
This slide focuses on metrics to measure content marketing strategy success such as organic traffic, leads, pageviews, conversion rate, time on page, social shares, bounce rate, return on investment, etc. The best PPT templates are a great way to save time, energy, and resources. Slidegeeks have 100 percent editable powerpoint slides making them incredibly versatile. With these quality presentation templates, you can create a captivating and memorable presentation by combining visually appealing slides and effectively communicating your message. Download Metrics To Measure Content Marketing Strategy Success Ppt Infographic Template Files PDF from Slidegeeks and deliver a wonderful presentation.
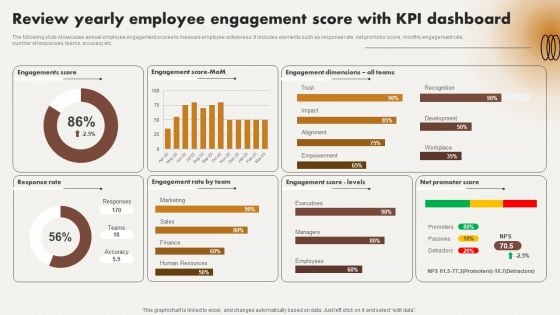
Review Yearly Employee Engagement Score With Kpi Dashboard Ppt Pictures Design Ideas PDF
The following slide showcases annual employee engagement scores to measure employee activeness. It includes elements such as response rate, net promotor score, monthly engagement rate, number of responses, teams, accuracy etc. From laying roadmaps to briefing everything in detail, our templates are perfect for you. You can set the stage with your presentation slides. All you have to do is download these easy to edit and customizable templates. Review Yearly Employee Engagement Score With Kpi Dashboard Ppt Pictures Design Ideas PDF will help you deliver an outstanding performance that everyone would remember and praise you for. Do download this presentation today.
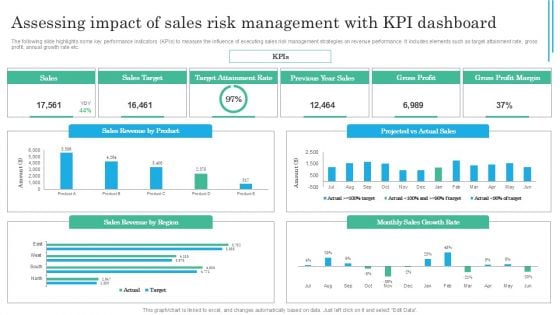
Implementing Sales Volatility Management Techniques Assessing Impact Of Sales Risk Management Topics PDF

Global Construction Sector Industry Report Global Construction Market Segmentation Europe Introduction PDF
This slide represents global construction market segmentation for Europe. It highlights GDP rate, employment rate, gender diversity in workforce, annual turnover etc. Create an editable Global Construction Sector Industry Report Global Construction Market Segmentation Europe Introduction PDF that communicates your idea and engages your audience. Whether youre presenting a business or an educational presentation, pre designed presentation templates help save time. Global Construction Sector Industry Report Global Construction Market Segmentation Europe Introduction PDF is highly customizable and very easy to edit, covering many different styles from creative to business presentations. Slidegeeks has creative team members who have crafted amazing templates. So, go and get them without any delay.
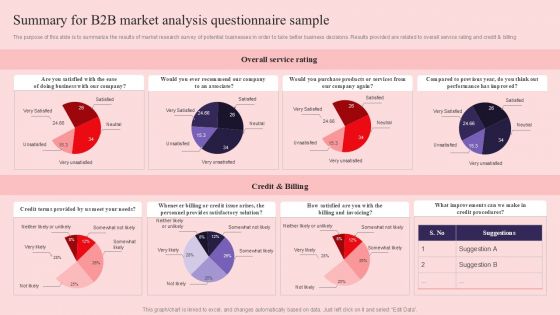
Summary For B2B Market Analysis Questionnaire Sample Survey SS
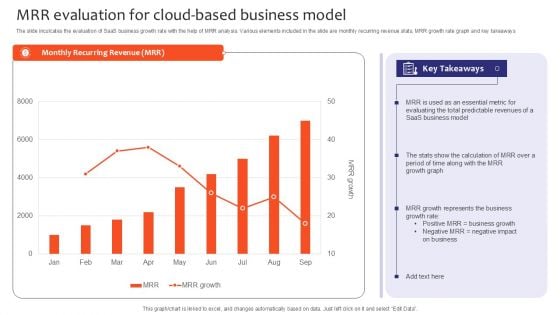
MRR Evaluation For Cloud Based Business Model Slides PDF
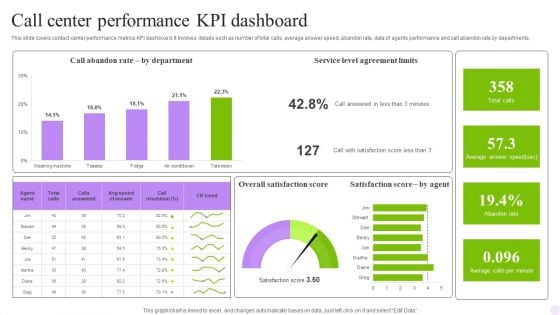
Call Center Performance KPI Dashboard Formats PDF
This slide covers contact center performance metrics KPI dashboard. It involves details such as number of total calls, average answer speed, abandon rate, data of agents performance and call abandon rate by departments. Showcasing this set of slides titled Call Center Performance KPI Dashboard Formats PDF. The topics addressed in these templates are Department, Dashboard, Agreement Limits. All the content presented in this PPT design is completely editable. Download it and make adjustments in color, background, font etc. as per your unique business setting.


 Continue with Email

 Home
Home


