Private Equity Dashboard
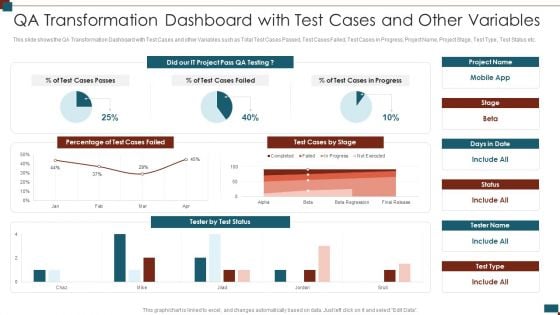
Successful Quality Assurance Transition Techniques To Enhance Product Quality Qa Transformation Dashboard Brochure PDF
This slide shows the QA Transformation Dashboard with Test Cases and other Variables such as Total Test Cases Passed, Test Cases Failed, Test Cases in Progress, Project Name, Project Stage, Test Type, Test Status etc. Deliver an awe inspiring pitch with this creative successful quality assurance transition techniques to enhance product quality qa transformation dashboard brochure pdf bundle. Topics like qa transformation dashboard with test cases and other variables can be discussed with this completely editable template. It is available for immediate download depending on the needs and requirements of the user.
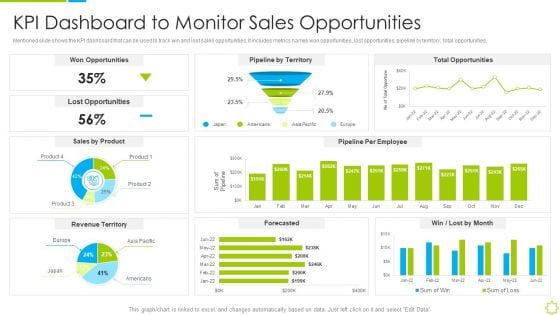
Launch New Sales Enablement Program Lead Generation KPI Dashboard To Monitor Sales Topics PDF
Mentioned slide shows the KPI dashboard that can be used to track win and lost sales opportunities. It includes metrics namely won opportunities, lost opportunities, pipeline by territory, total opportunities. Deliver and pitch your topic in the best possible manner with this launch new sales enablement program lead generation kpi dashboard to monitor sales topics pdf. Use them to share invaluable insights on kpi dashboard to monitor sales opportunities and impress your audience. This template can be altered and modified as per your expectations. So, grab it now.
Key Practices To Create Sales Playbook Sales Management Activities Tracking Dashboard Mockup PDF
This slide provides information regarding sales management activities tracking dashboard to measure closed business, sales pipeline, sales activity by sales rep, month over month growth, forecast by month, etc. Deliver and pitch your topic in the best possible manner with this key practices to create sales playbook sales management activities tracking dashboard mockup pdf Use them to share invaluable insights on sales management activities tracking dashboard and impress your audience. This template can be altered and modified as per your expectations. So, grab it now.
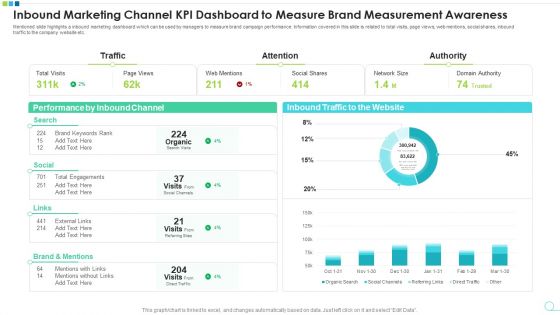
Inbound Marketing Channel KPI Dashboard To Measure Brand Measurement Awareness Pictures PDF
Mentioned slide highlights a inbound marketing dashboard which can be used by managers to measure brand campaign performance. Information covered in this slide is related to total visits, page views, web mentions, social shares, inbound traffic to the company website etc. Pitch your topic with ease and precision using this inbound marketing channel kpi dashboard to measure brand measurement awareness pictures pdf. This layout presents information on inbound marketing channel kpi dashboard to measure brand measurement awareness. It is also available for immediate download and adjustment. So, changes can be made in the color, design, graphics or any other component to create a unique layout.
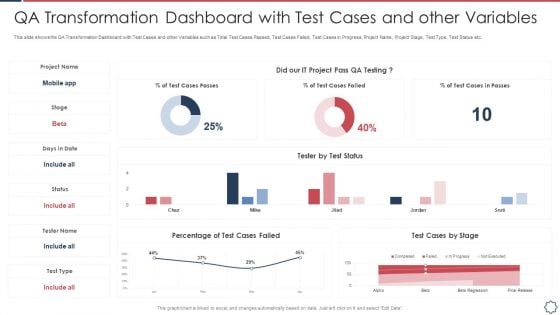
Quality Assurance Transformation Strategies To Improve Business Performance Efficiency QA Transformation Dashboard Inspiration PDF
This slide shows the QA Transformation Dashboard with Test Cases and other Variables such as Total Test Cases Passed, Test Cases Failed, Test Cases in Progress, Project Name, Project Stage, Test Type, Test Status etc. Deliver and pitch your topic in the best possible manner with this quality assurance transformation strategies to improve business performance efficiency qa transformation dashboard inspiration pdf. Use them to share invaluable insights on qa transformation dashboard with test cases and other variables and impress your audience. This template can be altered and modified as per your expectations. So, grab it now.
Application Sources For Recruitment On Social Media Tracking Dashboard Microsoft PDF
This slide covers the dashboard for tracking the count of applicants profiles from various sources. It includes the open positions, new roles, total roles, candidates placed , application sources, client decline rates and commission received. Pitch your topic with ease and precision using this application sources for recruitment on social media tracking dashboard microsoft pdf. This layout presents information on application sources for recruitment on social media tracking dashboard. It is also available for immediate download and adjustment. So, changes can be made in the color, design, graphics or any other component to create a unique layout.
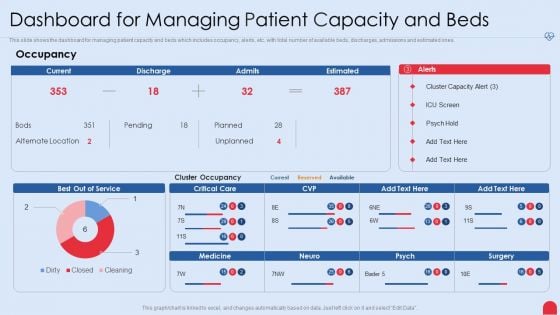
Enhancing Hospital Software System Dashboard For Managing Patient Capacity And Beds Brochure PDF
This slide shows the dashboard for managing patient capacity and beds which includes occupancy, alerts, etc, with total number of available beds, discharges, admissions and estimated ones. Deliver and pitch your topic in the best possible manner with this enhancing hospital software system dashboard for managing patient capacity and beds brochure pdf. Use them to share invaluable insights on dashboard for managing patient capacity and beds and impress your audience. This template can be altered and modified as per your expectations. So, grab it now.
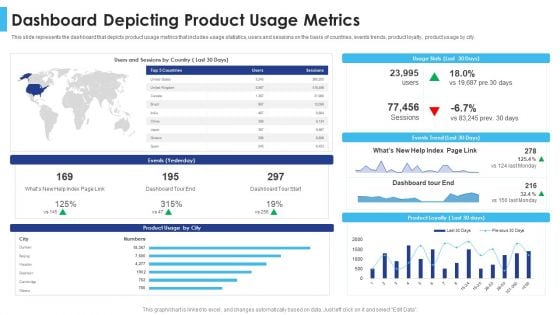
Satisfying Consumers Through Strategic Product Building Plan Dashboard Depicting Product Usage Metrics Inspiration PDF
This slide represents the dashboard that depicts product usage metrics that includes usage statistics, users and sessions on the basis of countries, events trends, product loyalty, product usage by city. Deliver and pitch your topic in the best possible manner with this satisfying consumers through strategic product building plan dashboard depicting product usage metrics inspiration pdf. Use them to share invaluable insights on dashboard depicting product usage metrics and impress your audience. This template can be altered and modified as per your expectations. So, grab it now.
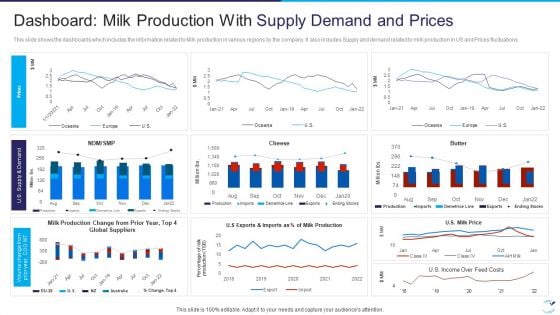
Factor Influencing User Experience Dairy Industry Dashboard Milk Production With Supply Designs PDF
This slide shows the dashboards which includes the information related to Milk production in various regions by the company. It also includes Supply and demand related to milk production in US and Prices fluctuations. Deliver an awe inspiring pitch with this creative factor influencing user experience dairy industry dashboard milk production with supply designs pdf bundle. Topics like dashboard milk production with supply demand and prices can be discussed with this completely editable template. It is available for immediate download depending on the needs and requirements of the user.
Agile Project Playbook Presentation Agile Project Management Activities Tracking Dashboard Tasks Designs PDF
This slide provides information regarding the dashboard which will help team in managing different activities associated to agile projects and keep track on the time, task summary, etc. Deliver and pitch your topic in the best possible manner with this agile project playbook presentation agile project management activities tracking dashboard tasks designs pdf. Use them to share invaluable insights on agile project management activities tracking dashboard and impress your audience. This template can be altered and modified as per your expectations. So, grab it now.
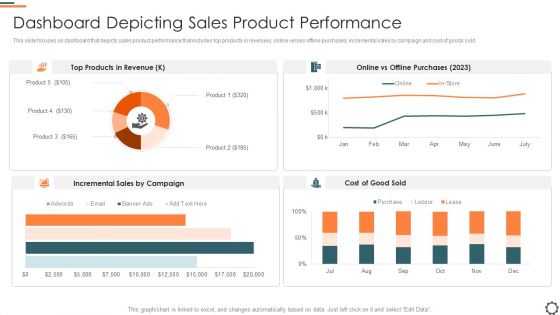
Agile Group For Product Development Dashboard Depicting Sales Product Performance Pictures PDF
This slide focuses on dashboard that depicts sales product performance that includes top products in revenues, online verses offline purchases, incremental sales by campaign and cost of goods sold. Deliver and pitch your topic in the best possible manner with this agile group for product development dashboard depicting sales product performance pictures pdf. Use them to share invaluable insights on dashboard depicting sales product performance and impress your audience. This template can be altered and modified as per your expectations. So, grab it now.
Formulating Competitive Plan Of Action For Effective Product Leadership Dashboard Depicting Sales Topics PDF
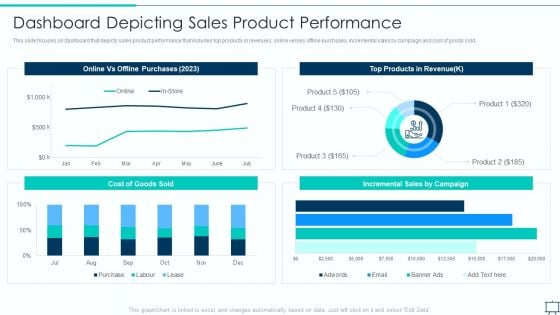
This slide focuses on dashboard that depicts sales product performance that includes top products in revenues, online verses offline purchases, incremental sales by campaign and cost of goods sold. Deliver and pitch your topic in the best possible manner with this formulating competitive plan of action for effective product leadership dashboard depicting sales topics pdf. Use them to share invaluable insights on dashboard depicting sales product performance and impress your audience. This template can be altered and modified as per your expectations. So, grab it now.
Dashboard For Threat Tracking In Information Technology Security Ppt Portfolio Shapes PDF
This slide depicts the dashboard for threat tracking in network security by covering monthly threat status, current risk status, threat-based on the role, threats by owners, risk by threats, and threat report. Deliver and pitch your topic in the best possible manner with this dashboard for threat tracking in information technology security ppt portfolio shapes pdf. Use them to share invaluable insights on dashboard for threat tracking in information technology security and impress your audience. This template can be altered and modified as per your expectations. So, grab it now.
Post Merger Information Technology Service Delivery Amalgamation KPI Dashboard To Measure Business Template PDF
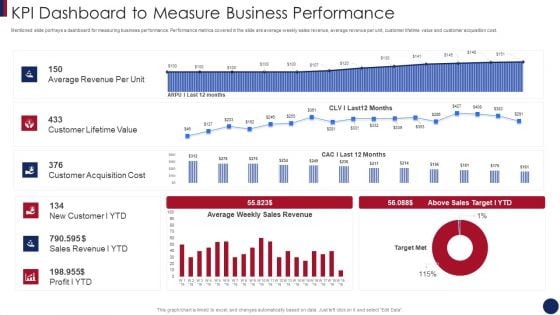
Mentioned slide portrays a dashboard for measuring business performance. Performance metrics covered in the slide are average weekly sales revenue, average revenue per unit, customer lifetime value and customer acquisition cost. Deliver an awe inspiring pitch with this creative post merger information technology service delivery amalgamation kpi dashboard to measure business template pdf bundle. Topics like kpi dashboard to measure business performance can be discussed with this completely editable template. It is available for immediate download depending on the needs and requirements of the user.
Professional Scrum Master Certification Risk Monitoring Dashboard For Software Development Portrait PDF
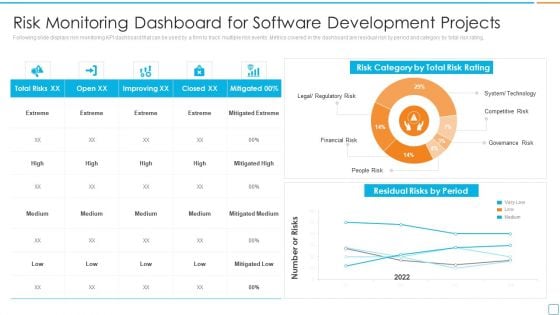
Following slide displays risk monitoring KPI dashboard that can be used by a firm to track multiple risk events. Metrics covered in the dashboard are residual risk by period and category by total risk rating. Deliver an awe inspiring pitch with this creative professional scrum master certification risk monitoring dashboard for software development portrait pdf bundle. Topics like residual risks by period, risk category, total risk rating can be discussed with this completely editable template. It is available for immediate download depending on the needs and requirements of the user.
Effective Initiation Of Information Technology Project Project Risk Monitoring Kpi Dashboard Microsoft PDF
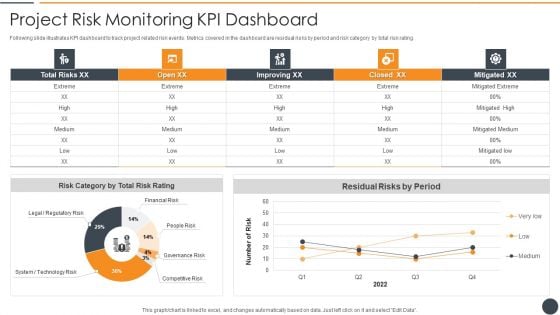
Following slide illustrates KPI dashboard to track project related risk events. Metrics covered in the dashboard are residual risks by period and risk category by total risk rating. Deliver and pitch your topic in the best possible manner with this effective initiation of information technology project project risk monitoring kpi dashboard microsoft pdf. Use them to share invaluable insights on mitigated extreme, residual risks by period, risk category by total risk rating and impress your audience. This template can be altered and modified as per your expectations. So, grab it now.
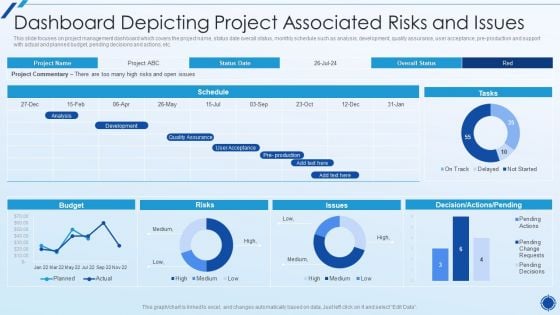
Organizing Action Plan For Successful Project Management Dashboard Depicting Project Associated Inspiration PDF
This slide focuses on project management dashboard which covers the project name, status date overall status, monthly schedule such as analysis, development, quality assurance, user acceptance, pre-production and support with actual and planned budget, pending decisions and actions, etc.Deliver an awe inspiring pitch with this creative organizing action plan for successful project management dashboard depicting project associated inspiration pdf bundle. Topics like dashboard depicting project associated risks and issues can be discussed with this completely editable template. It is available for immediate download depending on the needs and requirements of the user.
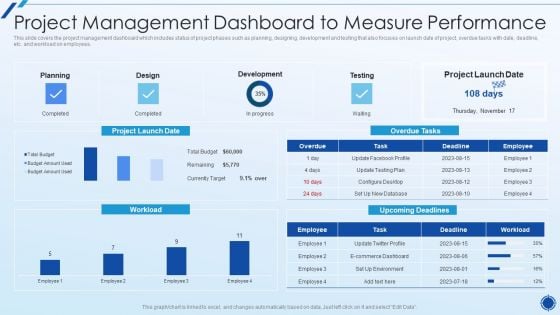
Organizing Action Plan For Successful Project Management Project Management Dashboard Topics PDF
This slide covers the project management dashboard which includes status of project phases such as planning, designing, development and testing that also focuses on launch date of project, overdue tasks with date, deadline, etc. and workload on employees.Deliver an awe inspiring pitch with this creative organizing action plan for successful project management project management dashboard topics pdf bundle. Topics like project management dashboard to measure performance can be discussed with this completely editable template. It is available for immediate download depending on the needs and requirements of the user.
Playbook For Application Developers KPI Dashboard For Tracking Project Team Performance Slides PDF
Following slide illustrates performance monitoring dashboard that can be used by managers to track their developers team efficiency. It also includes details about billable and non billable hours along with task summary.Deliver an awe inspiring pitch with this creative playbook for application developers kpi dashboard for tracking project team performance slides pdf bundle. Topics like kpi dashboard for tracking project team performance can be discussed with this completely editable template. It is available for immediate download depending on the needs and requirements of the user.

Cyber Phishing Scams And Attacks Dashboard With Improvement Curve Sample PDF
Mentioned slide showcases a comprehensive dashboard used to measure the cyber phishing attacks. Information covered in this slide is related to organization health risk, attack vendors, most vulnerable employees to attacks, improvement curve. Pitch your topic with ease and precision using this cyber phishing scams and attacks dashboard with improvement curve sample pdf. This layout presents information on cyber phishing scams and attacks dashboard with improvement curve. It is also available for immediate download and adjustment. So, changes can be made in the color, design, graphics or any other component to create a unique layout.
Organizational Marketing Playbook Dashboard For Tracking Lead Generation From Marketing Efforts Mockup PDF
Following slide displays KPI dashboard that company is currently using for measuring lead generation through marketing. It also provides information about the traffic generation through different sources.Deliver and pitch your topic in the best possible manner with this Organizational Marketing Playbook Dashboard For Tracking Lead Generation From Marketing Efforts Mockup PDF Use them to share invaluable insights on Dashboard For Tracking Lead Generation From Marketing Efforts and impress your audience. This template can be altered and modified as per your expectations. So, grab it now.
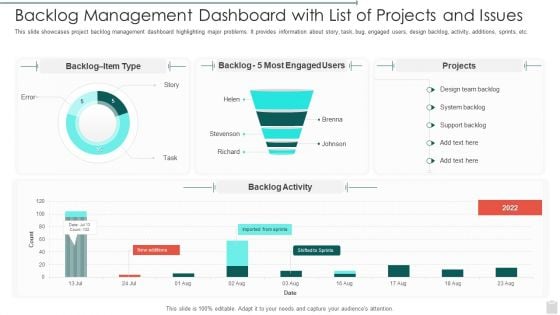
Backlog Management Dashboard With List Of Projects And Issues Template PDF
This slide showcases project backlog management dashboard highlighting major problems. It provides information about story, task, bug, engaged users, design backlog, activity, additions, sprints, etc. Pitch your topic with ease and precision using this Backlog Management Dashboard With List Of Projects And Issues Template PDF. This layout presents information on Backlog Management Dashboard With List Of Projects And Issues. It is also available for immediate download and adjustment. So, changes can be made in the color, design, graphics or any other component to create a unique layout.
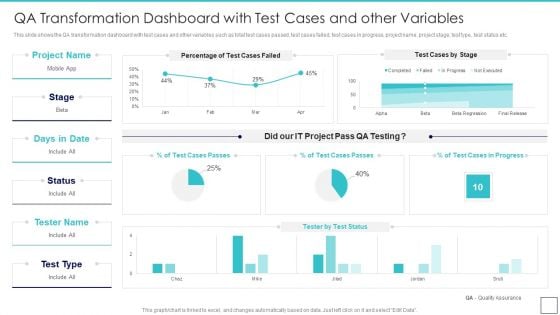
Deploying Quality Assurance QA Transformation QA Transformation Dashboard With Test Download PDF
This slide shows the QA transformation dashboard with test cases and other variables such as total test cases passed, test cases failed, test cases in progress, project name, project stage, test type, test status etc. Deliver and pitch your topic in the best possible manner with this Deploying Quality Assurance QA Transformation QA Transformation Dashboard With Test Download PDF Use them to share invaluable insights on Qa Transformation Dashboard With Test Cases And Other Variablesc and impress your audience. This template can be altered and modified as per your expectations. So, grab it now.
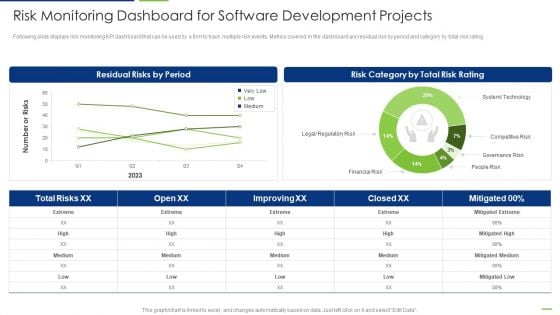
Professional Scrum Master Risk Monitoring Dashboard For Software Development Projects Designs PDF
Following slide displays risk monitoring KPI dashboard that can be used by a firm to track multiple risk events. Metrics covered in the dashboard are residual risk by period and category by total risk rating. Deliver an awe inspiring pitch with this creative Professional Scrum Master Risk Monitoring Dashboard For Software Development Projects Designs PDF bundle. Topics like Residual Risks By Period, Risk Category By Total Risk Rating, Total Risks can be discussed with this completely editable template. It is available for immediate download depending on the needs and requirements of the user.
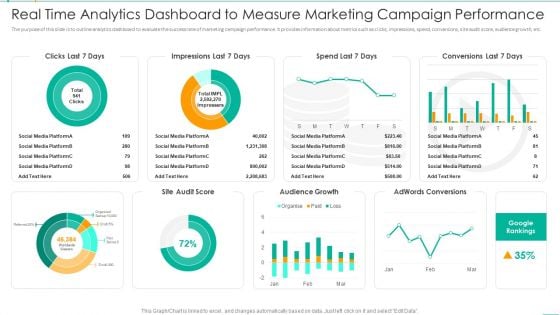
Real Time Analytics Dashboard To Measure Marketing Campaign Performance Information PDF
The purpose of this slide is to outline analytics dashboard to evaluate the success rate of marketing campaign performance. It provides information about metrics such as clicks, impressions, spend, conversions, site audit score, audience growth, etc. Pitch your topic with ease and precision using this Real Time Analytics Dashboard To Measure Marketing Campaign Performance Information PDF. This layout presents information on Real Time Analytics Dashboard To Measure Marketing Campaign Performance. It is also available for immediate download and adjustment. So, changes can be made in the color, design, graphics or any other component to create a unique layout.
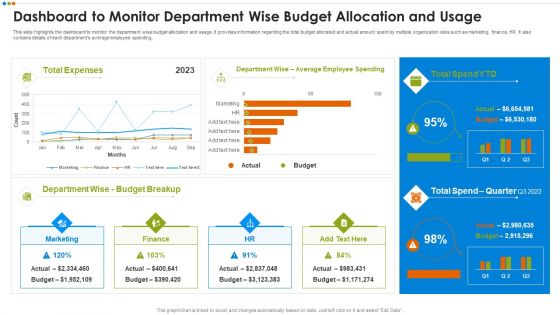
Quarterly Budget Analysis Of Business Organization Dashboard To Monitor Department Demonstration PDF
This slide highlights the dashboard to monitor the department wise budget allocation and usage. It provides information regarding the total budget allocated and actual amount spent by multiple organization silos such as marketing, finance, HR. It also contains details of each departments average employee spending,Deliver and pitch your topic in the best possible manner with this Quarterly Budget Analysis Of Business Organization Dashboard To Monitor Department Demonstration PDF Use them to share invaluable insights on Dashboard To Monitor Department Wise Budget Allocation And Usage and impress your audience. This template can be altered and modified as per your expectations. So, grab it now.
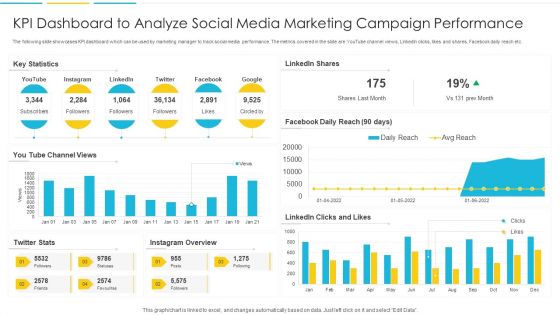
KPI Dashboard To Analyze Social Media Marketing Campaign Performance Rules PDF
The following slide showcases KPI dashboard which can be used by marketing manager to track social media performance. The metrics covered in the slide are YouTube channel views, LinkedIn clicks, likes and shares, Facebook daily reach etc. Pitch your topic with ease and precision using this KPI Dashboard To Analyze Social Media Marketing Campaign Performance Rules PDF. This layout presents information on Dashboard, Marketing, Analyze. It is also available for immediate download and adjustment. So, changes can be made in the color, design, graphics or any other component to create a unique layout.
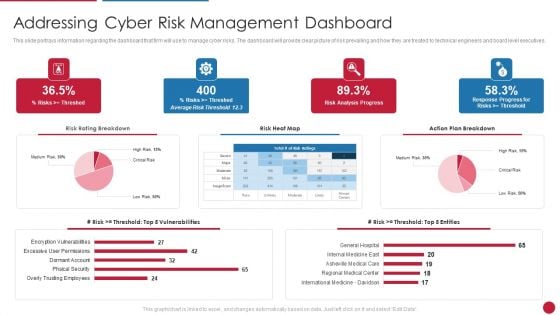
Facilitating IT Intelligence Architecture Addressing Cyber Risk Management Dashboard Professional PDF
This slide portrays information regarding the dashboard that firm will use to manage cyber risks. The dashboard will provide clear picture of risk prevailing and how they are treated to technical engineers and board level executives.Deliver and pitch your topic in the best possible manner with this Facilitating IT Intelligence Architecture Addressing Cyber Risk Management Dashboard Professional PDF Use them to share invaluable insights on International Medicine Davidson, Regional Medical Center, Asheville Medical Care and impress your audience. This template can be altered and modified as per your expectations. So, grab it now.
Patient Healthcare Online Transformation Dashboard Ppt PowerPoint Presentation Icon Example File PDF
This slide displays the dashboard depicting the results of patients after the digital transformation. It includes the daily activity of the patients on the app, appointments, water balance, etc. Pitch your topic with ease and precision using this Patient Healthcare Online Transformation Dashboard Ppt PowerPoint Presentation Icon Example File PDF. This layout presents information on General Health, Water Balance, Transformation Dashboard. It is also available for immediate download and adjustment. So, changes can be made in the color, design, graphics or any other component to create a unique layout.
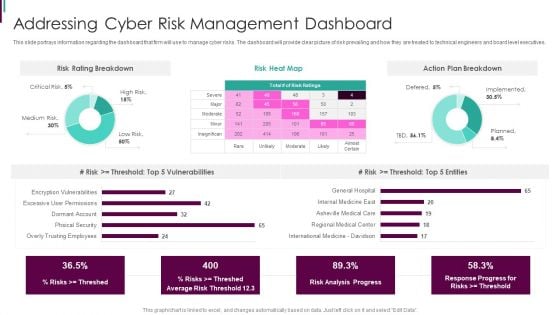
Developing Business Analytics Framework Addressing Cyber Risk Management Dashboard Graphics PDF
This slide portrays information regarding the dashboard that firm will use to manage cyber risks. The dashboard will provide clear picture of risk prevailing and how they are treated to technical engineers and board level executives.Deliver and pitch your topic in the best possible manner with this Developing Business Analytics Framework Addressing Cyber Risk Management Dashboard Graphics PDF Use them to share invaluable insights on Risk Breakdown, Action Breakdown, Vulnerabilities and impress your audience. This template can be altered and modified as per your expectations. So, grab it now.
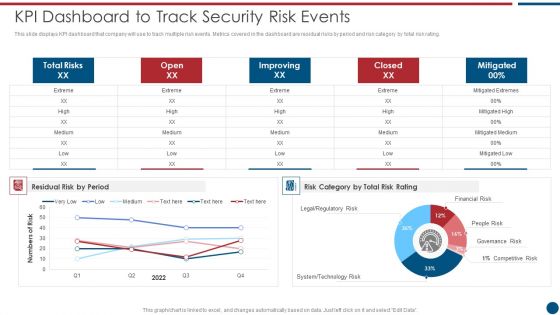
Risk Based Procedures To IT Security KPI Dashboard To Track Security Risk Events Designs PDF

New Product Sales Strategy And Marketing KPI Dashboard To Monitor Sales Performance Information PDF
This slide shows sales performance monitoring dashboard. Metrics included in the dashboard are sales revenue, sales growth, average revenue per unit, customer lifetime value and customer acquisition cost. Deliver an awe inspiring pitch with this creative New Product Sales Strategy And Marketing KPI Dashboard To Monitor Sales Performance Information PDF bundle. Topics like Sales Revenue, Monthly Sales Growth, Sales Country Performance can be discussed with this completely editable template. It is available for immediate download depending on the needs and requirements of the user.
IT Security Risk Management Approach Introduction Kpi Dashboard To Track Security Risk Events Icons PDF
This slide displays KPI dashboard that company will use to track multiple risk events. Metrics covered in the dashboard are residual risks by period and risk category by total risk rating. Deliver and pitch your topic in the best possible manner with this IT Security Risk Management Approach Introduction Kpi Dashboard To Track Security Risk Events Icons PDF. Use them to share invaluable insights on System Technology Risk, Governance Risk, Security Risk Events and impress your audience. This template can be altered and modified as per your expectations. So, grab it now.
Playbook For Lean Agile Project Administration Agile Project Management Activities Tracking Dashboard Introduction PDF
This slide provides information regarding the dashboard which will help team in managing different activities associated to agile projects and keep track on the time, task summary, etc. Deliver an awe inspiring pitch with this creative Playbook For Lean Agile Project Administration Agile Project Management Activities Tracking Dashboard Introduction PDF bundle. Topics like Activities Tracking Dashboard, Agile Project Management, Summary By Resources can be discussed with this completely editable template. It is available for immediate download depending on the needs and requirements of the user.
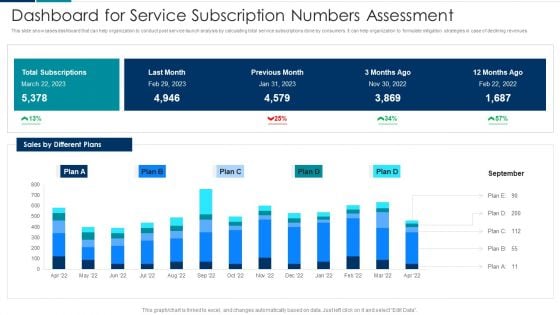
Managing New Service Roll Out And Marketing Procedure Dashboard For Service Subscription Numbers Assessment Clipart PDF
This slide showcases dashboard that can help organization to conduct post service launch analysis by calculating total service subscriptions done by consumers. It can help organization to formulate mitigation strategies in case of declining revenues. Deliver an awe inspiring pitch with this creative Managing New Service Roll Out And Marketing Procedure Dashboard For Service Subscription Numbers Assessment Clipart PDF bundle. Topics like Dashboard For Service, Subscription Numbers Assessment can be discussed with this completely editable template. It is available for immediate download depending on the needs and requirements of the user.
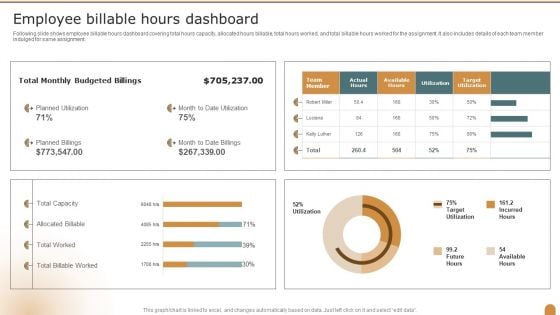
Employee Billable Hours Dashboard Company Performance Evaluation Using KPI Topics PDF
Following slide shows employee billable hours dashboard covering total hours capacity, allocated hours billable, total hours worked, and total billable hours worked for the assignment. It also includes details of each team member indulged for same assignment. Deliver and pitch your topic in the best possible manner with this Employee Billable Hours Dashboard Company Performance Evaluation Using KPI Topics PDF. Use them to share invaluable insights on Employee Billable, Hours Dashboard, Budgeted Billings and impress your audience. This template can be altered and modified as per your expectations. So, grab it now.
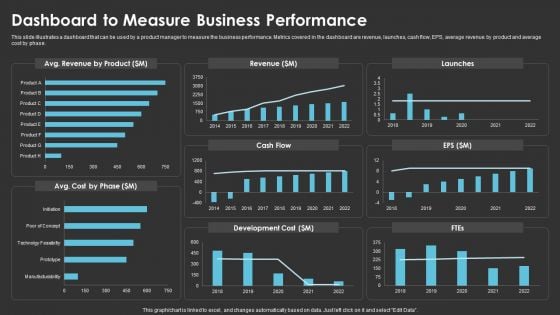
Method To Introduce New Product Offerings In The Industry Dashboard To Measure Business Performance Pictures PDF
This slide illustrates a dashboard that can be used by a product manager to measure the business performance. Metrics covered in the dashboard are revenue, launches, cash flow, EPS, average revenue by product and average cost by phase. Deliver and pitch your topic in the best possible manner with this Method To Introduce New Product Offerings In The Industry Dashboard To Measure Business Performance Pictures PDF. Use them to share invaluable insights on Revenue, Cash Flow, Development Cost and impress your audience. This template can be altered and modified as per your expectations. So, grab it now.
Consumer Journey Mapping Techniques Dashboard For Tracking Customer Service Team Performance Summary PDF
This slide covers the KPI dashboard for analyzing the performance of client support department. It includes metrics such as first call resolution, unresolved calls, average response rate, the best day to call, average time to solve issues, etc. Pitch your topic with ease and precision using this Consumer Journey Mapping Techniques Dashboard For Tracking Customer Service Team Performance Summary PDF. This layout presents information on Dashboard For Tracking Customer, Service Team Performance. It is also available for immediate download and adjustment. So, changes can be made in the color, design, graphics or any other component to create a unique layout.
Dashboard For Tracking Progress Of Media Relations Management Strategies Slides PDF
This slide provides dashboard showcasing impact of media relations plan which helps track campaign performance. It provides information regarding consumer engagement, bounce rate, lead generation, conversion rates and top channels used. Pitch your topic with ease and precision using this Dashboard For Tracking Progress Of Media Relations Management Strategies Slides PDF. This layout presents information on Dashboard For Tracking, Progress Of Media, Relations Management Strategies. It is also available for immediate download and adjustment. So, changes can be made in the color, design, graphics or any other component to create a unique layout.

Email Marketing Campaign Outcomes And Social Media Marketing Result Analysis Dashboard Mockup PDF
This slide depicts the dashboard for analyzing the results of email campaign and social media marketing. It includes information related to the comparison, statistics, usage, etc. Pitch your topic with ease and precision using this Email Marketing Campaign Outcomes And Social Media Marketing Result Analysis Dashboard Mockup PDF. This layout presents information on Email Marketing Campaign, Outcomes And Social Media, Marketing Result, Analysis Dashboard. It is also available for immediate download and adjustment. So, changes can be made in the color, design, graphics or any other component to create a unique layout.
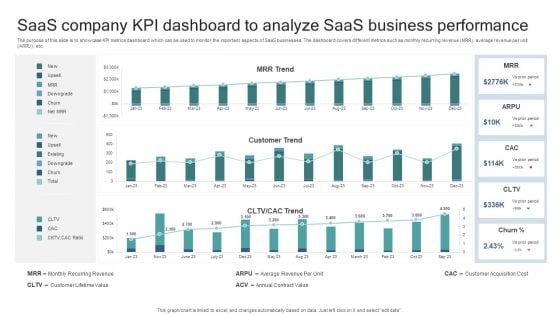
Saas Company KPI Dashboard To Analyze Saas Business Performance Elements PDF
The purpose of this slide is to showcase KPI metrics dashboard which can be used to monitor the important aspects of SaaS businesses. The dashboard covers different metrics such as monthly recurring revenue MRR, average revenue per unit ARPU, etc. Pitch your topic with ease and precision using this Saas Company KPI Dashboard To Analyze Saas Business Performance Elements PDF. This layout presents information on Monthly Recurring Revenue, Customer Lifetime Value, Average Revenue Per Unit, Annual Contract Value, Customer Acquisition Cost. It is also available for immediate download and adjustment. So, changes can be made in the color, design, graphics or any other component to create a unique layout.
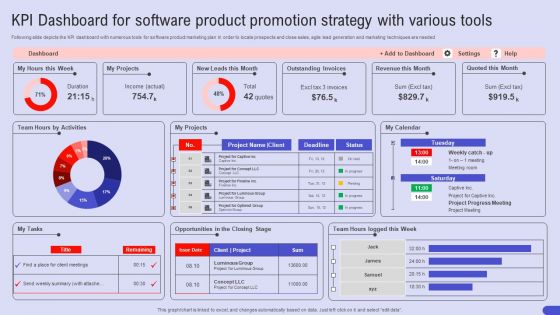
KPI Dashboard For Software Product Promotion Strategy With Various Tools Portrait PDF
Following slide depicts the KPI dashboard with numerous tools for software product marketing plan In order to locate prospects and close sales, agile lead generation and marketing techniques are needed. Pitch your topic with ease and precision using this KPI Dashboard For Software Product Promotion Strategy With Various Tools Portrait PDF. This layout presents information on KPI Dashboard, Software Product Promotion, Strategy With Various Tools. It is also available for immediate download and adjustment. So, changes can be made in the color, design, graphics or any other component to create a unique layout.
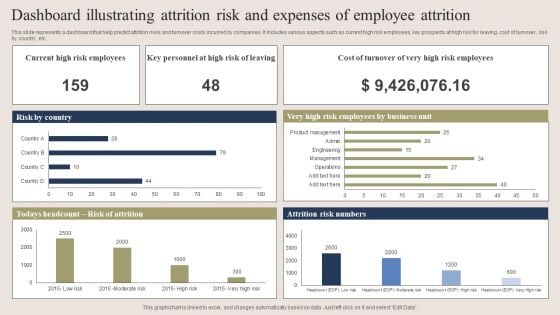
Dashboard Illustrating Attrition Risk And Expenses Of Employee Attrition Clipart PDF
This slide represents a dashboard that help predict attrition risks and turnover costs incurred by companies. It includes various aspects such as current high risk employees, key prospects at high risk for leaving, cost of turnover, risk by country, etc. Pitch your topic with ease and precision using this Dashboard Illustrating Attrition Risk And Expenses Of Employee Attrition Clipart PDF. This layout presents information on Dashboard Illustrating Attrition Risk, Expenses Of Employee Attrition . It is also available for immediate download and adjustment. So, changes can be made in the color, design, graphics or any other component to create a unique layout.
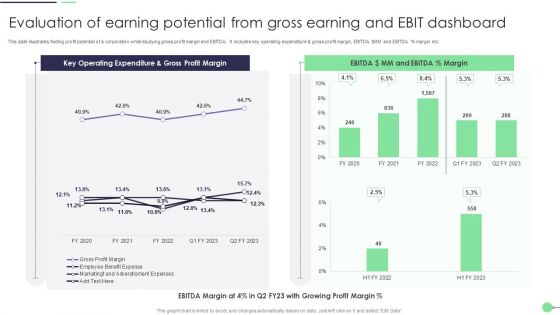
Evaluation Of Earning Potential From Gross Earning And Ebit Dashboard Professional PDF
This slide illustrates finding profit potential of a corporation while studying gross profit margin and EBITDA. It includes key operating expenditure and gross profit margin, EBITDA dollar MM and EBITDA percent margin etc. Showcasing this set of slides titled Evaluation Of Earning Potential From Gross Earning And Ebit Dashboard Professional PDF. The topics addressed in these templates are Evaluation Of Earning Potential, Gross Earning, Ebit Dashboard. All the content presented in this PPT design is completely editable. Download it and make adjustments in color, background, font etc. as per your unique business setting.
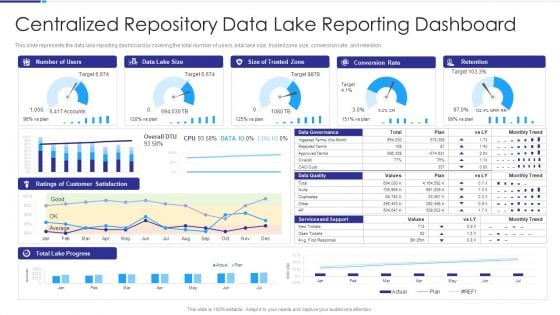
Data Lake Architecture Centralized Repository Data Lake Reporting Dashboard Introduction PDF
This slide represents the data lake reporting dashboard by covering the total number of users, total lake size, trusted zone size, conversion rate, and retention. Deliver an awe inspiring pitch with this creative Data Lake Architecture Centralized Repository Data Lake Reporting Dashboard Introduction PDF bundle. Topics like Data Lake Size, Conversion Rate, Retention, Ratings Customer Satisfaction can be discussed with this completely editable template. It is available for immediate download depending on the needs and requirements of the user.
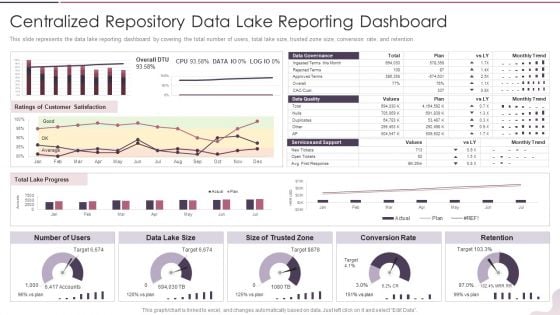
Data Lake Development With Azure Cloud Software Centralized Repository Data Lake Reporting Dashboard Demonstration PDF
This slide represents the data lake reporting dashboard by covering the total number of users, total lake size, trusted zone size, conversion rate, and retention. Deliver an awe inspiring pitch with this creative Data Lake Development With Azure Cloud Software Centralized Repository Data Lake Reporting Dashboard Demonstration PDF bundle. Topics like Conversion Rate, Services And Support can be discussed with this completely editable template. It is available for immediate download depending on the needs and requirements of the user.
Vendor Performance KPI Analytical Dashboard Icon For Data Management Background PDF
Persuade your audience using this Vendor Performance KPI Analytical Dashboard Icon For Data Management Background PDF. This PPT design covers three stages, thus making it a great tool to use. It also caters to a variety of topics including Vendor Performance, KPI Analytical Dashboard, Icon Data Management. Download this PPT design now to present a convincing pitch that not only emphasizes the topic but also showcases your presentation skills.
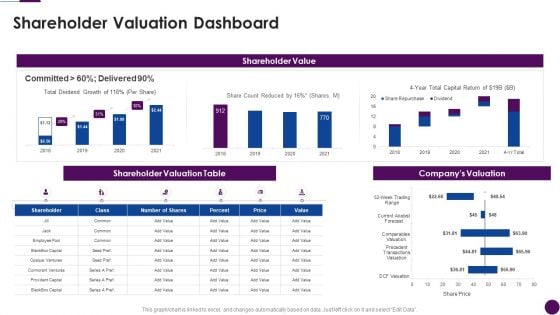
Procedure To Identify The Shareholder Value Shareholder Valuation Dashboard Template Pdf
Deliver and pitch your topic in the best possible manner with this procedure to identify the shareholder value shareholder valuation dashboard template pdf. Use them to share invaluable insights on employee pool, cormorant ventures, provident capital, blackbox capital, opaque ventures and impress your audience. This template can be altered and modified as per your expectations. So, grab it now.
Business Intelligence Dashboard Icon For Data Analysis And Visualization Information PDF
Persuade your audience using this Business Intelligence Dashboard Icon For Data Analysis And Visualization Information PDF. This PPT design covers three stages, thus making it a great tool to use. It also caters to a variety of topics including Business Intelligence Dashboard Icon, Data Analysis And Visualization. Download this PPT design now to present a convincing pitch that not only emphasizes the topic but also showcases your presentation skills.
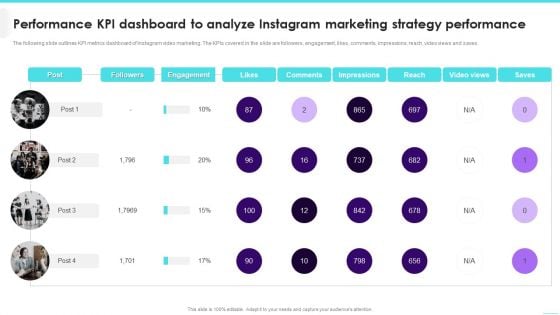
Performance KPI Dashboard To Analyze Instagram Marketing Strategy Performance Infographics PDF
The following slide outlines KPI metrics dashboard of Instagram video marketing. The KPIs covered in the slide are followers, engagement, likes, comments, impressions, reach, video views and saves.Deliver an awe inspiring pitch with this creative Performance KPI Dashboard To Analyze Instagram Marketing Strategy Performance Infographics PDF bundle. Topics like Engagement, Impressions, Comments can be discussed with this completely editable template. It is available for immediate download depending on the needs and requirements of the user.
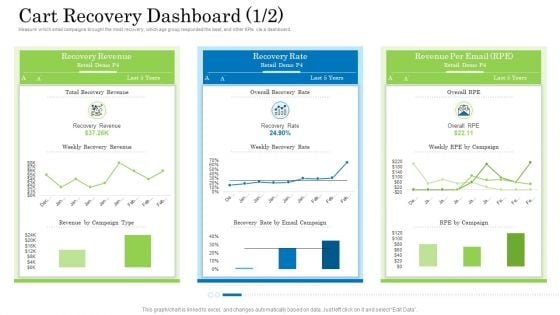
Customer Behavioral Data And Analytics Cart Recovery Dashboard Revenue Background PDF
Measure which email campaigns brought the most recovery, which age group responded the best, and other KPIs via a dashboard. Deliver an awe inspiring pitch with this creative customer behavioral data and analytics cart recovery dashboard revenue background pdf bundle. Topics like recovery revenue, recovery rate, revenue per email can be discussed with this completely editable template. It is available for immediate download depending on the needs and requirements of the user.
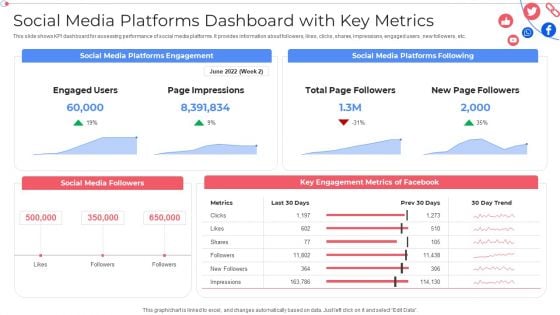
Social Media Platforms Dashboard With Key Metrics Customer Group Engagement Through Social Media Channels Infographics PDF
This slide shows KPI dashboard for assessing performance of social media platforms. It provides information about followers, likes, clicks, shares, impressions, engaged users , new followers, etc. Deliver an awe inspiring pitch with this creative Social Media Platforms Dashboard With Key Metrics Customer Group Engagement Through Social Media Channels Infographics PDF bundle. Topics like Social Media Followers, Key Engagement Metrics can be discussed with this completely editable template. It is available for immediate download depending on the needs and requirements of the user.
KPI Dashboard For Tracking Hospitality And Tourism Management Plan Performance Infographics PDF
This slide shows the KPI dashboard for monitoring the performance of strategy implemented. It covers KPIs such as bookings, location, housekeeping, etc. Pitch your topic with ease and precision using this KPI Dashboard For Tracking Hospitality And Tourism Management Plan Performance Infographics PDF. This layout presents information on Booking Type, Housekeeping, Check In Guest. It is also available for immediate download and adjustment. So, changes can be made in the color, design, graphics or any other component to create a unique layout.
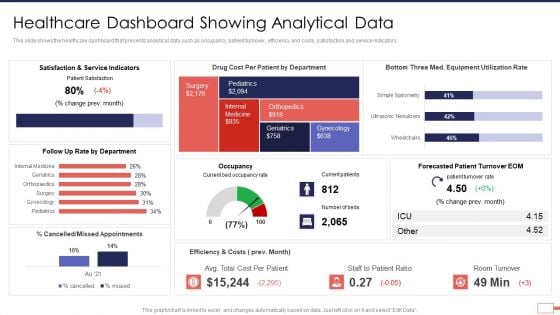
Iot Digital Twin Technology Post Covid Expenditure Management Healthcare Dashboard Showing Analytical Data Brochure PDF
This slide shows the healthcare dashboard that presents analytical data such as occupancy, patient turnover, efficiency and costs, satisfaction and service indicators. Deliver an awe inspiring pitch with this creative iot digital twin technology post covid expenditure management healthcare dashboard showing analytical data brochure pdf bundle. Topics like service, indicators, cost, appointments, turnover can be discussed with this completely editable template. It is available for immediate download depending on the needs and requirements of the user.
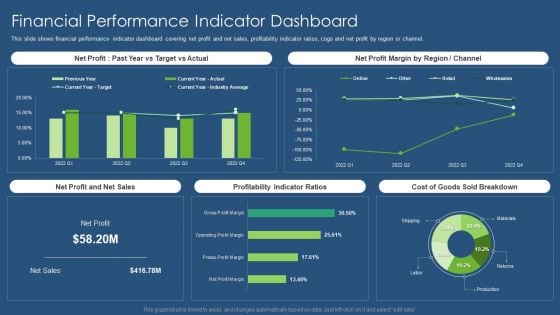
Sustainability Calculation With KPI Financial Performance Indicator Dashboard Infographics PDF Template PDF
This slide shows financial performance indicator dashboard covering net profit and net sales, profitability indicator ratios, cogs and net profit by region or channel. Deliver an awe inspiring pitch with this creative sustainability calculation with kpi financial performance indicator dashboard infographics pdf bundle. Topics like net profit margin, net profit and net sales, profitability indicator ratios, sold breakdown can be discussed with this completely editable template. It is available for immediate download depending on the needs and requirements of the user.
Workplace Risk Key Performance Indicator Dashboard Icon Ppt Inspiration Slides PDF
Persuade your audience using this Workplace Risk Key Performance Indicator Dashboard Icon Ppt Inspiration Slides PDF. This PPT design covers four stages, thus making it a great tool to use. It also caters to a variety of topics including Workplace Risk, Key Performance, Indicator Dashboard, Icon. Download this PPT design now to present a convincing pitch that not only emphasizes the topic but also showcases your presentation skills.
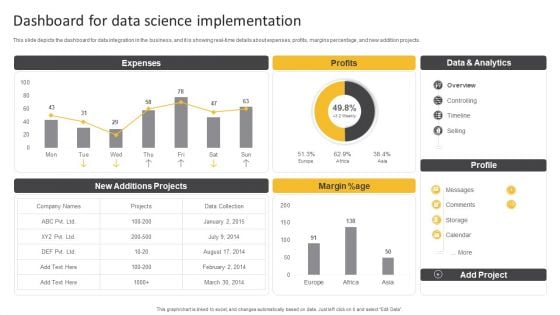
Information Science Dashboard For Data Science Implementation Ppt PowerPoint Presentation Slides Maker PDF
This slide depicts the dashboard for data integration in the business, and it is showing real-time details about expenses, profits, margins percentage, and new addition projects.Deliver and pitch your topic in the best possible manner with this Information Science Dashboard For Data Science Implementation Ppt PowerPoint Presentation Slides Maker PDF. Use them to share invaluable insights on Expenses, Data Analytics, New Projects and impress your audience. This template can be altered and modified as per your expectations. So, grab it now.
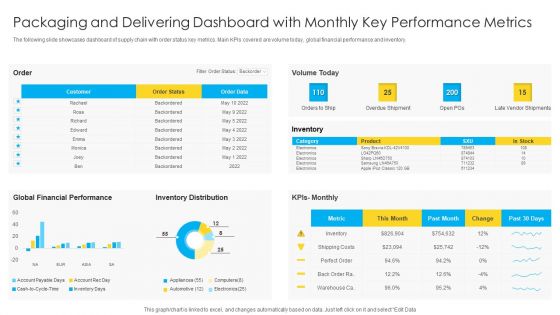
Packaging And Delivering Dashboard With Monthly Key Performance Metrics Microsoft PDF
The following slide showcases dashboard of supply chain with order status key metrics. Main KPIs covered are volume today, global financial performance and inventory. Pitch your topic with ease and precision using this Packaging And Delivering Dashboard With Monthly Key Performance Metrics Microsoft PDF. This layout presents information on Customer, Global Financial Performance, Inventory Distribution. It is also available for immediate download and adjustment. So, changes can be made in the color, design, graphics or any other component to create a unique layout.
Integrating Social Media Tactics Dashboard For Tracking Social Media Kpis Introduction PDF
This slide shows dashboard for tracking social media key performance indicators KPIs. It provides details about average social engagement, reactions, comments, shares, clicks, thumbnail, platform, post message, etc. Deliver an awe inspiring pitch with this creative Integrating Social Media Tactics Dashboard For Tracking Social Media Kpis Introduction PDF bundle. Topics like Month Upper Fence, Social KPIs, Conversion Rate can be discussed with this completely editable template. It is available for immediate download depending on the needs and requirements of the user.
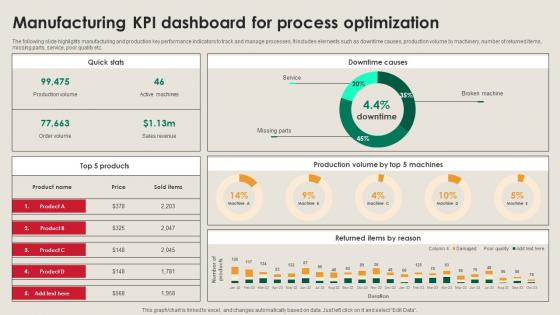
Manufacturing KPI Dashboard For Process Manufacturing Strategy Driving Industry 4 0
The following slide highlights manufacturing and production key performance indicators to track and manage processes. It includes elements such as downtime causes, production volume by machinery, number of returned items, missing parts, service, poor quality etc. Boost your pitch with our creative Manufacturing KPI Dashboard For Process Manufacturing Strategy Driving Industry 4 0. Deliver an awe-inspiring pitch that will mesmerize everyone. Using these presentation templates you will surely catch everyones attention. You can browse the ppts collection on our website. We have researchers who are experts at creating the right content for the templates. So you do not have to invest time in any additional work. Just grab the template now and use them. The following slide highlights manufacturing and production key performance indicators to track and manage processes. It includes elements such as downtime causes, production volume by machinery, number of returned items, missing parts, service, poor quality etc.


 Continue with Email

 Home
Home


