Private Equity Dashboard
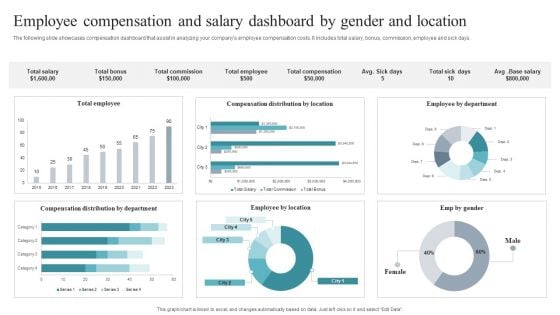
Employee Compensation And Salary Dashboard By Gender And Location Download PDF
The following slide showcases compensation dashboard that assist in analyzing your companys employee compensation costs. It includes total salary, bonus, commission, employee and sick days. Pitch your topic with ease and precision using this Employee Compensation And Salary Dashboard By Gender And Location Download PDF. This layout presents information on Employee By Location, Location, Employee. It is also available for immediate download and adjustment. So, changes can be made in the color, design, graphics or any other component to create a unique layout.
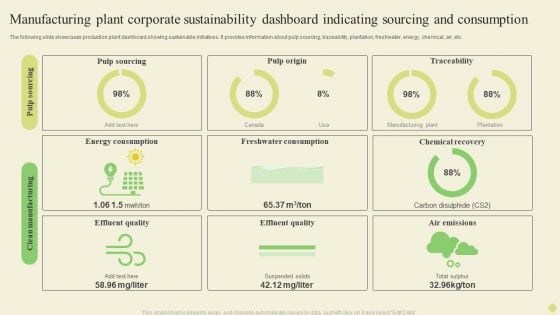
Manufacturing Plant Corporate Sustainability Dashboard Indicating Sourcing And Consumption Infographics PDF
The following slide showcases business sustainability dashboard highlighting multiple sources of technology. It provides information about renewable energy, plant age, solar, wind, biomass, regionality, etc.Pitch your topic with ease and precision using this Manufacturing Plant Corporate Sustainability Dashboard Indicating Sourcing And Consumption Infographics PDF. This layout presents information on Energy Consumption, Freshwater Consumption, Chemical Recovery. It is also available for immediate download and adjustment. So, changes can be made in the color, design, graphics or any other component to create a unique layout.
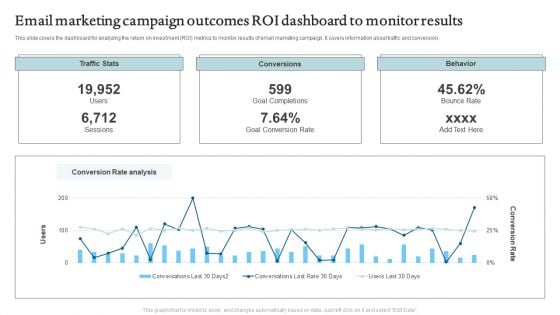
Email Marketing Campaign Outcomes ROI Dashboard To Monitor Results Formats PDF
This slide depicts the dashboard for analyzing the marketing results and campaign performance. It includes information related email sent, delivered, conversions, etc. Pitch your topic with ease and precision using this Email Marketing Campaign Outcomes ROI Dashboard To Monitor Results Formats PDF. This layout presents information on Traffic Stats, Conversions, Behavior. It is also available for immediate download and adjustment. So, changes can be made in the color, design, graphics or any other component to create a unique layout.
Icon For Activity Management And Revenue Customer Relationship Management Dashboard Slides PDF
Persuade your audience using this Icon For Activity Management And Revenue Customer Relationship Management Dashboard Slides PDF. This PPT design covers three stages, thus making it a great tool to use. It also caters to a variety of topics including Icon For Activity Management, Revenue Customer Relationship, Management Dashboard. Download this PPT design now to present a convincing pitch that not only emphasizes the topic but also showcases your presentation skills.
Effective NPO Promotional Strategies For Recruit Volunteers Event Analysis Dashboard Determine Total Funds Raised Icons PDF
This slide provides an overview of the dashboard depicting the events conducted to raise money. The dashboard includes participation by gender, type of events, fundraising event by state, year and occupation. This modern and well-arranged Effective NPO Promotional Strategies For Recruit Volunteers Event Analysis Dashboard Determine Total Funds Raised Icons PDF provides lots of creative possibilities. It is very simple to customize and edit with the Powerpoint Software. Just drag and drop your pictures into the shapes. All facets of this template can be edited with Powerpoint, no extra software is necessary. Add your own material, put your images in the places assigned for them, adjust the colors, and then you can show your slides to the world, with an animated slide included.
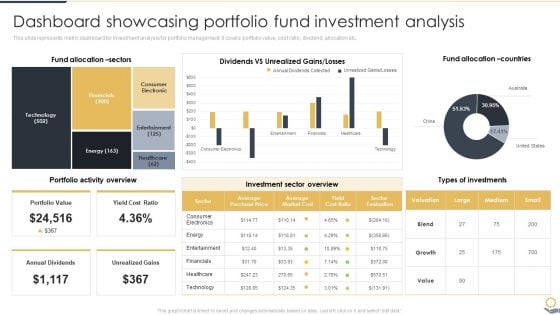
Dashboard Showcasing Portfolio Fund Investment Analysis Portfolio Investment Analysis Designs PDF
This slide represents metric dashboard for investment analysis for portfolio management. It covers portfolio value, cost ratio, dividend, allocation etc.Slidegeeks is one of the best resources for PowerPoint templates. You can download easily and regulate Dashboard Showcasing Portfolio Fund Investment Analysis Portfolio Investment Analysis Designs PDF for your personal presentations from our wonderful collection. A few clicks is all it takes to discover and get the most relevant and appropriate templates. Use our Templates to add a unique zing and appeal to your presentation and meetings. All the slides are easy to edit and you can use them even for advertisement purposes.
Implementing Change Management Strategy To Transform Business Processes Dashboard Depicting Kpis To Track Icons PDF
This slide covers the dashboard that depicts metrics to track company sales performance that focuses on number of sales, cost breakdown, accumulated revenues, incremental sales, etc. Boost your pitch with our creative Implementing Change Management Strategy To Transform Business Processes Dashboard Depicting Kpis To Track Icons PDF. Deliver an awe-inspiring pitch that will mesmerize everyone. Using these presentation templates you will surely catch everyones attention. You can browse the ppts collection on our website. We have researchers who are experts at creating the right content for the templates. So you do not have to invest time in any additional work. Just grab the template now and use them.
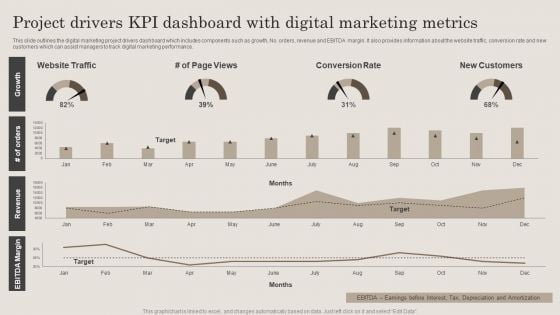
Project Drivers Kpi Dashboard With Digital Marketing Metrics Ppt PowerPoint Presentation File Clipart PDF
This slide outlines the digital marketing project drivers dashboard which includes components such as growth, No. orders, revenue and EBITDA margin. It also provides information about the website traffic, conversion rate and new customers which can assist managers to track digital marketing performance. Showcasing this set of slides titled Project Drivers Kpi Dashboard With Digital Marketing Metrics Ppt PowerPoint Presentation File Clipart PDF. The topics addressed in these templates are Website Traffic, Conversion Rate, New Customers. All the content presented in this PPT design is completely editable. Download it and make adjustments in color, background, font etc. as per your unique business setting.
Banking Dashboard To Determine Total Loans And Deposits Information Icons PDF
Mentioned slide portrays banking dashboard providing information on total loans and deposits by region and by district. Boost your pitch with our creative Banking Dashboard To Determine Total Loans And Deposits Information Icons PDF. Deliver an awe inspiring pitch that will mesmerize everyone. Using these presentation templates you will surely catch everyones attention. You can browse the ppts collection on our website. We have researchers who are experts at creating the right content for the templates. So you do not have to invest time in any additional work. Just grab the template now and use them.
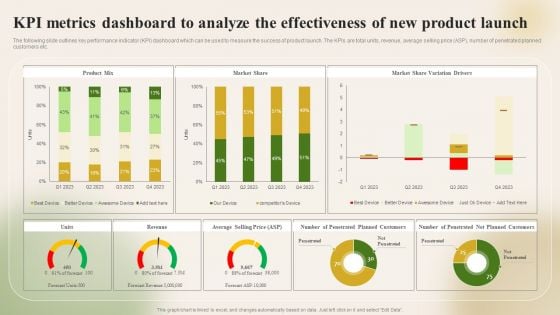
KPI Metrics Dashboard To Analyze The Effectiveness Of New Introducing New Food Pictures PDF
The following slide outlines key performance indicator KPI dashboard which can be used to measure the success of product launch. The KPIs are total units, revenue, average selling price ASP, number of penetrated planned customers etc. Make sure to capture your audiences attention in your business displays with our gratis customizable KPI Metrics Dashboard To Analyze The Effectiveness Of New Introducing New Food Pictures PDF. These are great for business strategies, office conferences, capital raising or task suggestions. If you desire to acquire more customers for your tech business and ensure they stay satisfied, create your own sales presentation with these plain slides.
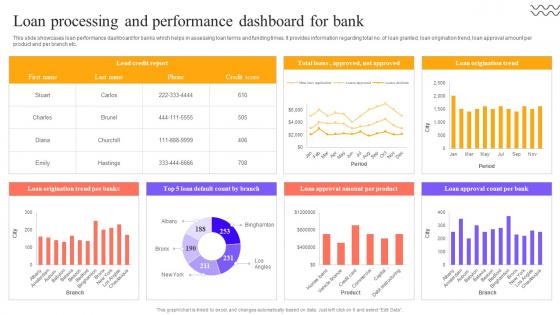
Digital Approach To Client Loan Processing And Performance Dashboard For Bank
This slide showcases loan performance dashboard for banks which helps in assessing loan terms and funding times. It provides information regarding total no. of loan granted, loan origination trend, loan approval amount per product and per branch etc. Whether you have daily or monthly meetings, a brilliant presentation is necessary. Digital Approach To Client Loan Processing And Performance Dashboard For Bank can be your best option for delivering a presentation. Represent everything in detail using Digital Approach To Client Loan Processing And Performance Dashboard For Bank and make yourself stand out in meetings. The template is versatile and follows a structure that will cater to your requirements. All the templates prepared by Slidegeeks are easy to download and edit. Our research experts have taken care of the corporate themes as well. So, give it a try and see the results. This slide showcases loan performance dashboard for banks which helps in assessing loan terms and funding times. It provides information regarding total no. of loan granted, loan origination trend, loan approval amount per product and per branch etc.
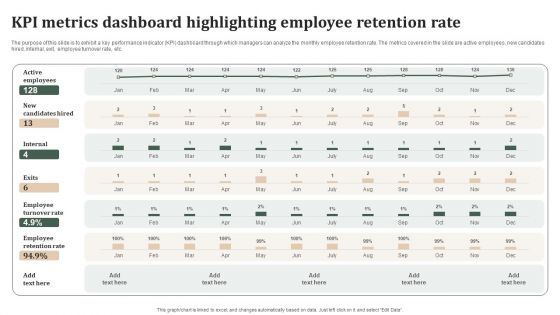
Successful Staff Retention Techniques KPI Metrics Dashboard Highlighting Employee Retention Rate Pictures PDF
The purpose of this slide is to exhibit a key performance indicator KPI dashboard through which managers can analyze the monthly employee retention rate. The metrics covered in the slide are active employees, new candidates hired, internal, exit, employee turnover rate, etc. Make sure to capture your audiences attention in your business displays with our gratis customizable Successful Staff Retention Techniques KPI Metrics Dashboard Highlighting Employee Retention Rate Pictures PDF. These are great for business strategies, office conferences, capital raising or task suggestions. If you desire to acquire more customers for your tech business and ensure they stay satisfied, create your own sales presentation with these plain slides.
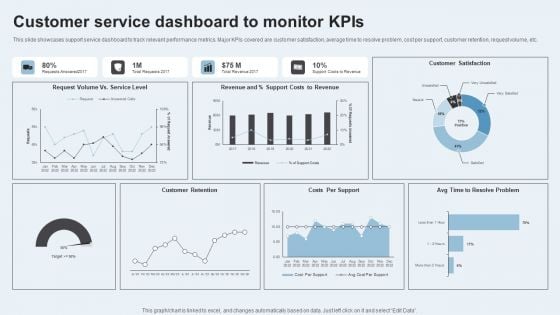
Action Plan To Enhance Client Service Customer Service Dashboard To Monitor Kpis Clipart PDF
This slide showcases support service dashboard to track relevant performance metrics. Major KPIs covered are customer satisfaction, average time to resolve problem, cost per support, customer retention, request volume, etc. Make sure to capture your audiences attention in your business displays with our gratis customizable Action Plan To Enhance Client Service Customer Service Dashboard To Monitor Kpis Clipart PDF. These are great for business strategies, office conferences, capital raising or task suggestions. If you desire to acquire more customers for your tech business and ensure they stay satisfied, create your own sales presentation with these plain slides.
Market Evaluation Of IT Industry Marketing Campaign Dashboard For B2b Marketers Icons PDF
The following slide showcases key performance indicator KPI dashboard that can assist managers to evaluate digital marketing campaign performance. The key metrics mentioned in the slide are click through rate CTR, conversion rate, cost per click CPC, etc. Make sure to capture your audiences attention in your business displays with our gratis customizable Market Evaluation Of IT Industry Marketing Campaign Dashboard For B2b Marketers Icons PDF. These are great for business strategies, office conferences, capital raising or task suggestions. If you desire to acquire more customers for your tech business and ensure they stay satisfied, create your own sales presentation with these plain slides.

Improvement Of Safety Performance At Construction Site Kpi Dashboard To Track Safety Program Microsoft PDF
This slide reflects the key performance indicator dashboard to track the performance of safety program. It includes information regarding the total manpower, manhours, unsafe conditions, lost time injuries frequency, injuries severity rate, along with the training hours. Make sure to capture your audiences attention in your business displays with our gratis customizable Improvement Of Safety Performance At Construction Site Kpi Dashboard To Track Safety Program Microsoft PDF. These are great for business strategies, office conferences, capital raising or task suggestions. If you desire to acquire more customers for your tech business and ensure they stay satisfied, create your own sales presentation with these plain slides.
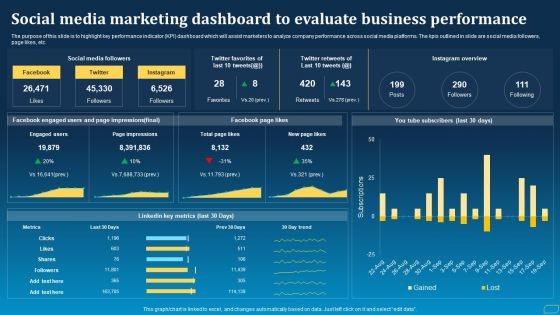
Direct Marketing Techniques To Enhance Business Presence Social Media Marketing Dashboard To Evaluate Rules PDF
The purpose of this slide is to highlight key performance indicator KPI dashboard which will assist marketers to analyze company performance across social media platforms. The kpis outlined in slide are social media followers, page likes, etc. Make sure to capture your audiences attention in your business displays with our gratis customizable Direct Marketing Techniques To Enhance Business Presence Social Media Marketing Dashboard To Evaluate Rules PDF. These are great for business strategies, office conferences, capital raising or task suggestions. If you desire to acquire more customers for your tech business and ensure they stay satisfied, create your own sales presentation with these plain slides.
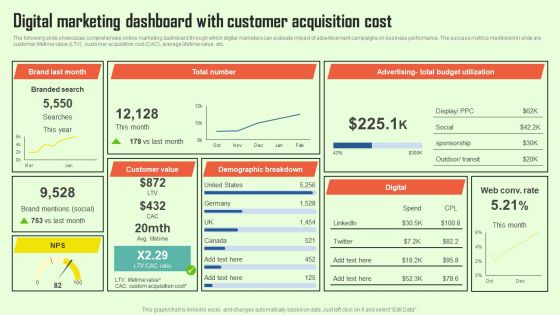
Increasing Consumer Engagement With Database Digital Marketing Dashboard With Customer Infographics PDF
The following slide showcases comprehensive online marketing dashboard through which digital marketers can evaluate impact of advertisement campaigns on business performance. The success metrics mentioned in slide are customer lifetime value LTV, customer acquisition cost CAC, average lifetime value, etc. Make sure to capture your audiences attention in your business displays with our gratis customizable Increasing Consumer Engagement With Database Digital Marketing Dashboard With Customer Infographics PDF. These are great for business strategies, office conferences, capital raising or task suggestions. If you desire to acquire more customers for your tech business and ensure they stay satisfied, create your own sales presentation with these plain slides.
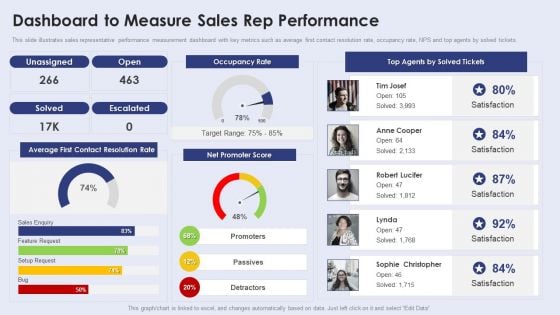
Creating New Product Launch Campaign Strategy Dashboard To Measure Sales Rep Performance Introduction PDF
This slide illustrates sales representative performance measurement dashboard with key metrics such as average first contact resolution rate, occupancy rate, NPS and top agents by solved tickets. Make sure to capture your audiences attention in your business displays with our gratis customizable Creating New Product Launch Campaign Strategy Dashboard To Measure Sales Rep Performance Introduction PDF. These are great for business strategies, office conferences, capital raising or task suggestions. If you desire to acquire more customers for your tech business and ensure they stay satisfied, create your own sales presentation with these plain slides.

Strategic Marketing For Hair And Beauty Salon To Increase Dashboard Monitoring Sales Slides PDF
This slide presents a dashboard tracking revenue and sales by products and services. It includes KPIs such as revenue by service and products, units sold, monthly revenue. Make sure to capture your audiences attention in your business displays with our gratis customizable Strategic Marketing For Hair And Beauty Salon To Increase Dashboard Monitoring Sales Slides PDF. These are great for business strategies, office conferences, capital raising or task suggestions. If you desire to acquire more customers for your tech business and ensure they stay satisfied, create your own sales presentation with these plain slides.
HR Induction Dashboard Highlighting Employee Headcount And Turnover Ratio Icons PDF
This slide highlights the HR induction dashboard which includes average salary, headcount, turnover rate, employees hired and employees left rate, average age with employment contract and status. Make sure to capture your audiences attention in your business displays with our gratis customizable HR Induction Dashboard Highlighting Employee Headcount And Turnover Ratio Icons PDF. These are great for business strategies, office conferences, capital raising or task suggestions. If you desire to acquire more customers for your tech business and ensure they stay satisfied, create your own sales presentation with these plain slides.
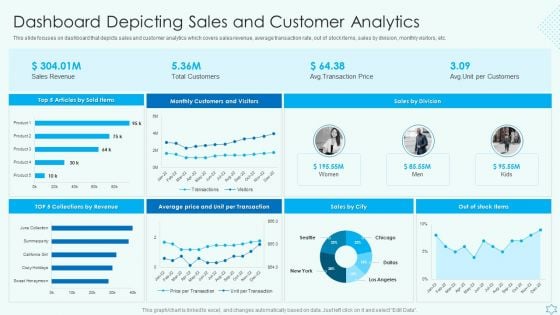
Deploy Merchandise Program To Enhance Sales Dashboard Depicting Sales And Customer Analytics Sample PDF
This slide focuses on dashboard that depicts sales and customer analytics which covers sales revenue, average transaction rate, out of stock items, sales by division, monthly visitors, etc. Make sure to capture your audiences attention in your business displays with our gratis customizable Deploy Merchandise Program To Enhance Sales Dashboard Depicting Sales And Customer Analytics Sample PDF. These are great for business strategies, office conferences, capital raising or task suggestions. If you desire to acquire more customers for your tech business and ensure they stay satisfied, create your own sales presentation with these plain slides.
Developing Brand Awareness To Gain Customer Attention Different Brands Performance Tracking Dashboard Introduction PDF
This slide provides information regarding different brands performance tracking dashboard in terms of brand metric, brand commitment, advertising metrics, and purchase metrics. Make sure to capture your audiences attention in your business displays with our gratis customizable Developing Brand Awareness To Gain Customer Attention Different Brands Performance Tracking Dashboard Introduction PDF. These are great for business strategies, office conferences, capital raising or task suggestions. If you desire to acquire more customers for your tech business and ensure they stay satisfied, create your own sales presentation with these plain slides.
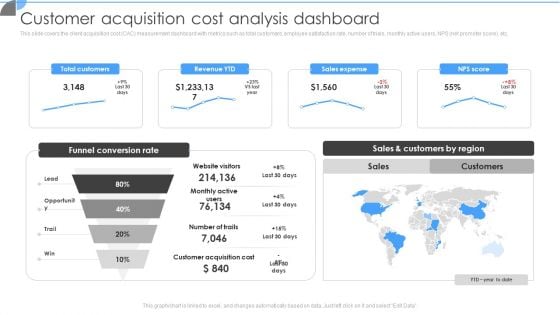
Customer Acquisition Approaches To Enhance Organization Growth Customer Acquisition Cost Analysis Dashboard Slides PDF
This slide covers the client acquisition cost CAC measurement dashboard with metrics such as total customers, employee satisfaction rate, number of trials, monthly active users, NPS net promoter score, etc. Make sure to capture your audiences attention in your business displays with our gratis customizable Customer Acquisition Approaches To Enhance Organization Growth Customer Acquisition Cost Analysis Dashboard Slides PDF. These are great for business strategies, office conferences, capital raising or task suggestions. If you desire to acquire more customers for your tech business and ensure they stay satisfied, create your own sales presentation with these plain slides.
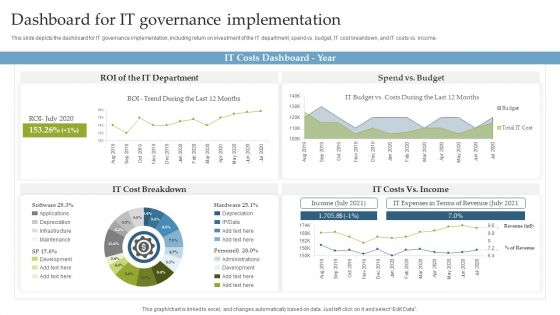
Deploying EGIT To Ensure Optimum Risk Management Dashboard For IT Governance Implementation Slides PDF
This slide depicts the dashboard for IT governance implementation, including return on investment of the IT department, spend vs. budget, IT cost breakdown, and IT costs vs. income. Make sure to capture your audiences attention in your business displays with our gratis customizable Deploying EGIT To Ensure Optimum Risk Management Dashboard For IT Governance Implementation Slides PDF. These are great for business strategies, office conferences, capital raising or task suggestions. If you desire to acquire more customers for your tech business and ensure they stay satisfied, create your own sales presentation with these plain slides.
Efficient Administration Of Product Business And Umbrella Branding Product Branding Performance Tracking Dashboard Background PDF
This slide provides information regarding product branding performance tracking dashboard in terms of revenues, new customers, customer satisfaction rate. Make sure to capture your audiences attention in your business displays with our gratis customizable Efficient Administration Of Product Business And Umbrella Branding Product Branding Performance Tracking Dashboard Background PDF. These are great for business strategies, office conferences, capital raising or task suggestions. If you desire to acquire more customers for your tech business and ensure they stay satisfied, create your own sales presentation with these plain slides.
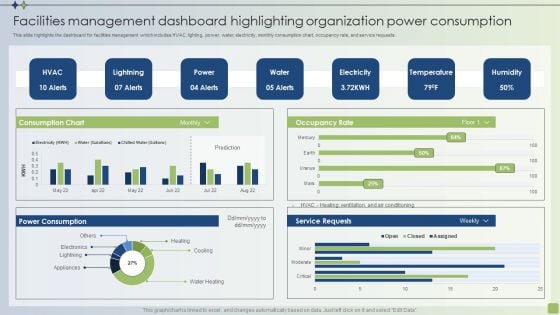
Strategic FM Services Facilities Management Dashboard Highlighting Organization Power Consumption Brochure PDF
This slide highlights the dashboard for facilities management which includes HVAC, lighting, power, water, electricity, monthly consumption chart, occupancy rate, and service requests. Make sure to capture your audiences attention in your business displays with our gratis customizable Strategic FM Services Facilities Management Dashboard Highlighting Organization Power Consumption Brochure PDF. These are great for business strategies, office conferences, capital raising or task suggestions. If you desire to acquire more customers for your tech business and ensure they stay satisfied, create your own sales presentation with these plain slides.
Dashboard To Monitor Department Wise Budget Allocation And Usage Icons PDF
This slide highlights the dashboard to monitor the department wise budget allocation and usage. It provides information regarding the total budget allocated and actual amount spent by multiple organization silos such as marketing, finance, HR. It also contains details of each departments average employee spending, Make sure to capture your audiences attention in your business displays with our gratis customizable Dashboard To Monitor Department Wise Budget Allocation And Usage Icons PDF. These are great for business strategies, office conferences, capital raising or task suggestions. If you desire to acquire more customers for your tech business and ensure they stay satisfied, create your own sales presentation with these plain slides.
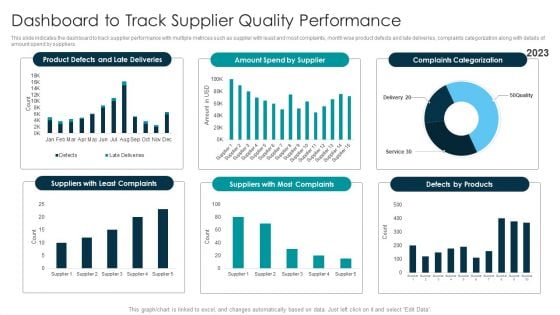
Tactical Approach For Vendor Reskilling Dashboard To Track Supplier Quality Performance Template PDF
This slide indicates the dashboard to track supplier performance with multiple metrices such as supplier with least and most complaints, month wise product defects and late deliveries, complaints categorization along with details of amount spend by suppliers. Make sure to capture your audiences attention in your business displays with our gratis customizable Tactical Approach For Vendor Reskilling Dashboard To Track Supplier Quality Performance Template PDF. These are great for business strategies, office conferences, capital raising or task suggestions. If you desire to acquire more customers for your tech business and ensure they stay satisfied, create your own sales presentation with these plain slides.
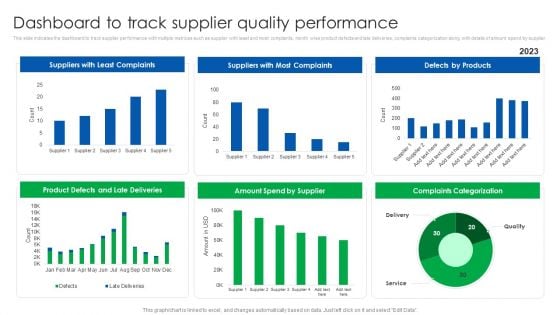
Vendor Relationship Management Strategic Plan Dashboard To Track Supplier Quality Performance Portrait PDF
This slide indicates the dashboard to track supplier performance with multiple metrices such as supplier with least and most complaints, month wise product defects and late deliveries, complaints categorization along with details of amount spend by supplier. Make sure to capture your audiences attention in your business displays with our gratis customizable Vendor Relationship Management Strategic Plan Dashboard To Track Supplier Quality Performance Portrait PDF. These are great for business strategies, office conferences, capital raising or task suggestions. If you desire to acquire more customers for your tech business and ensure they stay satisfied, create your own sales presentation with these plain slides.
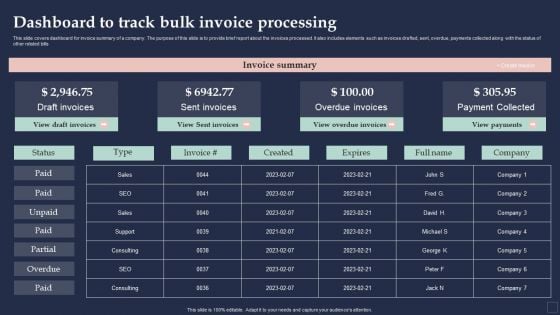
BPM System Methodology Dashboard To Track Bulk Invoice Processing Download PDF
This slide covers dashboard for invoice summary of a company. The purpose of this slide is to provide brief report about the invoices processed. It also includes elements such as invoices drafted, sent, overdue, payments collected along with the status of other related bills. Make sure to capture your audiences attention in your business displays with our gratis customizable BPM System Methodology Dashboard To Track Bulk Invoice Processing Download PDF. These are great for business strategies, office conferences, capital raising or task suggestions. If you desire to acquire more customers for your tech business and ensure they stay satisfied, create your own sales presentation with these plain slides.

Dashboard To Track Website And Application Traffic Gaining Competitive Advantage And Capturing Guidelines PDF
This slide showcases dashboard that can help organization to evaluate the traffic of website and application after entering into niche market. Its key elements are users, conversions, conversion by event type and engagement rate.Make sure to capture your audiences attention in your business displays with our gratis customizable Dashboard To Track Website And Application Traffic Gaining Competitive Advantage And Capturing Guidelines PDF. These are great for business strategies, office conferences, capital raising or task suggestions. If you desire to acquire more customers for your tech business and ensure they stay satisfied, create your own sales presentation with these plain slides.
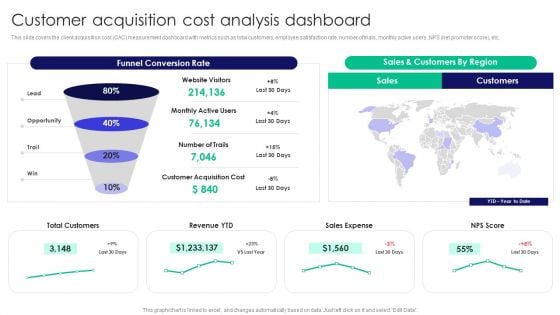
Guide To Business Customer Acquisition Customer Acquisition Cost Analysis Dashboard Download PDF
This slide covers the client acquisition cost CAC measurement dashboard with metrics such as total customers, employee satisfaction rate, number of trials, monthly active users, NPS net promoter score, etc. Make sure to capture your audiences attention in your business displays with our gratis customizable Guide To Business Customer Acquisition Customer Acquisition Cost Analysis Dashboard Download PDF. These are great for business strategies, office conferences, capital raising or task suggestions. If you desire to acquire more customers for your tech business and ensure they stay satisfied, create your own sales presentation with these plain slides.
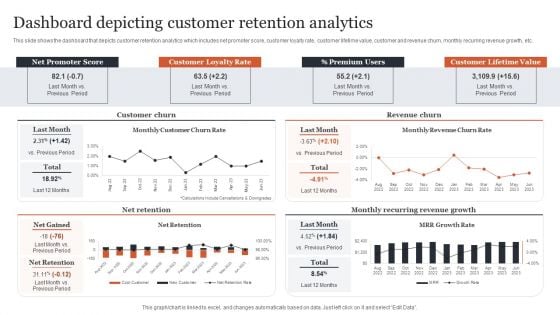
CRM Administration To Reduce Churn Rate Dashboard Depicting Customer Retention Analytics Themes PDF
This slide shows the dashboard that depicts customer retention analytics which includes net promoter score, customer loyalty rate, customer lifetime value, customer and revenue churn, monthly recurring revenue growth, etc. Make sure to capture your audiences attention in your business displays with our gratis customizable CRM Administration To Reduce Churn Rate Dashboard Depicting Customer Retention Analytics Themes PDF. These are great for business strategies, office conferences, capital raising or task suggestions. If you desire to acquire more customers for your tech business and ensure they stay satisfied, create your own sales presentation with these plain slides.
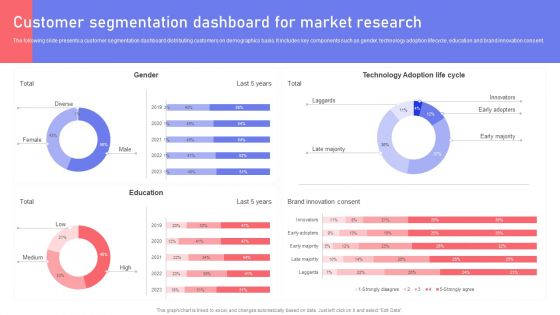
Customer Segmentation Dashboard For Market Research Ppt PowerPoint Presentation File Professional PDF
The following slide presents a customer segmentation dashboard distributing customers on demographics basis. It includes key components such as gender, technology adoption lifecycle, education and brand innovation consent. Make sure to capture your audiences attention in your business displays with our gratis customizable Customer Segmentation Dashboard For Market Research Ppt PowerPoint Presentation File Professional PDF. These are great for business strategies, office conferences, capital raising or task suggestions. If you desire to acquire more customers for your tech business and ensure they stay satisfied, create your own sales presentation with these plain slides.
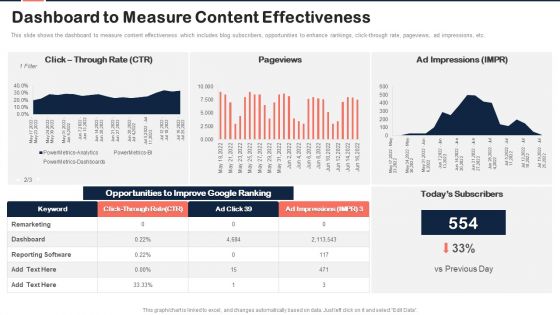
Implementing Content Marketing Plan To Nurture Leads Dashboard To Measure Content Effectiveness Summary PDF
This slide shows the dashboard to measure content effectiveness which includes blog subscribers, opportunities to enhance rankings, click through rate, pageviews, ad impressions, etc. Make sure to capture your audiences attention in your business displays with our gratis customizable Implementing Content Marketing Plan To Nurture Leads Dashboard To Measure Content Effectiveness Summary PDF. These are great for business strategies, office conferences, capital raising or task suggestions. If you desire to acquire more customers for your tech business and ensure they stay satisfied, create your own sales presentation with these plain slides.
Latest Methodologies Of Construction Ongoing Construction Project Progress Tracking Dashboard Formats PDF
This slide provides information regarding ongoing construction project progress tracking dashboard along with details such as project status, project type, project progress, etc. Make sure to capture your audiences attention in your business displays with our gratis customizable Latest Methodologies Of Construction Ongoing Construction Project Progress Tracking Dashboard Formats PDF. These are great for business strategies, office conferences, capital raising or task suggestions. If you desire to acquire more customers for your tech business and ensure they stay satisfied, create your own sales presentation with these plain slides.
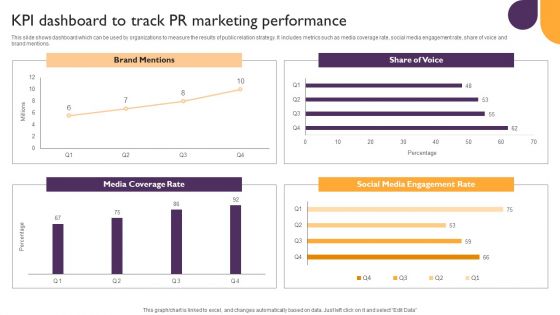
Public Relations Guide To Enhance Brand Credibility KPI Dashboard To Track PR Marketing Performance Diagrams PDF
This slide shows dashboard which can be used by organizations to measure the results of public relation strategy. It includes metrics such as media coverage rate, social media engagement rate, share of voice and brand mentions. Make sure to capture your audiences attention in your business displays with our gratis customizable Public Relations Guide To Enhance Brand Credibility KPI Dashboard To Track PR Marketing Performance Diagrams PDF. These are great for business strategies, office conferences, capital raising or task suggestions. If you desire to acquire more customers for your tech business and ensure they stay satisfied, create your own sales presentation with these plain slides.
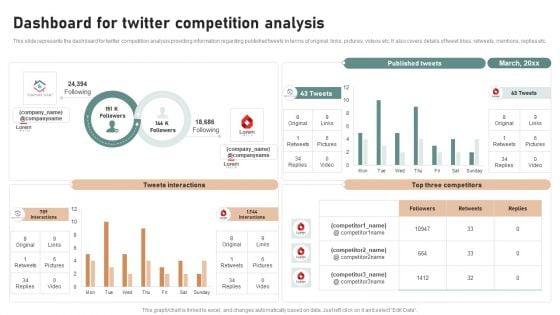
Utilizing Twitter For Social Media Dashboard For Twitter Competition Analysis Structure PDF
This slide represents the dashboard for twitter competition analysis providing information regarding published tweets in terms of original, links, pictures, videos etc. It also covers details of tweet likes, retweets, mentions, replies etc. Make sure to capture your audiences attention in your business displays with our gratis customizable Utilizing Twitter For Social Media Dashboard For Twitter Competition Analysis Structure PDF. These are great for business strategies, office conferences, capital raising or task suggestions. If you desire to acquire more customers for your tech business and ensure they stay satisfied, create your own sales presentation with these plain slides.
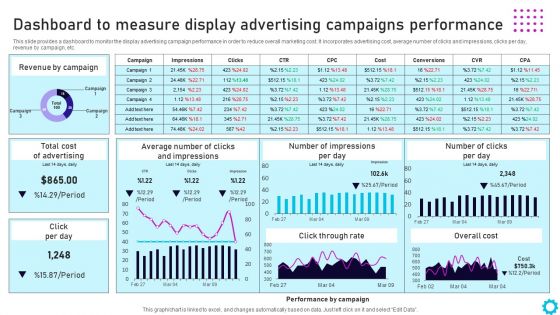
Complete Guide For Display Dashboard To Measure Display Advertising Campaigns Themes PDF
This slide provides a dashboard to monitor the display advertising campaign performance in order to reduce overall marketing cost. It incorporates advertising cost, average number of clicks and impressions, clicks per day, revenue by campaign, etc. Make sure to capture your audiences attention in your business displays with our gratis customizable Complete Guide For Display Dashboard To Measure Display Advertising Campaigns Themes PDF. These are great for business strategies, office conferences, capital raising or task suggestions. If you desire to acquire more customers for your tech business and ensure they stay satisfied, create your own sales presentation with these plain slides.
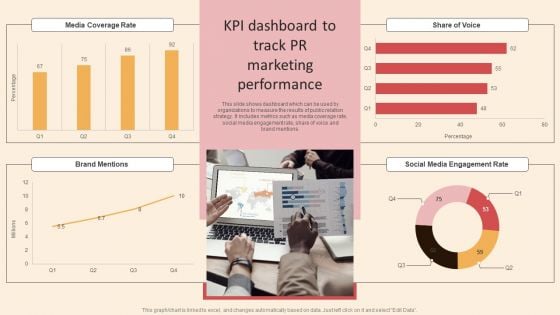
Online PR Techniques To Boost Brands Online Visibility KPI Dashboard To Track PR Marketing Summary PDF
This slide shows dashboard which can be used by organizations to measure the results of public relation strategy. It includes metrics such as media coverage rate, social media engagement rate, share of voice and brand mentions. Make sure to capture your audiences attention in your business displays with our gratis customizable Online PR Techniques To Boost Brands Online Visibility KPI Dashboard To Track PR Marketing Summary PDF. These are great for business strategies, office conferences, capital raising or task suggestions. If you desire to acquire more customers for your tech business and ensure they stay satisfied, create your own sales presentation with these plain slides.
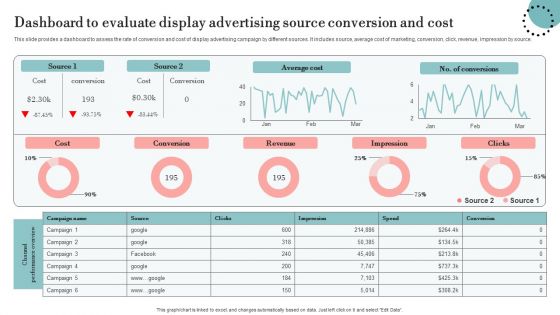
Dashboard To Evaluate Display Advertising Source Conversion And Cost Designs PDF
This slide provides a dashboard to assess the rate of conversion and cost of display advertising campaign by different sources. It includes source, average cost of marketing, conversion, click, revenue, impression by source. Make sure to capture your audiences attention in your business displays with our gratis customizable Dashboard To Evaluate Display Advertising Source Conversion And Cost Designs PDF. These are great for business strategies, office conferences, capital raising or task suggestions. If you desire to acquire more customers for your tech business and ensure they stay satisfied, create your own sales presentation with these plain slides.
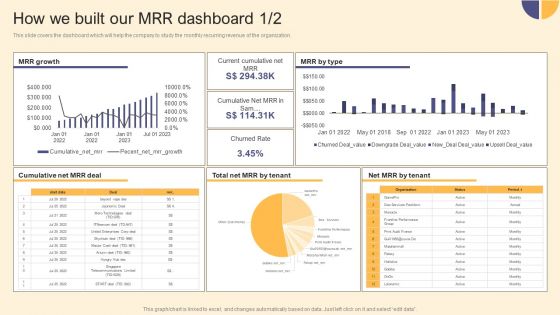
Per Device Pricing Strategy For Managed Solutions How We Built Our MRR Dashboard Infographics PDF
This slide covers the dashboard which will help the company to study the monthly recurring revenue of the organization. Make sure to capture your audiences attention in your business displays with our gratis customizable Per Device Pricing Strategy For Managed Solutions How We Built Our MRR Dashboard Infographics PDF. These are great for business strategies, office conferences, capital raising or task suggestions. If you desire to acquire more customers for your tech business and ensure they stay satisfied, create your own sales presentation with these plain slides.
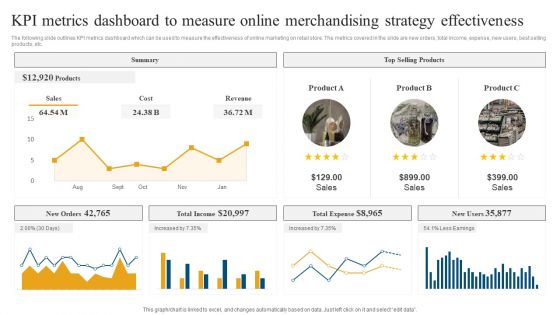
Retail Ecommerce Merchandising Tactics For Boosting Revenue KPI Metrics Dashboard To Measure Online Background PDF
The following slide outlines KPI metrics dashboard which can be used to measure the effectiveness of online marketing on retail store. The metrics covered in the slide are new orders, total income, expense, new users, best selling products, etc. Make sure to capture your audiences attention in your business displays with our gratis customizable Retail Ecommerce Merchandising Tactics For Boosting Revenue KPI Metrics Dashboard To Measure Online Background PDF. These are great for business strategies, office conferences, capital raising or task suggestions. If you desire to acquire more customers for your tech business and ensure they stay satisfied, create your own sales presentation with these plain slides.
Key Elements Of Strategic Brand Administration Customer Tracking Dashboard To Monitor Brand Loyalty Information PDF
This slide provides information brand loyalty tracking dashboard in order to monitor customer engagement, average revenues, new vs. returning visitors performance, etc. Make sure to capture your audiences attention in your business displays with our gratis customizable Key Elements Of Strategic Brand Administration Customer Tracking Dashboard To Monitor Brand Loyalty Information PDF. These are great for business strategies, office conferences, capital raising or task suggestions. If you desire to acquire more customers for your tech business and ensure they stay satisfied, create your own sales presentation with these plain slides.
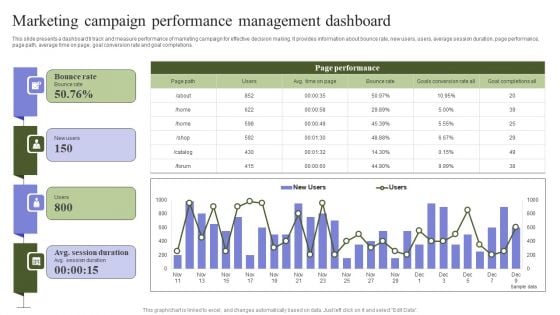
Marketing Mix Strategy Handbook Marketing Campaign Performance Management Dashboard Professional PDF
This slide presents a dashboard ti track and measure performance of marketing campaign for effective decision making. It provides information about bounce rate, new users, users, average session duration, page performance, page path, average time on page, goal conversion rate and goal completions. Make sure to capture your audiences attention in your business displays with our gratis customizable Marketing Mix Strategy Handbook Marketing Campaign Performance Management Dashboard Professional PDF. These are great for business strategies, office conferences, capital raising or task suggestions. If you desire to acquire more customers for your tech business and ensure they stay satisfied, create your own sales presentation with these plain slides.
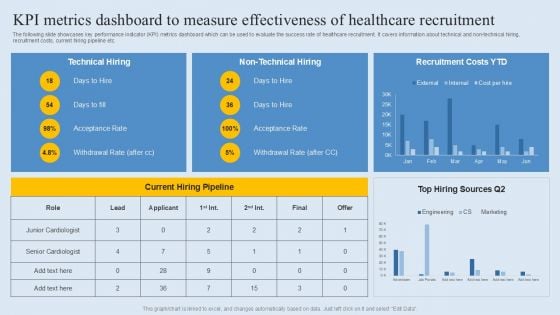
KPI Metrics Dashboard To Measure Effectiveness Of Healthcare Recruitment Demonstration PDF
AIM Principles For Data Storage Application Cost Dashboard Ppt Icon Diagrams PDF
Deliver an awe inspiring pitch with this creative aim principles for data storage application cost dashboard ppt icon diagrams pdf bundle. Topics like investment, department, budget, cost, comparison can be discussed with this completely editable template. It is available for immediate download depending on the needs and requirements of the user.
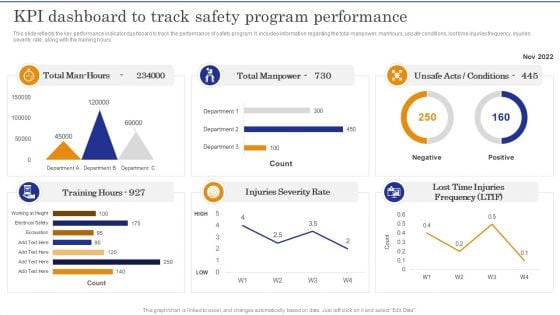
Construction Site Safety Measure KPI Dashboard To Track Safety Program Performance Slides PDF
This slide reflects the key performance indicator dashboard to track the performance of safety program. It includes information regarding the total manpower, manhours, unsafe conditions, lost time injuries frequency, injuries severity rate, along with the training hours.Slidegeeks has constructed Construction Site Safety Measure KPI Dashboard To Track Safety Program Performance Slides PDF after conducting extensive research and examination. These presentation templates are constantly being generated and modified based on user preferences and critiques from editors. Here, you will find the most attractive templates for a range of purposes while taking into account ratings and remarks from users regarding the content. This is an excellent jumping-off point to explore our content and will give new users an insight into our top-notch PowerPoint Templates.
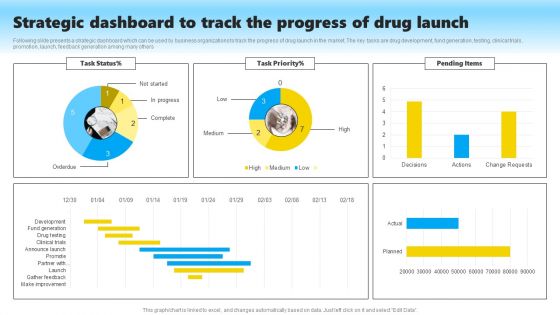
Strategic Dashboard To Track The Progress Of Drug Launch Structure PDF
Following slide presents a strategic dashboard which can be used by business organizations to track the progress of drug launch in the market. The key tasks are drug development, fund generation, testing, clinical trials, promotion, launch, feedback generation among many others. Pitch your topic with ease and precision using this Strategic Dashboard To Track The Progress Of Drug Launch Structure PDF. This layout presents information on Drug Development, Fund Generation, Testing, Clinical Trials, Promotion, Launch, Feedback Generation. It is also available for immediate download and adjustment. So, changes can be made in the color, design, graphics or any other component to create a unique layout.
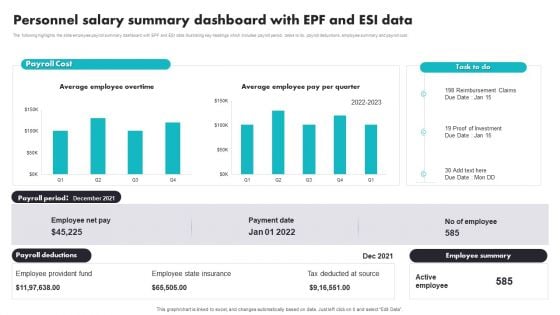
Personnel Salary Summary Dashboard With EPF And ESI Data Brochure PDF
The following highlights the slide employee payroll summary dashboard with EPF and ESI data illustrating key headings which includes payroll period, tasks to do, payroll deductions, employee summary and payroll cost. Pitch your topic with ease and precision using this Personnel Salary Summary Dashboard With EPF And ESI Data Brochure PDF. This layout presents information on Employee Provident Fund, Employee State Insurance, Tax Deducted At Source. It is also available for immediate download and adjustment. So, changes can be made in the color, design, graphics or any other component to create a unique layout.
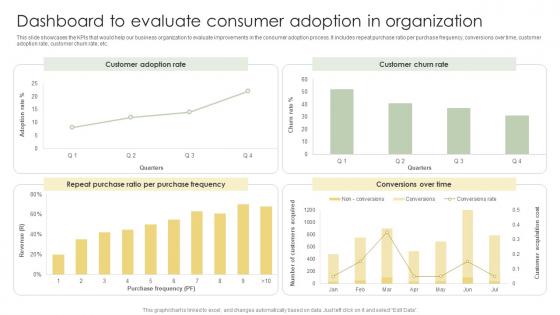
Dashboard To Evaluate Consumer Adoption In Organization Analyzing Customer Adoption Information Pdf
This slide showcases the KPIs that would help our business organization to evaluate improvements in the consumer adoption process. It includes repeat purchase ratio per purchase frequency, conversions over time, customer adoption rate, customer churn rate, etc.Slidegeeks is here to make your presentations a breeze with Dashboard To Evaluate Consumer Adoption In Organization Analyzing Customer Adoption Information Pdf With our easy-to-use and customizable templates, you can focus on delivering your ideas rather than worrying about formatting. With a variety of designs to choose from, you are sure to find one that suits your needs. And with animations and unique photos, illustrations, and fonts, you can make your presentation pop. So whether you are giving a sales pitch or presenting to the board, make sure to check out Slidegeeks first. This slide showcases the KPIs that would help our business organization to evaluate improvements in the consumer adoption process. It includes repeat purchase ratio per purchase frequency, conversions over time, customer adoption rate, customer churn rate, etc.
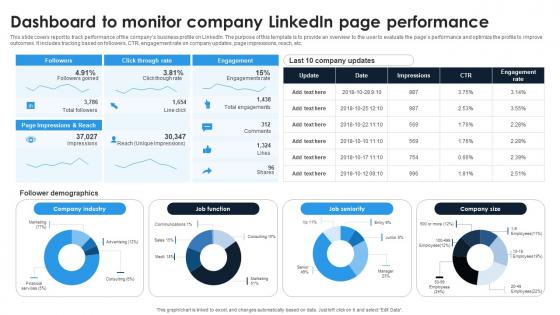
Linkedin Content Strategies Dashboard To Monitor Company Linkedin Page MKT SS V
This slide covers report to track performance of the compans business profile on LinkedIn. The purpose of this template is to provide an overview to the user to evaluate the pages performance and optimize the profile to improve outcomes. It includes tracking based on followers, CTR, engagement rate on company updates, page impressions, reach, etc. Slidegeeks is here to make your presentations a breeze with Linkedin Content Strategies Dashboard To Monitor Company Linkedin Page MKT SS V With our easy-to-use and customizable templates, you can focus on delivering your ideas rather than worrying about formatting. With a variety of designs to choose from, you are sure to find one that suits your needs. And with animations and unique photos, illustrations, and fonts, you can make your presentation pop. So whether you are giving a sales pitch or presenting to the board, make sure to check out Slidegeeks first This slide covers report to track performance of the compans business profile on LinkedIn. The purpose of this template is to provide an overview to the user to evaluate the pages performance and optimize the profile to improve outcomes. It includes tracking based on followers, CTR, engagement rate on company updates, page impressions, reach, etc.
Healthcare Management KPI Dashboard Showing Incidents Severity And Consequences Ppt PowerPoint Presentation Icon Model
Presenting this set of slides with name healthcare management kpi dashboard showing incidents severity and consequences ppt powerpoint presentation icon model. The topics discussed in these slides are finance, marketing, management, investment, analysis. This is a completely editable PowerPoint presentation and is available for immediate download. Download now and impress your audience.
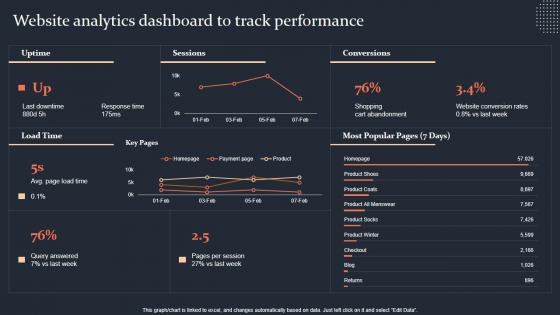
Website Analytics Dashboard To Track Performance Step By Step Guide Inspiration PDF
This graph chart is linked to excel, and changes automatically based on data. Just left click on it and select Edit Data. Slidegeeks is here to make your presentations a breeze with Website Analytics Dashboard To Track Performance Step By Step Guide Inspiration PDF With our easy-to-use and customizable templates, you can focus on delivering your ideas rather than worrying about formatting. With a variety of designs to choose from, you are sure to find one that suits your needs. And with animations and unique photos, illustrations, and fonts, you can make your presentation pop. So whether you are giving a sales pitch or presenting to the board, make sure to check out Slidegeeks first This graph chart is linked to excel, and changes automatically based on data. Just left click on it and select Edit Data.

Patient Health And Risk Key Performance Indicator Dashboard Ppt Infographic Template Summary PDF
The following slide highlights the patient health and safety key performance indicator dashboard illustrating admission by department, admission by cost, patient satisfaction, total patients, operations cost, patient density, total staff, waiting time, treatment satisfaction and treatment confidence. Pitch your topic with ease and precision using this Patient Health And Risk Key Performance Indicator Dashboard Ppt Infographic Template Summary PDF. This layout presents information on Admission By Department, Admission Vs Cost, Patient Satisfaction. It is also available for immediate download and adjustment. So, changes can be made in the color, design, graphics or any other component to create a unique layout.
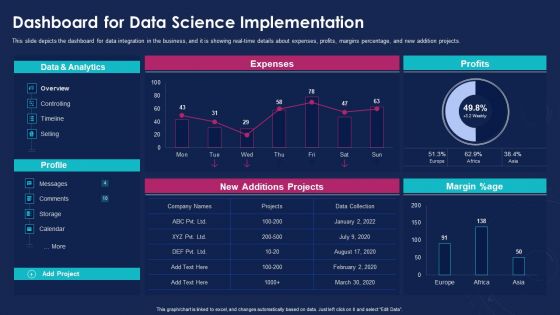
Data Analytics IT Dashboard For Data Science Implementation Ppt Portfolio Pictures PDF
This slide depicts the dashboard for data integration in the business, and it is showing real-time details about expenses, profits, margins percentage, and new addition projects. Deliver and pitch your topic in the best possible manner with this data analytics it dashboard for data science implementation ppt portfolio pictures pdf. Use them to share invaluable insights on data and analytics, margin percentage, profits, expenses, new additions projects and impress your audience. This template can be altered and modified as per your expectations. So, grab it now.
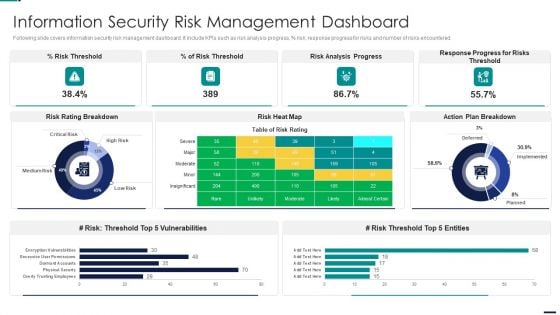
Risk Management Model For Data Security Information Security Risk Management Dashboard Pictures PDF
Following slide covers information security risk management dashboard. It include KPIs such as risk analysis progress, percent risk, response progress for risks and number of risks encountered. Deliver an awe inspiring pitch with this creative Risk Management Model For Data Security Information Security Risk Management Dashboard Pictures PDF bundle. Topics like Risk Threshold, Risk Analysis Progress, Response Progress For Risks Threshold, Action Plan Breakdown can be discussed with this completely editable template. It is available for immediate download depending on the needs and requirements of the user.

Iot And Digital Twin To Reduce Costs Post Covid Healthcare Dashboard Showing Analytical Data Elements PDF
This slide shows the healthcare dashboard that presents analytical data such as occupancy, patient turnover, efficiency and costs, satisfaction and service indicators. Deliver and pitch your topic in the best possible manner with this iot and digital twin to reduce costs post covid healthcare dashboard showing analytical data elements pdf. Use them to share invaluable insights on occupancy, patient turnover, efficiency and costs, satisfaction and service indicators and impress your audience. This template can be altered and modified as per your expectations. So, grab it now.
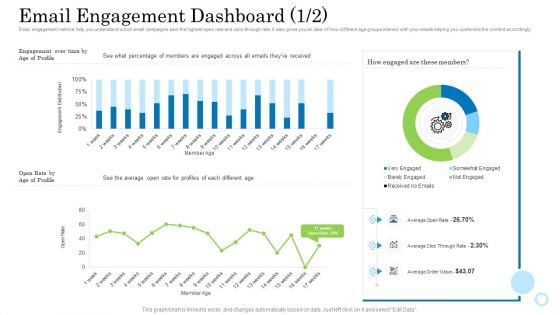
Customer Behavioral Data And Analytics Email Engagement Dashboard Rate Designs PDF
Email engagement metrics help you understand which email campaigns saw the highest open rate and click-through rate. It also gives you an idea of how different age groups interact with your emails helping you customize the content accordingly. Deliver an awe inspiring pitch with this creative customer behavioral data and analytics email engagement dashboard rate designs pdf bundle. Topics like email engagement dashboard can be discussed with this completely editable template. It is available for immediate download depending on the needs and requirements of the user.

Multiple Point Of Sale System Dashboard Depicting Restaurants Daily Performance Mockup PDF
This Slide represents point of sale system dashboard depicting restaurants daily performance which can be beneficial for eateries to manage their regular sales. It includes information about sales, expenditure, menu, customer data, bookings and reports. Persuade your audience using this Multiple Point Of Sale System Dashboard Depicting Restaurants Daily Performance Mockup PDF. This PPT design covers four stages, thus making it a great tool to use. It also caters to a variety of topics including Expenditure, Sales, Customer Data. Download this PPT design now to present a convincing pitch that not only emphasizes the topic but also showcases your presentation skills.


 Continue with Email

 Home
Home


