Problem Solving
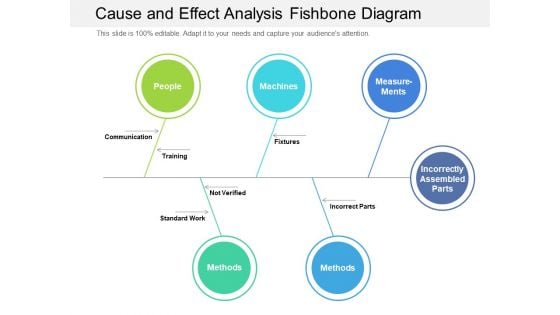
Cause And Effect Analysis Fishbone Diagram Ppt PowerPoint Presentation Gallery Designs PDF
Presenting this set of slides with name cause and effect analysis fishbone diagram ppt powerpoint presentation gallery designs pdf. This is a five stage process. The stages in this process are communication, training, fixtures. This is a completely editable PowerPoint presentation and is available for immediate download. Download now and impress your audience.

Cause And Effect Puzzle Diagram Ppt Powerpoint Presentation Layouts
This is a cause and effect puzzle diagram ppt powerpoint presentation layouts. This is a two stage process. The stages in this process are action and reaction, causality, causes and effects.
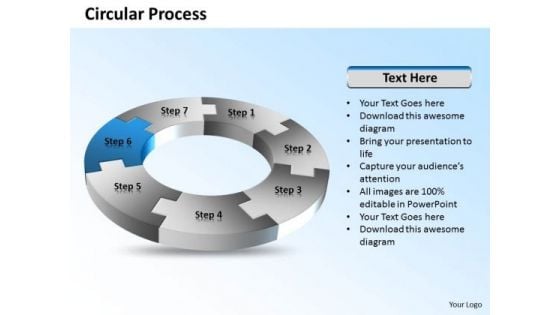
Ppt 7 Stages Circular Process Flow Cause And Effect Diagram PowerPoint Template Templates
PPT 7 stages circular process flow cause and effect diagram powerpoint template Templates-This diagram can use to examine all of business activities, and see how they're connected. This image has been conceived to enable you to emphatically communicate your ideas that can help you understand the sources of value for your organization. Add charm and personality to your presentations with our stunning high quality PowerPoint Template.-PPT 7 stages circular process flow cause and effect diagram powerpoint template Templates-Arrows, Background, Business, Chart, Circle, Circular, Financial, Flow, Graphic, Gray, Icon, Illustration, Isometric, Perspective, Process, Recycle, Round, Shape, Flow, Marketing, Leadership, Steps Announce plans with our Ppt 7 Stages Circular Process Flow Cause And Effect Diagram PowerPoint Template Templates. You will come out on top.

root cause analysis ppt powerpoint presentation styles introduction
This is a root cause analysis ppt powerpoint presentation styles introduction. This is a one stage process. The stages in this process are business, management, analysis, success.
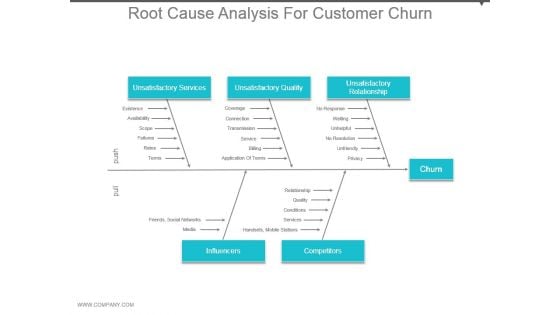
Root Cause Analysis For Customer Churn Ppt Examples Slides
This is a root cause analysis for customer churn ppt examples slides. This is a five stage process. The stages in this process are unsatisfactory services, unsatisfactory quality, unsatisfactory relationship, churn, influencers, competitors.
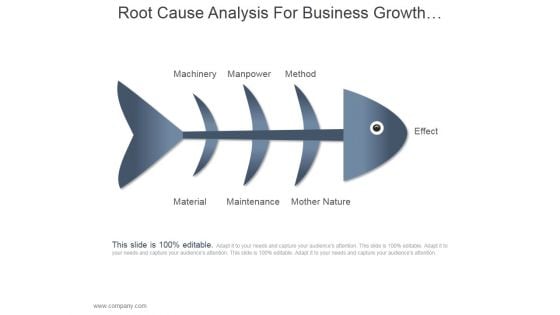
Root Cause Analysis For Business Growth Ppt PowerPoint Presentation Layouts
This is a root cause analysis for business growth ppt powerpoint presentation layouts. This is a three stage process. The stages in this process are machinery, manpower, method, effect, material, maintenance, mother nature.
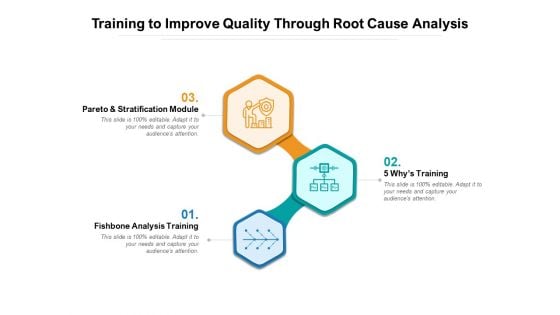
Training To Improve Quality Through Root Cause Analysis Ppt PowerPoint Presentation Outline Topics PDF
Presenting this set of slides with name training to improve quality through root cause analysis ppt powerpoint presentation outline topics pdf. This is a three stage process. The stages in this process are pareto And stratification module, fishbone analysis training, 5 whys training. This is a completely editable PowerPoint presentation and is available for immediate download. Download now and impress your audience.
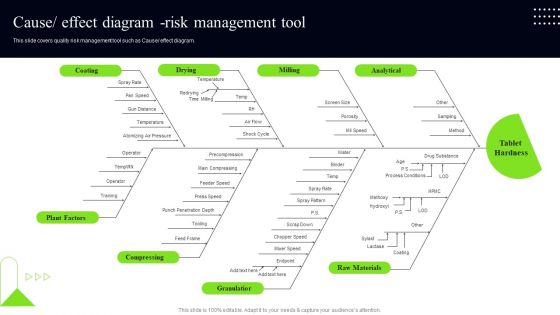
Quality Assessment Cause Effect Diagram Risk Management Tool Clipart PDF
This slide covers quality risk management tool such as Cause effect diagram. Create an editable Quality Assessment Cause Effect Diagram Risk Management Tool Clipart PDF that communicates your idea and engages your audience. Whether youre presenting a business or an educational presentation, pre designed presentation templates help save time. Quality Assessment Cause Effect Diagram Risk Management Tool Clipart PDF is highly customizable and very easy to edit, covering many different styles from creative to business presentations. Slidegeeks has creative team members who have crafted amazing templates. So, go and get them without any delay.
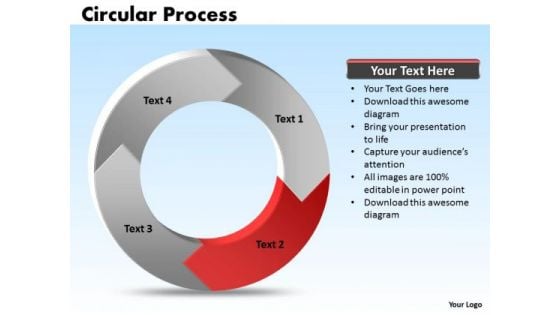
Ppt 4 Stages Process Cycle Cause And Effect Diagram PowerPoint Template Templates
PPT 4 stages process cycle cause and effect diagram powerpoint template Templates-This process cycle cause and effect diagram is an outstanding communication tool. Use this structured, systematic, compartmentalized layout to evaluate the causes of a particular effect. Steal the affection of your audience. Our Ppt 4 Stages Process Cycle Cause And Effect Diagram PowerPoint Template Templates will abet you in the crime.
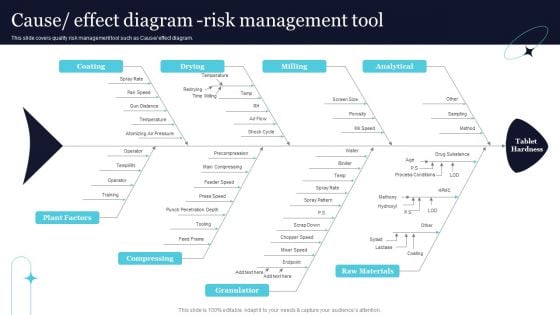
Quality Evaluation Cause Effect Diagram Risk Management Tool Mockup PDF
This slide covers quality risk management tool such as Cause or effect diagram. If you are looking for a format to display your unique thoughts, then the professionally designed Quality Evaluation Cause Effect Diagram Risk Management Tool Mockup PDF is the one for you. You can use it as a Google Slides template or a PowerPoint template. Incorporate impressive visuals, symbols, images, and other charts. Modify or reorganize the text boxes as you desire. Experiment with shade schemes and font pairings. Alter, share or cooperate with other people on your work. Download Quality Evaluation Cause Effect Diagram Risk Management Tool Mockup PDF and find out how to give a successful presentation. Present a perfect display to your team and make your presentation unforgettable.
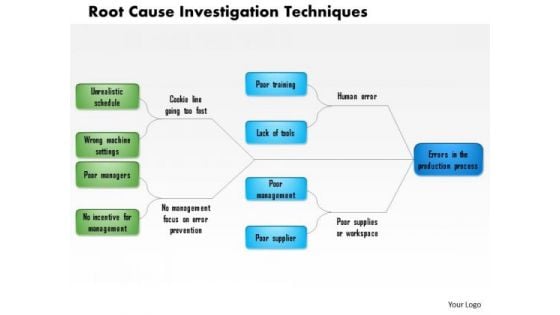
Business Framework Root Cause Investigation Techniques PowerPoint Presentation
A linear flow chart has been used to design this Power Point template slide. This diagram slide contains the concept of root cause analysis and investigation techniques. Use this diagram slide for your business and marketing presentation and show root cause analysis.

Quality And Patient Safety Enhancement Strategy For Healthcare Company Portrait PDF
This slide explains about the plan that the healthcare department is going to improve for the betterment of patients and for improving the quality of the work. This can be done through various steps such as defining a problem, data collection and analysis of root cause by doing some test for getting best solutions to implement them for further process and at the end shares the result.Presenting Quality And Patient Safety Enhancement Strategy For Healthcare Company Portrait PDF to dispense important information. This template comprises six stages. It also presents valuable insights into the topics including Evaluate Result, Solution Implementation, Cause Analysis. This is a completely customizable PowerPoint theme that can be put to use immediately. So, download it and address the topic impactfully.
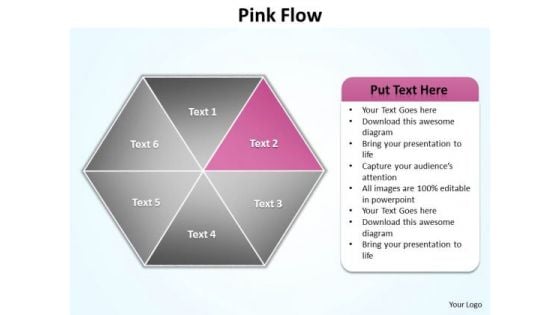
Ppt Pink Factor Hexagon Cause And Effect Diagram PowerPoint Template Editable Templates
PPT pink factor hexagon cause and effect diagram PowerPoint template editable Templates-The Diagram offers an excellent background to build up the various stages of your business process. This PowerPoint Process Chart shows the seven Different Layers which are to be followed in any business. This Business Diagram can be used in Marketing, Banking, and Management etc. -PPT pink factor hexagon cause and effect diagram PowerPoint template editable Templates-attached, backgrounds, blue, cell, color, component, connect, connection, diagram, elements, geometric, graphic, group, hexagon, honeycomb, icon, illustration, intricacy, lines, link, map, mesh, model, network, science, shape, shiny, strategy, structure, symbol, teamwork, technology Dwell on your exploits with our Ppt Pink Factor Hexagon Cause And Effect Diagram PowerPoint Template Editable Templates. Bring out the courage of your actions.

Company Vulnerability Administration Analyze Root Causes Sample Professional PDF
Presenting company vulnerability administration analyze root causes sample pdf professional pdf to provide visual cues and insights. Share and navigate important information on four stages that need your due attention. This template can be used to pitch topics like perform root cause analysis, develop corrective actions to address root cause, update the vulnerability repository, monitor effect of corrective actions. In addtion, this PPT design contains high resolution images, graphics, etc, that are easily editable and available for immediate download.
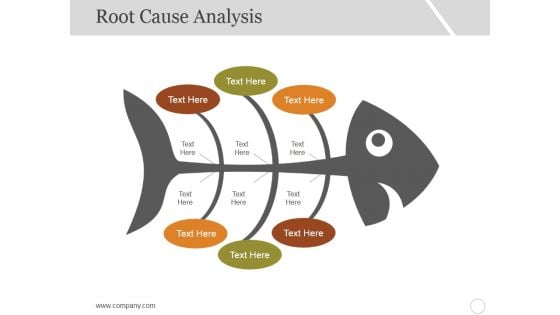
Root Cause Analysis Ppt PowerPoint Presentation Layouts Shapes
This is a root cause analysis ppt powerpoint presentation layouts shapes. This is a three stage process. The stages in this process are linear, business, marketing, management.
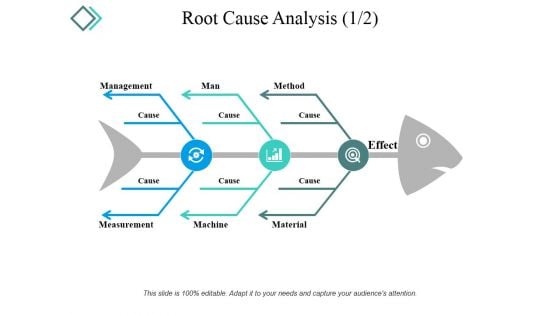
Root Cause Analysis Template 1 Ppt PowerPoint Presentation Inspiration Visuals
This is a root cause analysis template 1 ppt powerpoint presentation inspiration visuals. This is a three stage process. The stages in this process are management, cause, method, man, effect, material.
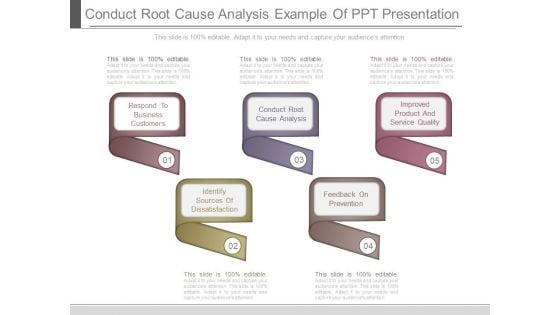
Conduct Root Cause Analysis Example Of Ppt Presentation
This is a conduct root cause analysis example of ppt presentation. This is a five stage process. The stages in this process are respond to business customers, conduct root cause analysis, improved product and service quality, identify sources of dissatisfaction, feedback on prevention.
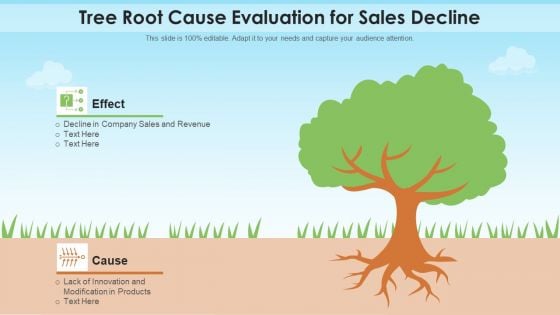
Tree Root Cause Evaluation For Sales Decline Graphics PDF
Presenting tree root cause evaluation for sales decline graphics pdf to dispense important information. This template comprises two stages. It also presents valuable insights into the topics including tree root cause evaluation for sales decline. This is a completely customizable PowerPoint theme that can be put to use immediately. So, download it and address the topic impactfully.
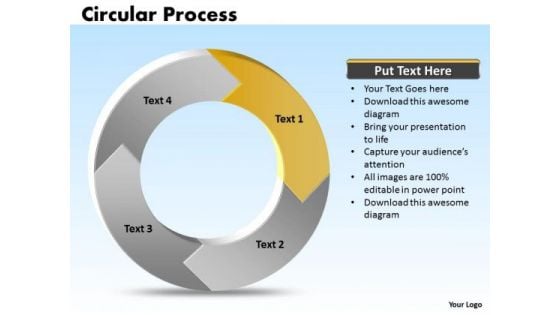
Ppt Cycle Process Cause And Effect Diagram PowerPoint Template 4 Stages Templates
PPT cycle process cause and effect diagram powerpoint template 4 stages Templates-Visually support your Microsoft office PPT Presentation with our above template. This diagram shows the flow of control between activities. You can model the sequential steps in a process with this diagram-PPT cycle process cause and effect diagram powerpoint template 4 stages Templates-Arrow, Chart, Circular Procedure, Color, Colorful, Connect, Connection, Design, Diagram, Finance, Graphic, Group, Growth, Icon, Illustration, Marketing, Pieces, Process, Recycle, Recycling, Round, Set, Strategy, Symbol, Wheel Make it a festival of ideas with our Ppt Cycle Process Cause And Effect Diagram PowerPoint Template 4 Stages Templates. Your audience will be up for a celebration.

Ppt Components Of Circular Process Cause And Effect Diagram PowerPoint Template Templates
PPT components of circular process cause and effect diagram powerpoint template Templates-This circular flow diagram illustrates the economic exchange that takes place in the building of wealth. Adjust the above image in your PPT presentations to visually support your content in your Business PPT slideshows-PPT components of circular process cause and effect diagram powerpoint template Templates-Arrow, Chart, Circular, Color, Colorful, Connect, Connection, Design, Diagram, Finance, Graphic, Group, Growth, Icon, Illustration, Marketing, Pieces, Process, Recycle, Recycling, Round, Set, Strategy, Symbol, Wheel Our Ppt Components Of Circular Process Cause And Effect Diagram PowerPoint Template Templates will become an extension of you. They will get in character with your thoughts.
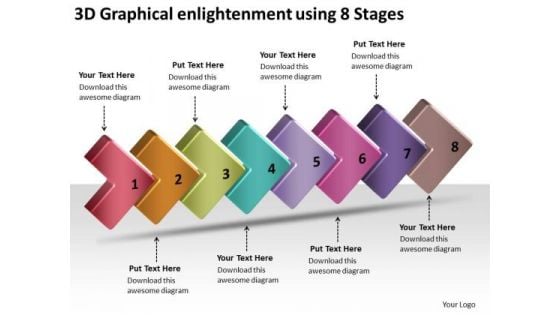
3d Graphical Enlightenment Using 8 Stages Free Flow Charts PowerPoint Slides
We present our 3d graphical enlightenment using 8 stages free flow charts PowerPoint Slides.Use our Arrows PowerPoint Templates because,There is a very good saying that prevention is better than cure, either way you have a store of knowledge for sure. Use our Shapes PowerPoint Templates because, Your quicksilver ideas are the arrows in your quiver. Use our Signs PowerPoint Templates because,This template with an image of helps you chart the course of your presentation. Use our Business PowerPoint Templates because,The NASA Space programme took mankind to the moon and so much more. Like them you too can look far beyond normal boundaries. Show them that in your mind the sky is certainly not the limit Use our Process and Flows PowerPoint Templates because, It is in your DNA to analyse possible causes to the minutest detail.Use these PowerPoint slides for presentations relating to brainy, brilliant, bulb, concept, conceptual, creative, enlightened, future, graphic, head, human, idea, ideation, illustration, innovation, inspiration, intelligence, intelligent, inventive, light, mental, mind, plant, power, psychology, remedy, solve, strike, symbol, thought, wisdom. The prominent colors used in the PowerPoint template are Red, Brown, Green. People tell us our 3d graphical enlightenment using 8 stages free flow charts PowerPoint Slides are Elegant. The feedback we get is that our enlightened PowerPoint templates and PPT Slides are Whimsical. People tell us our 3d graphical enlightenment using 8 stages free flow charts PowerPoint Slides are Whimsical. Presenters tell us our bulb PowerPoint templates and PPT Slides are No-nonsense. The feedback we get is that our 3d graphical enlightenment using 8 stages free flow charts PowerPoint Slides are specially created by a professional team with vast experience. They diligently strive to come up with the right vehicle for your brilliant Ideas. Professionals tell us our enlightened PowerPoint templates and PPT Slides are Reminiscent. So far, so good is not enough. Go further and better with our 3d Graphical Enlightenment Using 8 Stages Free Flow Charts PowerPoint Slides.

Root Cause Analysis Ppt PowerPoint Presentation Example 2015
This is a root cause analysis ppt powerpoint presentation example 2015. This is a three stage process. The stages in this process are business, strategy, marketing, success, growth strategy, arrow.
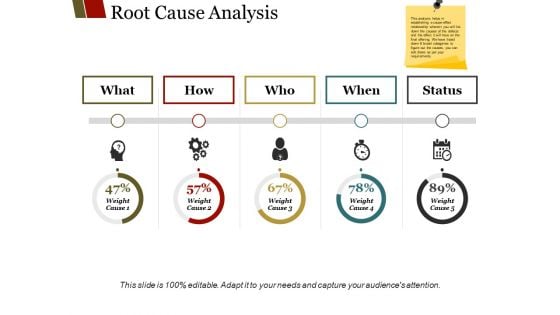
Root Cause Analysis Template 2 Ppt PowerPoint Presentation Outline Pictures
This is a root cause analysis template 2 ppt powerpoint presentation outline pictures. This is a five stage process. The stages in this process are what, how, who, when, status.

Root Cause Analysis Template 1 Ppt PowerPoint Presentation File Gallery
This is a root cause analysis template 1 ppt powerpoint presentation file gallery. This is a three stage process. The stages in this process are management, measurement, machine, man, method.
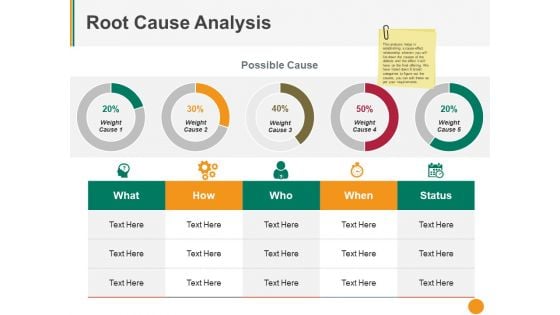
Root Cause Analysis Template 2 Ppt PowerPoint Presentation Outline Slides
This is a root cause analysis template 2 ppt powerpoint presentation outline slides. This is a five stage process. The stages in this process are what, how, who, when, status.

Root Cause Analysis Template 1 Ppt PowerPoint Presentation Slides Brochure
This is a root cause analysis template 1 ppt powerpoint presentation slides brochure. This is a three stage process. The stages in this process are management, man, method, measurement, machine, material.
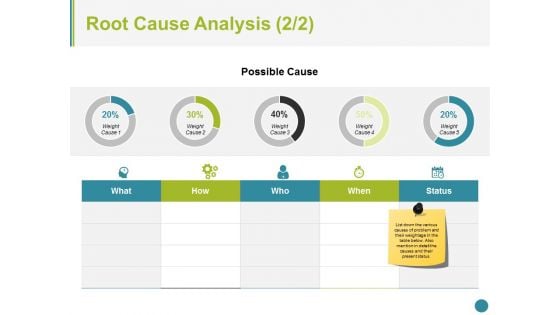
Root Cause Analysis Template 2 Ppt PowerPoint Presentation Styles Graphics
This is a root cause analysis template 2 ppt powerpoint presentation styles graphics. This is a five stage process. The stages in this process are business, icons, marketing, strategy, process.
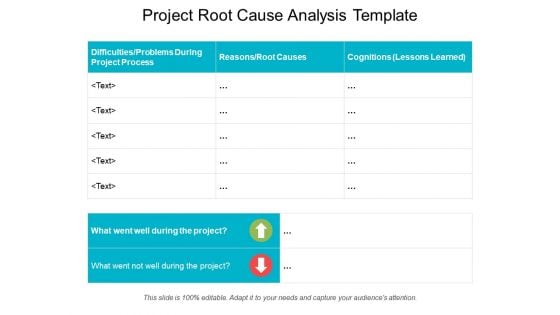
Project Root Cause Analysis Template Ppt PowerPoint Presentation Professional Show
This is a project root cause analysis template ppt powerpoint presentation professional show. This is a three stage process. The stages in this process are project analysis, project review, project performance management.
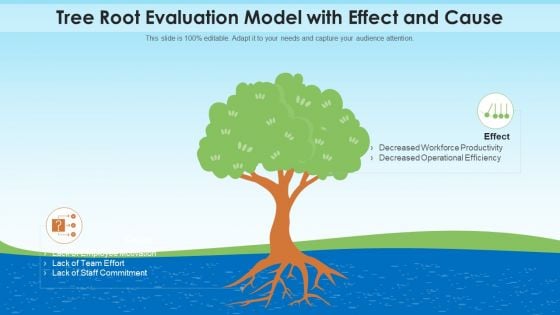
Tree Root Evaluation Model With Effect And Cause Designs PDF
Persuade your audience using this tree root evaluation model with effect and cause designs pdf. This PPT design covers two stages, thus making it a great tool to use. It also caters to a variety of topics including tree root evaluation model with effect and cause. Download this PPT design now to present a convincing pitch that not only emphasizes the topic but also showcases your presentation skills.
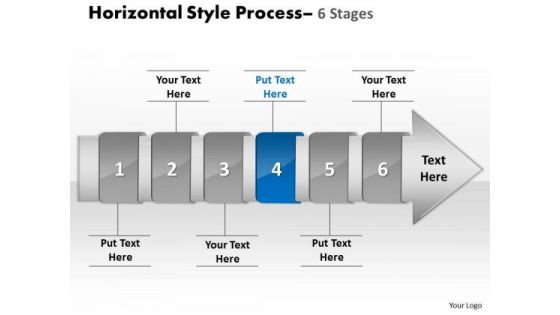
Ppt Horizontal Flow Of 6 Stage Cause And Effect Diagram PowerPoint Template 5 Graphic
We present our PPT horizontal flow of 6 stage cause and effect diagram PowerPoint template 5 Graphic. Use our Design PowerPoint Templates because, you have made significant headway in this field. Use our Shapes PowerPoint Templates because, are the tools that helped most of us evolve. Use our Business PowerPoint Templates because, Marketing Strategy Business Template: - Maximizing sales of your product is the intended destination. Use our Process and Flows PowerPoint Templates because, However there is a key aspect to be emphasized. Use our Arrows PowerPoint Templates because; in any endeavor people matter most. Use these PowerPoint slides for presentations relating to accent, advertisement, aqua, arrow, blank, business, button, collection, color, decoration, design, direction, element, empty, financial, flow, graph, green, grey, horizontal, instruction, isolated, placard, process, promo, promotion, sale, set, shape, shiny, silver, steps, symbol. The prominent colors used in the PowerPoint template are Blue navy, White, Gray Let the audience experience the beauty of our Ppt Horizontal Flow Of 6 Stage Cause And Effect Diagram PowerPoint Template 5 Graphic. They will be beholden to you.

Fishbone Ishikawa Cause And Effect Analysis How Do I Do It Contd Communication Ppt PowerPoint Presentation Show Layout PDF
Presenting this set of slides with name fishbone ishikawa cause and effect analysis how do i do it contd communication ppt powerpoint presentation show layout pdf. This is a one stage process. The stages in this process are align output cause categories, brainstorming, business situation. This is a completely editable PowerPoint presentation and is available for immediate download. Download now and impress your audience.
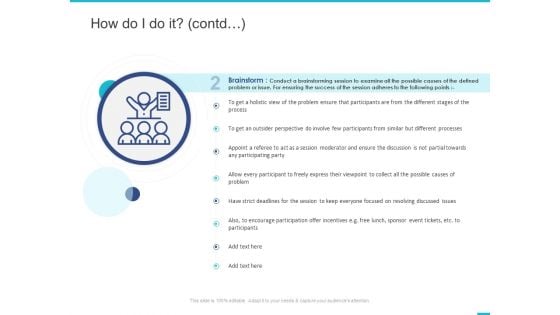
Fishbone Ishikawa Cause And Effect Analysis How Do I Do It Contd Ppt PowerPoint Presentation Styles Template PDF
Presenting this set of slides with name fishbone ishikawa cause and effect analysis how do i do it contd ppt powerpoint presentation styles template pdf. This is a one stage process. The stages in this process are brainstorm, brainstorming session, involve, encourage participation. This is a completely editable PowerPoint presentation and is available for immediate download. Download now and impress your audience.
Fishbone Ishikawa Cause And Effect Analysis Sources Of Variation Method Ppt PowerPoint Presentation Icon Example Topics PDF
Presenting this set of slides with name fishbone ishikawa cause and effect analysis sources of variation method ppt powerpoint presentation icon example topics pdf. The topics discussed in these slides are different methods followed produce products, alterations caused inappropriate methods, processes, effectiveness. This is a completely editable PowerPoint presentation and is available for immediate download. Download now and impress your audience.
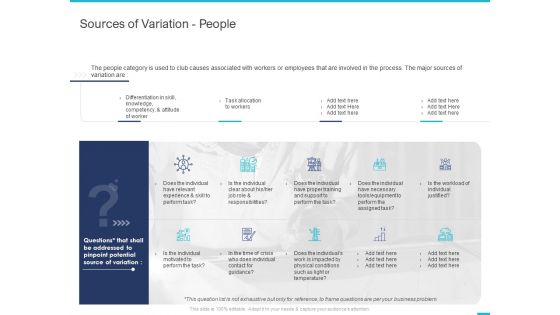
Fishbone Ishikawa Cause And Effect Analysis Sources Of Variation People Ppt PowerPoint Presentation Infographics Designs Download PDF
Presenting this set of slides with name fishbone ishikawa cause and effect analysis sources of variation people ppt powerpoint presentation infographics designs download pdf. The topics discussed in these slides are skill, knowledge, attitude worker, individual justified, equipment. This is a completely editable PowerPoint presentation and is available for immediate download. Download now and impress your audience.
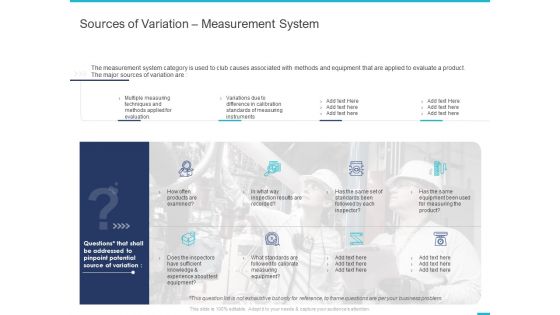
Fishbone Ishikawa Cause And Effect Analysis Sources Of Variation Measurement System Ppt PowerPoint Presentation Layouts Graphic Tips PDF
Presenting this set of slides with name fishbone ishikawa cause and effect analysis sources of variation measurement system ppt powerpoint presentation layouts graphic tips pdf. The topics discussed in these slides are multiple measuring, variations due difference, measuring instruments, equipment, knowledge and experience. This is a completely editable PowerPoint presentation and is available for immediate download. Download now and impress your audience.
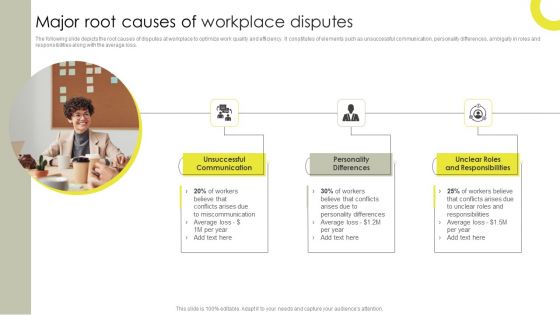
Major Root Causes Of Workplace Disputes Clipart PDF
The following slide depicts the root causes of disputes at workplace to optimize work quality and efficiency. It constitutes of elements such as unsuccessful communication, personality differences, ambiguity in roles and responsibilities along with the average loss. Presenting Major Root Causes Of Workplace Disputes Clipart PDF to dispense important information. This template comprises three stages. It also presents valuable insights into the topics including Unsuccessful Communication, Personality Differences, Unclear Roles Responsibilities. This is a completely customizable PowerPoint theme that can be put to use immediately. So, download it and address the topic impactfully.
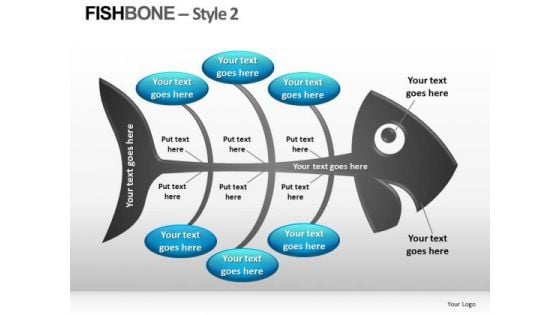
Download Fishbone Diagrams
Download FishBone Diagrams-These high quality powerpoint pre-designed slides and powerpoint templates have been carefully created by our professional team to help you impress your audience. All slides have been created and are 100% editable in powerpoint. Each and every property of any graphic - color, size, orientation, shading, outline etc. can be modified to help you build an effective powerpoint presentation. Any text can be entered at any point in the powerpoint template or slide. Simply DOWNLOAD, TYPE and PRESENT! Our content is special. Join the revolution with our Download Fishbone Diagrams. You'll always stay ahead of the game.
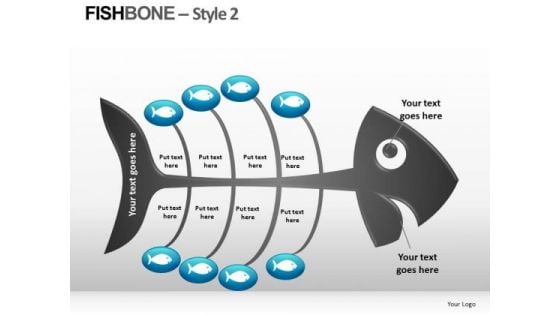
Editable Fishbone Diagrams
Editable FishBone Diagrams-These high quality powerpoint pre-designed slides and powerpoint templates have been carefully created by our professional team to help you impress your audience. All slides have been created and are 100% editable in powerpoint. Each and every property of any graphic - color, size, orientation, shading, outline etc. can be modified to help you build an effective powerpoint presentation. Any text can be entered at any point in the powerpoint template or slide. Simply DOWNLOAD, TYPE and PRESENT! Expand your organization with our Editable Fishbone Diagrams. You will come out on top.
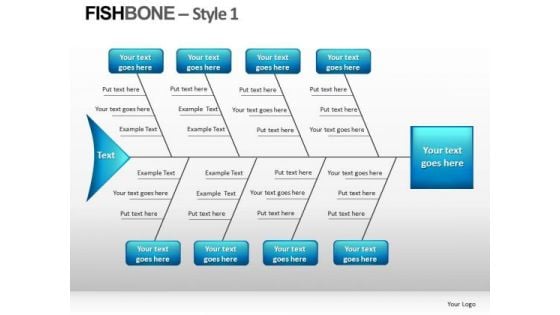
Fishbone Analysis PowerPoint Templates
FishBone Analysis PowerPoint templates-These high quality powerpoint pre-designed slides and powerpoint templates have been carefully created by our professional team to help you impress your audience. All slides have been created and are 100% editable in powerpoint. Each and every property of any graphic - color, size, orientation, shading, outline etc. can be modified to help you build an effective powerpoint presentation. Any text can be entered at any point in the powerpoint template or slide. Simply DOWNLOAD, TYPE and PRESENT! Every factor has it's own effect. Address each consequence with our Fishbone Analysis PowerPoint Templates.
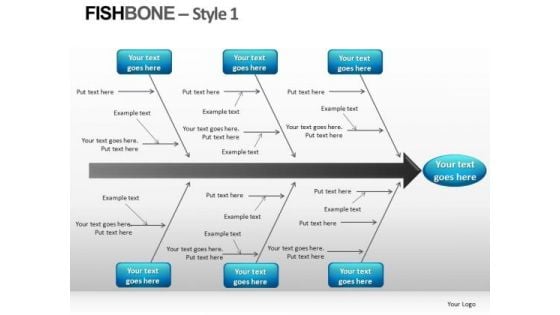
Fishbone Chart PowerPoint Templates
Fishbone Chart PowerPoint templates-These high quality powerpoint pre-designed slides and powerpoint templates have been carefully created by our professional team to help you impress your audience. All slides have been created and are 100% editable in powerpoint. Each and every property of any graphic - color, size, orientation, shading, outline etc. can be modified to help you build an effective powerpoint presentation. Any text can be entered at any point in the powerpoint template or slide. Simply DOWNLOAD, TYPE and PRESENT! Optimize your business cyclewith our Fishbone Chart PowerPoint Templates. You'll deliver your best presentation yet.
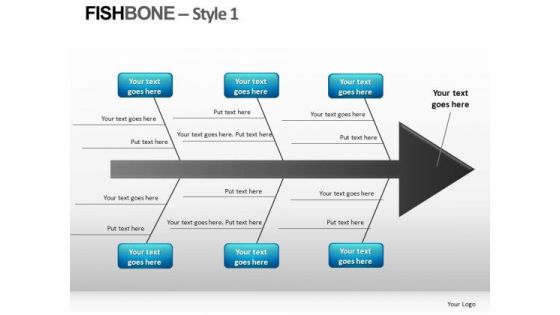
Fishbone Diagrams PowerPoint Slides
FishBone Diagrams PowerPoint Slides-These high quality powerpoint pre-designed slides and powerpoint templates have been carefully created by our professional team to help you impress your audience. All slides have been created and are 100% editable in powerpoint. Each and every property of any graphic - color, size, orientation, shading, outline etc. can be modified to help you build an effective powerpoint presentation. Any text can be entered at any point in the powerpoint template or slide. Simply DOWNLOAD, TYPE and PRESENT! With our Fishbone Diagrams PowerPoint Slides duds are few and far between. But even they give you a bang for your buck.
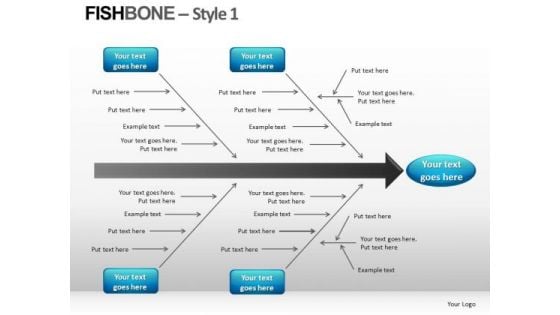
Fishbone Diagrams PowerPoint Templates
FishBone Diagrams PowerPoint templates-These high quality powerpoint pre-designed slides and powerpoint templates have been carefully created by our professional team to help you impress your audience. All slides have been created and are 100% editable in powerpoint. Each and every property of any graphic - color, size, orientation, shading, outline etc. can be modified to help you build an effective powerpoint presentation. Any text can be entered at any point in the powerpoint template or slide. Simply DOWNLOAD, TYPE and PRESENT! Negotiate deals with our Fishbone Diagrams PowerPoint Templates. Download without worries with our money back guaranteee.
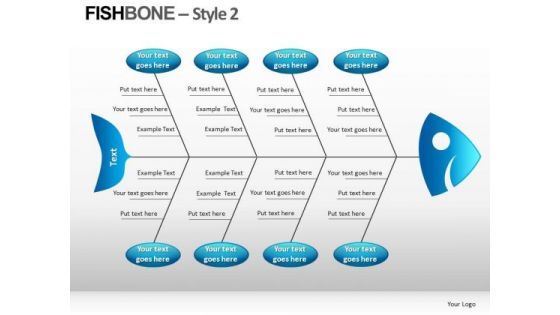
PowerPoint Fishbone Diagrams
PowerPoint FishBone Diagrams-These high quality powerpoint pre-designed slides and powerpoint templates have been carefully created by our professional team to help you impress your audience. All slides have been created and are 100% editable in powerpoint. Each and every property of any graphic - color, size, orientation, shading, outline etc. can be modified to help you build an effective powerpoint presentation. Any text can be entered at any point in the powerpoint template or slide. Simply DOWNLOAD, TYPE and PRESENT! Develop your business aptitude with our PowerPoint Fishbone Diagrams. Your creative abilities will flourish.
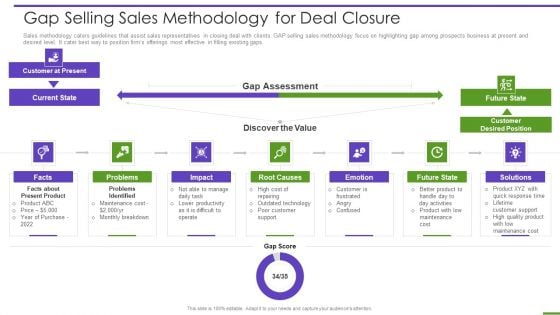
Marketing Playbook To Maximize ROI Gap Selling Sales Methodology For Deal Closure Ideas PDF
Sales methodology caters guidelines that assist sales representatives in closing deal with clients. GAP selling sales methodology focus on highlighting gap among prospects business at present and desired level. It cater best way to position firms offerings most effective in filling existing gaps. This is a marketing playbook to maximize roi gap selling sales methodology for deal closure ideas pdf template with various stages. Focus and dispense information on seven stages using this creative set, that comes with editable features. It contains large content boxes to add your information on topics like facts, problems, impact, root causes, emotion. You can also showcase facts, figures, and other relevant content using this PPT layout. Grab it now.
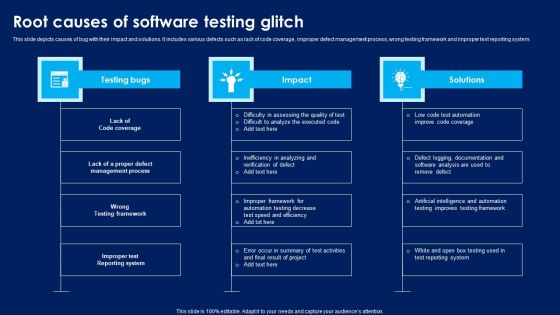
Root Causes Of Software Testing Glitch Themes PDF
This slide depicts causes of bug with their impact and solutions. It includes various defects such as lack of code coverage, improper defect management process, wrong testing framework and improper test reporting system. Presenting Root Causes Of Software Testing Glitch Themes PDF to dispense important information. This template comprises three stages. It also presents valuable insights into the topics including Lack Code Coverage, Defect Management Process, Wrong Testing Framework. This is a completely customizable PowerPoint theme that can be put to use immediately. So, download it and address the topic impactfully.
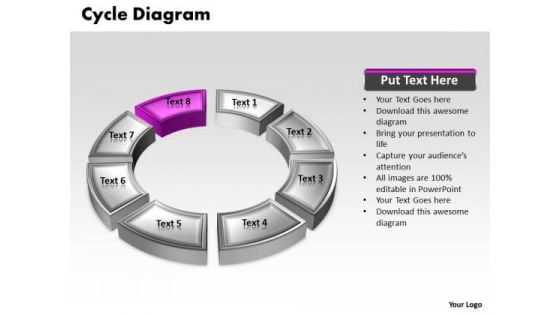
Ppt Pink Animated Text Cycle Cause And Effect Diagram PowerPoint Template Templates
PPT pink animated text cycle cause and effect diagram powerpoint template Templates-This Eight Way Round chart Diagram is an effective way of displaying Interconnected information. You can edit text, color, shade and style as per you need.-PPT pink animated text cycle cause and effect diagram powerpoint template Templates-Abstract, Blank, Business, Chart, Circular, Circulation, Cycle, Design, Diagram, Empty, Executive, Icon, Illustration, Management, Model, Numbers, Organization, Procedure, Process Our Ppt Pink Animated Text Cycle Cause And Effect Diagram PowerPoint Template Templates has been designed by professionals. Use them to string together your glistening ideas.
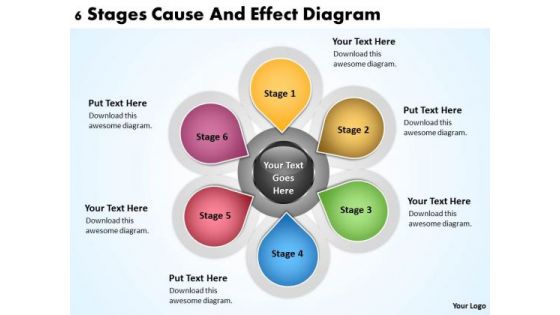
Examples Of Business Processes 6 Stages Cause And Effect Diagram PowerPoint Templates
We present our examples of business processes 6 stages cause and effect diagram PowerPoint templates.Use our Circle Charts PowerPoint Templates because you can Set pulses racing with our PowerPoint Templates and Slides. They will raise the expectations of your team. Use our Ring Charts PowerPoint Templates because Our PowerPoint Templates and Slides have the Brilliant backdrops. Guaranteed to illuminate the minds of your audience. Download our Business PowerPoint Templates because Our PowerPoint Templates and Slides are the chords of your song. String them along and provide the lilt to your views. Present our Process and Flows PowerPoint Templates because You can Bask in the warmth of our PowerPoint Templates and Slides. Enjoy the heartfelt glowing response of your listeners. Use our Flow Charts PowerPoint Templates because Watching this your Audience will Grab their eyeballs, they wont even blink.Use these PowerPoint slides for presentations relating to Abstract, arrows, blank, business, central, centralized, chart, circle, circular, circulation, concept, conceptual, converging, design, diagram, empty, executive, five, icon, idea, illustration, management, map, mapping, model, numbers, organization, outwards, pointing, procedure, process, radial, radiating, relationship, resource, sequence, strategy, template. The prominent colors used in the PowerPoint template are Purple, Gray, Black. You have been given an exacting task. Plan your approach with our Examples Of Business Processes 6 Stages Cause And Effect Diagram PowerPoint Templates.
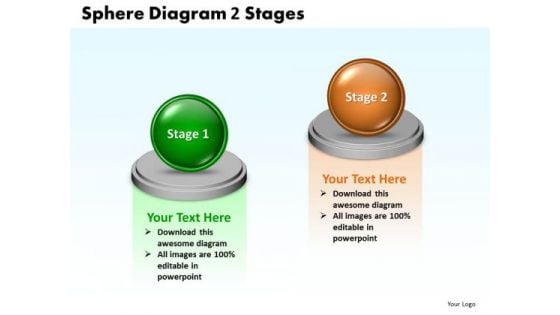
Ppt Sphere Cause And Effect Diagram PowerPoint Template 2 State Templates
PPT sphere cause and effect diagram powerpoint template 2 state Templates-This PPT slide can be used to compare two approaches and evaluate the effectiveness. You can easily insert text to this slide as per your requirement.-PPT sphere cause and effect diagram powerpoint template 2 state Templates-Around, Background, Ball, Big, Blue, Business, Circle, Competition, Competitive, Concept, Contrast, Design, Development, Diagram, Group, Icon, Illustration, Individual, Individuality, Isolated, Leadership, Partnership, Ring, Shapes, Sign, Sphere, Success, Symbol, Team, Teamwork, Wheel Compare products and services with our Ppt Sphere Cause And Effect Diagram PowerPoint Template 2 State Templates. You will come out on top.
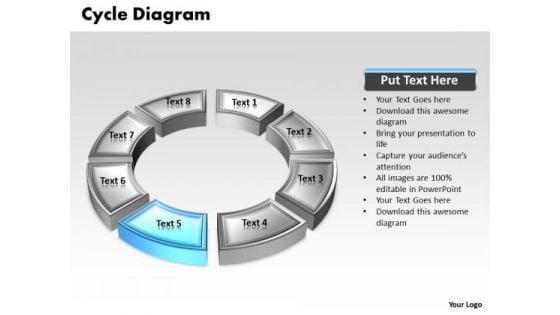
Ppt Blue Animated Multicolor Cycle Cause And Effect Diagram PowerPoint Template Templates
PPT blue animated multicolor cycle cause and effect diagram powerpoint template Templates-This PowerPoint Diagram shows the blue piece out of all connected pieces to describe the part of the process in Linear Flow. It signifies Round, circular, beeline, continuous, even, horizontal, linear, nonstop, right, shortest, though, true, unbroken etc.-PPT blue animated multicolor cycle cause and effect diagram powerpoint template Templates-Abstract, Blank, Business, Chart, Circular, Circulation, Cycle, Design, Diagram, Empty, Executive, Icon, Illustration, Management, Model, Numbers, Organization, Procedure, Process Our Ppt Blue Animated Multicolor Cycle Cause And Effect Diagram PowerPoint Template Templates stay faithful to their word. They stand by any promise they make.
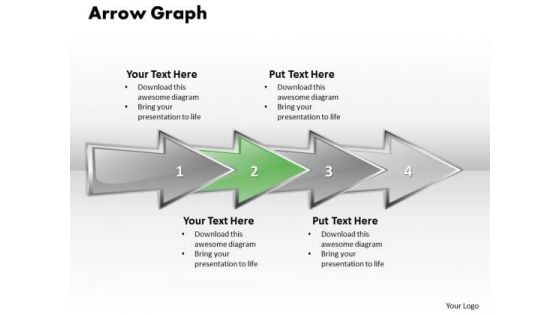
Ppt Linear Abstraction Arrow Cause And Effect Diagram PowerPoint Template Templates
PPT linear abstraction arrow cause and effect diagram powerpoint template Templates-Use this linear diagram to emphasize the process of your business and corporate growth. Highlight your ideas broad based on strong fundamentals and illustrate how they step by step achieve the set growth factor.-PPT linear abstraction arrow cause and effect diagram powerpoint template Templates-analysis, arrow, background, business, chart, communication, concept, construction, delivery, design, development, engineering, fabrication, feasibiliti, generated, growth, idea, industry, making, production, products, science, sequence, shape Analyse your inputs with our Ppt Linear Abstraction Arrow Cause And Effect Diagram PowerPoint Template Templates. Discover ways to increase your output.
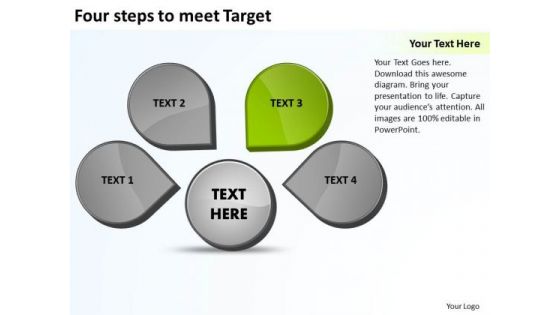
Four Steps To Meet Target Relative Cycle Arrow Process PowerPoint Slides
We present our four steps to meet target Relative Cycle Arrow Process PowerPoint Slides.Download and present our Business PowerPoint Templates because Building castles in the sand is a danger and you are aware of. You have taken the precaution of building strong fundamentals. Download our Marketing PowerPoint Templates because The marketplace is the merger of your dreams and your ability. Download our Finance PowerPoint Templates because as a result we often end up with errors. Present our Shapes PowerPoint Templates because our template will illustrate what you want to say. Present our Process and flows PowerPoint Templates because retrace your steps with your team and have a relook at the basic aspects of your work.Use these PowerPoint slides for presentations relating to Business, chart, circle, circular, steps, process, flow, concept, conference, curving, cycle, design, diagram, direction, element, financial, flow, flowchart, formula, future, goal, graphic, idea, management, market, marketing, mind, mind map, motion, movement, organization, organize, plan, presentation, process, product, questions, render, solutions, solve, strategy, success, symbol. The prominent colors used in the PowerPoint template are Green lime, Gray, White. The feedback we get is that our four steps to meet target Relative Cycle Arrow Process PowerPoint Slides are Precious. Customers tell us our flow PowerPoint templates and PPT Slides are Cheerful. Professionals tell us our four steps to meet target Relative Cycle Arrow Process PowerPoint Slides are Striking. Customers tell us our steps PowerPoint templates and PPT Slides are Endearing. Use our four steps to meet target Relative Cycle Arrow Process PowerPoint Slides will help them to explain complicated concepts. Professionals tell us our flow PowerPoint templates and PPT Slides are Pretty. Guide your team to victory with our Four Steps To Meet Target Relative Cycle Arrow Process PowerPoint Slides. Try us out and see what a difference our templates make.

Root Cause Assessment Ppt PowerPoint Presentation Complete Deck With Slides
Improve your presentation delivery using this Root Cause Assessment Ppt PowerPoint Presentation Complete Deck With Slides. Support your business vision and objectives using this well-structured PPT deck. This template offers a great starting point for delivering beautifully designed presentations on the topic of your choice. Comprising ninteen this professionally designed template is all you need to host discussion and meetings with collaborators. Each slide is self-explanatory and equipped with high-quality graphics that can be adjusted to your needs. Therefore, you will face no difficulty in portraying your desired content using this PPT slideshow. This PowerPoint slideshow contains every important element that you need for a great pitch. It is not only editable but also available for immediate download and utilization. The color, font size, background, shapes everything can be modified to create your unique presentation layout. Therefore, download it now.
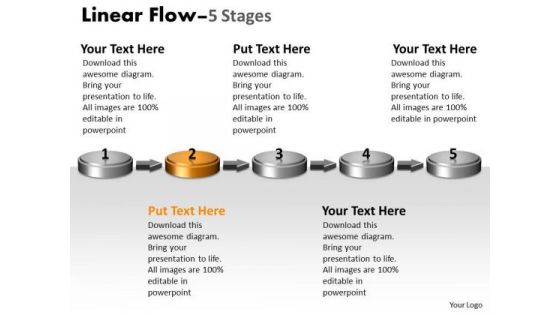
Ppt Theme 3d Linear Flow Five Steps Cause And Effect Diagram PowerPoint Template Graphic
We present our PPT Theme 3d linear flow five steps cause and effect diagram PowerPoint template Graphic. Use our Arrows PowerPoint Templates because, Signpost your preferred roadmap to your eager co- travelers and demonstrate clearly how you intend to navigate them towards the desired corporate goal. Use our Symbol PowerPoint Templates because; Raise your Company stocks at the Opening Bell. Use our Marketing PowerPoint Templates because, you have the process in your head, our template design showing will illuminate your thoughts. Use our Advertising PowerPoint Templates because, Team Efforts Business Template: - The concept and strategy is your strength. Use our Business PowerPoint Templates because, Marketing Strategy Business Template:- Maximizing sales of your product is the intended destination. Use these PowerPoint slides for presentations relating to Arrow, Background, Business, Chart, Diagram, Financial, Graphic, Gray, Icon, Illustration, Management, Perspective, Planning, Process, Stages, Steps, Text. The prominent colors used in the PowerPoint template are Orange, Gray, and Black Our Ppt Theme 3d Linear Flow Five Steps Cause And Effect Diagram PowerPoint Template Graphic encourage economy of effort. Make it easier to bear the burden.

Cloud Architecture At Scale How To Execute A Cloud Infrastructure Evaluation Conducting Root Cause Analysis Mockup PDF
This slide covers the need to conduct a cloud architecture review to address a specific issue in your cloud environment . Presenting cloud architecture at scale how to execute a cloud infrastructure evaluation conducting root cause analysis mockup pdf to provide visual cues and insights. Share and navigate important information on four stages that need your due attention. This template can be used to pitch topics like infrastructure analysis, cloud environment. In addtion, this PPT design contains high resolution images, graphics, etc, that are easily editable and available for immediate download.
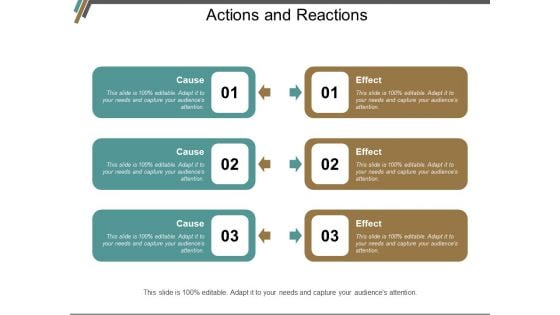
Actions And Reactions Ppt Powerpoint Presentation Layouts Background Designs
This is a actions and reactions ppt powerpoint presentation layouts background designs. This is a three stage process. The stages in this process are action and reaction, causality, causes and effects.
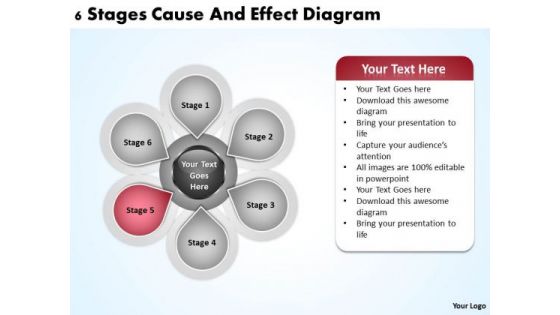
Business Process Diagram Vision 6 Stages Cause And Effect Ppt PowerPoint Templates
We present our business process diagram vision 6 stages cause and effect ppt PowerPoint templates.Download and present our Advertising PowerPoint Templates because You are well armed with penetrative ideas. Our PowerPoint Templates and Slides will provide the gunpowder you need. Use our Arrows PowerPoint Templates because You can Be the star of the show with our PowerPoint Templates and Slides. Rock the stage with your ideas. Download our Circle Charts PowerPoint Templates because You can Hit a home run with our PowerPoint Templates and Slides. See your ideas sail into the minds of your audience. Download our Business PowerPoint Templates because It will get your audience in sync. Download and present our Shapes PowerPoint Templates because Our PowerPoint Templates and Slides will definately Enhance the stature of your presentation. Adorn the beauty of your thoughts with their colourful backgrounds.Use these PowerPoint slides for presentations relating to Arrow, box, brochure, business, button, catalog, chart, circle, company, cross, data, design, diagram, direction, document, financial, glossy, goals, graph, junction, management, market, marketing, model, multiple, navigation, network, options, pie, plan, presentation, process, results, shiny, six, sphere, statistics, stock, structure, template, vector, website. The prominent colors used in the PowerPoint template are Blue, Gray, Black. Inform your audience with our Business Process Diagram Vision 6 Stages Cause And Effect Ppt PowerPoint Templates. Make sure your presentation gets the attention it deserves.
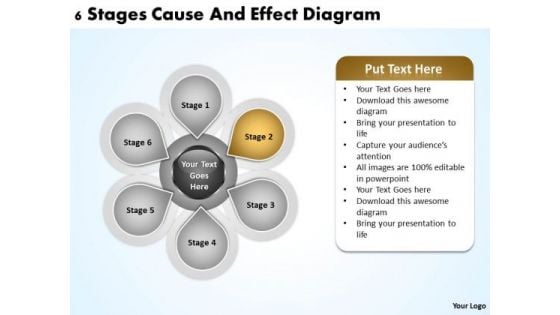
Business Process Flow Chart Examples 6 Stages Cause And Effect Diagram Ppt PowerPoint Slides
We present our business process flow chart examples 6 stages cause and effect diagram ppt PowerPoint Slides.Use our Marketing PowerPoint Templates because Our PowerPoint Templates and Slides are designed to help you succeed. They have all the ingredients you need. Present our Business PowerPoint Templates because Our PowerPoint Templates and Slides will embellish your thoughts. See them provide the desired motivation to your team. Download our Shapes PowerPoint Templates because Your audience will believe you are the cats whiskers. Download our Circle Charts PowerPoint Templates because Our PowerPoint Templates and Slides will bullet point your ideas. See them fall into place one by one. Use our Signs PowerPoint Templates because Our PowerPoint Templates and Slides will generate and maintain the level of interest you desire. They will create the impression you want to imprint on your audience.Use these PowerPoint slides for presentations relating to Brochure, business, button, catalog, chart, circle, company, cross, data, design, diagram, direction, document, financial, glossy, goals, graph, junction, management, market, marketing, model, multiple, navigation, network, options, pie, plan, presentation, process, results, shiny, six, sphere, statistics, stock, structure, template, vector, website. The prominent colors used in the PowerPoint template are Yellow, Gray, Black. Our Business Process Flow Chart Examples 6 Stages Cause And Effect Diagram Ppt PowerPoint Slides will ensure everyone in the room is impressed. You will be glad you tried us out.

Ppt Moving Down Process 7 Steps Ishikawa Diagram PowerPoint Template Templates
PPT moving down process 7 steps ishikawa diagram powerpoint template Templates-Often you have to represent an organization using a simple organizational hierarchy, but by using this PowerPoint Diagram you will give your Presentation a new look and will make it more interesting to watch. It is a useful captivating tool enables you to define your message in your Marketing PPT presentations. You can edit text, color, shade and style as per you need.-PPT moving down process 7 steps ishikawa diagram powerpoint template Templates-Add, Aqua, Arrows, Badges, Bar, Blend, Blue, Bright, Bubbles, Buttons, Caution, Circle, Drop, Elements, Glossy, Glowing, Graphic, Heart, Help, Icons, Idea, Illustration, Navigation, Oblong, Plus, Round, Service, Shadow, Shiny, Sign, Speech, Squares Presentation to a sizable audience. We've got your back with our Ppt Moving Down Process 7 Steps Ishikawa Diagram PowerPoint Template Templates. You'll always stay ahead of the game.
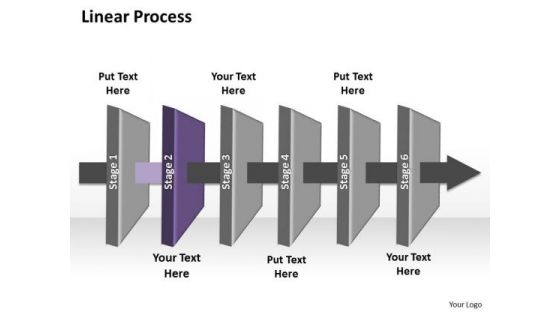
Ppt Direct Flow Of Marketing Startegy Ishikawa Diagram PowerPoint Template Templates
PPT direct flow of marketing startegy ishikawa diagram powerpoint template Templates-Use this graphical approach to represent global business issues such as financial data, stock market Exchange, increase in sales, corporate presentations and more. It Signifies common, comprehensive, extensive, global, international, multinational, omnipresent, planetary, ubiquitous, universal etc.-PPT direct flow of marketing startegy ishikawa diagram powerpoint template Templates-3d, Air, Arrow, Art, Business, Chart, Clip, Clipart, Cooling, Diagram, Drip, Drop, Dry, Energy, Eps10, Evaporate, Evaporating, Evaporation, Graphic, Heat, Icon, Illustration, Isolated, Isometric, Layers, Material, Moisture, Process Burn away doubts with our Ppt Direct Flow Of Marketing Startegy Ishikawa Diagram PowerPoint Template Templates. You will come out on top.
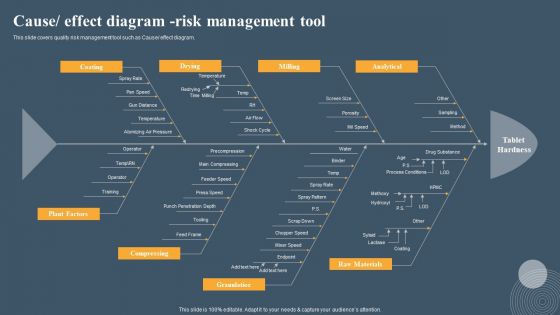
Risk Based Methodology Cause Effect Diagram Risk Management Tool Brochure PDF
This slide covers quality risk management tool such as Cause or effect diagram. Do you have an important presentation coming up Are you looking for something that will make your presentation stand out from the rest Look no further than Risk Based Methodology Cause Effect Diagram Risk Management Tool Brochure PDF. With our professional designs, you can trust that your presentation will pop and make delivering it a smooth process. And with Slidegeeks, you can trust that your presentation will be unique and memorable. So why wait Grab Risk Based Methodology Cause Effect Diagram Risk Management Tool Brochure PDF today and make your presentation stand out from the rest


 Continue with Email

 Home
Home


