Process Chart
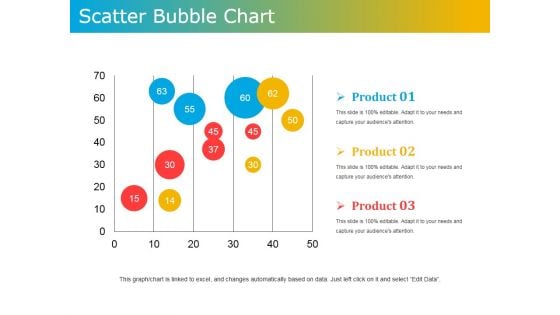
Scatter Bubble Chart Ppt PowerPoint Presentation Ideas Design Templates
This is a scatter bubble chart ppt powerpoint presentation ideas design templates. This is a three stage process. The stages in this process are product, scatter, bubble chart, business, marketing.

Area Chart Ppt PowerPoint Presentation Infographic Template Layout
This is a area chart ppt powerpoint presentation infographic template layout. This is a two stage process. The stages in this process are product, profit, area chart, growth, success.
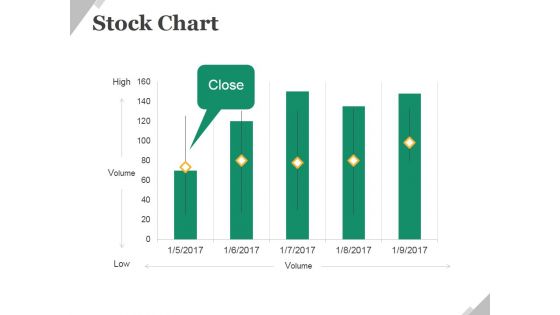
Stock Chart Ppt PowerPoint Presentation Slides Example File
This is a stock chart ppt powerpoint presentation slides example file. This is a five stage process. The stages in this process are business, finance, stock chart, management, planning.
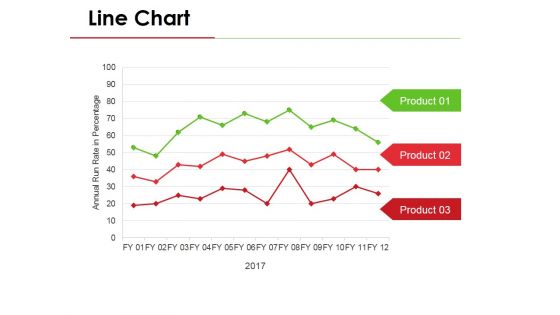
Line Chart Ppt PowerPoint Presentation Visual Aids Pictures
This is a line chart ppt powerpoint presentation visual aids pictures. This is a three stage process. The stages in this process are business, marketing, line chart, analysis, growth.
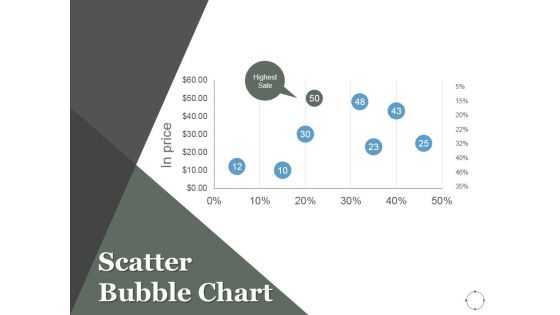
Scatter Bubble Chart Ppt PowerPoint Presentation Background Designs
This is a scatter bubble chart ppt powerpoint presentation background designs. This is a eight stage process. The stages in this process are projects, marketing, scatter chart, finance, management.
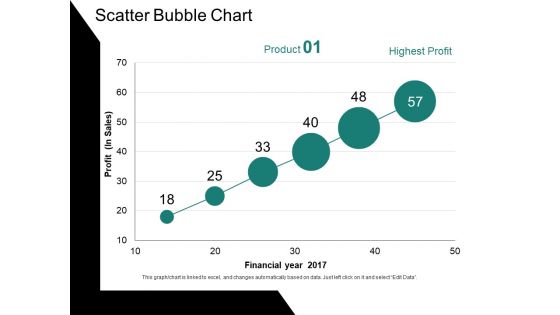
Scatter Bubble Chart Ppt PowerPoint Presentation Ideas Gallery
This is a scatter bubble chart ppt powerpoint presentation ideas gallery. This is a six stage process. The stages in this process are profit, financial year, chart, business, growth.

Radar Chart Ppt PowerPoint Presentation Pictures Layout Ideas
This is a radar chart ppt powerpoint presentation pictures layout ideas. This is a two stage process. The stages in this process are business, marketing, radar chart, finance, strategy, graph.

Column Chart Ppt PowerPoint Presentation Inspiration Layout Ideas
This is a column chart ppt powerpoint presentation inspiration layout ideas. This is a two stage process. The stages in this process are in years, dollars, chart, business, marketing, finance.
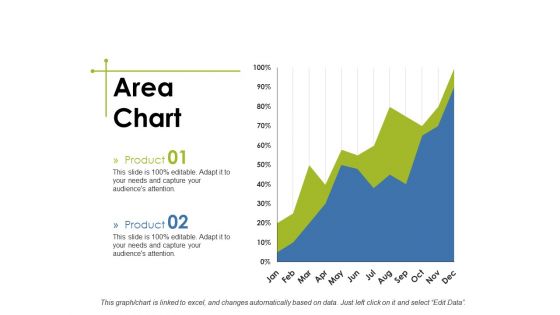
Area Chart Ppt PowerPoint Presentation Slides Master Slide
This is a area chart ppt powerpoint presentation slides master slide. This is a two stage process. The stages in this process are business, marketing, area chart, finance, strategy.
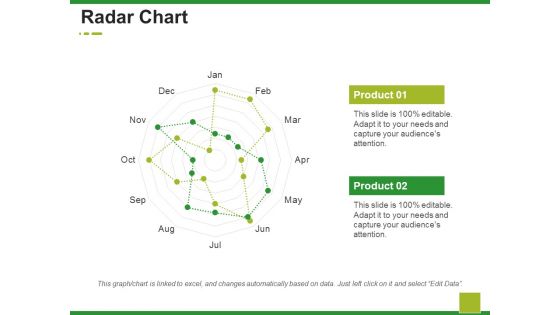
Radar Chart Ppt PowerPoint Presentation Ideas Design Ideas
This is a radar chart ppt powerpoint presentation ideas design ideas. This is a two stage process. The stages in this process are business, marketing, radar chart, finance, strategy.
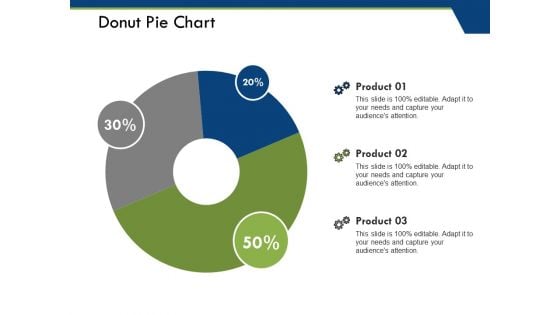
Donut Pie Chart Ppt PowerPoint Presentation Pictures File Formats
This is a donut pie chart ppt powerpoint presentation pictures file formats. This is a three stage process. The stages in this process are product, donut pie chart, percentage, business, marketing.
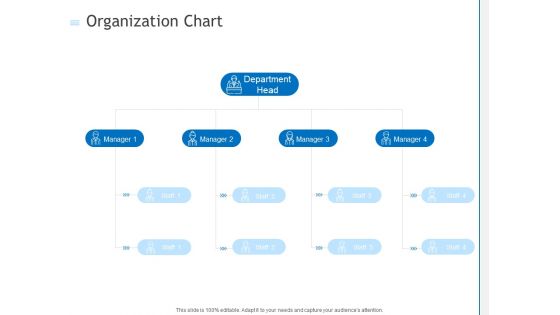
Organization Chart Ppt PowerPoint Presentation Portfolio Good PDF
Presenting this set of slides with name organization chart ppt powerpoint presentation portfolio good pdf. This is a four stage process. The stages in this process are organization chart. This is a completely editable PowerPoint presentation and is available for immediate download. Download now and impress your audience.
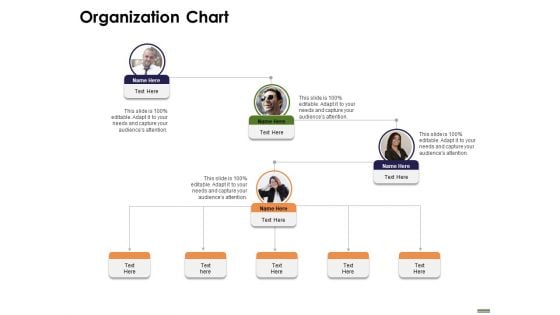
HR Strategy Employee Journey Organization Chart Ppt Styles Topics PDF
Presenting this set of slides with name hr strategy employee journey organization chart ppt styles topics pdf. This is a four stage process. The stages in this process are organization chart. This is a completely editable PowerPoint presentation and is available for immediate download. Download now and impress your audience.
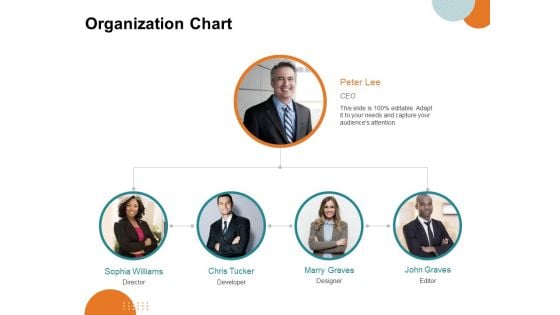
Key Product Distribution Channels Organization Chart Ppt Styles Infographics PDF
Presenting this set of slides with name key product distribution channels organization chart ppt styles infographics pdf. This is a five stage process. The stages in this process are organization chart. This is a completely editable PowerPoint presentation and is available for immediate download. Download now and impress your audience.
Determining Internalization Externalization Vendors Organization Chart Ppt File Deck PDF
Presenting this set of slides with name determining internalization externalization vendors organization chart ppt file deck pdf. This is a three stage process. The stages in this process are organization chart. This is a completely editable PowerPoint presentation and is available for immediate download. Download now and impress your audience.
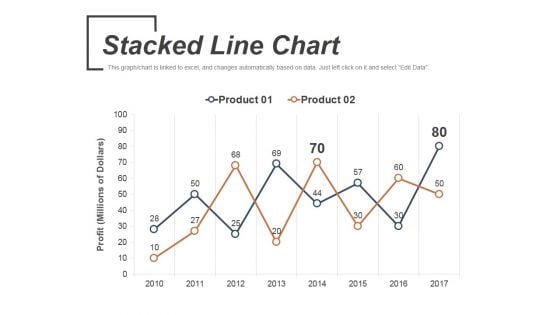
Stacked Line Chart Ppt PowerPoint Presentation Outline Examples
This is a stacked line chart ppt powerpoint presentation outline examples. This is a two stage process. The stages in this process are product, stacked line chart, business, marketing, profit.
Email Marketing Performance Chart Ppt PowerPoint Presentation Icon Design Inspiration
This is a email marketing performance chart ppt powerpoint presentation icon design inspiration. This is a nine stage process. The stages in this process are email marketing performance chart, business, marketing, strategy, success.
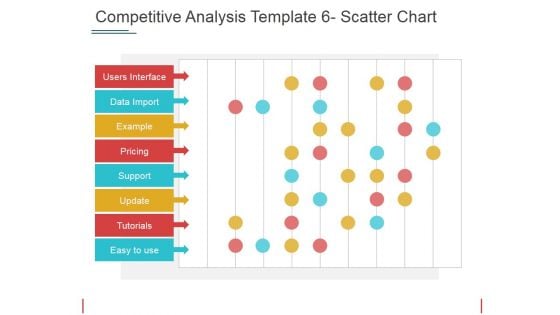
Competitive Analysis Scatter Chart Ppt PowerPoint Presentation Layouts Layout
This is a competitive analysis scatter chart ppt powerpoint presentation layouts layout. This is a six stage process. The stages in this process are business, marketing, success, chart, management.

Scatter Chart Template 2 Ppt PowerPoint Presentation Slides
This is a scatter chart template 2 ppt powerpoint presentation slides. This is a eight stage process. The stages in this process are business, marketing, scatter chart, profit, management.
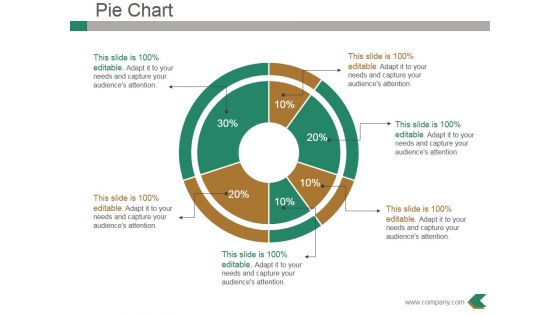
Pie Chart Ppt PowerPoint Presentation File Background Designs
This is a pie chart ppt powerpoint presentation file background designs. This is a six stage process. The stages in this process are business, marketing, pie chart, percentage, finance.
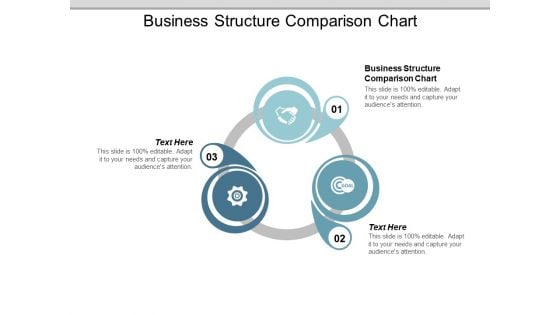
Business Structure Comparison Chart Ppt PowerPoint Presentation Infographic Template Vector
This is a business structure comparison chart ppt powerpoint presentation infographic template vector. This is a three stage process. The stages in this process are business structure comparison chart.
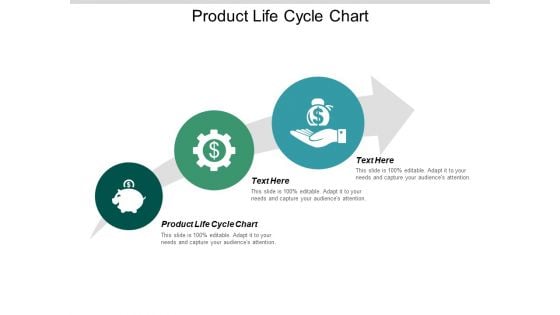
Product Life Cycle Chart Ppt PowerPoint Presentation Professional Styles Cpb
This is a product life cycle chart ppt powerpoint presentation professional styles cpb. This is a three stage process. The stages in this process are product life cycle chart.
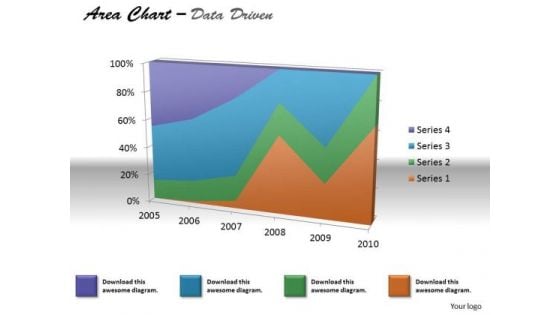
Financial Data Analysis Area Chart For Various Values PowerPoint Templates
Document The Process On Our financial data analysis area chart for various values Powerpoint Templates . Make A Record Of Every Detail.
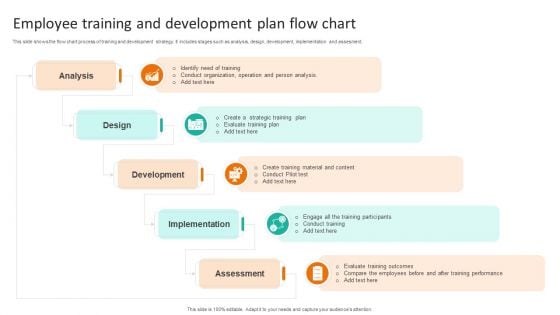
Employee Training And Development Plan Flow Chart Clipart PDF
This slide shows the flow chart process of training and development strategy. It includes stages such as analysis, design, development, implementation and assesment. Persuade your audience using this Employee Training And Development Plan Flow Chart Clipart PDF. This PPT design covers five stages, thus making it a great tool to use. It also caters to a variety of topics including Development, Implementation, Assessment. Download this PPT design now to present a convincing pitch that not only emphasizes the topic but also showcases your presentation skills.
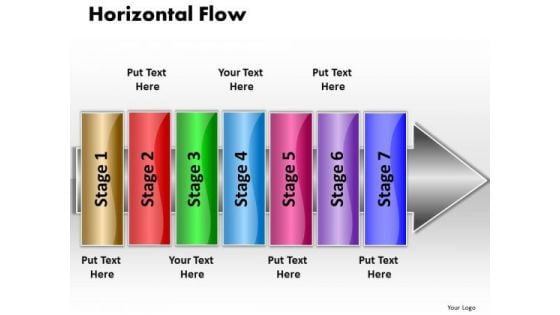
Ppt Linear Work Flow Chart PowerPoint 7 Stages5 Templates
PPT linear work flow chart powerpoint 7 stages5 Templates-You can easily collaborate this PowerPoint diagram with colleagues to create detailed process diagrams and use them as a key element in streamlining your processes. -PPT linear work flow chart powerpoint 7 stages5 Templates-Abstract, Arrow, Blank, Business, Chart, Concept, Conceptual, Design, Diagram, Executive, Icon, Idea, Illustration, Management, Model, Numbers, Organization, Procedure, Process, Progression, Resource, Sequence, Sequential, Stages, Steps, Strategy Delve on the cold facts in detail. Explain the factual analysis on our Ppt Linear Work Flow Chart PowerPoint 7 Stages5 Templates.
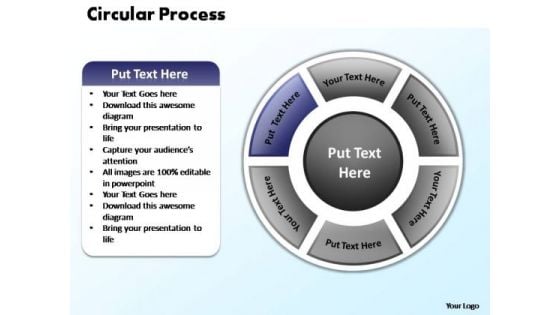
PowerPoint Slides Process Circular Process Ppt Themes
PowerPoint Slides Process Circular Process PPT Themes-Highlight the key components of your entire manufacturing/ business process. Illustrate how each element flows seamlessly onto the next stage. Emphasise on any critical or key factors within them. Demonstrate how they all combine to form the final product.-PowerPoint Slides Process Circular Process PPT Themes Make your presentations glow like the sun with our PowerPoint Slides Process Circular Process Ppt Themes. You will be at the top of your game.
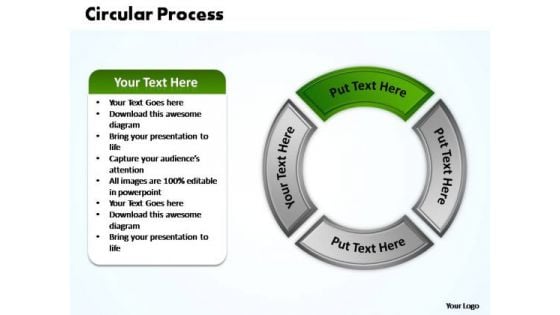
PowerPoint Slides Process Circular Process Ppt Templates
PowerPoint Slides Process Circular Process PPT Templates-Highlight the key components of your entire manufacturing/ business process. Illustrate how each element flows seamlessly onto the next stage. Emphasise on any critical or key factors within them. Demonstrate how they all combine to form the final product.-PowerPoint Slides Process Circular Process PPT Templates Cash in with our PowerPoint Slides Process Circular Process Ppt Templates. You will prove commercially astute.
Glucometer Reading Chart In Powerpoint And Google Slides Cpb
Presenting our innovatively-designed set of slides titled Glucometer Reading Chart In Powerpoint And Google Slides Cpb. This completely editable PowerPoint graphic exhibits Glucometer Reading Chart that will help you convey the message impactfully. It can be accessed with Google Slides and is available in both standard screen and widescreen aspect ratios. Apart from this, you can download this well-structured PowerPoint template design in different formats like PDF, JPG, and PNG. So, click the download button now to gain full access to this PPT design. Our Glucometer Reading Chart In Powerpoint And Google Slides Cpb are topically designed to provide an attractive backdrop to any subject. Use them to look like a presentation pro.
Antihistamine Comparison Chart In Powerpoint And Google Slides Cpb
Presenting our innovatively-designed set of slides titled Antihistamine Comparison Chart In Powerpoint And Google Slides Cpb. This completely editable PowerPoint graphic exhibits Antihistamine Comparison Chart that will help you convey the message impactfully. It can be accessed with Google Slides and is available in both standard screen and widescreen aspect ratios. Apart from this, you can download this well-structured PowerPoint template design in different formats like PDF, JPG, and PNG. So, click the download button now to gain full access to this PPT design. Our Antihistamine Comparison Chart In Powerpoint And Google Slides Cpb are topically designed to provide an attractive backdrop to any subject. Use them to look like a presentation pro.

Organizational Hierarchy Chart Food And Grocery Retail Ppt Example
This slide covers hierarchy chart for supermarket or grocery store. It involves regional managers, merchandising, public relations and vice president distribution. Are you in need of a template that can accommodate all of your creative concepts This one is crafted professionally and can be altered to fit any style. Use it with Google Slides or PowerPoint. Include striking photographs, symbols, depictions, and other visuals. Fill, move around, or remove text boxes as desired. Test out color palettes and font mixtures. Edit and save your work, or work with colleagues. Download Organizational Hierarchy Chart Food And Grocery Retail Ppt Example and observe how to make your presentation outstanding. Give an impeccable presentation to your group and make your presentation unforgettable. This slide covers hierarchy chart for supermarket or grocery store. It involves regional managers, merchandising, public relations and vice president distribution.
Food Macros Chart In Powerpoint And Google Slides Cpb
Presenting our innovatively designed set of slides titled Food Macros Chart In Powerpoint And Google Slides Cpb. This completely editable PowerPoint graphic exhibits Food Macros Chart that will help you convey the message impactfully. It can be accessed with Google Slides and is available in both standard screen and widescreen aspect ratios. Apart from this, you can download this well structured PowerPoint template design in different formats like PDF, JPG, and PNG. So, click the download button now to gain full access to this PPT design. Our Food Macros Chart In Powerpoint And Google Slides Cpb are topically designed to provide an attractive backdrop to any subject. Use them to look like a presentation pro.
Ursodeoxycholic Acid Dosage Chart In Powerpoint And Google Slides Cpb
Introducing our well designed Ursodeoxycholic Acid Dosage Chart In Powerpoint And Google Slides Cpb This PowerPoint design presents information on topics like Ursodeoxycholic Acid Dosage Chart As it is predesigned it helps boost your confidence level. It also makes you a better presenter because of its high quality content and graphics. This PPT layout can be downloaded and used in different formats like PDF, PNG, and JPG. Not only this, it is available in both Standard Screen and Widescreen aspect ratios for your convenience. Therefore, click on the download button now to persuade and impress your audience. Our Ursodeoxycholic Acid Dosage Chart In Powerpoint And Google Slides Cpb are topically designed to provide an attractive backdrop to any subject. Use them to look like a presentation pro.
Vaccines Effectiveness Chart In Powerpoint And Google Slides Cpb
Presenting our innovatively designed set of slides titled Vaccines Effectiveness Chart In Powerpoint And Google Slides Cpb. This completely editable PowerPoint graphic exhibits Vaccines Effectiveness Chart that will help you convey the message impactfully. It can be accessed with Google Slides and is available in both standard screen and widescreen aspect ratios. Apart from this, you can download this well structured PowerPoint template design in different formats like PDF, JPG, and PNG. So, click the download button now to gain full access to this PPT design. Our Vaccines Effectiveness Chart In Powerpoint And Google Slides Cpb are topically designed to provide an attractive backdrop to any subject. Use them to look like a presentation pro.
Kindle Tablet Comparison Chart In Powerpoint And Google Slides Cpb
Introducing our well designed Kindle Tablet Comparison Chart In Powerpoint And Google Slides Cpb This PowerPoint design presents information on topics like Kindle Tablet Comparison Chart As it is predesigned it helps boost your confidence level. It also makes you a better presenter because of its high quality content and graphics. This PPT layout can be downloaded and used in different formats like PDF, PNG, and JPG. Not only this, it is available in both Standard Screen and Widescreen aspect ratios for your convenience. Therefore, click on the download button now to persuade and impress your audience. Our Kindle Tablet Comparison Chart In Powerpoint And Google Slides Cpb are topically designed to provide an attractive backdrop to any subject. Use them to look like a presentation pro.
Blood Pressure Chart In Powerpoint And Google Slides Cpb
Introducing our well designed Blood Pressure Chart In Powerpoint And Google Slides Cpb. This PowerPoint design presents information on topics like Blood Pressure Chart. As it is predesigned it helps boost your confidence level. It also makes you a better presenter because of its high quality content and graphics. This PPT layout can be downloaded and used in different formats like PDF, PNG, and JPG. Not only this, it is available in both Standard Screen and Widescreen aspect ratios for your convenience. Therefore, click on the download button now to persuade and impress your audience. Our Blood Pressure Chart In Powerpoint And Google Slides Cpb are topically designed to provide an attractive backdrop to any subject. Use them to look like a presentation pro.
Hockey Cage Size Chart In Powerpoint And Google Slides Cpb
Presenting our innovatively designed set of slides titled Hockey Cage Size Chart In Powerpoint And Google Slides Cpb. This completely editable PowerPoint graphic exhibits Hockey Cage Size Chart that will help you convey the message impactfully. It can be accessed with Google Slides and is available in both standard screen and widescreen aspect ratios. Apart from this, you can download this well structured PowerPoint template design in different formats like PDF, JPG, and PNG. So, click the download button now to gain full access to this PPT design. Our Hockey Cage Size Chart In Powerpoint And Google Slides Cpb are topically designed to provide an attractive backdrop to any subject. Use them to look like a presentation pro.
Dehydration Headache Location Chart In Powerpoint And Google Slides Cpb
Introducing our well designed Dehydration Headache Location Chart In Powerpoint And Google Slides Cpb. This PowerPoint design presents information on topics like Dehydration Headache Location Chart. As it is predesigned it helps boost your confidence level. It also makes you a better presenter because of its high quality content and graphics. This PPT layout can be downloaded and used in different formats like PDF, PNG, and JPG. Not only this, it is available in both Standard Screen and Widescreen aspect ratios for your convenience. Therefore, click on the download button now to persuade and impress your audience. Our Dehydration Headache Location Chart In Powerpoint And Google Slides Cpb are topically designed to provide an attractive backdrop to any subject. Use them to look like a presentation pro.
Contraceptive Methods Flow Chart In Powerpoint And Google Slides Cpb
Introducing our well-designed Contraceptive Methods Flow Chart In Powerpoint And Google Slides Cpb. This PowerPoint design presents information on topics like Contraceptive Methods Flow Chart. As it is predesigned it helps boost your confidence level. It also makes you a better presenter because of its high-quality content and graphics. This PPT layout can be downloaded and used in different formats like PDF, PNG, and JPG. Not only this, it is available in both Standard Screen and Widescreen aspect ratios for your convenience. Therefore, click on the download button now to persuade and impress your audience. Our Contraceptive Methods Flow Chart In Powerpoint And Google Slides Cpb are topically designed to provide an attractive backdrop to any subject. Use them to look like a presentation pro.
Should Oxygen Levels Chart In Powerpoint And Google Slides Cpb
Presenting our innovatively designed set of slides titled Should Oxygen Levels Chart In Powerpoint And Google Slides Cpb This completely editable PowerPoint graphic exhibits Should Oxygen Levels Chart that will help you convey the message impactfully. It can be accessed with Google Slides and is available in both standard screen and widescreen aspect ratios. Apart from this, you can download this well structured PowerPoint template design in different formats like PDF, JPG, and PNG. So, click the download button now to gain full access to this PPT design. Our Should Oxygen Levels Chart In Powerpoint And Google Slides Cpb are topically designed to provide an attractive backdrop to any subject. Use them to look like a presentation pro.
Comparison Chart Template Powerpoint In Powerpoint And Google Slides Cpb
Introducing our well-designed Comparison Chart Template Powerpoint In Powerpoint And Google Slides Cpb. This PowerPoint design presents information on topics like Comparison Chart Template Powerpoint. As it is predesigned it helps boost your confidence level. It also makes you a better presenter because of its high-quality content and graphics. This PPT layout can be downloaded and used in different formats like PDF, PNG, and JPG. Not only this, it is available in both Standard Screen and Widescreen aspect ratios for your convenience. Therefore, click on the download button now to persuade and impress your audience. Our Comparison Chart Template Powerpoint In Powerpoint And Google Slides Cpb are topically designed to provide an attractive backdrop to any subject. Use them to look like a presentation pro.
Language Milestone Timeline Chart In Powerpoint And Google Slides Cpb
Presenting our innovatively-designed set of slides titled Language Milestone Timeline Chart In Powerpoint And Google Slides Cpb. This completely editable PowerPoint graphic exhibits Language Milestone Timeline Chart that will help you convey the message impactfully. It can be accessed with Google Slides and is available in both standard screen and widescreen aspect ratios. Apart from this, you can download this well-structured PowerPoint template design in different formats like PDF, JPG, and PNG. So, click the download button now to gain full access to this PPT design. Our Language Milestone Timeline Chart In Powerpoint And Google Slides Cpb are topically designed to provide an attractive backdrop to any subject. Use them to look like a presentation pro.
Processor Comparison Chart In Powerpoint And Google Slides Cpb
Introducing our well-designed Processor Comparison Chart In Powerpoint And Google Slides Cpb. This PowerPoint design presents information on topics like Processor Comparison Chart. As it is predesigned it helps boost your confidence level. It also makes you a better presenter because of its high-quality content and graphics. This PPT layout can be downloaded and used in different formats like PDF, PNG, and JPG. Not only this, it is available in both Standard Screen and Widescreen aspect ratios for your convenience. Therefore, click on the download button now to persuade and impress your audience. Our Processor Comparison Chart In Powerpoint And Google Slides Cpb are topically designed to provide an attractive backdrop to any subject. Use them to look like a presentation pro.
Design Chart Paper In Powerpoint And Google Slides Cpb
Introducing our well designed Design Chart Paper In Powerpoint And Google Slides Cpb. This PowerPoint design presents information on topics like Design Chart Paper. As it is predesigned it helps boost your confidence level. It also makes you a better presenter because of its high quality content and graphics. This PPT layout can be downloaded and used in different formats like PDF, PNG, and JPG. Not only this, it is available in both Standard Screen and Widescreen aspect ratios for your convenience. Therefore, click on the download button now to persuade and impress your audience. Our Design Chart Paper In Powerpoint And Google Slides Cpb are topically designed to provide an attractive backdrop to any subject. Use them to look like a presentation pro.
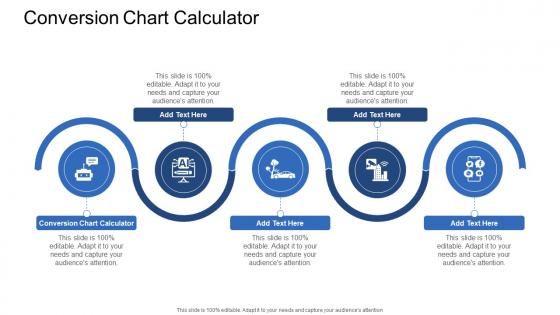
Conversion Chart Calculator In Powerpoint And Google Slides Cpb
Introducing our well designed Conversion Chart Calculator In Powerpoint And Google Slides Cpb. This PowerPoint design presents information on topics like Conversion Chart Calculator. As it is predesigned it helps boost your confidence level. It also makes you a better presenter because of its high quality content and graphics. This PPT layout can be downloaded and used in different formats like PDF, PNG, and JPG. Not only this, it is available in both Standard Screen and Widescreen aspect ratios for your convenience. Therefore, click on the download button now to persuade and impress your audience. Our Conversion Chart Calculator In Powerpoint And Google Slides Cpb are topically designed to provide an attractive backdrop to any subject. Use them to look like a presentation pro.
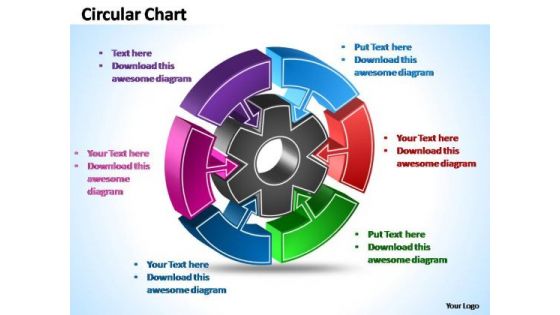
PowerPoint Designs Growth Interconnected Circular Chart Ppt Theme
PowerPoint Designs Growth Interconnected Circular Chart PPT Theme-Precision is what the users demand and seek for in a market that is getting increasingly complex. use this diagram to expalin this complex marketing process-PowerPoint Designs Growth Interconnected Circular Chart PPT Theme Audiences demand excitement. Give them a full dose and more with our PowerPoint Designs Growth Interconnected Circular Chart Ppt Theme.
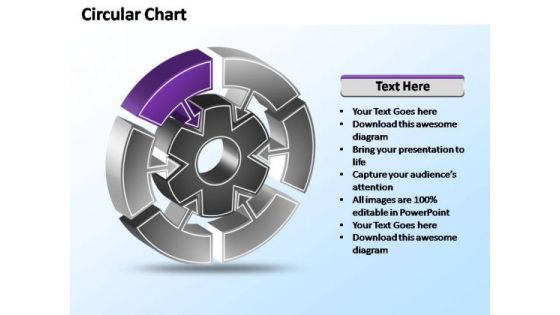
PowerPoint Designs Growth Interconnected Circular Chart Ppt Template
PowerPoint Designs Growth Interconnected Circular Chart PPT Template-Precision is what the users demand and seek for in a market that is getting increasingly complex. use this diagram to expalin this complex marketing process-PowerPoint Designs Growth Interconnected Circular Chart PPT Template Examine all factors in detail. Give each one close attention with our PowerPoint Designs Growth Interconnected Circular Chart Ppt Template.
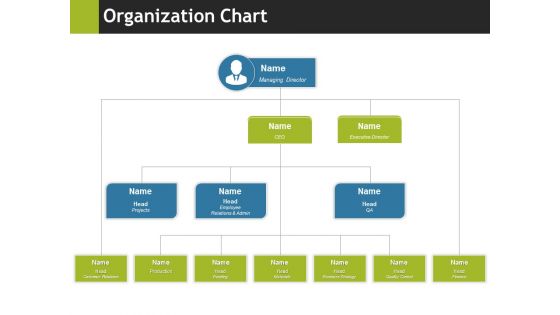
Organization Chart Ppt PowerPoint Presentation Inspiration Slide Download
This is a organization chart ppt powerpoint presentation inspiration slide download. This is a four stage process. The stages in this process are business, marketing, planning, organization chart, management.
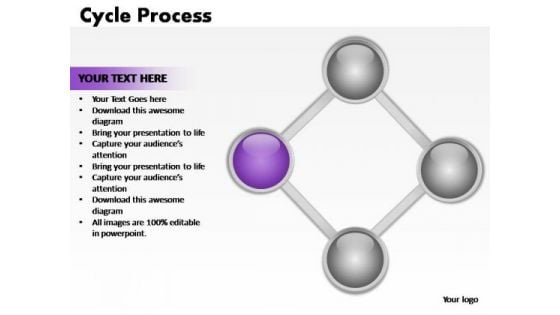
PowerPoint Themes Teamwork Cycle Process Ppt Process
PowerPoint Themes Teamwork Cycle Process PPT Process-Cycle Diagrams are a type of graphics that shows how items are related to one another in a repeating cycle. In a cycle diagram, you can explain the main events in the cycle, how they interact, and how the cycle repeats. These Diagrams can be used to interact visually and logically with audiences. -PowerPoint Themes Teamwork Cycle Process PPT Process Exploit our PowerPoint Themes Teamwork Cycle Process Ppt Process with your ideas. Extract every inch of space on them.
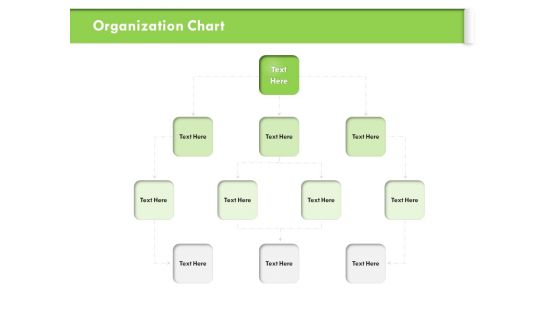
Understanding Organizational Structures Organization Chart Ppt Pictures Microsoft PDF
Presenting this set of slides with name understanding organizational structures organization chart ppt pictures microsoft pdf. This is a four stage process. The stages in this process are organization chart. This is a completely editable PowerPoint presentation and is available for immediate download. Download now and impress your audience.

Gantt Chart Analysis Ppt PowerPoint Presentation Summary Portfolio Cpb
Presenting this set of slides with name gantt chart analysis ppt powerpoint presentation summary portfolio cpb. This is a three stage process. The stages in this process are gantt chart analysis. This is a completely editable PowerPoint presentation and is available for immediate download. Download now and impress your audience.
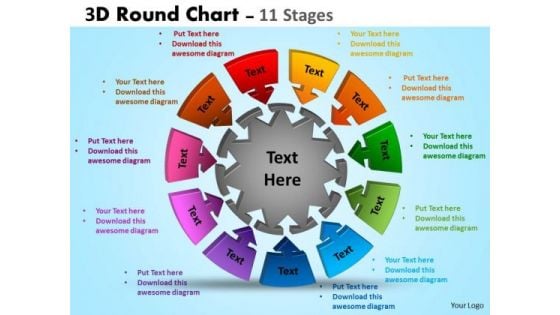
Strategy Diagram 3d Round Chart 11 Stages Business Cycle Diagram
Document The Process On Our Strategy Diagram 3D Round Chart 11 Stages Business Cycle Diagram Powerpoint Templates. Make A Record Of Every Detail.
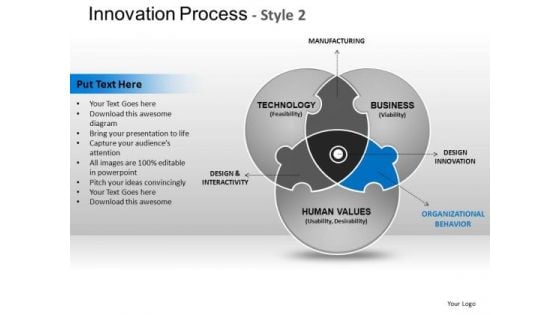
PowerPoint Slides Process Innovation Process Ppt Theme
PowerPoint Slides Process Innovation Process PPT ThemeBusiness PPT templates-These high quality powerpoint pre-designed slides and powerpoint templates have been carefully created by our professional team to help you impress your audience. All slides have been created and are 100% editable in powerpoint. Each and every property of any graphic - color, size, orientation, shading, outline etc. can be modified to help you build an effective powerpoint presentation. Any text can be entered at any point in the powerpoint template or slide. Simply DOWNLOAD, TYPE and PRESENT! Carry your team with our PowerPoint Slides Process Innovation Process Ppt Theme. You will come out on top.
Org Chart Beauty Brand Capital Raising Pitch Deck Icons Pdf
This slide shows diagram representing the organizational structure of the company which can be used to understand the positions of key members. Crafting an eye catching presentation has never been more straightforward. Let your presentation shine with this tasteful yet straightforward Org Chart Beauty Brand Capital Raising Pitch Deck Icons Pdf template. It offers a minimalistic and classy look that is great for making a statement. The colors have been employed intelligently to add a bit of playfulness while still remaining professional. Construct the ideal Org Chart Beauty Brand Capital Raising Pitch Deck Icons Pdf that effortlessly grabs the attention of your audience. Begin now and be certain to wow your customers. This slide shows diagram representing the organizational structure of the company which can be used to understand the positions of key members.

Stock Photo 3d Chart With Six Stages PowerPoint Slide
Use this image slide to provide information about a process or task to the relevant audience. This image presents 3d chart with six stages. This diagram is designed to attract the attention of your audience.
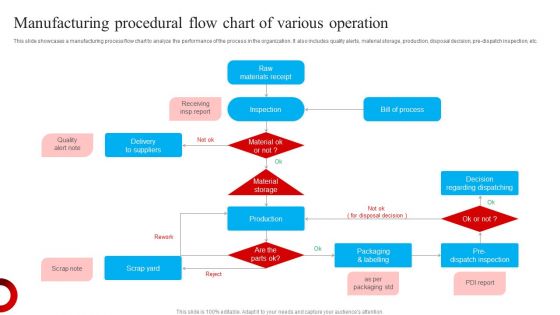
Manufacturing Procedural Flow Chart Of Various Operation Inspiration PDF
This slide showcases a manufacturing process flow chart to analyze the performance of the process in the organization. It also includes quality alerts, material storage, production, disposal decision, pre-dispatch inspection, etc. Persuade your audience using this Manufacturing Procedural Flow Chart Of Various Operation Inspiration PDF. This PPT design covers one stages, thus making it a great tool to use. It also caters to a variety of topics including Raw Materials Receipt, Inspection, Delivery Suppliers . Download this PPT design now to present a convincing pitch that not only emphasizes the topic but also showcases your presentation skills.
Scatter Bubble Chart Ppt PowerPoint Presentation Model Icon
This is a scatter bubble chart ppt powerpoint presentation model icon. This is a three stage process. The stages in this process are finance, business, management, marketing, chart and graph.
Scatter Bubble Chart Ppt PowerPoint Presentation Icon Templates
This is a scatter bubble chart ppt powerpoint presentation icon templates. This is a eight stage process. The stages in this process are business, finance, management, scatter chart, marketing.

Combo Chart Ppt PowerPoint Presentation Inspiration Slide Portrait
This is a combo chart ppt powerpoint presentation inspiration slide portrait. This is a three stage process. The stages in this process are product, market size, bar chart, growth, success.
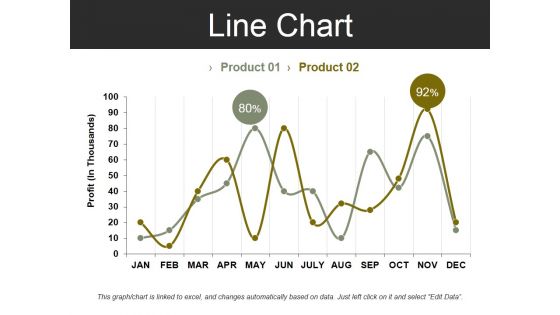
Line Chart Template 2 Ppt PowerPoint Presentation Summary Design Inspiration
This is a line chart template 2 ppt powerpoint presentation summary design inspiration. This is a two stage process. The stages in this process are profit, business, marketing, finance, chart.
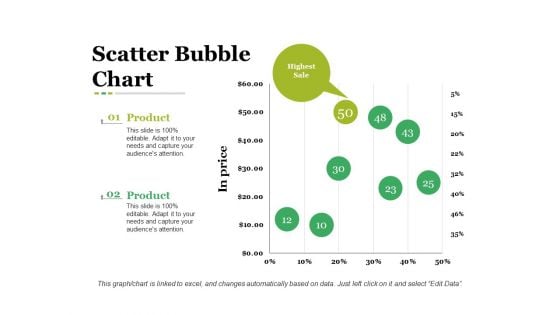
Scatter Bubble Chart Ppt PowerPoint Presentation Infographic Template Graphic Images
This is a scatter bubble chart ppt powerpoint presentation infographic template graphic images. This is a two stage process. The stages in this process are business, in price, bubble chart, marketing, strategy.


 Continue with Email

 Home
Home


