Process Chart
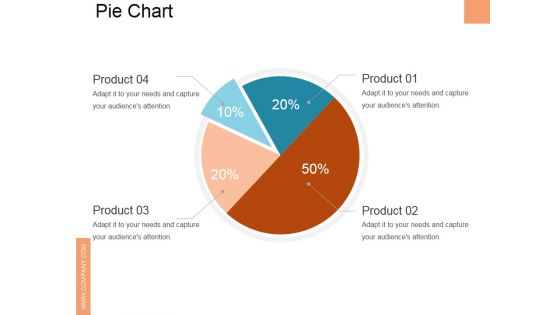
Pie Chart Ppt PowerPoint Presentation Slides Graphics Download
This is a pie chart ppt powerpoint presentation slides graphics download. This is a four stage process. The stages in this process are business, marketing, pie, finance, analysis.

Column Chart Ppt PowerPoint Presentation Inspiration Design Ideas
This is a column chart ppt powerpoint presentation inspiration design ideas. This is a nine stage process. The stages in this process are product, growth, success, graph, business.
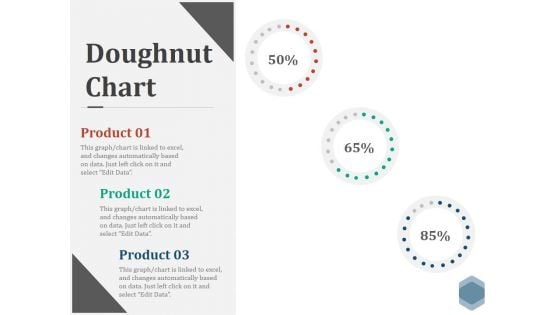
Doughnut Chart Ppt PowerPoint Presentation Visual Aids Files
This is a doughnut chart ppt powerpoint presentation visual aids files. This is a three stage process. The stages in this process are finance, donut, percentage, business, marketing.
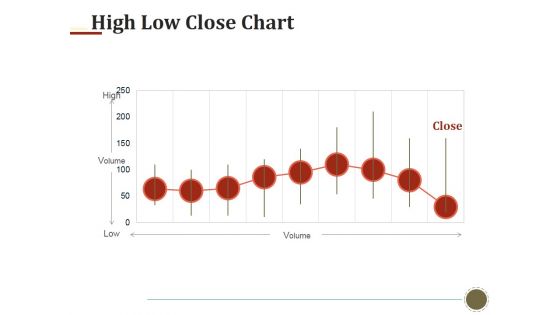
High Low Close Chart Ppt PowerPoint Presentation Infographics Templates
This is a high low close chart ppt powerpoint presentation infographics templates. This is a nine stage process. The stages in this process are high, volume, low, close.
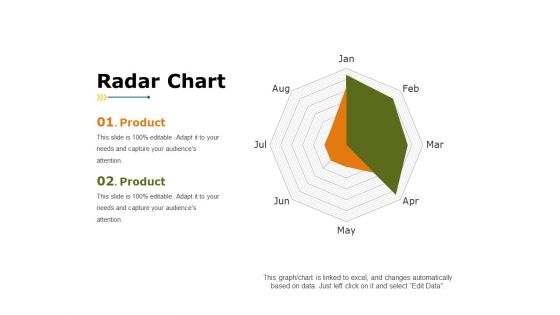
Radar Chart Ppt PowerPoint Presentation Summary Background Designs
This is a radar chart ppt powerpoint presentation summary background designs. This is a two stage process. The stages in this process are product, finance, business, marketing.
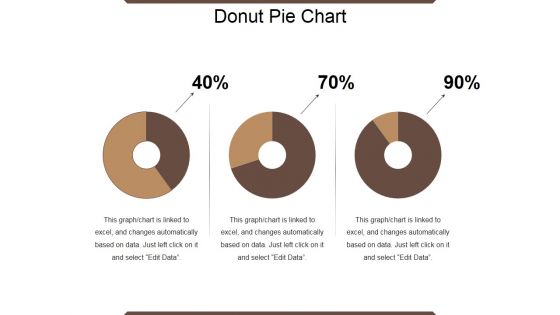
Donut Pie Chart Ppt PowerPoint Presentation Show Topics
This is a donut pie chart ppt powerpoint presentation show topics. This is a three stage process. The stages in this process are percentage, finance, donut, business.
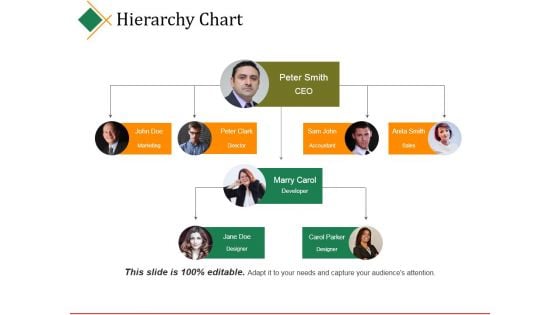
Hierarchy Chart Ppt PowerPoint Presentation Infographic Template Graphics
This is a hierarchy chart ppt powerpoint presentation infographic template graphics. This is a four stage process. The stages in this process are ceo, director, accountant, sales, developer.
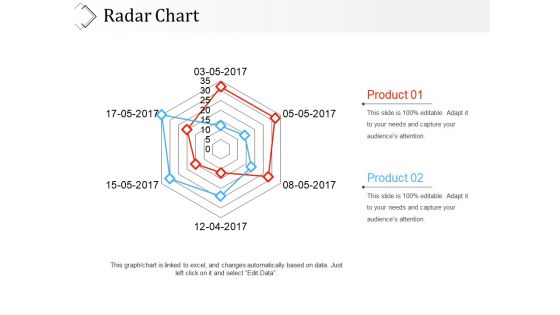
Radar Chart Ppt PowerPoint Presentation File Graphic Tips
This is a radar chart ppt powerpoint presentation file graphic tips. This is a two stage process. The stages in this process are product, finance, marketing, business.
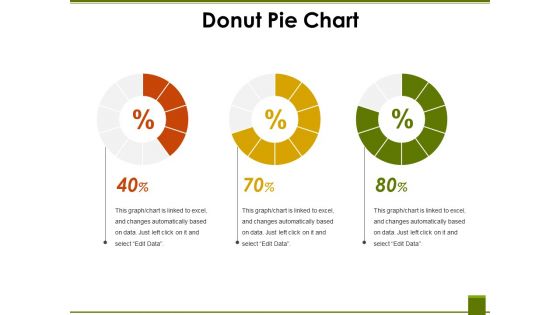
Donut Pie Chart Ppt PowerPoint Presentation File Mockup
This is a donut pie chart ppt powerpoint presentation file mockup. This is a three stage process. The stages in this process are finance, business, percentage, marketing.
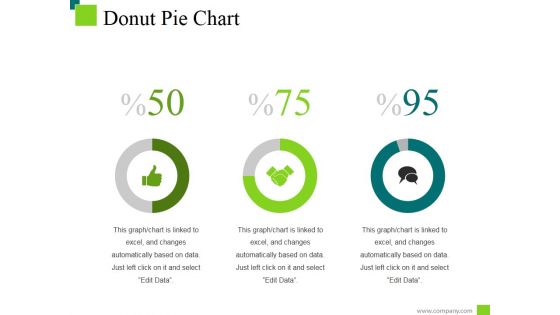
Donut Pie Chart Ppt PowerPoint Presentation Inspiration Deck
This is a donut pie chart ppt powerpoint presentation inspiration deck. This is a three stage process. The stages in this process are percentage, finance, donut, business.

Radar Chart Ppt PowerPoint Presentation Summary Slide Portrait
This is a radar chart ppt powerpoint presentation summary slide portrait. This is a two stage process. The stages in this process are product, business, marketing, finance.
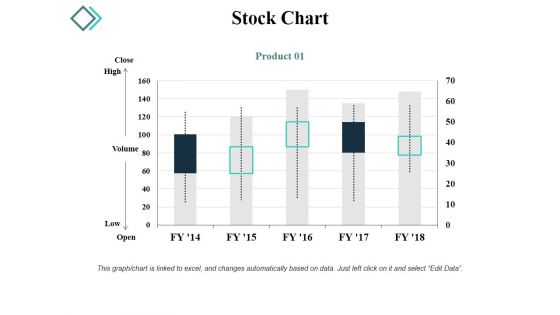
Stock Chart Ppt PowerPoint Presentation Gallery Graphic Images
This is a stock chart ppt powerpoint presentation gallery graphic images. This is a five stage process. The stages in this process are close, high, volume, low, open.
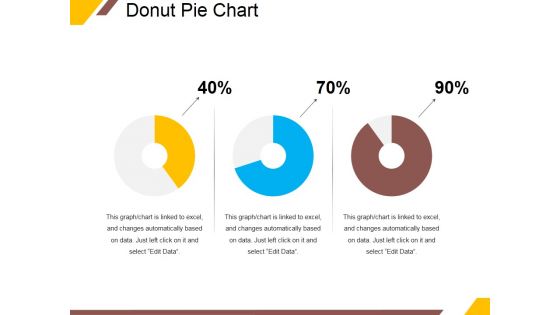
Donut Pie Chart Ppt PowerPoint Presentation Ideas Portrait
This is a donut pie chart ppt powerpoint presentation ideas portrait. This is a three stage process. The stages in this process are percentage, finance, donut, business.
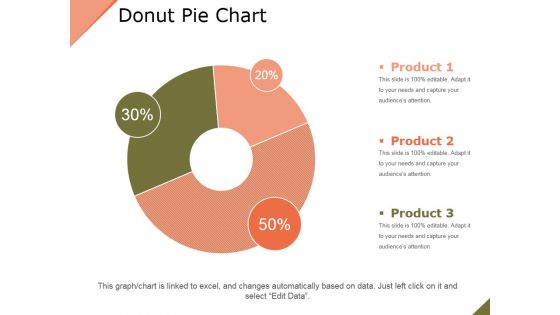
Donut Pie Chart Ppt PowerPoint Presentation Layouts Outfit
This is a donut pie chart ppt powerpoint presentation layouts outfit. This is a three stage process. The stages in this process are product, business, percentage, finance, marketing.
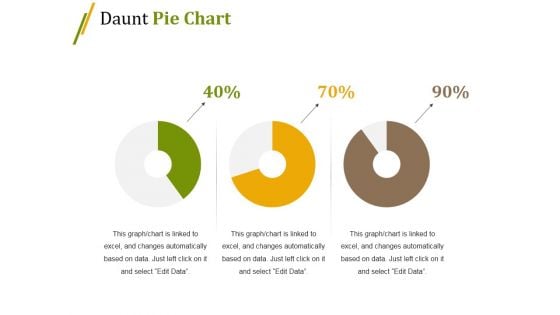
Daunt Pie Chart Ppt PowerPoint Presentation Show Gallery
This is a daunt pie chart ppt powerpoint presentation show gallery. This is a five stage process. The stages in this process are business, marketing, teamwork, communication, strategy.
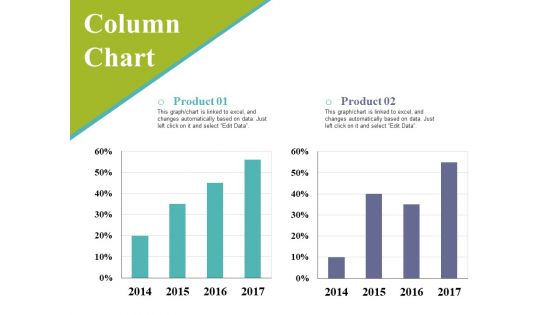
Column Chart Ppt PowerPoint Presentation Styles Background Image
This is a column chart ppt powerpoint presentation styles background image. This is a two stage process. The stages in this process are business, graph, percentage, marketing, strategy.
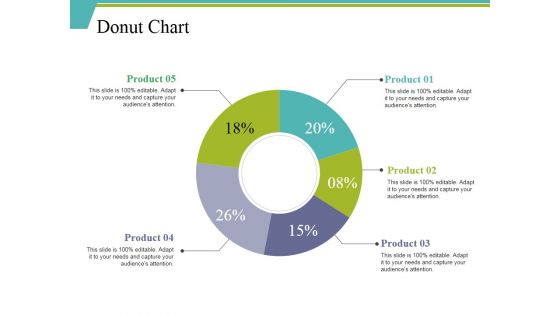
Donut Chart Ppt PowerPoint Presentation Ideas Background Designs
This is a donut chart ppt powerpoint presentation ideas background designs. This is a five stage process. The stages in this process are percentage, finance, donut, business, product.
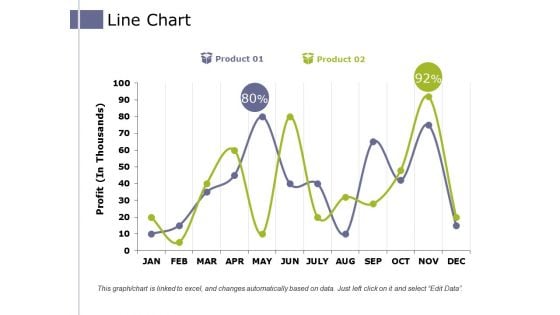
Line Chart Ppt PowerPoint Presentation Pictures Example Introduction
This is a line chart ppt powerpoint presentation pictures example introduction. This is a two stage process. The stages in this process are product, profit, business, growth, success.
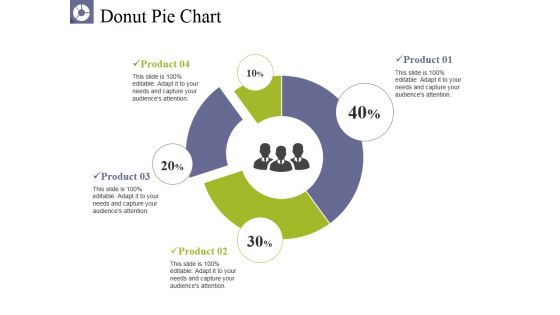
Donut Pie Chart Ppt PowerPoint Presentation Pictures Graphics
This is a donut pie chart ppt powerpoint presentation pictures graphics. This is a four stage process. The stages in this process are product, business, percentage, donut, finance.
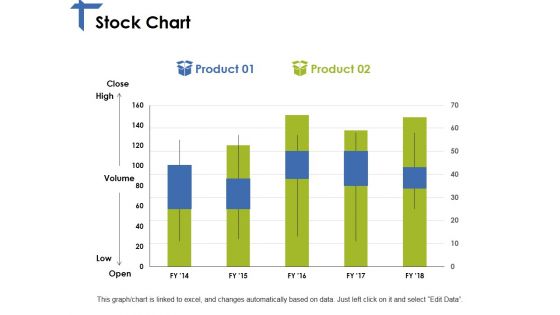
Stock Chart Ppt PowerPoint Presentation Slides Graphics Pictures
This is a stock chart ppt powerpoint presentation slides graphics pictures. This is a two stage process. The stages in this process are product, high, volume, low, open.
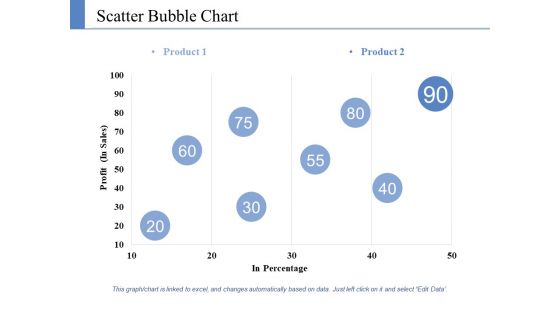
Scatter Bubble Chart Ppt PowerPoint Presentation Styles Information
This is a scatter bubble chart ppt powerpoint presentation styles information. This is a two stage process. The stages in this process are product, profit, in percentage.
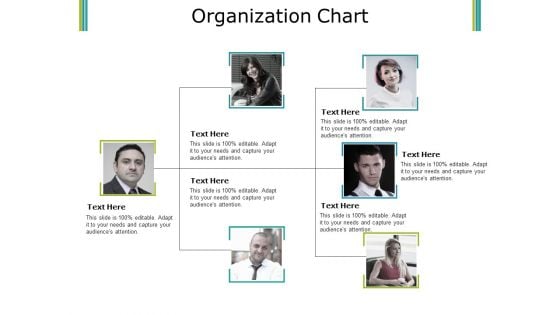
Organization Chart Ppt PowerPoint Presentation Ideas Graphics Download
This is a organization chart ppt powerpoint presentation ideas graphics download. This is a three stage process. The stages in this process are hierarchy, step, teamwork, communication, business.
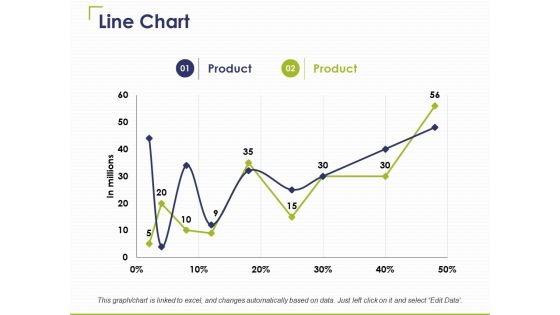
Line Chart Ppt PowerPoint Presentation Inspiration Slide Download
This is a line chart ppt powerpoint presentation inspiration slide download. This is a two stage process. The stages in this process are product, in millions, business, marketing.
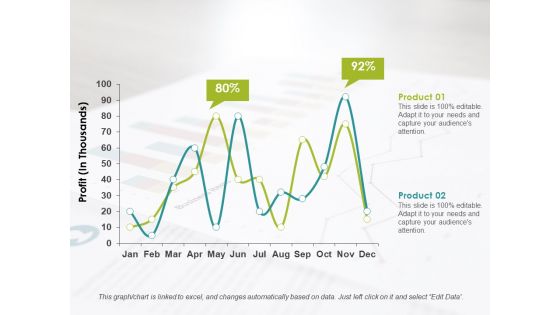
Line Chart Ppt PowerPoint Presentation Infographics Format Ideas
This is a line chart ppt powerpoint presentation infographics format ideas. This is a two stage process. The stages in this process are product, profit, business.
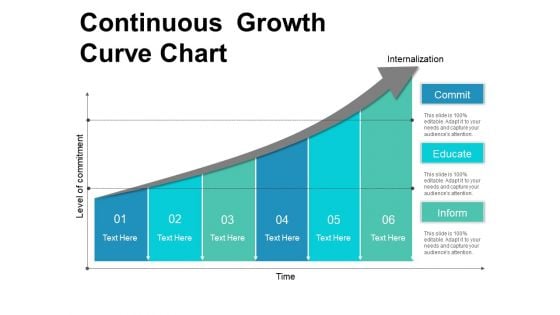
Continuous Growth Curve Chart Ppt PowerPoint Presentation Inspiration Slideshow
This is a continuous growth curve chart ppt powerpoint presentation inspiration slideshow. This is a six stage process. The stages in this process are circular, continuity, continuum.

Eight Stages Sequential Function Chart Ppt PowerPoint Presentation Slides Graphics
This is a eight stages sequential function chart ppt powerpoint presentation slides graphics. This is a eight stage process. The stages in this process are circular, continuity, continuum.
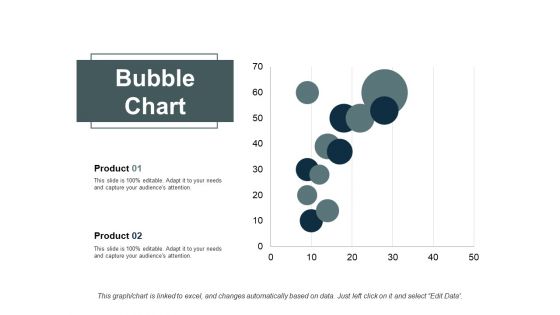
Bubble Chart Finance Ppt PowerPoint Presentation Slides Show
This is a bubble chart finance ppt powerpoint presentation slides show. This is a two stage process. The stages in this process are finance, marketing, analysis, business, investment.
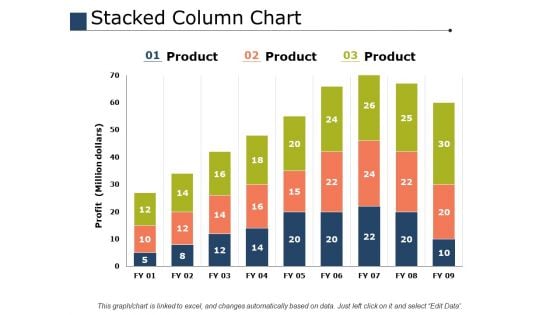
Stacked Column Chart Ppt PowerPoint Presentation Slides Files
This is a stacked column chart ppt powerpoint presentation slides files. This is a three stage process. The stages in this process are percentage, product, business, marketing.
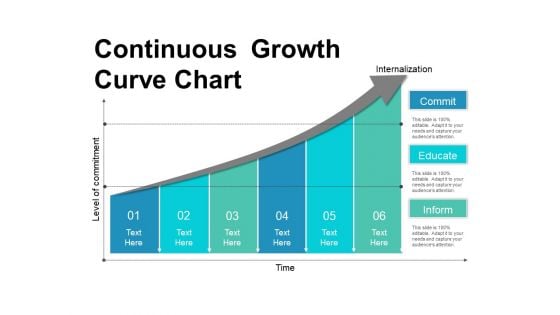
Continuous Growth Curve Chart Ppt PowerPoint Presentation Inspiration Portrait
This is a continuous growth curve chart ppt powerpoint presentation inspiration portrait. This is a six stage process. The stages in this process are circular, continuity, continuum.
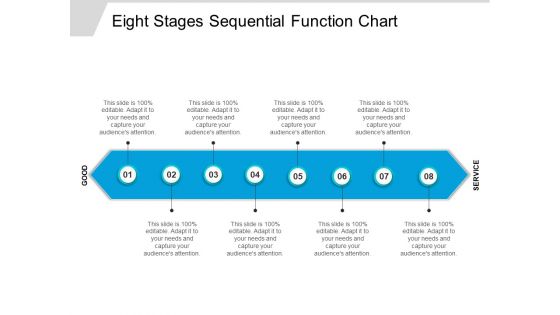
Eight Stages Sequential Function Chart Ppt PowerPoint Presentation Professional Maker
This is a eight stages sequential function chart ppt powerpoint presentation professional maker. This is a eight stage process. The stages in this process are circular, continuity, continuum.
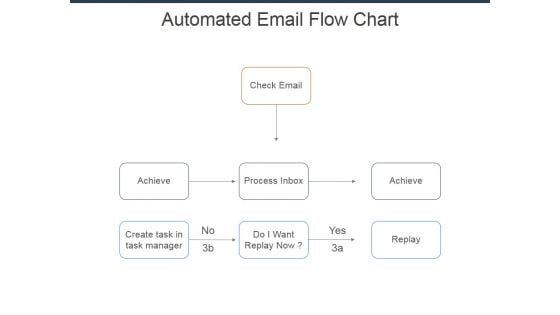
Automated Email Flow Chart Ppt Powerpoint Presentation Infographics Show
This is a automated email flow chart ppt powerpoint presentation infographics show. This is a three stage process. The stages in this process are check email, achieve, process inbox, do i want replay now, create task in task manager.
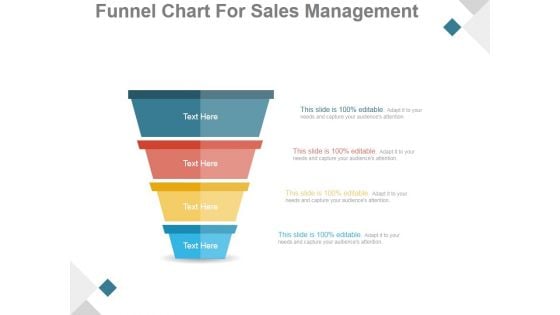
Funnel Chart For Sales Management Ppt PowerPoint Presentation Styles
This is a funnel chart for sales management ppt powerpoint presentation styles. This is a four stage process. The stages in this process are funnel, process, flow, business, sale.
Donut Pie Chart Ppt PowerPoint Presentation Icon Background Images
This is a donut pie chart ppt powerpoint presentation icon background images. This is a four stage process. The stages in this process are donut, process, planning, percentage, finance.
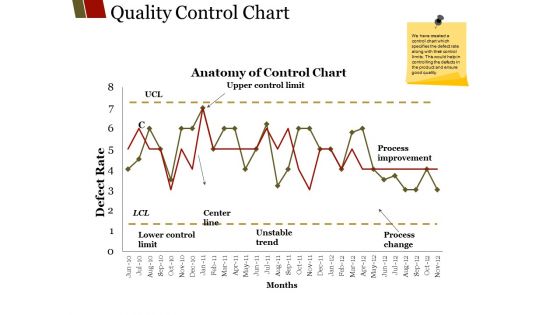
Quality Control Chart Ppt PowerPoint Presentation File Graphics Design
This is a quality control chart ppt powerpoint presentation file graphics design. This is a two stage process. The stages in this process are unstable trend, months center line, lower control limit, process improvement.
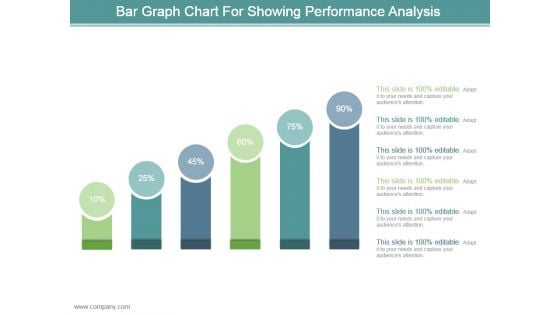
Bar Graph Chart For Showing Performance Analysis Ppt Design
This is a bar graph chart for showing performance analysis ppt design. This is a six stage process. The stages in this process are business, marketing, process, success, presentation.
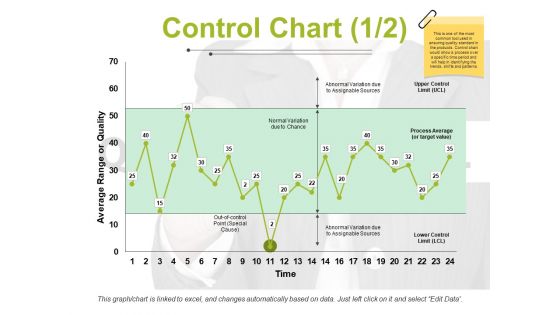
Control Chart Template 1 Ppt PowerPoint Presentation Ideas Images
This is a control chart template 1 ppt powerpoint presentation ideas images. This is a two stage process. The stages in this process are average range or quality, upper control limit, lower control limit, time, process average.
High Low Close Chart Ppt PowerPoint Presentation Icon Background Images
This is a high low close chart ppt powerpoint presentation icon background images. This is a ten stage process. The stages in this process are finance, analysis, planning, business, process.

Insurance Claim Approval Flow Chart Ppt Powerpoint Presentation Styles Gallery
This is a insurance claim approval flow chart ppt powerpoint presentation styles gallery. This is a four stage process. The stages in this process are insurance claim process, insurance claim steps, insurance claim procedure.
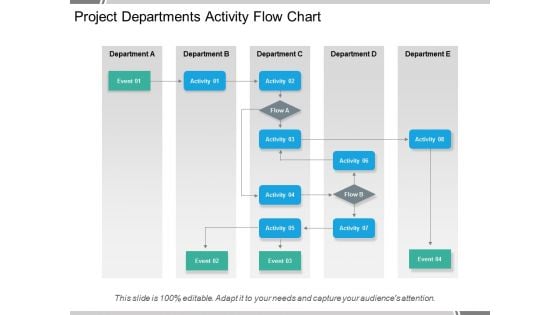
Project Departments Activity Flow Chart Ppt PowerPoint Presentation Pictures Show
This is a project departments activity flow chart ppt powerpoint presentation pictures show. This is a five stage process. The stages in this process are operational excellence, operational plan, operational process.
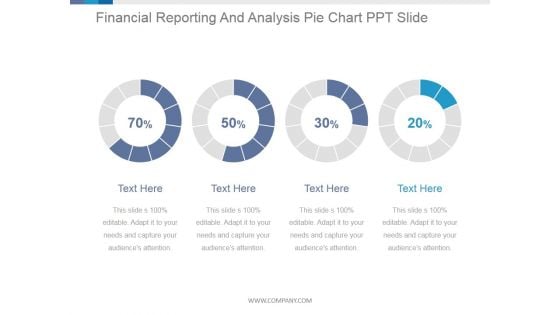
Financial Reporting And Analysis Pie Chart Ppt PowerPoint Presentation Guidelines
This is a financial reporting and analysis pie chart ppt powerpoint presentation guidelines. This is a four stage process. The stages in this process are process, percentage, business, marketing, finance.
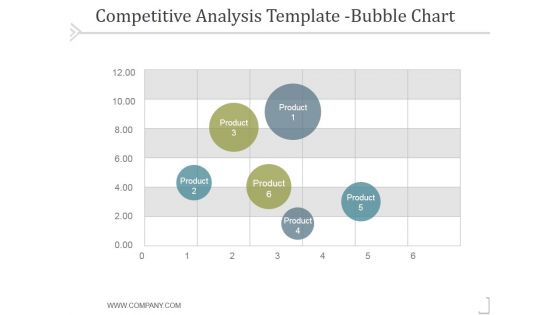
Competitive Analysis Bubble Chart Template 1 Ppt PowerPoint Presentation Influencers
This is a competitive analysis bubble chart template 1 ppt powerpoint presentation influencers. This is a six stage process. The stages in this process are business, strategy, marketing, success, process.
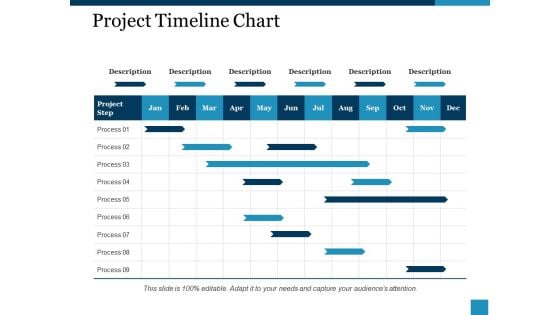
Project Timeline Chart Ppt PowerPoint Presentation Portfolio Gridlines
This is a project timeline chart ppt powerpoint presentation portfolio gridlines. This is a nine stage process. The stages in this process are description, process, project step, table, business.
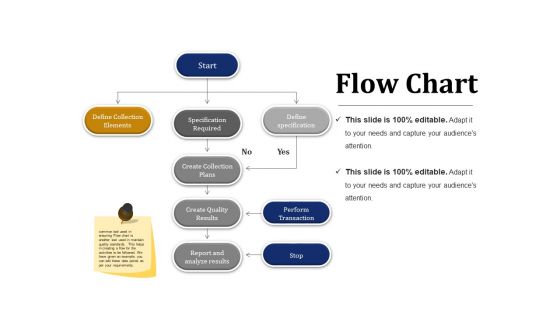
Flow Chart Ppt PowerPoint Presentation Professional Design Templates
This is a flow chart ppt powerpoint presentation professional design templates. This is a three stage process. The stages in this process are define collection elements, specification required, define specification, create collection plans, create quality results.
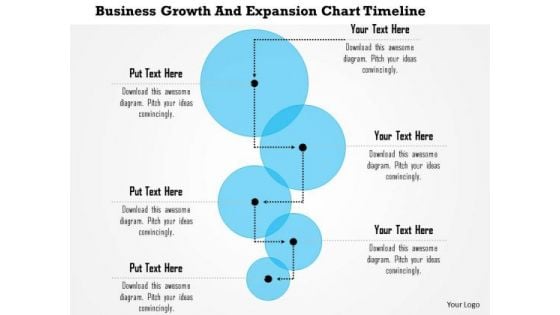
Business Framework Business Growth And Expansion Chart Timeline PowerPoint Presentation
Six staged process flow linear diagram is used to design this Power Point template. This PPT slide contains the concept of data and process flow. This exclusive PPT can be used for linear process flow representation in any presentation.
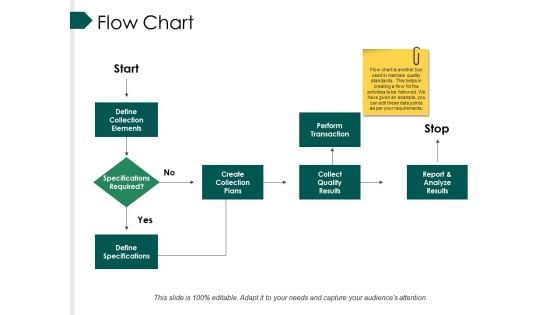
Flow Chart Ppt PowerPoint Presentation Infographic Template Mockup
This is a flow chart ppt powerpoint presentation infographic template mockup. This is a four stage process. The stages in this process are define collection elements, create collection plans, perform, transaction, collect quality results.
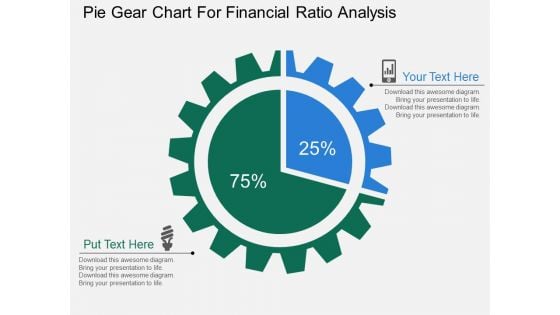
Pie Gear Chart For Financial Ratio Analysis Powerpoint Templates
This PPT slide displays diagram of pie gear chart. This PowerPoint template has been designed to exhibit financial ratio analysis. You can present your opinions using this impressive slide
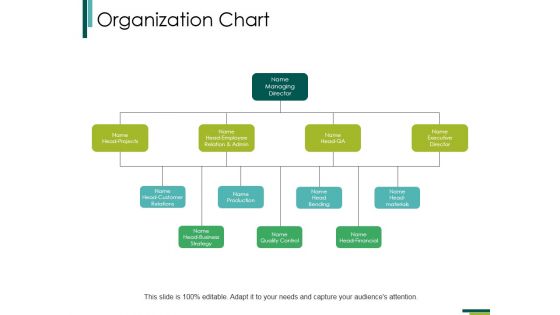
Organization Chart Ppt PowerPoint Presentation Infographic Template Files
This is a organization chart ppt powerpoint presentation infographic template files. This is a four stage process. The stages in this process are managing director, head projects, head business strategy, quality control.
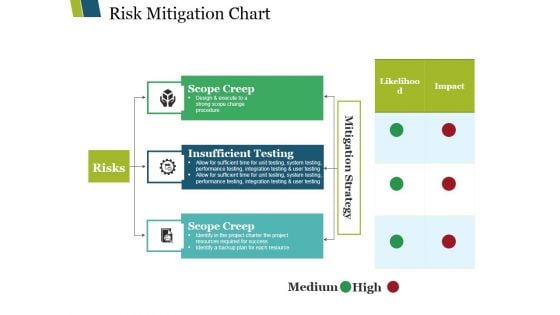
Risk Mitigation Chart Ppt PowerPoint Presentation Infographic Template Elements
This is a risk mitigation chart ppt powerpoint presentation infographic template elements. This is a three stage process. The stages in this process are scope creep, insufficient testing, insufficient resources, risks.
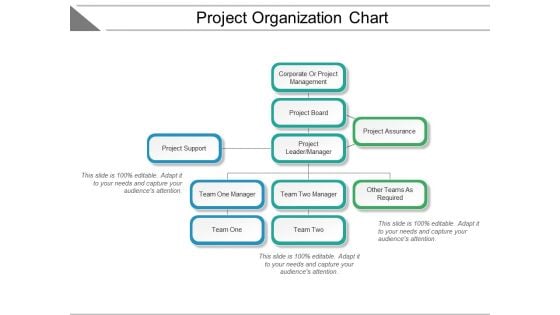
Project Organization Chart Ppt PowerPoint Presentation Summary Elements
This is a project organization chart ppt powerpoint presentation summary elements. This is a three stage process. The stages in this process are project governance, governance structure, project structure.
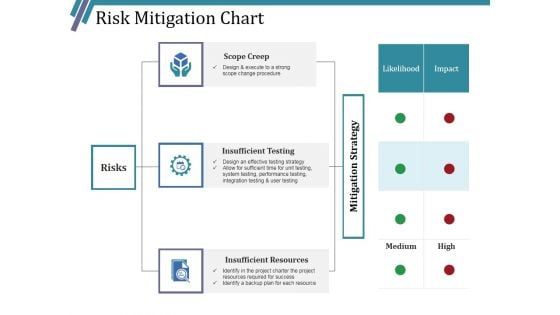
Risk Mitigation Chart Ppt PowerPoint Presentation Infographic Template Layouts
This is a risk mitigation chart ppt powerpoint presentation infographic template layouts. This is a three stage process. The stages in this process are scope creep, insufficient testing, insufficient resources, risks.
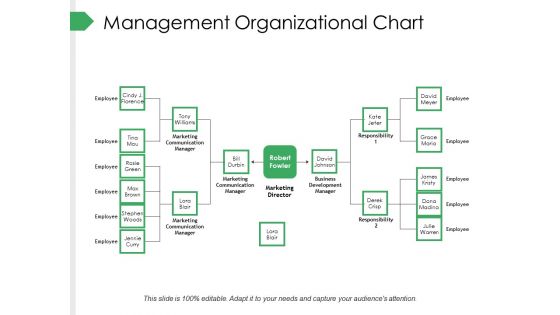
Management Organizational Chart Ppt PowerPoint Presentation Summary Gallery
This is a management organizational chart ppt powerpoint presentation summary gallery. This is a two stage process. The stages in this process are employee, marketing communication manager, marketing director, business development manager, responsibility, tony williams.
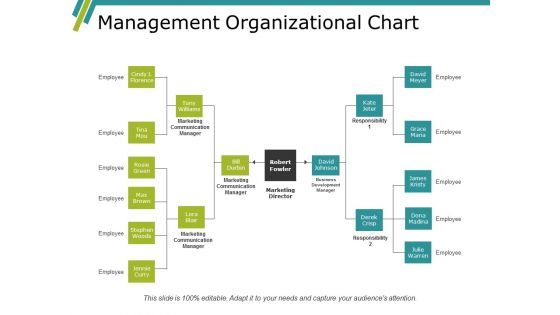
Management Organizational Chart Ppt PowerPoint Presentation Visual Aids Portfolio
This is a management organizational chart ppt powerpoint presentation visual aids portfolio. This is a three stage process. The stages in this process are rosie green, max brown, stephen woods, jennie curry, lora blair.
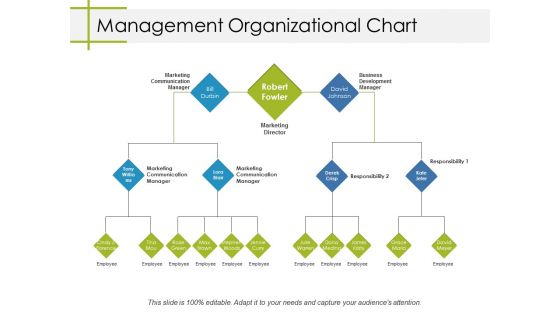
Management Organizational Chart Ppt PowerPoint Presentation Layouts Topics
This is a management organizational chart ppt powerpoint presentation layouts topics. This is a three stage process. The stages in this process are bill durbin, robert fowler, david johnson, tony williams, lora blair.
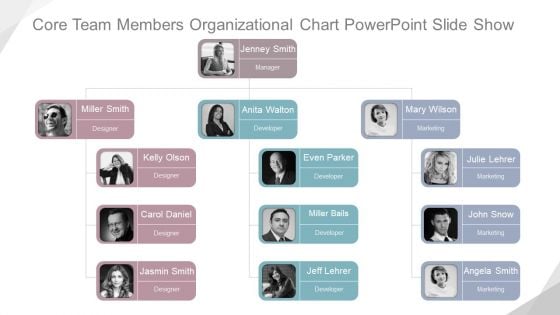
Core Team Members Organizational Chart Ppt PowerPoint Presentation Background Designs
This is a core team members organizational chart ppt powerpoint presentation background designs. This is a five stage process. The stages in this process are manager, designer, developer, marketing.
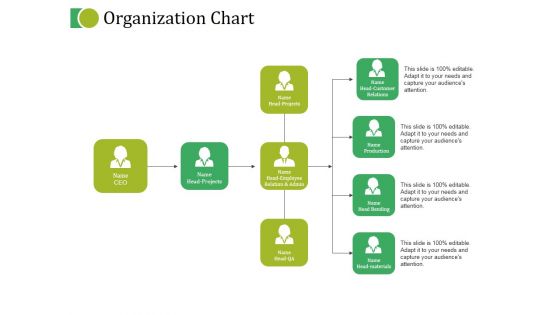
Organization Chart Ppt PowerPoint Presentation Gallery Graphics Pictures
This is a organization chart ppt powerpoint presentation gallery graphics pictures. This is a four stage process. The stages in this process are head customer relations name, production name, head bending name, head employee relation and admin, name head projects.
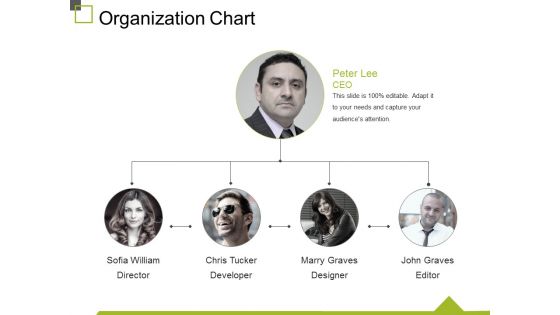
Organization Chart Ppt PowerPoint Presentation File Slide Download
This is a organization chart ppt powerpoint presentation file slide download. This is a four stage process. The stages in this process are sofia william, chris tucker, marry graves, john graves, business.
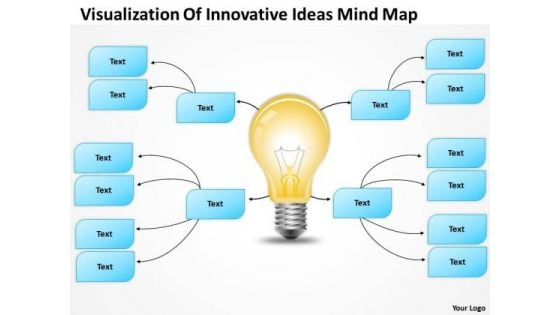
PowerPoint Org Chart Visualization Of Innovative Ideas Mind Map Templates
We present our powerpoint org chart visualization of innovative ideas mind map templates.Use our Technology PowerPoint Templates because These PowerPoint Templates and Slides will give the updraft to your ideas. See them soar to great heights with ease. Download our Marketing PowerPoint Templates because Our PowerPoint Templates and Slides are a sure bet. Gauranteed to win against all odds. Use our Arrows PowerPoint Templates because Our PowerPoint Templates and Slides will effectively help you save your valuable time. They are readymade to fit into any presentation structure. Use our Light Bulbs PowerPoint Templates because Our PowerPoint Templates and Slides are effectively colour coded to prioritise your plans They automatically highlight the sequence of events you desire. Present our Business PowerPoint Templates because Our PowerPoint Templates and Slides will definately Enhance the stature of your presentation. Adorn the beauty of your thoughts with their colourful backgrounds.Use these PowerPoint slides for presentations relating to Chart, flow, organization, flowchart, diagram, sitemap, process, box, arrow, graph, business, graphical, data, design, important, rectangle, corporate, plan, president, concept, hierarchy, glossy, teamwork, tier, chain, supervisor, relation, steps, glassy, connection, ladder, administration, group, connect, organize, connectivity, site-map, office, financial, structure, officer, glass. The prominent colors used in the PowerPoint template are Yellow, Gray, White. Maintain the continuity of your thoughts. Our PowerPoint Org Chart Visualization Of Innovative Ideas Mind Map Templates will be the fillers.
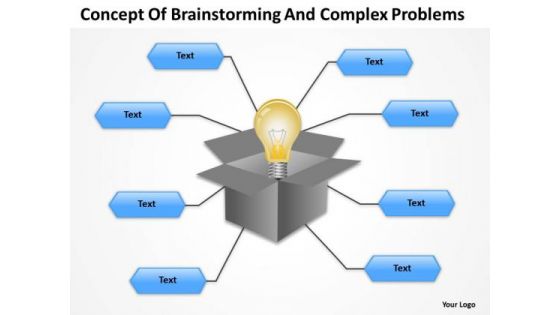
Organization Chart Template Concept Of Brainstormingand Complex Problems PowerPoint Templates
We present our organization chart template concept of brainstormingand complex problems powerpoint templates.Download our Technology PowerPoint Templates because Our PowerPoint Templates and Slides will let Your superior ideas hit the target always and everytime. Use our Marketing PowerPoint Templates because Timeline crunches are a fact of life. Meet all deadlines using our PowerPoint Templates and Slides. Download our Arrows PowerPoint Templates because Our PowerPoint Templates and Slides will give good value for money. They also have respect for the value of your time. Download and present our Light Bulbs PowerPoint Templates because Our PowerPoint Templates and Slides will let your words and thoughts hit bullseye everytime. Download our Business PowerPoint Templates because Our PowerPoint Templates and Slides will give you great value for your money. Be assured of finding the best projection to highlight your words. Use these PowerPoint slides for presentations relating to Chart, flow, organization, flowchart, diagram, sitemap, process, box, arrow, graph, business, light bulb, data, design, important, rectangle, corporate, plan, president, concept, hierarchy, glossy, teamwork, tier, chain, supervisor, relation, steps, glassy, connection, ladder, administration, group, connect, organize, connectivity, technology, office, financial, structure, officer, glass. The prominent colors used in the PowerPoint template are Yellow, Blue, Gray. Upgrade your presentation with our Organization Chart Template Concept Of Brainstormingand Complex Problems PowerPoint Templates. Download without worries with our money back guaranteee.
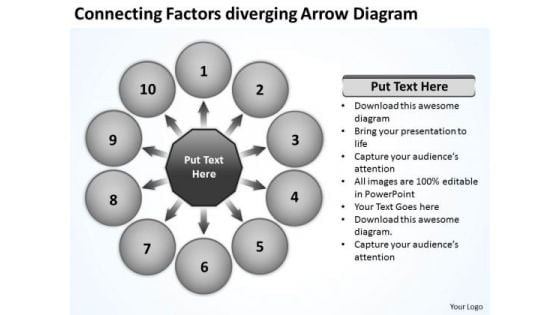
Connecting Factors Diverging Arrow Diagram Circular Flow Chart PowerPoint Slides
We present our connecting factors diverging arrow diagram Circular Flow Chart PowerPoint Slides.Present our Success PowerPoint Templates because you have come up with a brilliant breakthrough idea. you can also visualise the interest it will generate. Download and present our Arrows PowerPoint Templates because it shows the pyramid which is a symbol of the desire to reach the top in a steady manner. Download and present our Business PowerPoint Templates because you have churned your mind and come upwith solutions. Use our Shapes PowerPoint Templates because you will be able to Highlight your ideas broad-based on strong fundamentals and illustrate how they step by step acheive the set growth factor. Download our Flow Charts PowerPoint Templates because you know the path so show the way.Use these PowerPoint slides for presentations relating to Access, Arrow, Business, Chart, Circle, Concept, Conceptual, Connection, Corporate, Creative, Graphic, Illustration, Process, Shape, Template, Text, Usable, Web, Website. The prominent colors used in the PowerPoint template are White, Gray, Black. People tell us our connecting factors diverging arrow diagram Circular Flow Chart PowerPoint Slides are Appealing. Use our Connection PowerPoint templates and PPT Slides will generate and maintain the level of interest you desire. They will create the impression you want to imprint on your audience. Professionals tell us our connecting factors diverging arrow diagram Circular Flow Chart PowerPoint Slides will make the presenter look like a pro even if they are not computer savvy. Presenters tell us our Concept PowerPoint templates and PPT Slides are Efficacious. Professionals tell us our connecting factors diverging arrow diagram Circular Flow Chart PowerPoint Slides are Whimsical. PowerPoint presentation experts tell us our Chart PowerPoint templates and PPT Slides are Pleasant. Move away from amateur slides. Make them professional with our Connecting Factors Diverging Arrow Diagram Circular Flow Chart PowerPoint Slides. You will be at the top of your game.
cost volume profit analysis chart ppt powerpoint presentation icon slideshow
This is a cost volume profit analysis chart ppt powerpoint presentation icon slideshow. This is a three stage process. The stages in this process are break even point,break even analysis,break even level.


 Continue with Email

 Home
Home


