Process Chart
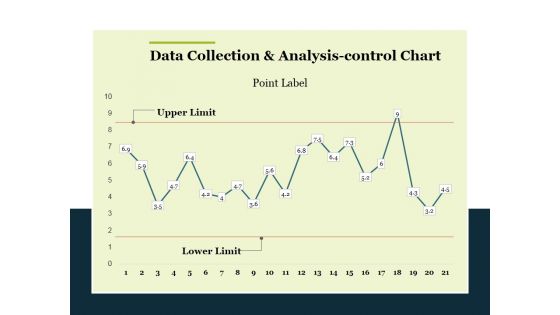
Data Collection And Analysis Control Chart Ppt PowerPoint Presentation Summary Templates
This is a data collection and analysis control chart ppt powerpoint presentation summary templates. This is a one stage process. The stages in this process are business, marketing, point label, upper limit, lower limit.
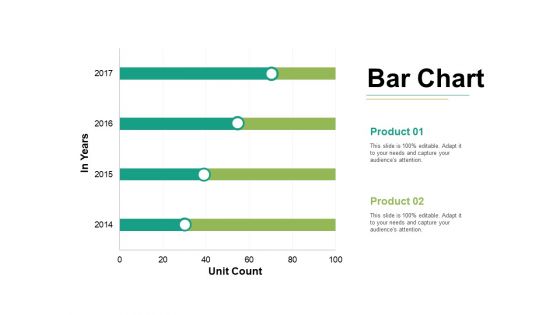
Bar Chart Ppt PowerPoint Presentation Styles Graphics Tutorials Ppt PowerPoint Presentation Slides Gallery
This is a bar chart ppt powerpoint presentation styles graphics tutorials ppt powerpoint presentation slides gallery. This is a two stage process. The stages in this process are bar graph, growth, success, business, marketing.
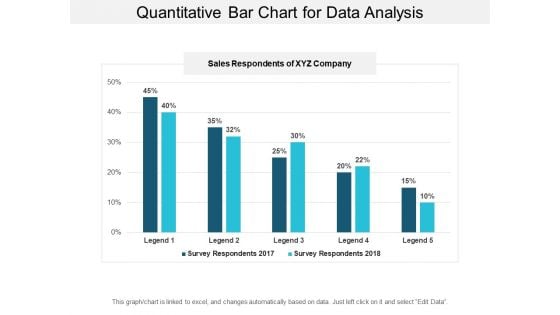
Quantitative Bar Chart For Data Analysis Ppt PowerPoint Presentation Model Graphic Tips
This is a quantitative bar chart for data analysis ppt powerpoint presentation model graphic tips. This is a two stage process. The stages in this process are financial analysis, quantitative, statistical modelling.
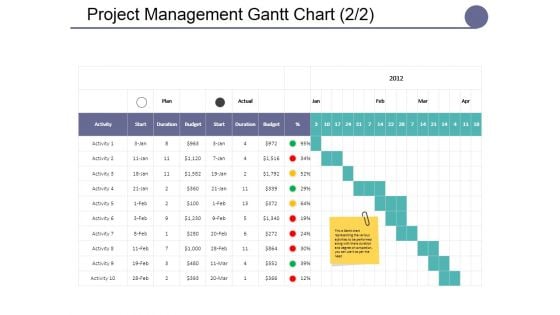
Project Management Gantt Chart Template Ppt PowerPoint Presentation Summary Master Slide
This is a project management gantt chart template ppt powerpoint presentation summary master slide. This is a seven stage process. The stages in this process are lists, table, data, management, marketing.
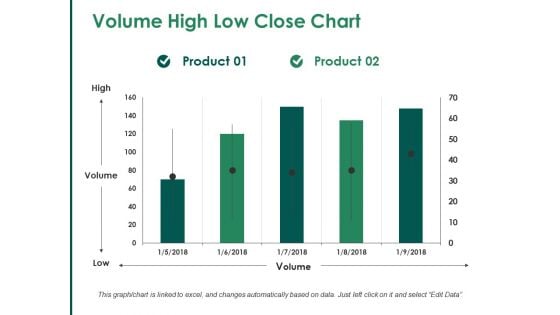
Volume High Low Close Chart Ppt PowerPoint Presentation Visual Aids Slides
This is a volume high low close chart ppt powerpoint presentation visual aids slides. This is a two stage process. The stages in this process are bar graph, marketing, strategy, finance, planning.
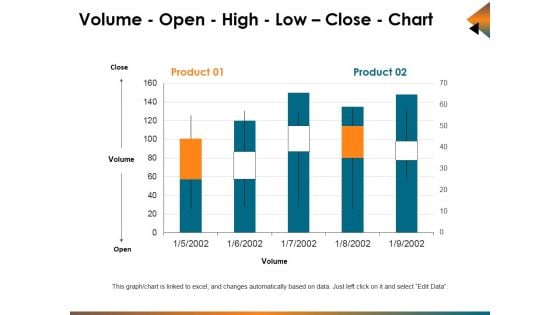
Volume Open High Low Close Chart Ppt PowerPoint Presentation Ideas Graphics Example
This is a volume open high low close chart ppt powerpoint presentation ideas graphics example. This is a five stage process. The stages in this process are business, bar graph, stock, cost, market.
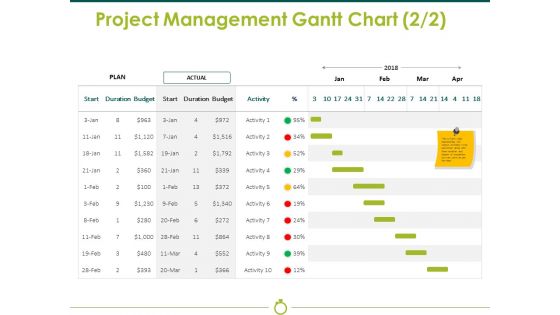
Project Management Gantt Chart Template 2 Ppt PowerPoint Presentation Show Styles
This is a project management gantt chart template 2 ppt powerpoint presentation show styles. This is a two stage process. The stages in this process are plan, actual, budget, duration, start.
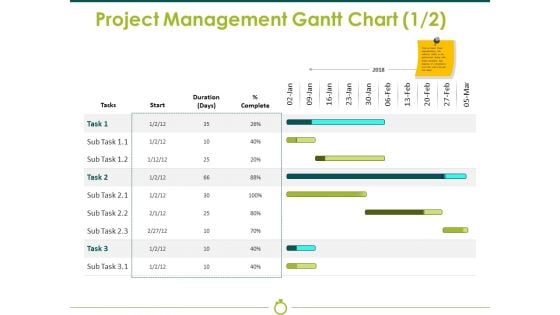
Project Management Gantt Chart Template 1 Ppt PowerPoint Presentation Gallery Graphics Template
This is a project management gantt chart template 1 ppt powerpoint presentation gallery graphics template. This is a two stage process. The stages in this process are start, duration, complete, business, finance.
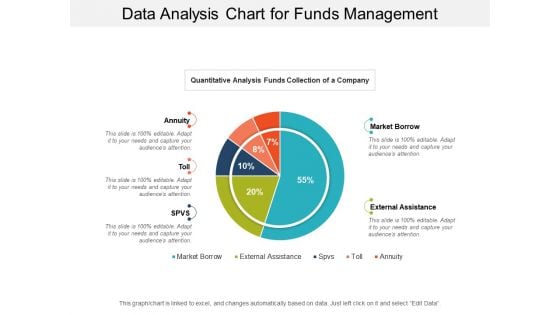
Data Analysis Chart For Funds Management Ppt PowerPoint Presentation Infographic Template Files
This is a data analysis chart for funds management ppt powerpoint presentation infographic template files. This is a five stage process. The stages in this process are financial analysis, quantitative, statistical modelling.
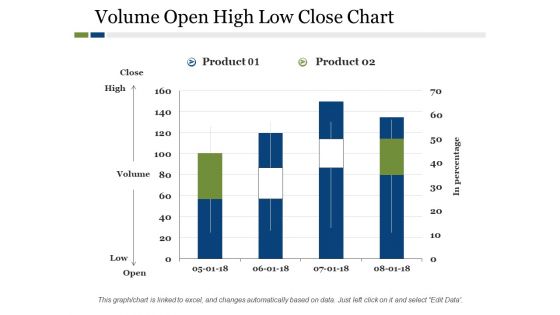
Volume Open High Low Close Chart Ppt PowerPoint Presentation Outline Mockup
This is a volume open high low close chart ppt powerpoint presentation outline mockup. This is a two stage process. The stages in this process are product, high, low, in percentage, volume.
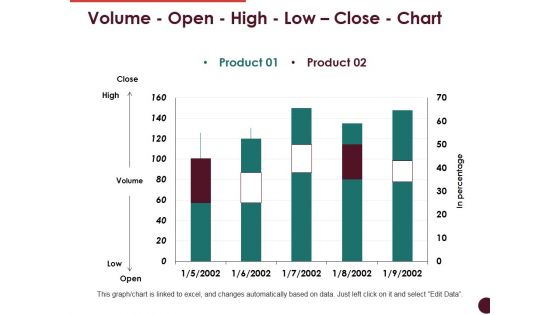
Volume Open High Low Close Chart Ppt PowerPoint Presentation File Graphics Template
This is a volume open high low close chart ppt powerpoint presentation file graphics template. This is a two stage process. The stages in this process are close, high, volume, low, open, product.
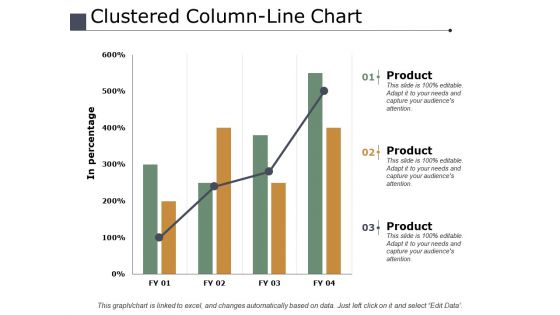
Clustered Column Line Chart Finance Ppt PowerPoint Presentation Inspiration Design Templates
This is a clustered column line chart finance ppt powerpoint presentation inspiration design templates. This is a three stage process. The stages in this process are finance, analysis, business, investment, marketing.
Volume High Low Close Chart Ppt PowerPoint Presentation Icon Graphics Pictures
This is a volume high low close chart ppt powerpoint presentation icon graphics pictures. This is a two stage process. The stages in this process are high, volume, low.
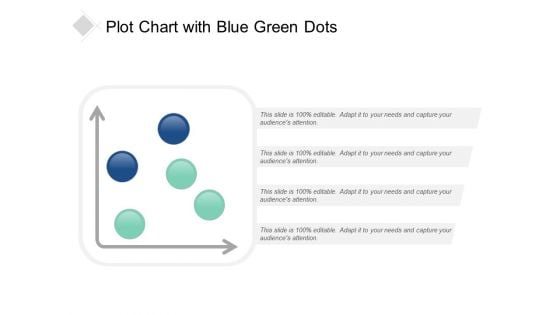
Plot Chart With Blue Green Dots Ppt Powerpoint Presentation Portfolio Graphic Tips
This is a plot chart with blue green dots ppt powerpoint presentation portfolio graphic tips. This is a four stage process. The stages in this process are scatter plot, probability plots, plot diagram.
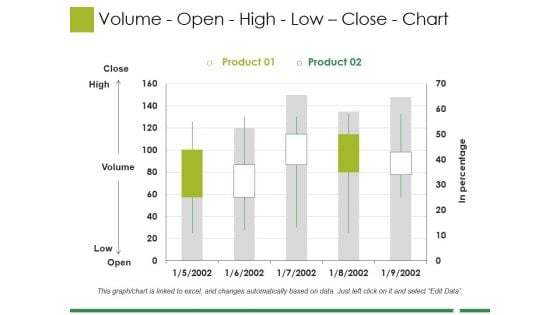
Volume Open High Low Close Chart Ppt PowerPoint Presentation Professional Format
This is a volume open high low close chart ppt powerpoint presentation professional format. This is a five stage process. The stages in this process are business, marketing, strategy, finance, planning.
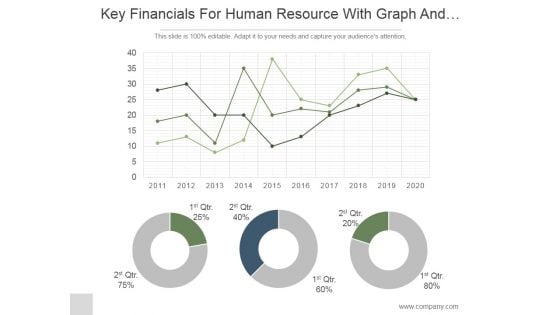
Key Financials For Human Resource With Graph And Pie Chart Ppt PowerPoint Presentation Ideas
This is a key financials for human resource with graph and pie chart ppt powerpoint presentation ideas. This is a three stage process. The stages in this process are business, strategy, marketing, analysis, donut, growth.
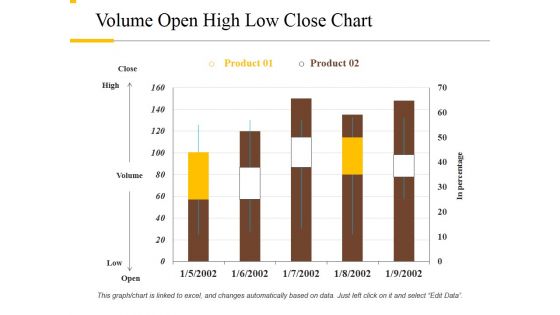
Volume Open High Low Close Chart Ppt PowerPoint Presentation Layouts Background Image
This is a volume open high low close chart ppt powerpoint presentation layouts background image. This is a two stage process. The stages in this process are close, high, volume, low, open.
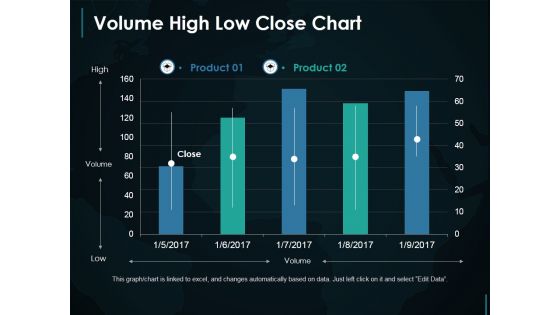
Volume High Low Close Chart Ppt PowerPoint Presentation Slides Example File
This is a volume high low close chart ppt powerpoint presentation slides example file. This is a two stage process. The stages in this process are high, volume, low.
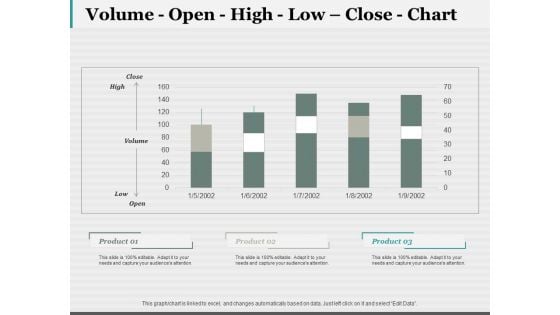
Volume Open High Low Close Chart Ppt PowerPoint Presentation Pictures Tips
This is a volume open high low close chart ppt powerpoint presentation pictures tips. This is a three stage process. The stages in this process are high, volume, low, open, business.
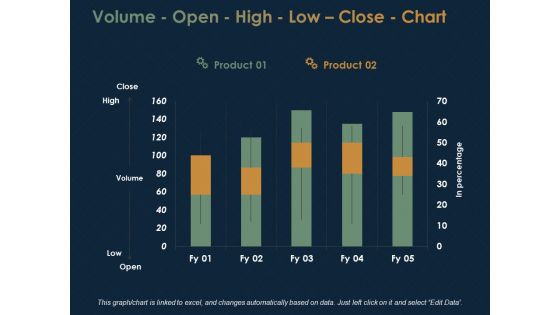
Volume Open High Low Close Chart Finance Ppt PowerPoint Presentation Gallery Graphic Tips
This is a volume open high low close chart finance ppt powerpoint presentation gallery graphic tips. This is a two stage process. The stages in this process are finance, analysis, business, investment, marketing.
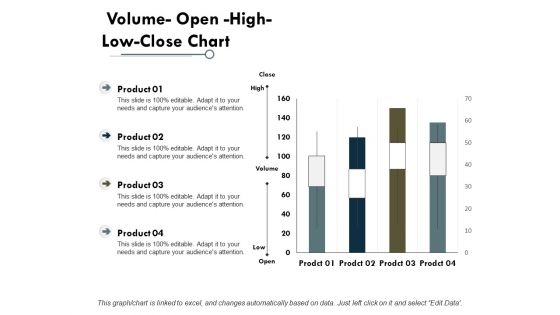
Volume Open High Low Close Chart Finance Ppt PowerPoint Presentation Professional Background Image
This is a volume open high low close chart finance ppt powerpoint presentation professional background image. This is a four stage process. The stages in this process are finance, analysis, business, investment, marketing.
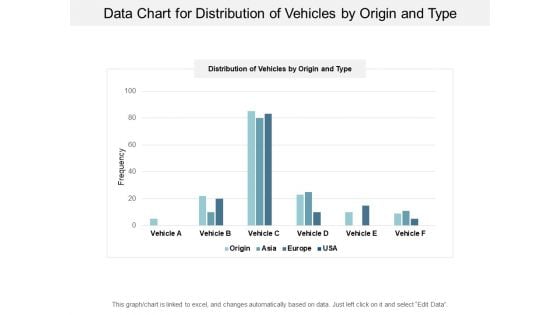
Data Chart For Distribution Of Vehicles By Origin And Type Ppt PowerPoint Presentation Infographics Topics
This is a data chart for distribution of vehicles by origin and type ppt powerpoint presentation infographics topics. This is a four stage process. The stages in this process are financial analysis, quantitative, statistical modelling.
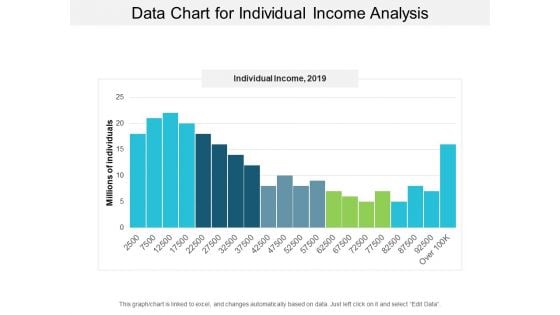
Data Chart For Individual Income Analysis Ppt PowerPoint Presentation Layouts Visual Aids
This is a data chart for individual income analysis ppt powerpoint presentation layouts visual aids. This is a five stage process. The stages in this process are financial analysis, quantitative, statistical modelling.
Business Workflow Chart With Purpose Statement Ppt PowerPoint Presentation Icon Backgrounds PDF
Presenting this set of slides with name business workflow chart with purpose statement ppt powerpoint presentation icon backgrounds pdf. This is a three stage process. The stages in this process are purpose statement, process input, process output. This is a completely editable PowerPoint presentation and is available for immediate download. Download now and impress your audience.
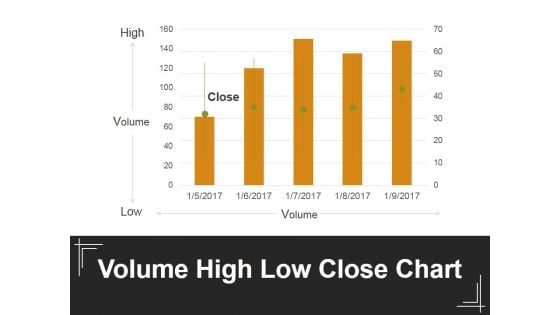
Volume High Low Close Chart Ppt PowerPoint Presentation Ideas Background Images
This is a volume high low close chart ppt powerpoint presentation ideas background images. This is a five stage process. The stages in this process are volume, high, low, close.
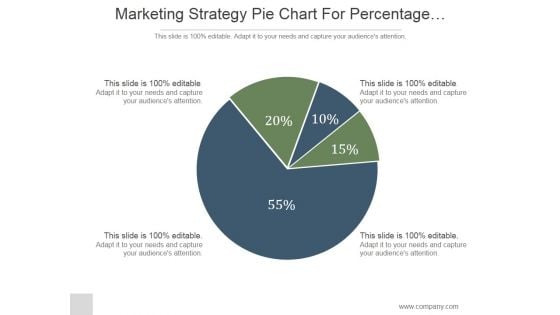
Marketing Strategy Pie Chart For Percentage Comparison Ppt PowerPoint Presentation Ideas
This is a marketing strategy pie chart for percentage comparison ppt powerpoint presentation ideas. This is a four stage process. The stages in this process are marketing, pie, strategy, finance, percentage.
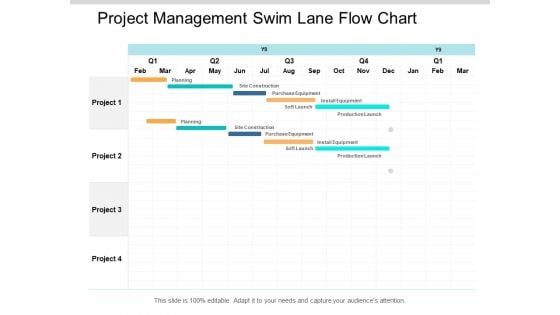
Project Management Swim Lane Flow Chart Ppt PowerPoint Presentation Pictures Brochure
This is a project management swim lane flow chart ppt powerpoint presentation pictures brochure. This is a four stage process. The stages in this process are swim lane diagram, flowchart, management.
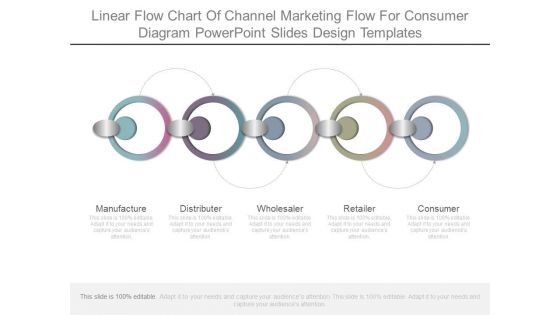
Linear Flow Chart Of Channel Marketing Flow For Consumer Diagram Powerpoint Slides Design Templates
This is a linear flow chart of channel marketing flow for consumer diagram powerpoint slides design templates. This is a five stage process. The stages in this process are manufacture, distributor, wholesaler, retailer, consumer.
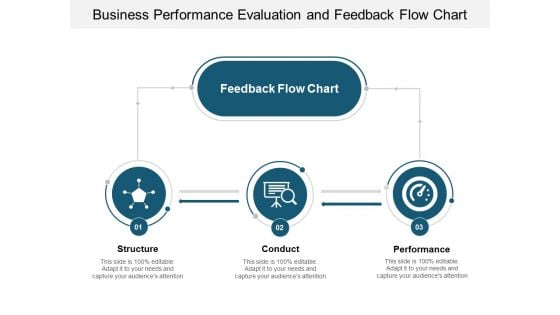
Business Performance Evaluation And Feedback Flow Chart Ppt Powerpoint Presentation Model Example Topics
This is a business performance evaluation and feedback flow chart ppt powerpoint presentation model example topics. This is a three stage process. The stages in this process are performance management, structure conduct performance, performance review and analysis.
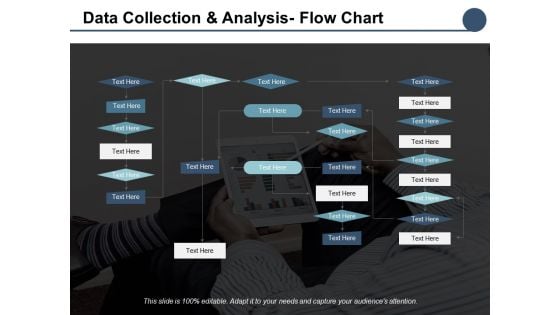
Data Collection And Analysis Flow Chart Ppt PowerPoint Presentation Outline Graphics
This is a data collection and analysis flow chart ppt powerpoint presentation outline graphics. This is a five stage process. The stages in this process are business, management, planning, strategy, marketing.
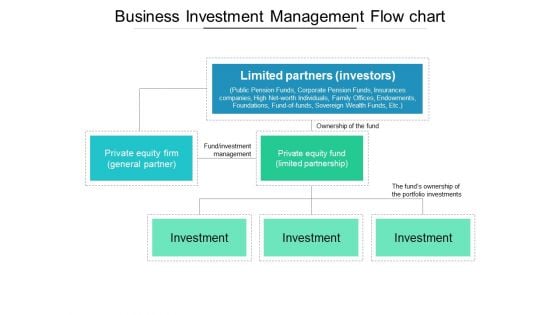
Business Investment Management Flow Chart Ppt PowerPoint Presentation Outline Example Topics
This is a business investment management flow chart ppt powerpoint presentation outline example topics. This is a three stage process. The stages in this process are investment, funding, private equity, venture capital.
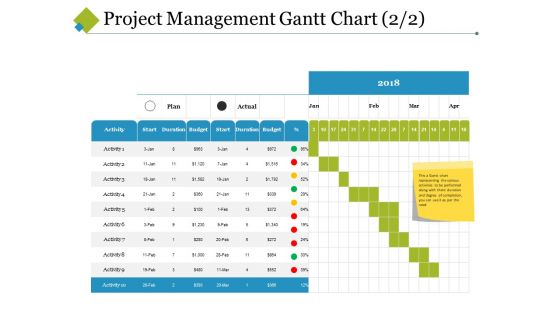
Project Management Gantt Chart Template 2 Ppt PowerPoint Presentation Model Slide Download
This is a project management gantt chart template 2 ppt powerpoint presentation model slide download. This is a nine stage process. The stages in this process are start, duration, budget, activity, plan.
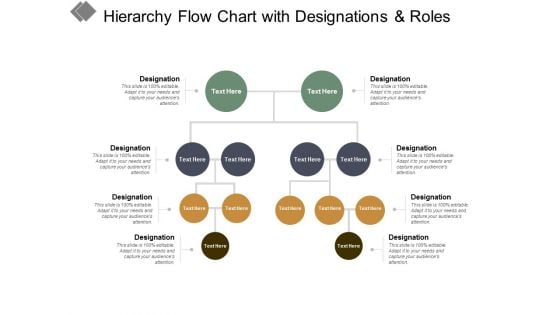
Hierarchy Flow Chart With Designations And Roles Ppt PowerPoint Presentation Styles Format Ideas
This is a hierarchy flow chart with designations and roles ppt powerpoint presentation styles format ideas. This is a four stage process. The stages in this process are business ownership, family business, owned business.
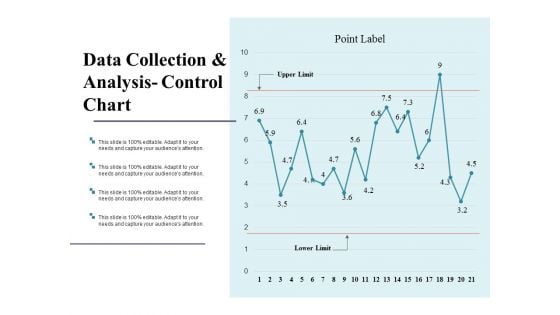
Data Collection And Analysis Control Chart Ppt PowerPoint Presentation Model Backgrounds
This is a data collection and analysis control chart ppt powerpoint presentation model backgrounds. This is a two stage process. The stages in this process are business, marketing, strategy, finance, analysis.
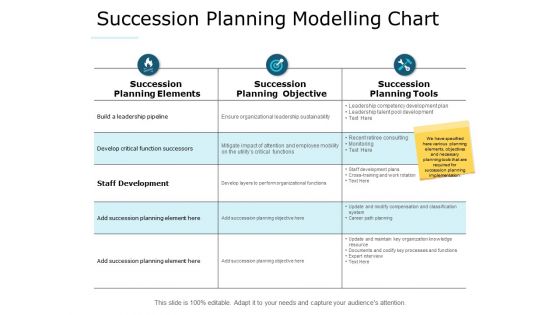
Succession Planning Modelling Chart Ppt PowerPoint Presentation Visual Aids Background Images
This is a succession planning modelling chart ppt powerpoint presentation visual aids background images. This is a three stage process. The stages in this process are compare, marketing, business, management, planning.
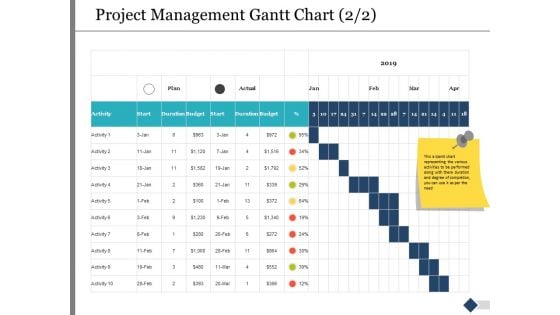
Project Management Gantt Chart Activity Ppt PowerPoint Presentation Model Background Designs
This is a project management gantt chart activity ppt powerpoint presentation model background designs. This is a three stage process. The stages in this process are marketing, business, management, compare.
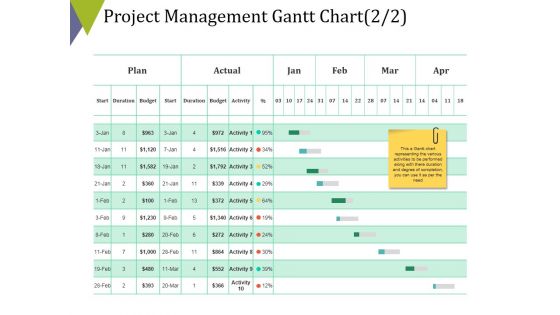
Project Management Gantt Chart Template 2 Ppt PowerPoint Presentation Pictures Model
This is a project management gantt chart template 2 ppt powerpoint presentation pictures model. This is a four stage process. The stages in this process are table, business, strategy, compare, marketing.
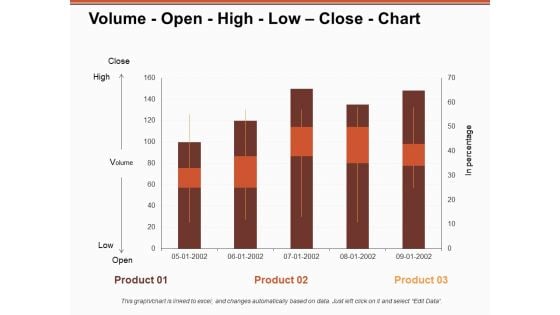
Volume Open High Low Close Chart Ppt PowerPoint Presentation Model Inspiration
This is a volume open high low close chart ppt powerpoint presentation model inspiration. This is a three stage process. The stages in this process are business, management, strategy, marketing, sales.
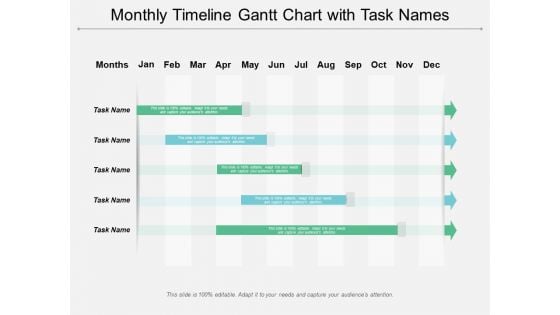
Monthly Timeline Gantt Chart With Task Names Ppt PowerPoint Presentation File Ideas
This is a monthly timeline gantt chart with task names ppt powerpoint presentation file ideas. This is a twelve stage process. The stages in this process are agenda, schedule, timetable.
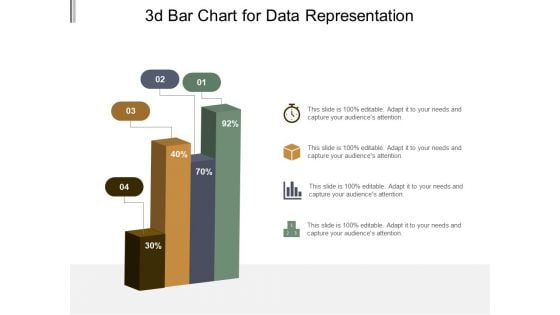
3D Bar Chart For Data Representation Ppt PowerPoint Presentation Model Graphic Tips
This is a 3d bar chart for data representation ppt powerpoint presentation model graphic tips. This is a four stage process. The stages in this process are art, colouring, paint brush.
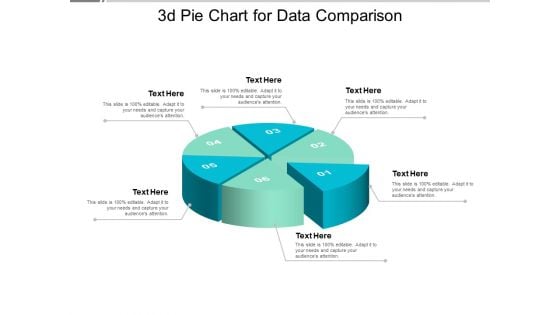
3D Pie Chart For Data Comparison Ppt PowerPoint Presentation Model Design Ideas
This is a 3d pie chart for data comparison ppt powerpoint presentation model design ideas. This is a six stage process. The stages in this process are art, colouring, paint brush.
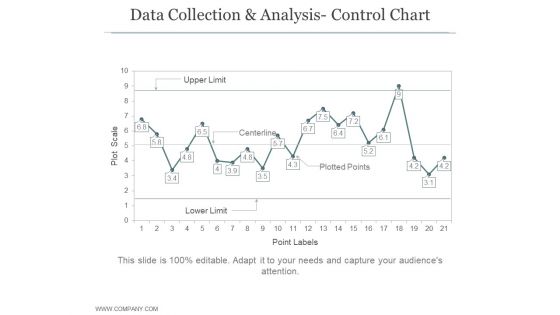
Data Collection And Analysis Control Chart Ppt PowerPoint Presentation Example File
This is a data collection and analysis control chart ppt powerpoint presentation example file. This is a four stage process. The stages in this process are business, strategy, marketing, bar graph, growth strategy.
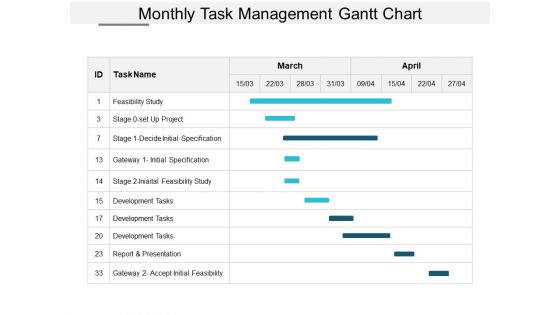
Monthly Task Management Gantt Chart Ppt Powerpoint Presentation Outline Example File
This is a monthly task management gantt chart ppt powerpoint presentation outline example file. This is a three stage process. The stages in this process are new product development, new product launch, introducing new product.
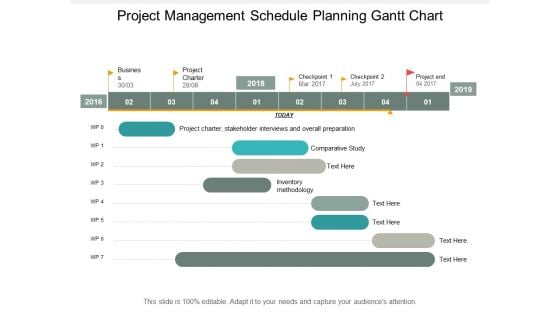
Project Management Schedule Planning Gantt Chart Ppt PowerPoint Presentation Outline Graphics Design
This is a project management schedule planning gantt chart ppt powerpoint presentation outline graphics design. This is a eight stage process. The stages in this process are work package timeline, work package roadmap, tasks package timelines.

Effectiveness Of Teamwork Team With Gears And Bar Chart Ppt Powerpoint Presentation Ideas Information
This is a effectiveness of teamwork team with gears and bar chart ppt powerpoint presentation ideas information. This is a four stage process. The stages in this process are team performance, member performance, group performance.
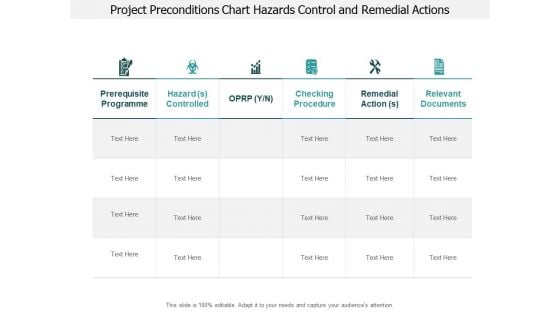
Project Preconditions Chart Hazards Control And Remedial Actions Ppt PowerPoint Presentation Pictures Show
This is a project preconditions chart hazards control and remedial actions ppt powerpoint presentation pictures show. This is a six stage process. The stages in this process are need, requirement, prerequisite.
Experimental Control Pie Chart With Dollar Symbol Ppt Powerpoint Presentation Infographics Background Images
This is a experimental control pie chart with dollar symbol ppt powerpoint presentation infographics background images. This is a four stage process. The stages in this process are exploratory, experimental, investigational.
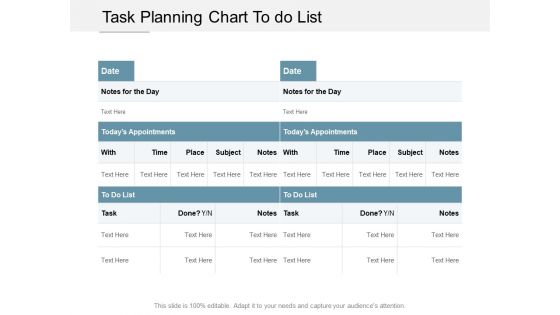
Task Planning Chart To Do List Ppt PowerPoint Presentation Infographics Picture Cpb
This is a task planning chart to do list ppt powerpoint presentation infographics picture cpb. This is a three stage process. The stages in this process are key activities, key highlights, list of activities.
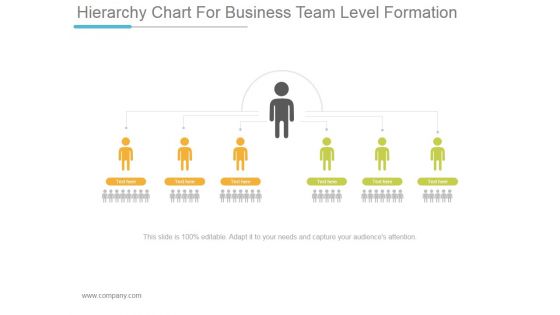
Hierarchy Chart For Business Team Level Formation Ppt PowerPoint Presentation Files
This is a hierarchy chart for business team level formation ppt powerpoint presentation files. This is a six stage process. The stages in this process are business, strategy, marketing, management, communication.
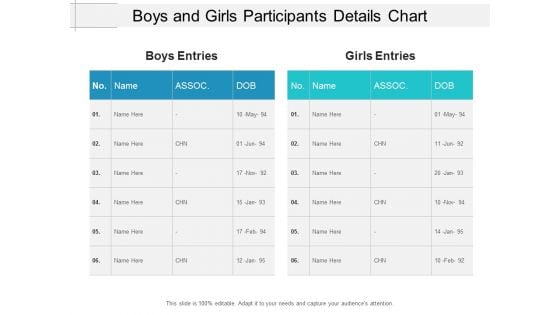
Boys And Girls Participants Details Chart Ppt Powerpoint Presentation Portfolio Layout Ideas
This is a boys and girls participants details chart ppt powerpoint presentation portfolio layout ideas. This is a two stage process. The stages in this process are list of participants, list of members, list of contributors.
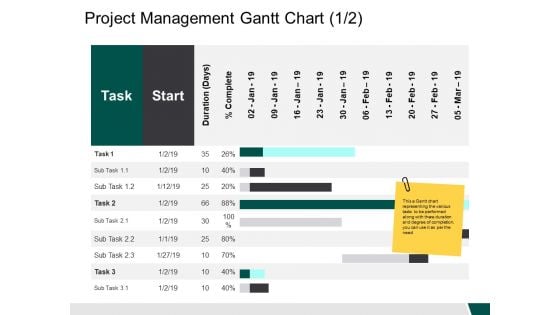
Project Management Gantt Chart Start Ppt PowerPoint Presentation Outline Example Introduction
This is a project management gantt chart start ppt powerpoint presentation outline example introduction. This is a two stage process. The stages in this process are business, management, strategy, analysis, marketing.
Gantt Chart For Task Planning And Management Ppt PowerPoint Presentation Icon Mockup
This is a gantt chart for task planning and management ppt powerpoint presentation icon mockup. This is a three stage process. The stages in this process are project management software, project management tools, project management techniques.
Clustered Bar Chart Yearly Operating Plan Ppt PowerPoint Presentation Styles Icon
This is a clustered bar chart yearly operating plan ppt powerpoint presentation styles icon. This is a four stage process. The stages in this process are business, management, strategy, analysis, marketing.
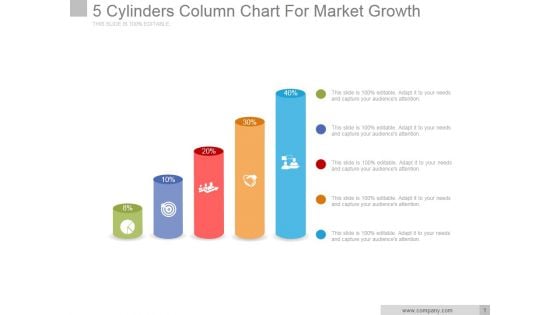
5 Cylinders Column Chart For Market Growth Ppt PowerPoint Presentation Outline
This is a 5 cylinders column chart for market growth ppt powerpoint presentation outline. This is a five stage process. The stages in this process are business, marketing, icons, growth, finance.
Sample Ppt Organization Chart Icons Slide Business Ppt Powerpoint Presentation Layouts Layouts
This is a sample ppt organization chart icons slide business ppt powerpoint presentation layouts layouts. This is a six stage process. The stages in this process are business, management, planning, strategy, marketing.

Task Management Chart With Status Priority Due Date Ppt PowerPoint Presentation Slides Format Ideas Cpb
This is a task management chart with status priority due date ppt powerpoint presentation slides format ideas cpb. This is a six stage process. The stages in this process are key activities, key highlights, list of activities.
Demonstration Icon Man Showing Bar Chart Ppt Powerpoint Presentation Styles Ideas
This is a demonstration icon man showing bar chart ppt powerpoint presentation styles ideas. This is a three stage process. The stages in this process are illustration, show, demo.
Product Features Comparison Chart With Icons Ppt Powerpoint Presentation Portfolio Diagrams
This is a product features comparison chart with icons ppt powerpoint presentation portfolio diagrams. This is a four stage process. The stages in this process are product differentiation, product comparison, brand differentiation.
Workload Management Chart With Employee Name And Activity Ppt PowerPoint Presentation Icon
This is a workload management chart with employee name and activity ppt powerpoint presentation icon. This is a eight stage process. The stages in this process are activity tracker, business, marketing.
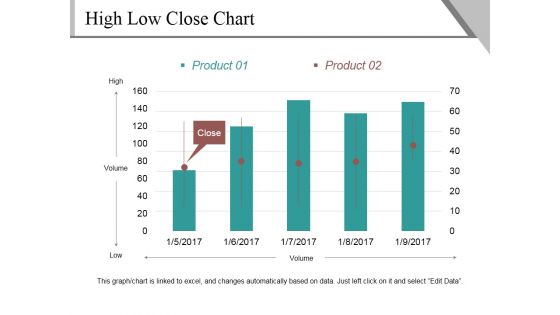
High Low Close Chart Template 2 Ppt PowerPoint Presentation Outline Show
This is a high low close chart template 2 ppt powerpoint presentation outline show. This is a five stage process. The stages in this process are high, volume, low, close, product.


 Continue with Email

 Home
Home


