Process Diagram
File Sharing Between Mobile And Desktop Vector Icon Ppt PowerPoint Presentation Diagram Ppt PDF
Presenting this set of slides with name file sharing between mobile and desktop vector icon ppt powerpoint presentation diagram ppt pdf. This is a three stage process. The stages in this process are sharing between mobile and desktop vector icon. This is a completely editable PowerPoint presentation and is available for immediate download. Download now and impress your audience.

Business Activity Flows Optimization Introduction Ppt PowerPoint Presentation Diagram Templates PDF
Presenting this set of slides with name business activity flows optimization introduction ppt powerpoint presentation diagram templates pdf. This is a three stage process. The stages in this process are enterprise, resource, planning, business, material, effective application and optimization resources. This is a completely editable PowerPoint presentation and is available for immediate download. Download now and impress your audience.
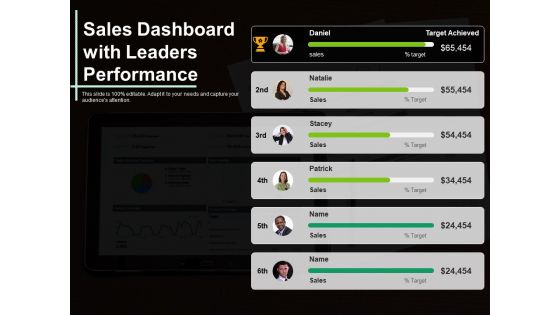
Sales Dashboard With Leaders Performance Ppt PowerPoint Presentation Diagram Ppt PDF
Presenting this set of slides with name sales dashboard with leaders performance ppt powerpoint presentation diagram ppt pdf. This is a five stage process. The stages in this process are sales, target achieved, leaders, performance. This is a completely editable PowerPoint presentation and is available for immediate download. Download now and impress your audience.

Prioritization Techniques For Software Development And Testing KANO Prioritization Technique Diagram Formats PDF
Presenting this set of slides with name prioritization techniques for software development and testing kano prioritization technique diagram formats pdf. This is a four stage process. The stages in this process are customer satisfaction, no implementation, full implementation, customer dissatisfaction. This is a completely editable PowerPoint presentation and is available for immediate download. Download now and impress your audience.
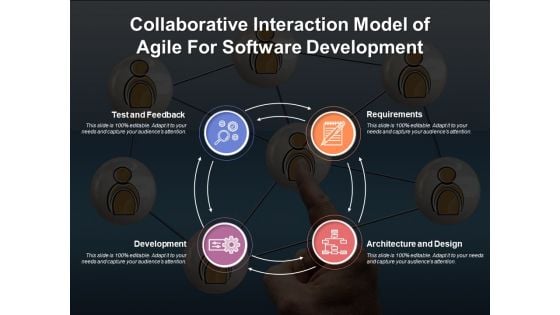
Collaborative Interaction Model Of Agile For Software Development Ppt PowerPoint Presentation Diagram Templates PDF
Presenting this set of slides with name collaborative interaction model of agile for software development ppt powerpoint presentation diagram templates pdf. This is a four stage process. The stages in this process are development, architecture and design, requirements. This is a completely editable PowerPoint presentation and is available for immediate download. Download now and impress your audience.
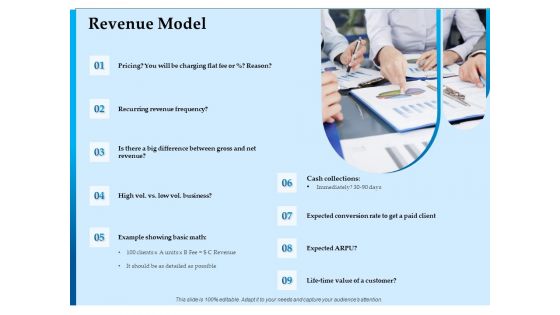
Corporate Fundraising Ideas And Strategies Revenue Model Ppt Diagram Lists PDF
Presenting this set of slides with name corporate fundraising ideas and strategies revenue model ppt diagram lists pdf. This is a nine stage process. The stages in this process are business, revenue, frequency, gross, value. This is a completely editable PowerPoint presentation and is available for immediate download. Download now and impress your audience.
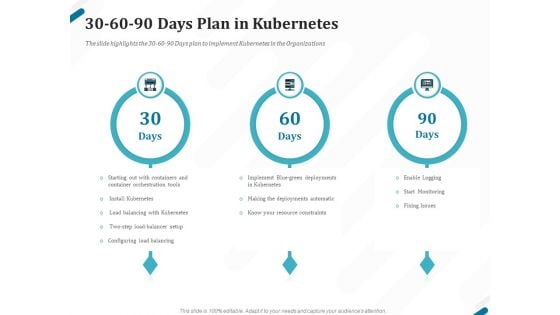
Kubernetes Containers Architecture Overview 30 60 90 Days Plan In Kubernetes Ppt Diagram Images PDF
Presenting this set of slides with name kubernetes containers architecture overview 30 60 90 days plan in kubernetes ppt diagram images pdf. This is a three stage process. The stages in this process are 30 60 90 days plan. This is a completely editable PowerPoint presentation and is available for immediate download. Download now and impress your audience.

E Commerce Table Of Contents Ppt PowerPoint Presentation Diagram Templates PDF
Presenting this set of slides with name e commerce table of contents ppt powerpoint presentation diagram templates pdf. This is a seven stage process. The stages in this process are introduction, strategy and applications, business models, revenue model, payment methodologies, implementation, kpis and dashboard. This is a completely editable PowerPoint presentation and is available for immediate download. Download now and impress your audience.

Global Market Segmentation Our Mission Ppt PowerPoint Presentation Diagram Lists PDF
Presenting this set of slides with name global market segmentation our mission ppt powerpoint presentation diagram lists pdf. This is a three stage process. The stages in this process are mission, vision, goal. This is a completely editable PowerPoint presentation and is available for immediate download. Download now and impress your audience.
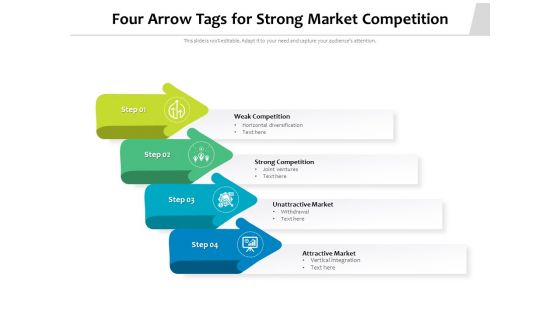
Four Arrow Tags For Strong Market Competition Ppt PowerPoint Presentation Diagram Templates PDF
Presenting this set of slides with name four arrow tags for strong market competition ppt powerpoint presentation diagram templates pdf. This is a four stage process. The stages in this process are weak competition, strong competition, unattractive market, attractive market. This is a completely editable PowerPoint presentation and is available for immediate download. Download now and impress your audience.
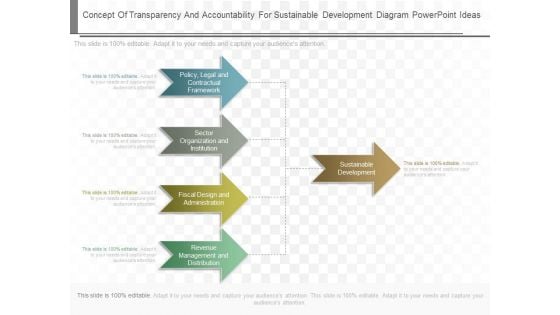
Concept Of Transparency And Accountability For Sustainable Development Diagram Powerpoint Ideas
This is a concept of transparency and accountability for sustainable development diagram powerpoint ideas. This is a five stage process. The stages in this process are policy legal and contractual framework, sector organization and institution, fiscal design and administration, revenue management and distribution, sustainable development.
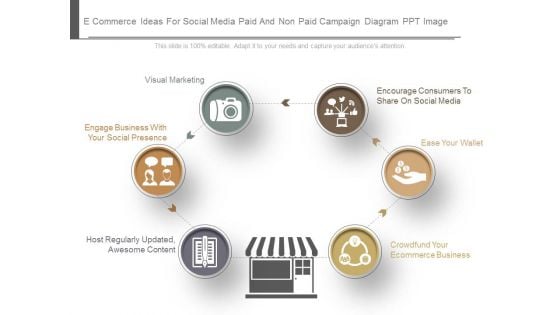
E Commerce Ideas For Social Media Paid And Non Paid Campaign Diagram Ppt Images
This is a e commerce ideas for social media paid and non paid campaign diagram ppt images. This is a six stage process. The stages in this process are visual marketing, engage business with your social presence, host regularly updated awesome content, encourage consumers to share on social media, ease your wallet, crowdfund your ecommerce business.
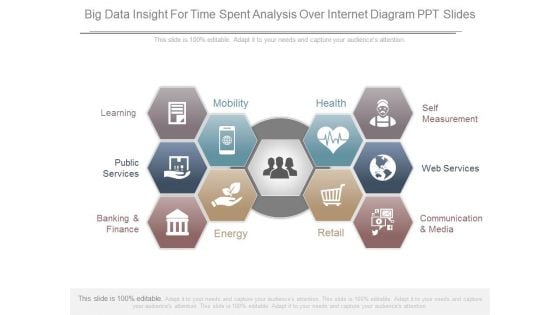
Big Data Insight For Time Spent Analysis Over Internet Diagram Ppt Slides
This is a big data insight for time spent analysis over internet diagram ppt slides. This is a ten stage process. The stages in this process are learning, public services, banking and finance, energy, mobility, health, retail, communication and media, web services, self measurement.

Emerging Technologies For Boosting Operational Productivity Ppt PowerPoint Presentation Diagram Lists PDF
Presenting this set of slides with name emerging technologies for boosting operational productivity ppt powerpoint presentation diagram lists pdf. This is a four stage process. The stages in this process are internet of things, augmented reality, big data analytics, algorithm. This is a completely editable PowerPoint presentation and is available for immediate download. Download now and impress your audience.
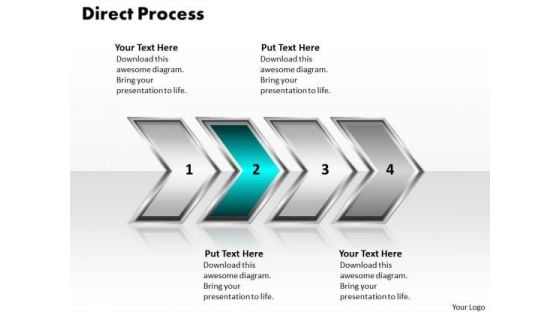
Ppt Direct Illustration Of Process Using 4 Power Point Stage PowerPoint Templates
PPT direct illustration of process using 4 power point stage PowerPoint Templates-This diagram helps you to analyze all the connected ideas and also can be used to show four aspects of an issue. This PowerPoint Linear process diagram is used to show interrelated ideas or concepts. This Illustrates the second step of the process. This diagram is useful in just about any type of presentation.-PPT direct illustration of process using 4 power point stage PowerPoint Templates-Aim, Arrow, Arrowheads, Badge, Border, Click, Connection, Curve, Design, Direction, Download, Element, Fuchsia, Icon, Illustration, Indicator, Internet, Magenta, Mark, Object, Orientation, Pointer, Shadow, Shape, Sign Achieve high-performance with our Ppt Direct Illustration Of Process Using 4 Power Point Stage PowerPoint Templates. They will make you look good.
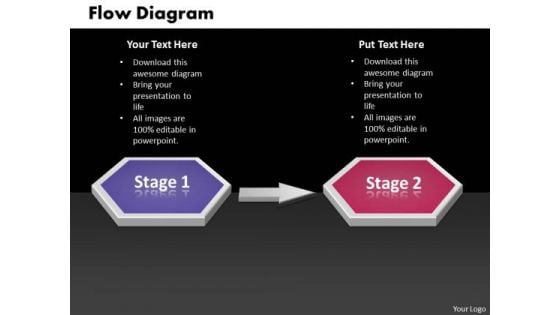
Ppt 3d Linear Work Flow Swim Lane Diagram PowerPoint Template Templates
PPT 3d linear work flow swim lane diagram powerpoint template Templates-This 3D Business PowerPoint Diagram Displays the circular arrows connected to each other signifying the continuous flow of steps to be executed. This Diagram can be used to represent Process charts, Business chart, Sales process chart and Finance process etc.-PPT 3d linear work flow swim lane diagram powerpoint template Templates-Abstract, Action, Attention, Business, Chart, Clipart, Commerce, Concept, Conceptual, Corporate, Customer, Design, Desire, Diagram, Flow, Goals, Guide, Icon, Idea, Illustration, Interest, Manage, Management, Map, Marketing, Mind, Mission, Model, Organization, Performance, Planning, Plans, Process Set an example with your views. Place the bar with our Ppt 3d Linear Work Flow Swim Lane Diagram PowerPoint Template Templates.
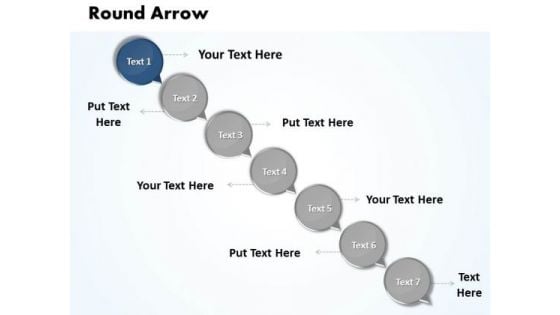
Ppt Connections Travel Text Circles 7 Steps Working With Slide Numbers Diagram PowerPoint Templates
PPT connections travel text circles 7 steps working with slide numbers diagram PowerPoint Templates-This Business Oriented Chart will definitely help you to be more Successful. Use this graphics as key element in streamlining your plans. It consists of Circular Bubbles connected together to form a complete process. This diagram is suitable for business and technical professionals who need to quickly and easily visualize, explore, and communicate information. -PPT connections travel text circles 7 steps working with slide numbers diagram PowerPoint Templates-Add, Aqua, Arrows, Badges, Bar, Blend, Blue, Bright, Bubbles, Buttons, Caution, Circle, Drop, Elements, Glossy, Glowing, Graphic, Heart, Help, Icons, Idea, Illustration, Navigation, Oblong, Plus, Round, Service, Shadow, Shiny, Sign, Speech, Squares Our Ppt Connections Travel Text Circles 7 Steps Working With Slide Numbers Diagram PowerPoint Templates team are an enduring lot. The further the distance, the better they become.
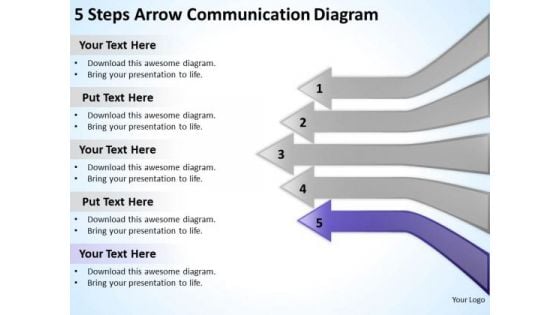
5 Steps Arrow Communication Diagram Ppt Non Profit Business Plan PowerPoint Templates
We present our 5 steps arrow communication diagram ppt non profit business plan PowerPoint templates.Download our Process and Flows PowerPoint Templates because You can Connect the dots. Fan expectations as the whole picture emerges. Download our Flow charts PowerPoint Templates because our PowerPoint Templates and Slides are the string of your bow. Fire of your ideas and conquer the podium. Download our Arrows PowerPoint Templates because It can Conjure up grand ideas with our magical PowerPoint Templates and Slides. Leave everyone awestruck by the end of your presentation. Download and present our Marketing PowerPoint Templates because Our PowerPoint Templates and Slides will provide you the cutting edge. Slice through the doubts in the minds of your listeners. Present our Shapes PowerPoint Templates because You can Rise to the occasion with our PowerPoint Templates and Slides. You will bring your audience on their feet in no time.Use these PowerPoint slides for presentations relating to Business, button, chart, communication, concept, conceptual, design, diagram, direction, elements, flow, future, graph, graphic, icon, illustration, internet, network, object, pictogram, process, simple, structure, symbol, technology, arrows flow, process, steps. The prominent colors used in the PowerPoint template are Purple, Gray, White. You can be sure our 5 steps arrow communication diagram ppt non profit business plan PowerPoint templates are the best it can get when it comes to presenting. You can be sure our communication PowerPoint templates and PPT Slides will make you look like a winner. Professionals tell us our 5 steps arrow communication diagram ppt non profit business plan PowerPoint templates are designed by professionals Presenters tell us our design PowerPoint templates and PPT Slides will impress their bosses and teams. The feedback we get is that our 5 steps arrow communication diagram ppt non profit business plan PowerPoint templates are second to none. You can be sure our design PowerPoint templates and PPT Slides are designed by professionals Ferry your thoughts successfullyacross. Our 5 Steps Arrow Communication Diagram Ppt Non Profit Business Plan PowerPoint Templates will be your boatman.
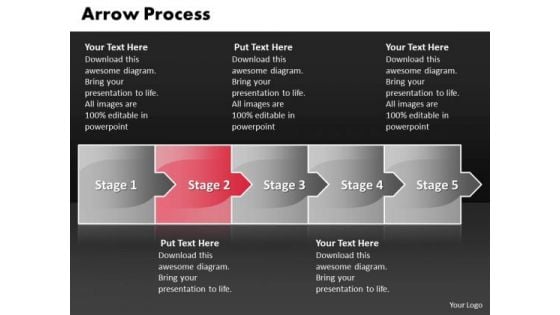
Marketing Ppt Template Arrow Process 5 Stages Business Strategy PowerPoint 3 Design
marketing PPT template arrow Process 5 stages business strategy powerpoint 3 design-This arrow process diagram allows managers to configure critical deviation alerts for any metric and provides real-time dashboards for a quick overview of the current situation. Organize your thoughts and Troubleshoot problems with our Marketing Ppt Template Arrow Process 5 Stages Business Strategy PowerPoint 3 Design. Download without worries with our money back guaranteee.

Business Diagram Cloud Computing Stack Showing Layers From Storage To Application Presentation Templ
This diagram contains cloud computing stack showing layers from storage to application. This text boxes diagram is designed to depict application, middleware, database, Operating System, virtual machine, servers and storage. Make a wonderful presentation with this innovative diagram
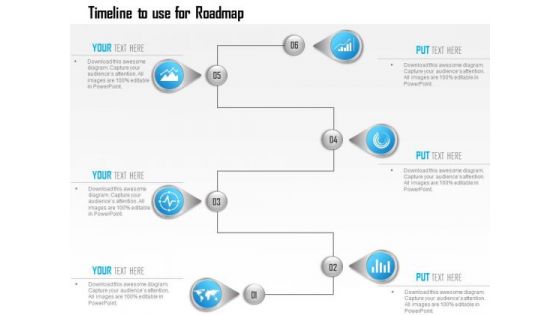
Business Diagram Infographic Template Showing Timeline To Use For Roadmap Ppt Slide
This business diagram has been designed with graphic of info graphics template. This diagram slide displays the concept of making business timeline with roadmap. Use this diagram for your business and marketing related presentations.
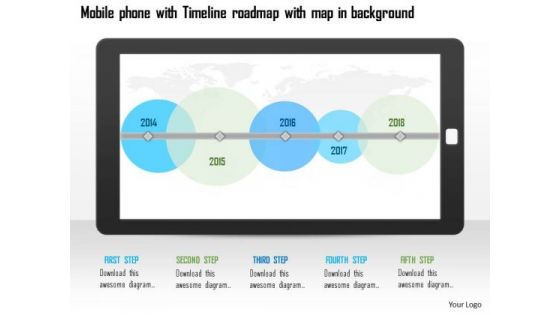
Business Diagram Moblie Phone With Timeline Roadmap With Map In Background Ppt Slide
This technology diagram has been designed with graphic of mobile phone and map. This diagram may be used to display the concept of technology and timeline. Display information in convincing manner this exclusive diagram.
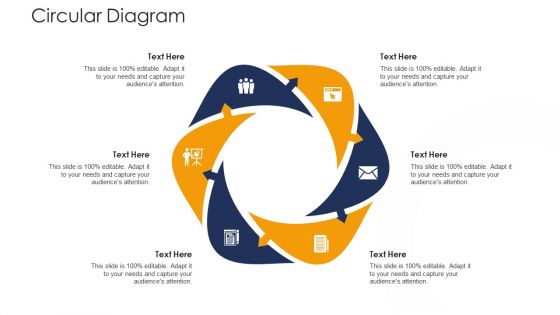
Strategies To Tackle Operational Risk In Banking Institutions Circular Diagram Pictures PDF
Presenting strategies to tackle in banking institutions need for operational risk management framework portrait pdf to provide visual cues and insights. Share and navigate important information on six stages that need your due attention. This template can be used to pitch topics like circular diagram. In addtion, this PPT design contains high resolution images, graphics, etc, that are easily editable and available for immediate download.
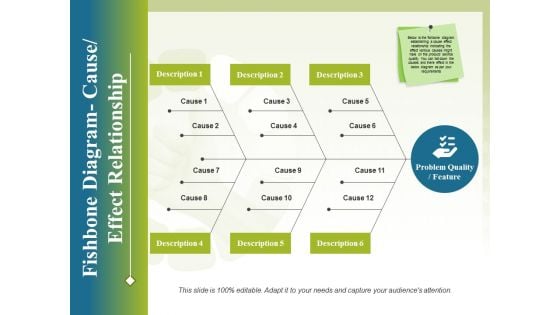
Fishbone Diagram Cause Effect Relationship Ppt PowerPoint Presentation Styles Design Inspiration
This is a fishbone diagram cause effect relationship ppt powerpoint presentation styles design inspiration. This is a three stage process. The stages in this process are business, process, analysis, strategy, management.
Mail With Cross Symbol Vector Icon Ppt PowerPoint Presentation Diagram Graph Charts PDF
Presenting this set of slides with name mail with cross symbol vector icon ppt powerpoint presentation diagram graph charts pdf. This is a three stage process. The stages in this process are mail with cross symbol vector icon. This is a completely editable PowerPoint presentation and is available for immediate download. Download now and impress your audience.
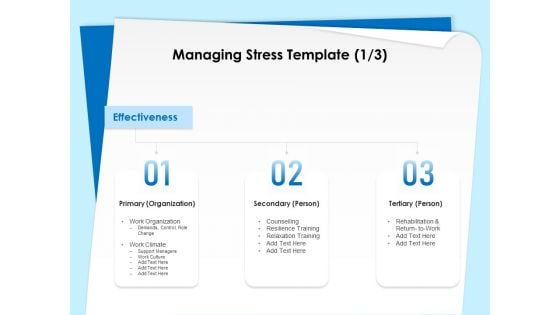
Executive Leadership Programs Managing Stress Template Primary Ppt PowerPoint Presentation Diagram Graph Charts PDF
Presenting this set of slides with name executive leadership programs managing stress template primary ppt powerpoint presentation diagram graph charts pdf. This is a three stage process. The stages in this process are primary organization, secondary person, tertiary person, work organization, resilience training, relaxation training. This is a completely editable PowerPoint presentation and is available for immediate download. Download now and impress your audience.
Marketing Funnel Icon With Dollar Symbol Ppt PowerPoint Presentation Diagram Graph Charts PDF
Presenting this set of slides with name marketing funnel icon with dollar symbol ppt powerpoint presentation diagram graph charts pdf. This is a three stage process. The stages in this process are marketing funnel icon with dollar symbol. This is a completely editable PowerPoint presentation and is available for immediate download. Download now and impress your audience.
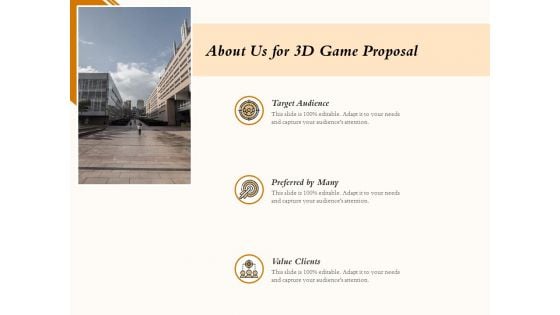
Three Dimensional Games Proposal About Us For 3D Game Proposal Target Ppt Diagram Graph Charts PDF
Presenting this set of slides with name three dimensional games proposal about us for 3d game proposal target ppt diagram graph charts pdf. This is a two stage process. The stages in this process are vision, mission, core values. This is a completely editable PowerPoint presentation and is available for immediate download. Download now and impress your audience.
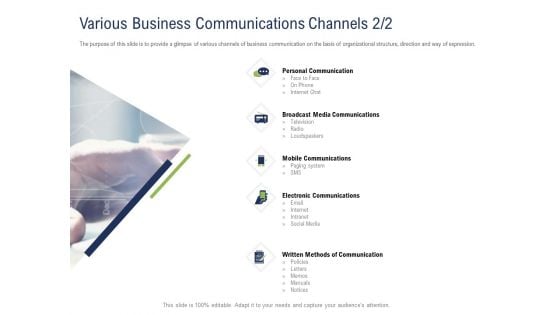
Incremental Decision Making Various Business Communications Channels Media Ppt Diagram Graph Charts PDF
Presenting this set of slides with name incremental decision making various business communications channels media ppt diagram graph charts pdf. This is a five stage process. The stages in this process are communication, broadcast media, mobile, electronic. This is a completely editable PowerPoint presentation and is available for immediate download. Download now and impress your audience.

Lady Plucking Flowers From Agriculture Farm Ppt PowerPoint Presentation Diagram Graph Charts PDF
Presenting this set of slides with name lady plucking flowers from agriculture farm ppt powerpoint presentation diagram graph charts pdf. This is a one stage process. The stage in this process is lady plucking flowers from agriculture farm. This is a completely editable PowerPoint presentation and is available for immediate download. Download now and impress your audience.
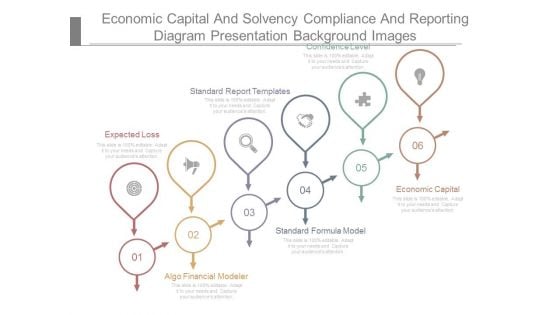
Economic Capital And Solvency Compliance And Reporting Diagram Presentation Background Images
This is a economic capital and solvency compliance and reporting diagram presentation background images. This is a six stage process. The stages in this process are confidence level, standard report templates, expected loss, algo financial modeler, standard formula model, economic capital.
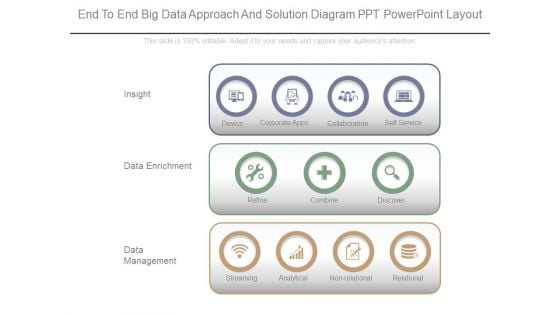
End To End Big Data Approach And Solution Diagram Ppt Powerpoint Layout
This is a end to end big data approach and solution diagram ppt powerpoint layout. This is a three stage process. The stages in this process are insight, data enrichment, data management, device, corporate apps, collaboration, self service, refine, combine, discover, relational, non relational, analytical, streaming.
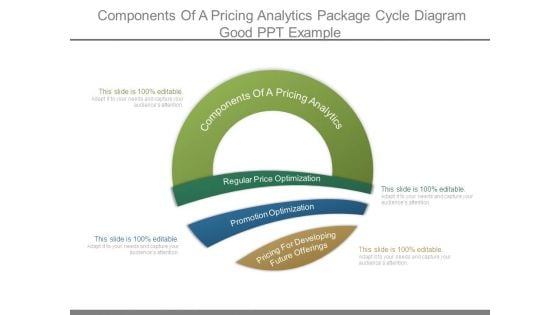
Components Of A Pricing Analytics Package Cycle Diagram Good Ppt Example
This is a components of a pricing analytics package cycle diagram good ppt example. This is a four stage process. The stages in this process are components of a pricing analytics, regular price optimization, promotion optimization, pricing for developing future offerings.
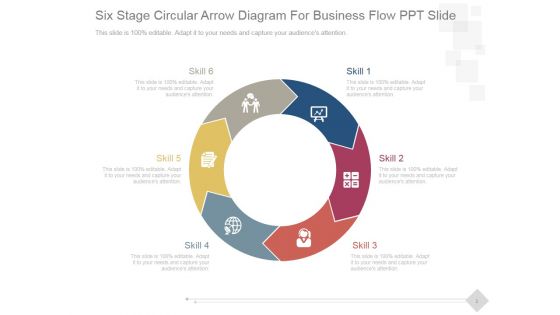
Six Stage Circular Arrow Diagram For Business Flow Ppt PowerPoint Presentation Example
This is a six stage circular arrow diagram for business flow ppt powerpoint presentation example. This is a six stage process. The stages in this process are skill, process, circle, icon, flow.
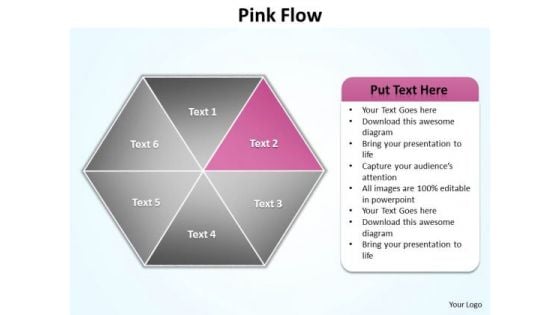
Ppt Pink Factor Hexagon Cause And Effect Diagram PowerPoint Template Editable Templates
PPT pink factor hexagon cause and effect diagram PowerPoint template editable Templates-The Diagram offers an excellent background to build up the various stages of your business process. This PowerPoint Process Chart shows the seven Different Layers which are to be followed in any business. This Business Diagram can be used in Marketing, Banking, and Management etc. -PPT pink factor hexagon cause and effect diagram PowerPoint template editable Templates-attached, backgrounds, blue, cell, color, component, connect, connection, diagram, elements, geometric, graphic, group, hexagon, honeycomb, icon, illustration, intricacy, lines, link, map, mesh, model, network, science, shape, shiny, strategy, structure, symbol, teamwork, technology Dwell on your exploits with our Ppt Pink Factor Hexagon Cause And Effect Diagram PowerPoint Template Editable Templates. Bring out the courage of your actions.

Busines Diagram Five Staged Test Tubes For Science Based Values Representation Ppt Template
Five staged test tubes are used to design this business diagram. This business slide contains the concept of value representation based on scientific data. Ideas are best expressed easily with the help of this diagram slide
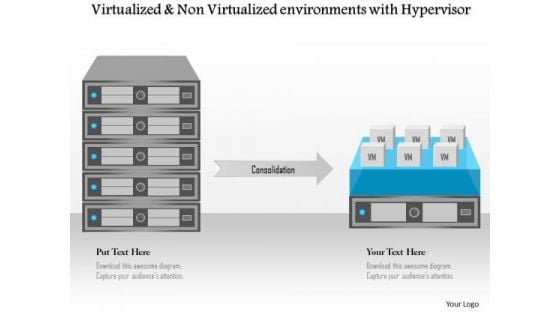
Business Diagram Virtualized And Non Vitualized Environments With Hypervisor Ppt Slide
Explain the concept of virtualized and non virtualized environments with hypervisor by using this unique diagram slide. This slide depicts the graphic of database server. This diagram may be used for networking and communication related presentations.
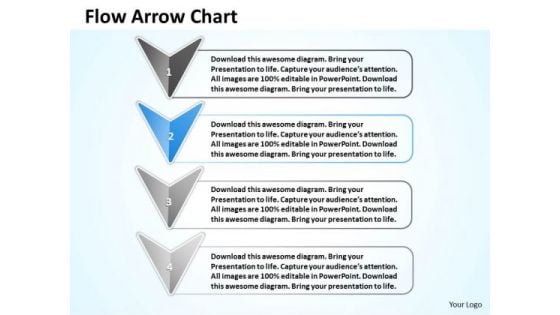
Ppt Stage 2 Continuous Demo Create Flow Chart PowerPoint Arrow Diagram Templates
PPT stage 2 continuous demo create flow chart powerpoint arrow diagram Templates-Use This Linearly Demonstrated PowerPoint Diagram having four steps displaying using arrow pointing towards south direction. It signifies the completion of the procedure and attaining success.-PPT stage 2 continuous demo create flow chart powerpoint arrow diagram Templates-3d, analyze, arrow, assess, background, bullet, business, chart, checkmark, chevron, diagram, drop, eps10, financial, glass, graphic, gray, icon, illustration, improvement, management, point, process, project, reflection, set, shadow, silver, stage, text, transparency, vector Give your team the family feel. Build alliances with our Ppt Stage 2 Continuous Demo Create Flow Chart PowerPoint Arrow Diagram Templates.
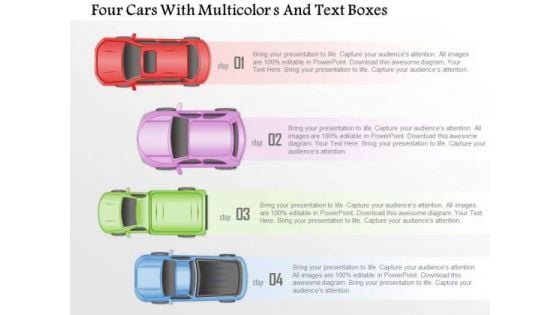
Busines Diagram Four Cars With Multicolors And Text Boxes Presentation Template
This business diagram contains graphics of four cars with multicolor and text boxes. This slide may be used to represent racing and competition in business presentations. Display process control in any presentations by using this innovative business slide.
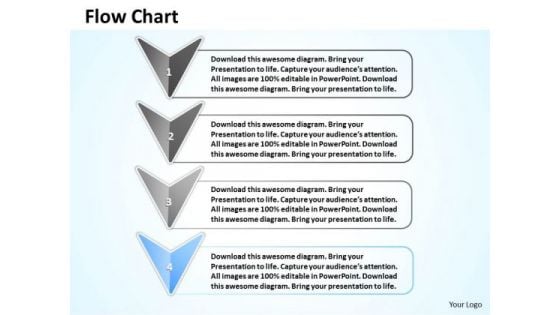
Ppt Stage 4 Continuous Flow Arrow Swim Lane Diagram PowerPoint Template Templates
PPT stage 4 continuous flow arrow swim lane diagram powerpoint template Templates-Use This Continuously Demonstrated PowerPoint Diagram having four steps displaying using arrow pointing towards south direction. It signifies the completion of the procedure and attaining success.-PPT stage 4 continuous flow arrow swim lane diagram powerpoint template Templates-3d, analyze, arrow, assess, background, bullet, business, chart, checkmark, chevron, diagram, drop, eps10, financial, glass, graphic, gray, icon, illustration, improvement, management, point, process, project, reflection, set, shadow, silver, stage, text, transparency, vector Demonstrate that your plan is not far fetched. Take them through it with our Ppt Stage 4 Continuous Flow Arrow Swim Lane Diagram PowerPoint Template Templates.
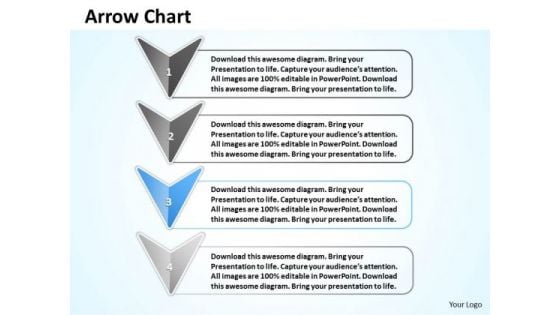
Ppt Stage 3 Continuous Flow Arrow Network Diagram PowerPoint Template Templates
PPT stage 3 continuous flow arrow network diagram powerpoint template Templates-Use This Sequentially Demonstrated PowerPoint Diagram having four steps displaying using arrow pointing towards south direction. It signifies the completion of the procedure and attaining success.-PPT stage 3 continuous flow arrow network diagram powerpoint template Templates-3d, analyze, arrow, assess, background, bullet, business, chart, checkmark, chevron, diagram, drop, eps10, financial, glass, graphic, gray, icon, illustration, improvement, management, point, process, project, reflection, set, shadow, silver, stage, text, transparency, vector Our Ppt Stage 3 Continuous Flow Arrow Network Diagram PowerPoint Template Templates have a festive effect. The audience will celebrate your ideas.
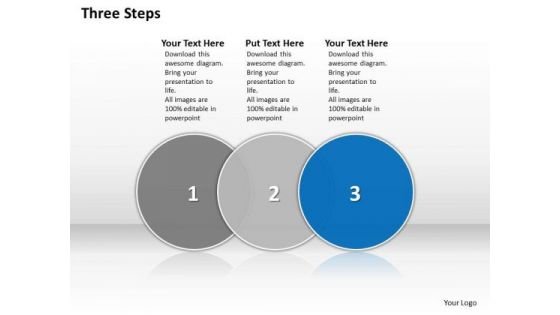
Ppt Circular Interpretation Of 3 State Diagram Describing Plan PowerPoint Templates
PPT circular interpretation of 3 state diagram describing plan PowerPoint Templates-The above template displays a diagram of three Circular text boxes attached in Horizontal manner. The Blue Circular Box Highlighted in the Diagram Implies that third stage is under processing. Use this diagram to make your Business PPT more attractive and interesting. Deliver this amazing presentation slide to mesmerize your audience. You can change color, size and orientation of any icon to your liking.-PPT circular interpretation of 3 state diagram describing plan PowerPoint Templates-3, Advice, Analysis, Analyze, Answer, Area, Career, Chart, Choice, Circles, Concept, Determination, Diagram, Graph, Idea, Illustration, Intersect, Measurement, Opportunities, Options, Overlap, Overlapped, Overlapping, Passion, Passionate, Prioritize, Priority, Profession Design exclusive presentations with our Ppt Circular Interpretation Of 3 State Diagram Describing Plan PowerPoint Templates. Dont waste time struggling with PowerPoint. Let us do it for you.
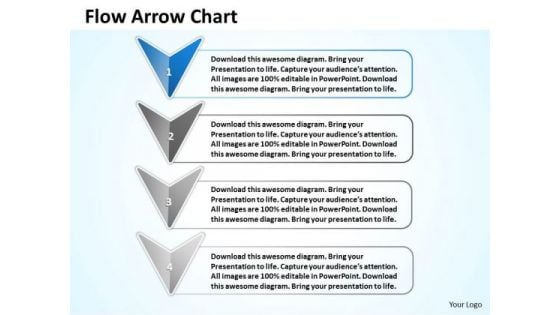
Ppt Stage 1 Beeline Flow Arrow Diagram Presentation PowerPoint Tips Templates
PPT stage 1 beeline flow arrow diagram presentation powerpoint tips Templates-Use This Linearly Demonstrated PowerPoint Diagram having four steps displaying using arrow pointing towards south direction. It signifies the completion of the procedure and attaining success.-PPT stage 1 beeline flow arrow diagram presentation powerpoint tips Templates-3d, analyze, arrow, assess, background, bullet, business, chart, checkmark, chevron, diagram, drop, eps10, financial, glass, graphic, gray, icon, illustration, improvement, management, point, process, project, reflection, set, shadow, silver, stage, text, transparency, vector Cross the chasm with our Ppt Stage 1 Beeline Flow Arrow Diagram Presentation PowerPoint Tips Templates. You will come out on top.
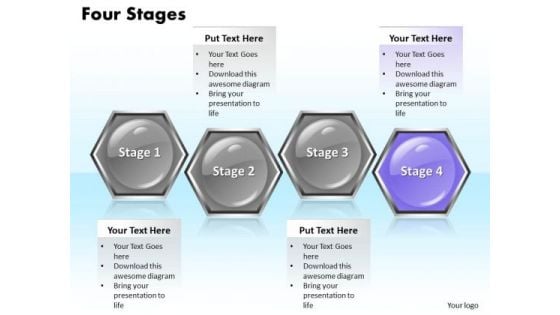
Ppt Consecutive Hexagonal Text Boxes PowerPoint Background 4 State Diagram Templates
PPT consecutive hexagonal text boxes powerpoint background 4 state diagram Templates-Develop competitive advantage with our above template which contains a diagram of four hexagons. This PowerPoint diagram slide shows four parts in an idea. You can use it to depict a list. You can edit the colors of hexagons. -PPT consecutive hexagonal text boxes powerpoint background 4 state diagram Templates-3d, Appointment, Box, Calendar, Cell, Cellular, Color, Diary, Due, Engagement, Event, Everyday, Figure, Grid, Hexagon, Letters, Memo, Message, Note, Order, Organizer, Schedule, Seasonal, Second, Structure, Symbol, System, Text Bond with the boys with our Ppt Consecutive Hexagonal Text Boxes PowerPoint Background 4 State Diagram Templates. They enhance espirit-de-corps.
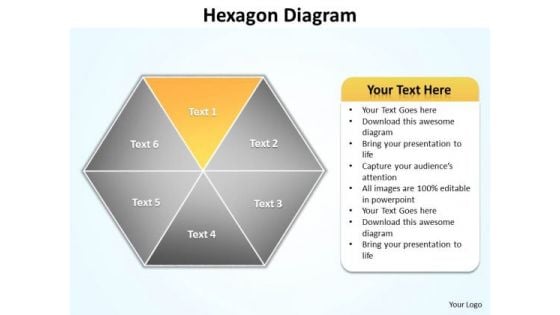
Ppt Yellow Factor Hexagon Cause And Effect Diagram PowerPoint Template Editable Templates
PPT yellow factor hexagon cause and effect diagram PowerPoint template editable Templates-Create visually stimulating Microsoft office PPT Presentations with our above Diagram. This image has been professionally designed to emphasize the concept of interrelated issues, Approaches or Methods. This Business Diagram can be used in Marketing, Banking, and Management etc. This Diagram explains the Yellow Component.-PPT yellow factor hexagon cause and effect diagram PowerPoint template editable Templates-attached, backgrounds, blue, cell, color, component, connect, connection, diagram, elements, geometric, graphic, group, hexagon, honeycomb, icon, illustration, intricacy, lines, link, map, mesh, model, network, science, shape, shiny, strategy, structure, symbol, teamwork, technology Watch your plans fall into place. Our Ppt Yellow Factor Hexagon Cause And Effect Diagram PowerPoint Template Editable Templates aid in completion.
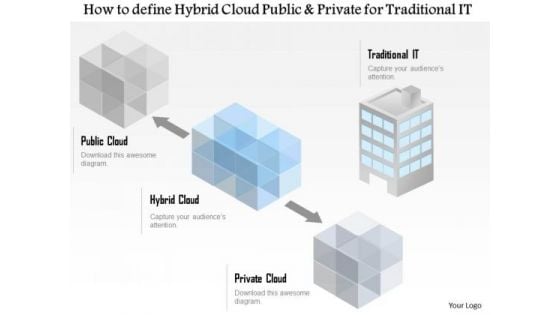
Business Diagram How To Define A Hybrid Cloud Public And Private For Traditional It Ppt Slide
This technology diagram has been designed with graphic of hybrid cloud with user connectivity. This diagram slide depicts the concept of cloud technology for private and public use. Download this diagram for your cloud technology related presentations.

Pie And Progress Bar Diagram Business PowerPoint Templates Ppt Backgrounds For Slides 0413
Display your drive on our Pie And Progress Bar Diagram Business PowerPoint Templates PPT Backgrounds For Slides 0413. Invigorate the audience with your fervour. Drive your team towards excellence. Steer them there with our Pie And Progress Bar Diagram Business PowerPoint Templates PPT Backgrounds For Slides 0413. Let our Pie And Progress Bar Diagram Business PowerPoint Templates Ppt Backgrounds For Slides 0413 escort your thoughts. They will take them safely to their destination.

Pie Diagram Business Planning And Development PowerPoint Templates Ppt Backgrounds For Slides 0413
Your thoughts are dripping with wisdom. Lace it with our Pie Diagram Business Planning And Development PowerPoint Templates PPT Backgrounds For Slides 0413. Give a new drift to your views. Change tack with our Pie Diagram Business Planning And Development PowerPoint Templates PPT Backgrounds For Slides 0413. Overcome resistance with our Pie Diagram Business Planning And Development PowerPoint Templates Ppt Backgrounds For Slides 0413. You will come out on top.
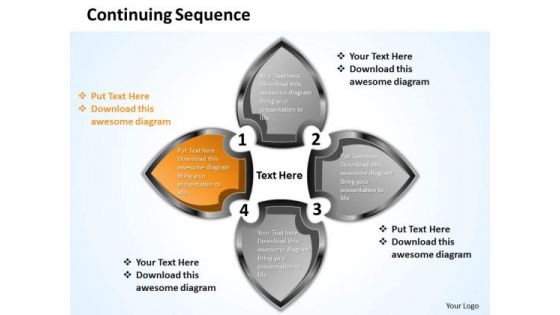
Ppt Continuing Sequence Of World Business Presentation State Diagram PowerPoint Templates
PPT continuing sequence of world business presentation state diagram PowerPoint Templates-This Flower Based PowerPoint Diagram shows the continuous sequence of stages which may be used in Sales, Marketing, and Finance etc. It shows the description of each stage one by one that is by Highlighting one Petal at a time. -PPT continuing sequence of world business presentation state diagram PowerPoint Templates Impress your organization with our Ppt Continuing Sequence Of World Business Presentation State Diagram PowerPoint Templates. Make sure your presentation gets the attention it deserves.
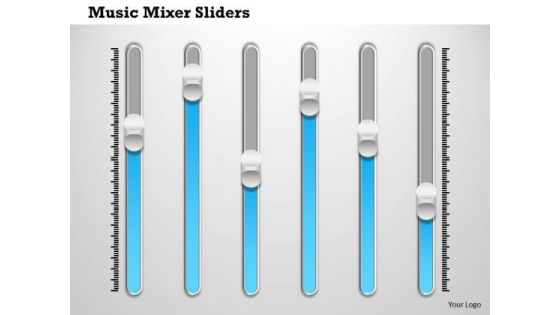
Business Diagram Music Sliders For Data Flow Technology And Control Presentation Template
Our above business diagram contains music sliders for data flow. This diagram provides an effective way of displaying information you can edit text, color, shade and style as per you need. Present your views using this innovative slide and be assured of leaving a lasting impression
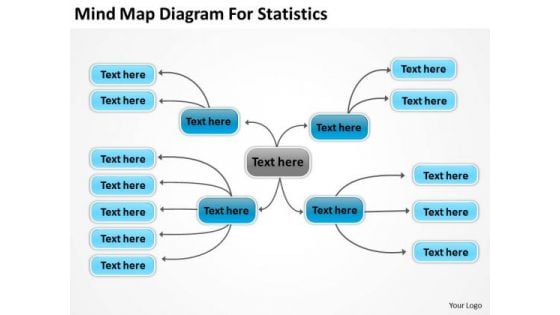
Mind Map Diagram For Statistics Ppt Real Estate Investing Business Plan PowerPoint Slides
Good camaradarie is a key to teamwork. Our mind map diagram for statistics ppt real estate investing business plan PowerPoint Slides can be a cementing force. Elect leaders with our Mind Map Diagram For Statistics Ppt Real Estate Investing Business Plan PowerPoint Slides. Download without worries with our money back guaranteee.
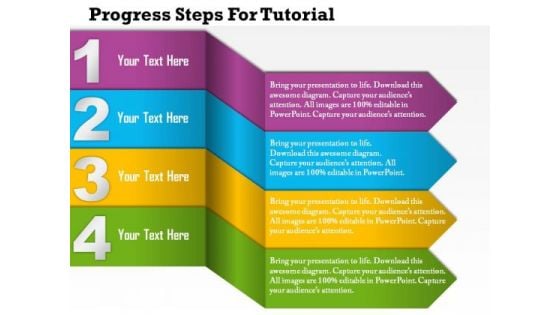
Business Diagram Four Progressive Text Boxes For Business Data Presentation Template
This diagram has been designed with four progressive steps with text boxes. You can insert this diagram into your presentations to clarify information. Highlight your ideas broad based on strong fundamentals and illustrate how they step by step achieve the set growth factor.
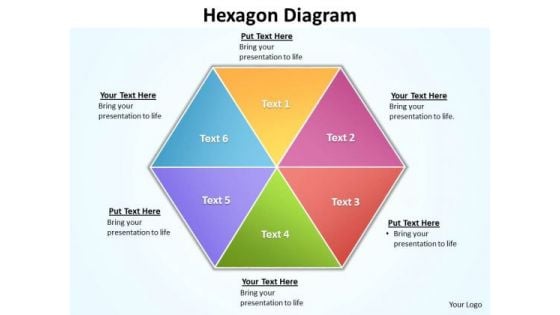
Ppt 6 Factors Hexagon Angles Free Fishbone Diagram PowerPoint Template Editable Templates
PPT 6 factors hexagon angles free fishbone diagram PowerPoint template editable Templates-Visually support your Microsoft office PPT Presentation with our above Diagram illustrating six factors combined in the form of Hexagon. This image identifies the concept of Inter-related issues to be explained together. Adjust the above image in your PPT presentations to visually support your content in your Business PPT slideshows -PPT 6 factors hexagon angles free fishbone diagram PowerPoint template editable Templates-attached, backgrounds, blue, cell, color, component, connect, connection, diagram, elements, geometric, graphic, group, hexagon, honeycomb, icon, illustration, intricacy, lines, link, map, mesh, model, network, science, shape, shiny, strategy, structure, symbol, teamwork, technology Our Ppt 6 Factors Hexagon Angles Free Fishbone Diagram PowerPoint Template Editable Templates will fetch it for you. They will bring audience adulation to your doorstep.

Ppt Continous E Sales PowerPoint Presentation Flow Procedure Diagram 10 Design
We present our PPT continuous e sales PowerPoint presentation Flow procedure diagram 10 design. Use our Arrows PowerPoint Templates because, Core Diagram: - Explore the various hues and layers existing in you are in your plans and processes. Use our Business PowerPoint Templates because, are truly some of the wonders of our life. Use our Shapes PowerPoint Templates because, the alphabetical order is a time honored concept. Use our Finance PowerPoint Templates because, to strive to give true form to your great dream. Use our Process and Flows PowerPoint Templates because; unravel the desired and essential elements of your overall strategy. Use these PowerPoint slides for presentations relating to 3d, arrow, background, bullet, business, chart, checkmark, chevron, diagram, drop, eps10, financial, five, glass, graphic, gray, icon, illustration, management, point, process, project, reflection, set, shadow, stage, text, transparency, vector, white. The prominent colors used in the PowerPoint template are Green, Gray, and Black Define the course with our Ppt Continous E Sales PowerPoint Presentation Flow Procedure Diagram 10 Design. Channel them in the correct direction.
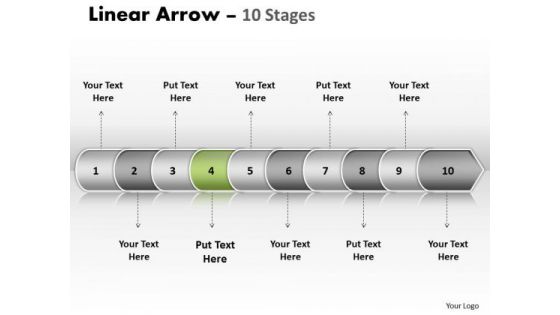
Usa Ppt Background Linear Arrow 10 State PowerPoint Project Diagram 5 Image
USA PPT Background linear arrow 10 state powerpoint project diagram 5 Image-Use this diagram to emphasize the process of your corporate growth. Highlight your ideas broad- based on strong fundamentals and illustrate how they step by step achieve the set growth factor.-USA PPT Background linear arrow 10 state powerpoint project diagram 5 Image-Arrow, Background, Collection, Completed, Concept, Confirmation, Design, Flow, Graph, Graphic, Illustration, Indication, Indicator, Information, Instruction, Interface, Internet, Layout, Measurement, Order, Phase, Pointer, Process, Progress, Reflection, Scale, Shape, Sign When in doubt fall back on our Usa Ppt Background Linear Arrow 10 State PowerPoint Project Diagram 5 Image. All your apprehensions will fall away.
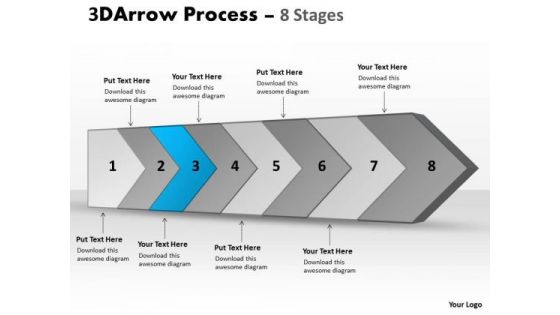
Ppt Background Continous Free Mole Theory Representation Video Flow Diagram 4 Graphic
We present our PPT Background continuous free mole theory representation video flow diagram 4 Graphic. Use our Arrows PowerPoint Templates because; Use this template containing to highlight the key issues of your presentation. Use our Shapes PowerPoint Templates because, hence this diagram has the unique ability to drive home your ideas and show how they mesh to guarantee success. Use our Finance PowerPoint Templates because; emphasize the process of your business/corporate growth. Use our Business PowerPoint Templates because, the lessons have been analyzed, studied and conclusions drawn. Use our Process and Flows PowerPoint Templates because, Harness these opportunities, celebrate your performance till date and focus on greater growth and expansion in coming years. Use these PowerPoint slides for presentations relating to 3d, arrow, background, bullet, business, chart, checkmark, chevron, diagram, drop, eps10, financial, glass, graphic, gray, icon, illustration, perspective, point, process, reflection, set, shadow, silver, text, transparency, vector,. The prominent colors used in the PowerPoint template are Blue, Gray, and Black Our Ppt Background Continous Free Mole Theory Representation Video Flow Diagram 4 Graphic will ensure you get a good grade. You will be glad you tried us out.
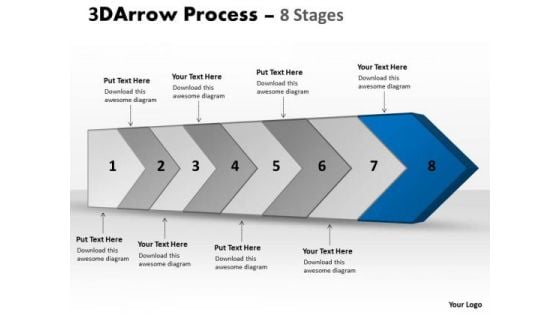
Ppt Continous Free Big Business Presentation PowerPoint Tips Flow Diagram 9 Graphic
We present our PPT continuous free big business presentation PowerPoint tips flow diagram 9 graphic. Use our Arrows PowerPoint Templates because, Our PowerPoint templates designed for your ideas to sell. Use our Business PowerPoint Templates because, Marketing Strategy Business Template: - Maximizing sales of your product is the intended destination. Use our Shapes PowerPoint Templates because, If making a mark is your obsession,. Use our Finance PowerPoint Templates because, Business Process Design: - The template offers an excellent background to build up the various stages of your business process. Use our Process and Flows PowerPoint Templates because; demonstrate how you think out of the box. Use these PowerPoint slides for presentations relating to 3d, arrow, background, bullet, business, chart, checkmark, chevron, diagram, drop, eps10, financial, five, glass, graphic, gray, icon, illustration, management, point, process, project, reflection, set, shadow, stage, text, transparency, vector, white. The prominent colors used in the PowerPoint template are Blue navy, Gray, Black Go on a binge with our Ppt Continous Free Big Business Presentation PowerPoint Tips Flow Diagram 9 Graphic. The after effects will always be pleasant.

Business Diagram Extract Transform Load Etl Business Intelligence Bug Data Analysis Pipeline Ppt Sli
This PowerPoint template has been designed with graphic of server. This diagram depicts the concept of ETL business intelligence with extract transform load. This slide also helps to display the data analysis pipeline.

Business Diagram Laptop Thin Clients Mobile Devices Connected To Virtual Desktop Cloud Ppt Slide
This PowerPoint template has been designed with graphic of laptop and mobile devices. It depicts concept of network with interconnected devices. Use this diagram for technology and internet related topics.
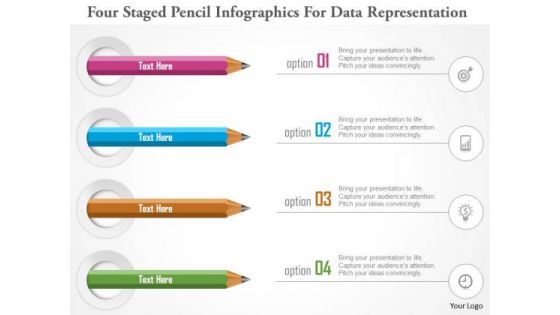
Business Diagram Four Staged Pencil Infographics For Data Representation PowerPoint Template
Four staged pencil info graphics has been used to design this power point template. This diagram template contains the concept of data representations. Use this PPT for your business and marketing presentations.


 Continue with Email

 Home
Home


