Process Flow Diagram
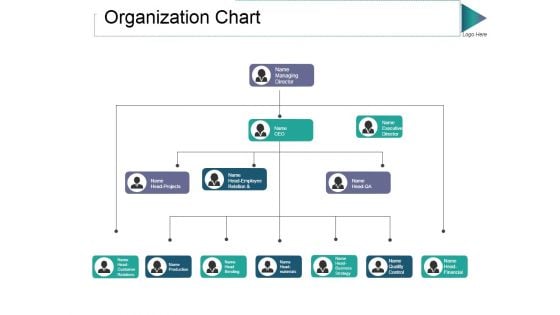
Organization Chart Ppt PowerPoint Presentation Gallery Ideas
This is a organization chart ppt powerpoint presentation gallery ideas. This is a four stage process. The stages in this process are managing director, ceo, head projects, head bending.
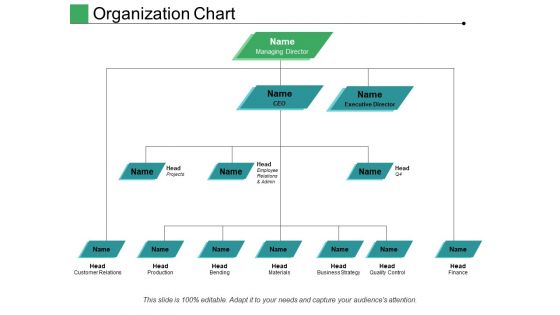
Organization Chart Ppt PowerPoint Presentation Pictures Structure
This is a organization chart ppt powerpoint presentation pictures structure. This is a three stage process. The stages in this process are managing director, executive director, head, ceo, finance.
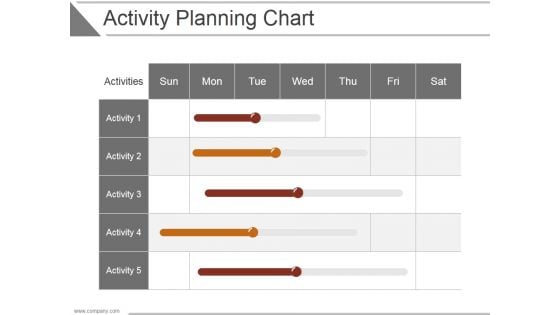
Activity Planning Chart Ppt PowerPoint Presentation Backgrounds
This is a activity planning chart ppt powerpoint presentation backgrounds. This is a five stage process. The stages in this process are business, strategy, analysis, marketing, chart and graph, compare.
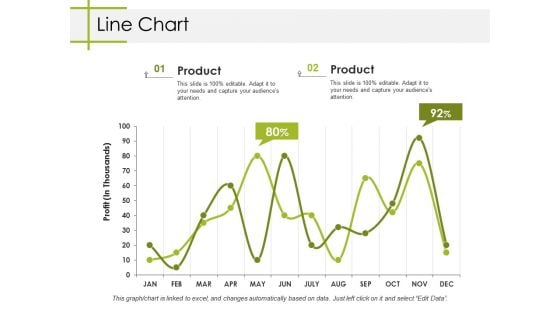
Line Chart Ppt PowerPoint Presentation Ideas Templates
This is a line chart ppt powerpoint presentation ideas templates. This is a two stage process. The stages in this process are line chart, growth, finance, marketing, analysis, business.
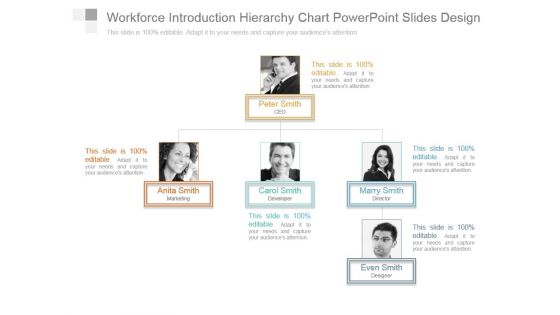
Workforce Introduction Hierarchy Chart Powerpoint Slides Design
This is a workforce introduction hierarchy chart powerpoint slides design. This is a three stage process. The stages in this process are peter smith ceo, anita smith marketing, carol smith developer, marry smith director, even smith designer.
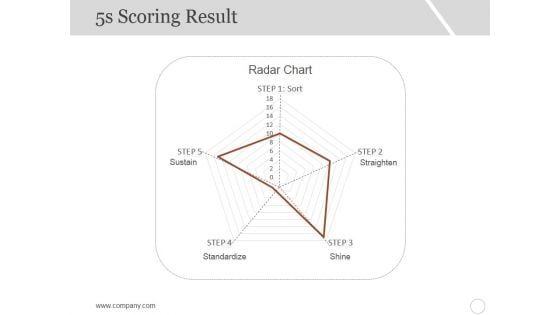
5S Scoring Result Ppt PowerPoint Presentation Model Objects
This is a 5s scoring result ppt powerpoint presentation model objects. This is a five stage process. The stages in this process are radar chart, straighten, shine, standardize, sustain.
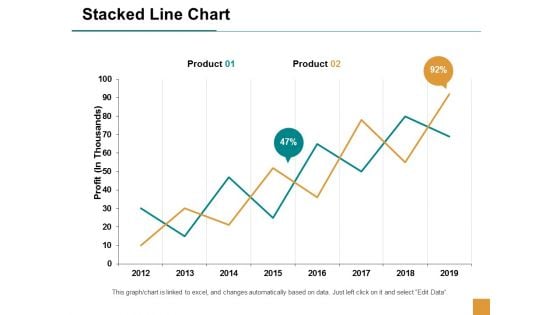
Stacked Line Chart Finance Ppt Powerpoint Presentation Outline Themes
This is a stacked line chart finance ppt powerpoint presentation outline themes. This is a two stage process. The stages in this process are finance, marketing, management, investment, analysis.
Control Chart Template 2 Ppt PowerPoint Presentation Icon Mockup
This is a control chart template 2 ppt powerpoint presentation icon mockup. This is a one stage process. The stages in this process are control chart, growth, finance, marketing, strategy, business.
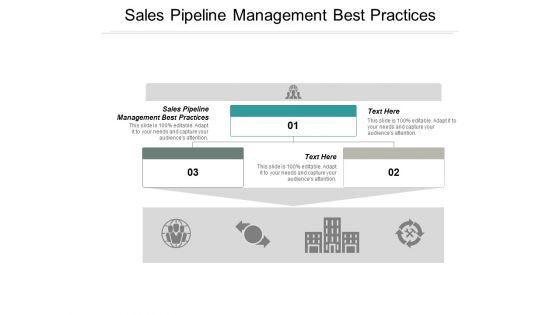
Sales Pipeline Management Best Practices Ppt PowerPoint Presentation Professional Model Cpb
This is a sales pipeline management best practices ppt powerpoint presentation professional model cpb. This is a three stage process. The stages in this process are sales pipeline management best practices.
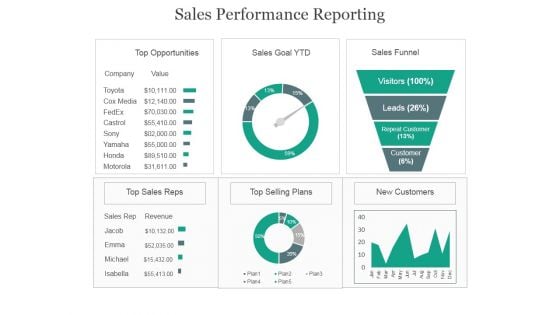
Sales Performance Reporting Ppt PowerPoint Presentation Model
This is a sales performance reporting ppt powerpoint presentation model. This is a six stage process. The stages in this process are top opportunities, sales goal ytd, sales funnel, top sales reps, top selling plans, new customers.
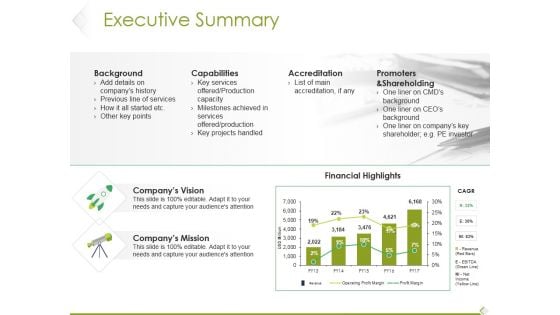
Executive Summary Ppt PowerPoint Presentation Model Show
This is a executive summary ppt powerpoint presentation model show. This is a five stage process. The stages in this process are background, capabilities, accreditation, promoters and shareholding, financial highlights.
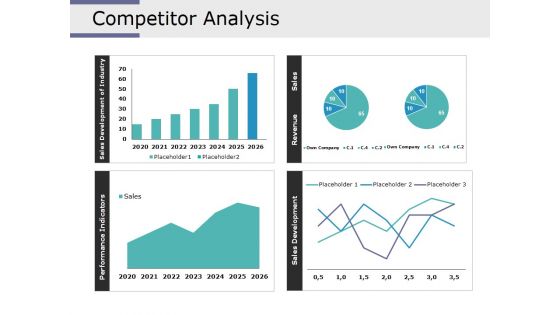
Competitor Analysis Ppt PowerPoint Presentation Model Show
This is a competitor analysis ppt powerpoint presentation model show. This is a four stage process. The stages in this process are performance indicators, sales development of industry, sales development, revenue, sales.
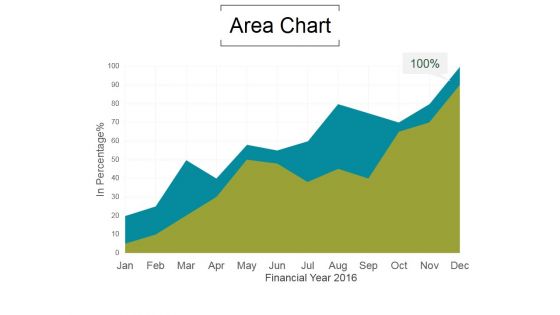
Area Chart Ppt PowerPoint Presentation Topics
This is a area chart ppt powerpoint presentation topics. This is a two stage process. The stages in this process are product, in percentage, jan, feb, mar, apr, may.
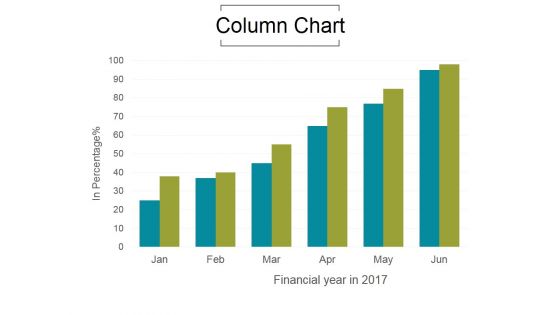
Column Chart Ppt PowerPoint Presentation Show
This is a column chart ppt powerpoint presentation show. This is a six stage process. The stages in this process are product, in percentage, jan, feb, mar, apr, may.
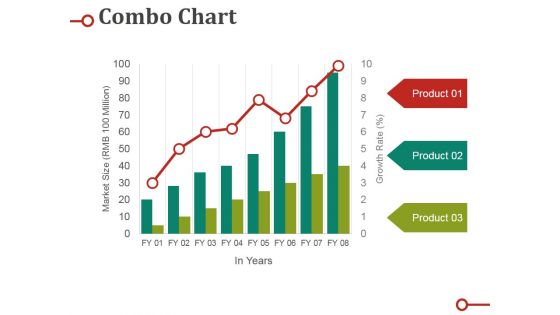
Combo Chart Ppt PowerPoint Presentation Gallery Sample
This is a combo chart ppt powerpoint presentation gallery sample. This is a three stage process. The stages in this process are market size, product, growth rate, bar, graph.
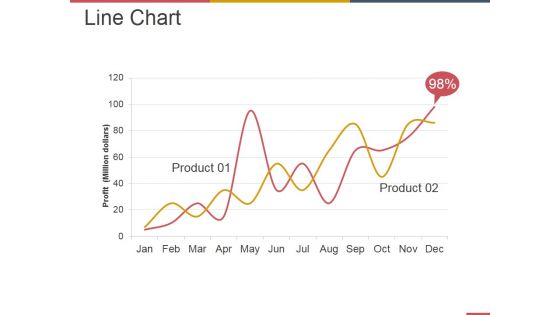
Line Chart Ppt PowerPoint Presentation Summary Information
This is a line chart ppt powerpoint presentation summary information. This is a two stage process. The stages in this process are business, strategy, marketing, analysis, profit million dollars.
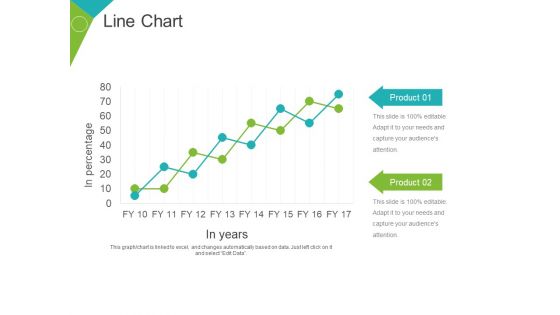
Line Chart Ppt PowerPoint Presentation Gallery Objects
This is a line chart ppt powerpoint presentation gallery objects. This is a two stage process. The stages in this process are product, business, marketing, growth, in years, in percentage.
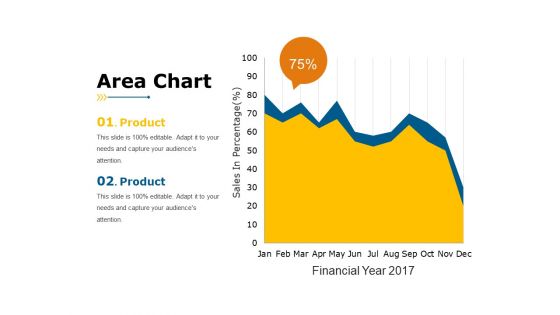
Area Chart Ppt PowerPoint Presentation Slides Rules
This is a area chart ppt powerpoint presentation slides rules. This is a two stage process. The stages in this process are sales in percentage, business, marketing, product, finance.
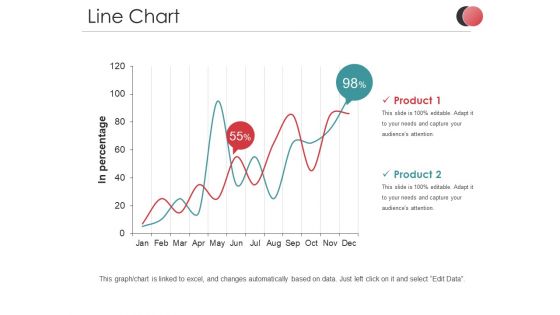
Line Chart Ppt PowerPoint Presentation Professional Ideas
This is a line chart ppt powerpoint presentation professional ideas. This is a two stage process. The stages in this process are in percentage, product, business, marketing, finance, percentage.
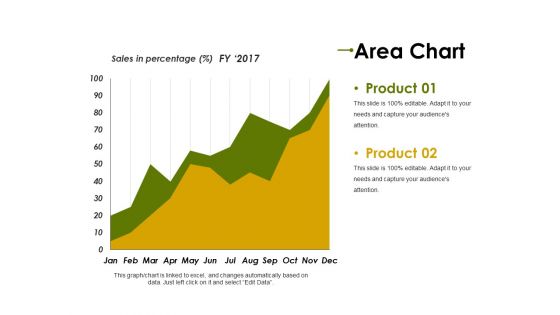
Area Chart Ppt PowerPoint Presentation Summary Objects
This is a area chart ppt powerpoint presentation summary objects. This is a two stage process. The stages in this process are product, sales in percentage, finance, business, marketing.

Column Chart Ppt PowerPoint Presentation Layouts Ideas
This is a column chart ppt powerpoint presentation layouts ideas. This is a two stage process. The stages in this process are dollars in thousands, strategy, business, graph, product.
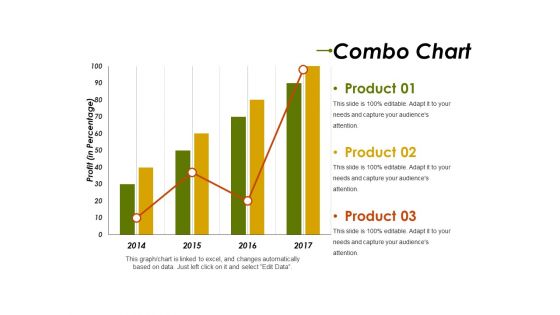
Combo Chart Ppt PowerPoint Presentation Infographics Introduction
This is a combo chart ppt powerpoint presentation infographics introduction. This is a three stage process. The stages in this process are profit in percentage, business, graph, strategy, product.
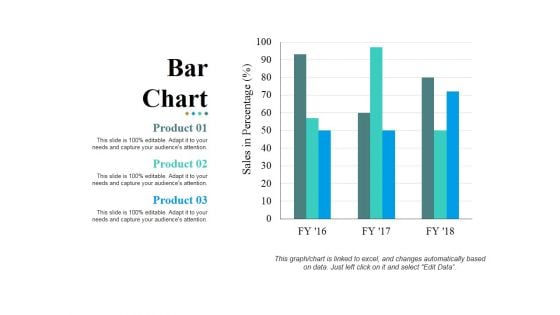
Bar Chart Ppt PowerPoint Presentation Layouts Pictures
This is a bar chart ppt powerpoint presentation layouts pictures. This is a three stage process. The stages in this process are bar graph, product, sales in percentage, business, marketing.
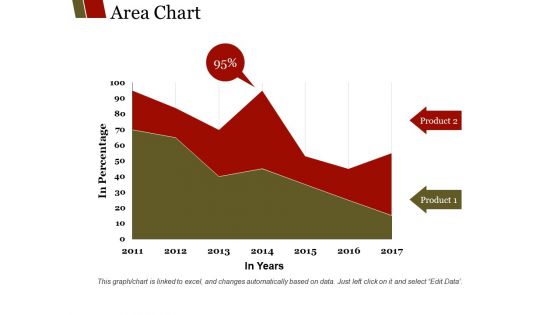
Area Chart Ppt PowerPoint Presentation Show Templates
This is a area chart ppt powerpoint presentation show templates. This is a two stage process. The stages in this process are product, in percentage, in years, finance, graph.
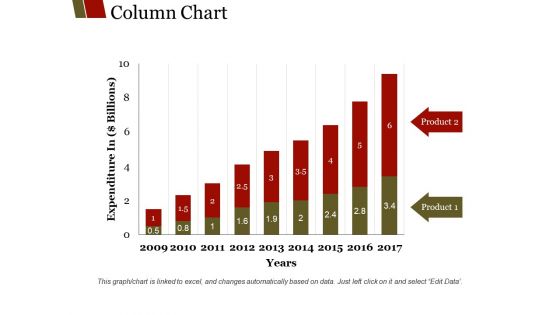
Column Chart Ppt PowerPoint Presentation Summary Graphics
This is a column chart ppt powerpoint presentation summary graphics. This is a nine stage process. The stages in this process are product, years, expenditure in billions, graph, business.
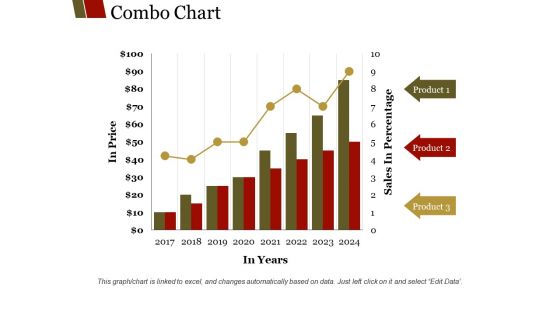
Combo Chart Ppt PowerPoint Presentation Summary Layouts
This is a combo chart ppt powerpoint presentation summary layouts. This is a eight stage process. The stages in this process are product, sales in percentage, in years, in price, graph.
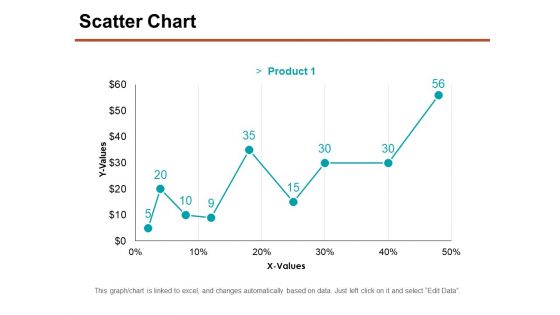
Scatter Chart Ppt PowerPoint Presentation Ideas Templates
This is a scatter chart ppt powerpoint presentation ideas templates. This is a nine stage process. The stages in this process are y values, x values, product, graph, business.
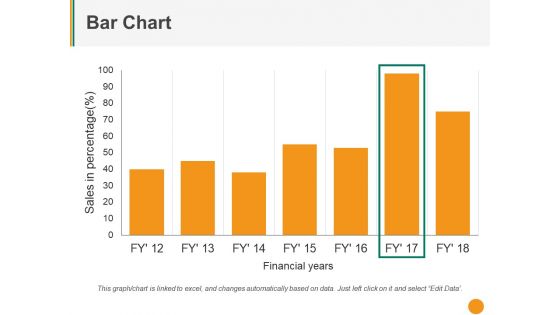
Bar Chart Ppt PowerPoint Presentation Styles Outfit
This is a bar chart ppt powerpoint presentation styles outfit. This is a Seven stage process. The stages in this process are sales in percentage, financial years, graph, business.
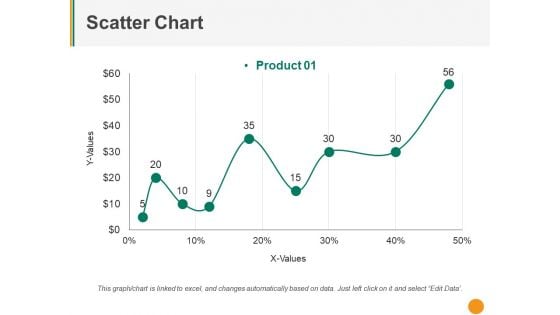
Scatter Chart Ppt PowerPoint Presentation Summary Smartart
This is a scatter chart ppt powerpoint presentation summary smartart. This is a nine stage process. The stages in this process are y values, x values, product, business, graph.
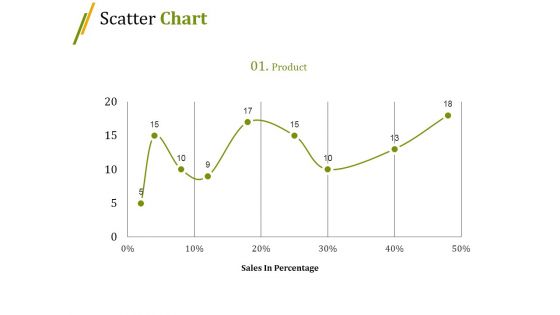
Scatter Chart Ppt PowerPoint Presentation Slides Summary
This is a scatter chart ppt powerpoint presentation slides summary. This is a nine stage process. The stages in this process are sales in percentage, growth, graph, business, marketing.
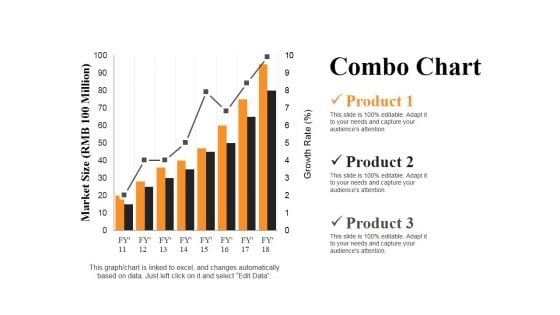
Combo Chart Ppt PowerPoint Presentation Summary Slides
This is a combo chart ppt powerpoint presentation summary slides. This is a three stage process. The stages in this process are market size, product, growth rate, bar graph, success.
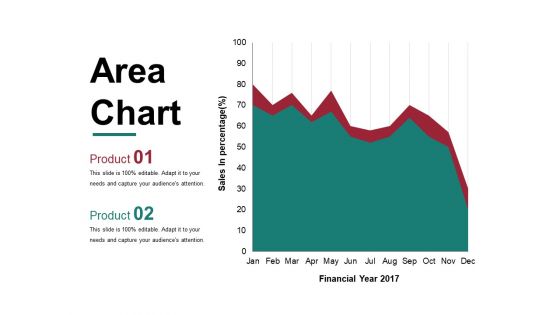
Area Chart Ppt PowerPoint Presentation Layouts Maker
This is a area chart ppt powerpoint presentation layouts maker. This is a two stage process. The stages in this process are financial year, sales in percentage, graph, business, marketing.
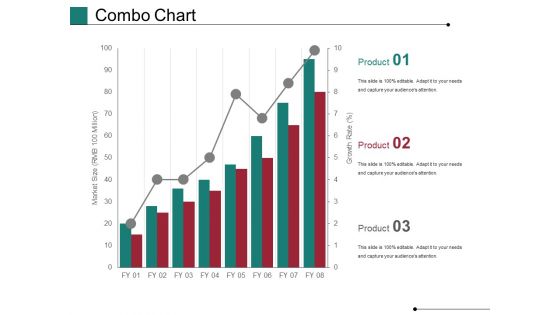
Combo Chart Ppt PowerPoint Presentation Styles Objects
This is a combo chart ppt powerpoint presentation styles objects. This is a three stage process. The stages in this process are market size growth rate, growth, business, marketing, graph.
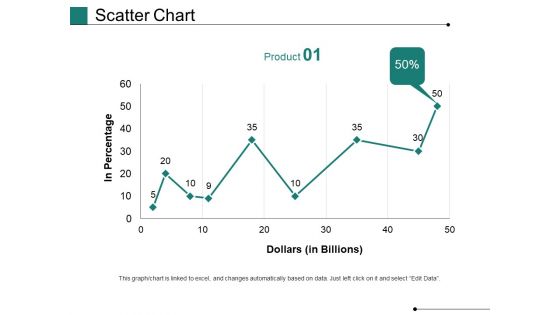
Scatter Chart Ppt PowerPoint Presentation Gallery Show
This is a scatter chart ppt powerpoint presentation gallery show. This is a one stage process. The stages in this process are in percentage, dollars, business, marketing, growth, graph.
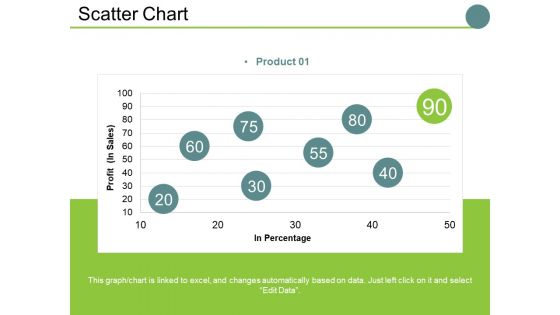
Scatter Chart Ppt PowerPoint Presentation Slides Examples
This is a scatter chart ppt powerpoint presentation slides examples. This is a one stage process. The stages in this process are profit , in percentage, business, marketing, finance, graph.
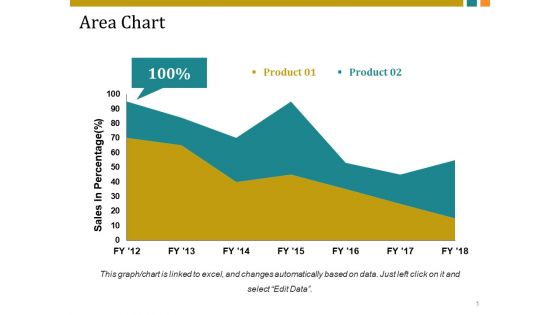
Area Chart Ppt PowerPoint Presentation Professional Brochure
This is a area chart ppt powerpoint presentation professional brochure. This is a two stage process. The stages in this process are sales in percentage, business, marketing, finance, graph.
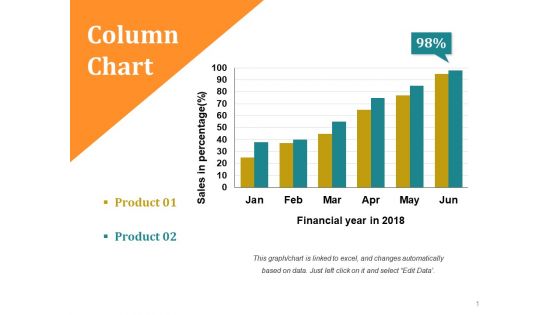
Column Chart Ppt PowerPoint Presentation Slides Smartart
This is a column chart ppt powerpoint presentation slides smartart. This is a two stage process. The stages in this process are sales in percentage, financial year in, business, growth, strategy.
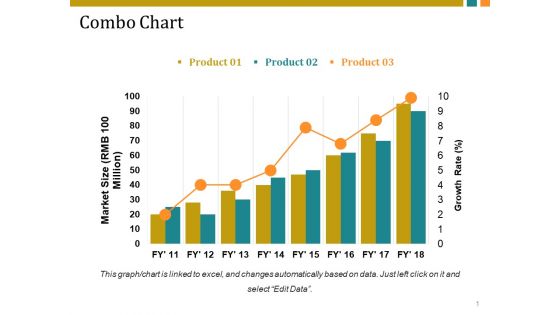
Combo Chart Ppt PowerPoint Presentation Guide
This is a combo chart ppt powerpoint presentation guide. This is a three stage process. The stages in this process are market size, growth rate, business, growth, graph, strategy.
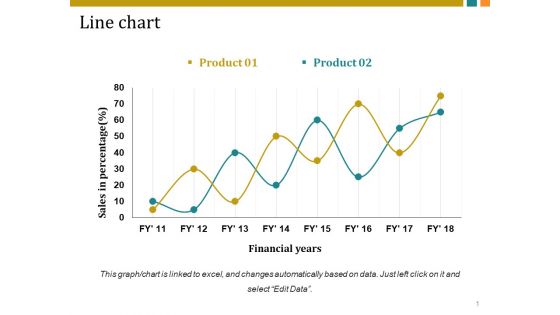
Line Chart Ppt PowerPoint Presentation Inspiration Vector
This is a line chart ppt powerpoint presentation inspiration vector. This is a two stage process. The stages in this process are sales in percentage, financial years, business, marketing, growth.
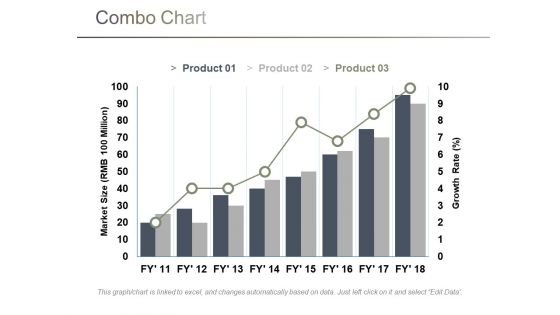
Combo Chart Ppt PowerPoint Presentation Pictures Shapes
This is a combo chart ppt powerpoint presentation pictures shapes. This is a three stage process. The stages in this process are market size, growth rate, business, marketing, graph.
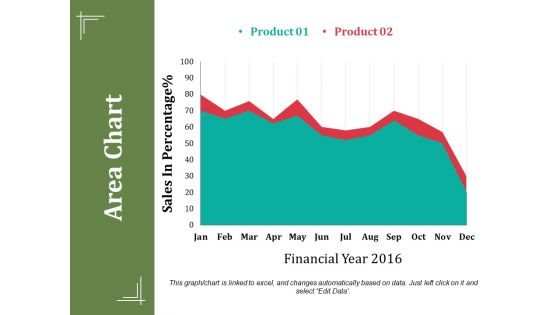
Area Chart Ppt PowerPoint Presentation Summary Show
This is a area chart ppt powerpoint presentation summary show. This is a two stage process. The stages in this process are sales in percentage, financial year, business, marketing, finance.
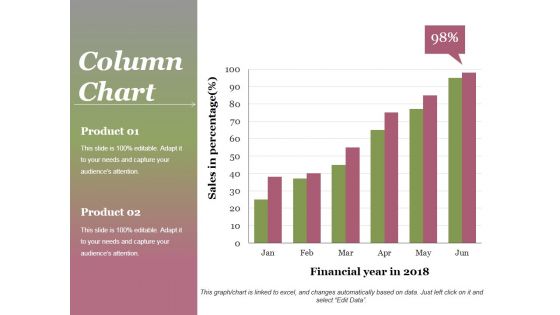
Column Chart Ppt PowerPoint Presentation Gallery Background
This is a column chart ppt powerpoint presentation gallery background. This is a two stage process. The stages in this process are product, sales in percentage, financial year, graph, success.
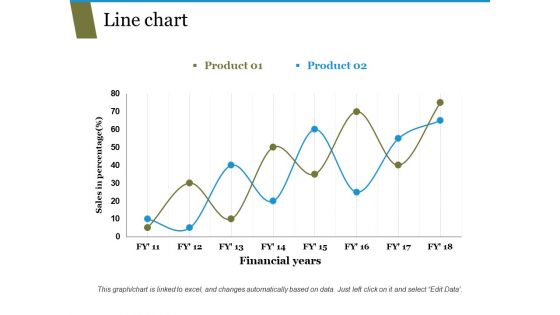
Line Chart Ppt PowerPoint Presentation Pictures Templates
This is a line chart ppt powerpoint presentation pictures templates. This is a two stage process. The stages in this process are sales in percentage, financial years, business, marketing, growth.
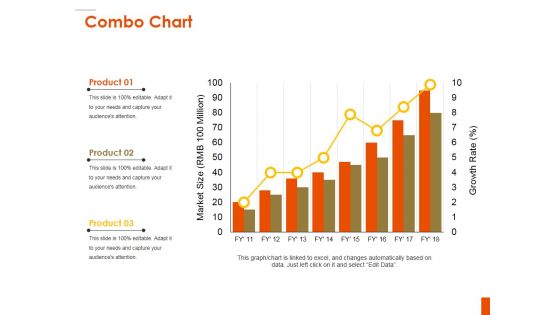
Combo Chart Ppt PowerPoint Presentation Inspiration Background
This is a combo chart ppt powerpoint presentation inspiration background. This is a three stage process. The stages in this process are product, bar graph, market size, growth, growth rate.
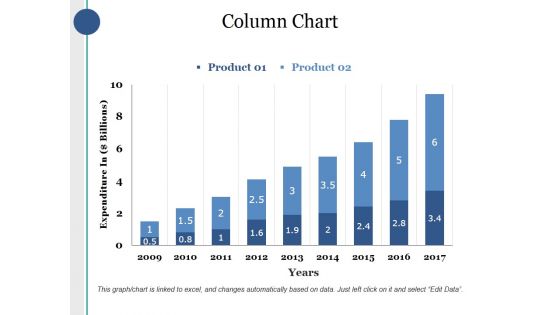
Column Chart Ppt PowerPoint Presentation Infographics Deck
This is a column chart ppt powerpoint presentation infographics deck. This is a two stage process. The stages in this process are product, expenditure in, years, bar graph, growth.
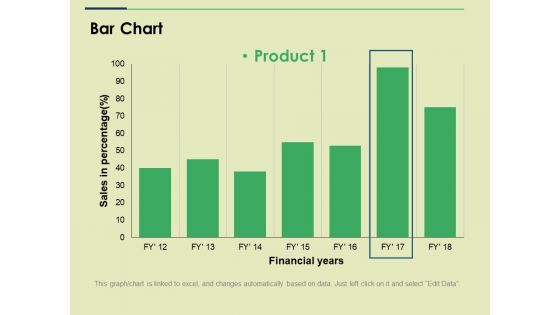
Bar Chart Ppt PowerPoint Presentation File Slide
This is a bar chart ppt powerpoint presentation file slide. This is a one stage process. The stages in this process are sales in percentage financial years, business, marketing, strategy, graph.
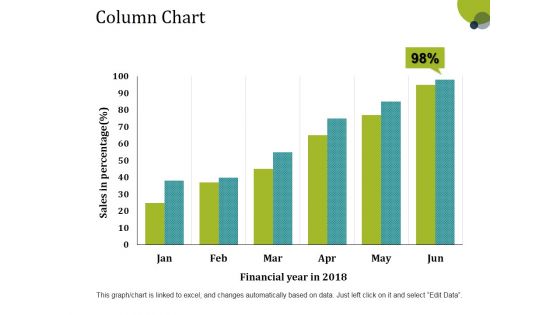
Column Chart Ppt PowerPoint Presentation Layouts Tips
This is a column chart ppt powerpoint presentation layouts tips. This is a six stage process. The stages in this process are sales in percentage, financial year, bar graph, growth, success.
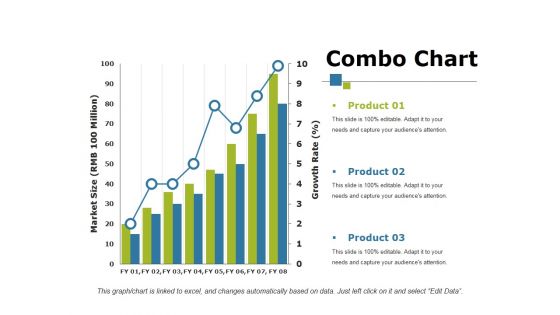
Combo Chart Ppt PowerPoint Presentation Show Influencers
This is a combo chart ppt powerpoint presentation show influencers. This is a three stage process. The stages in this process are product, bar graph, growth, growth rate, market size.
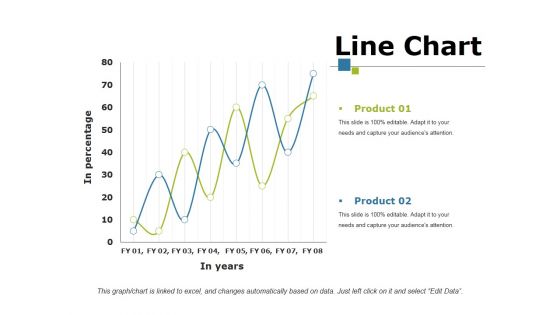
Line Chart Ppt PowerPoint Presentation Portfolio Mockup
This is a line chart ppt powerpoint presentation portfolio mockup. This is a two stage process. The stages in this process are product, in percentage, in year, growth, success.
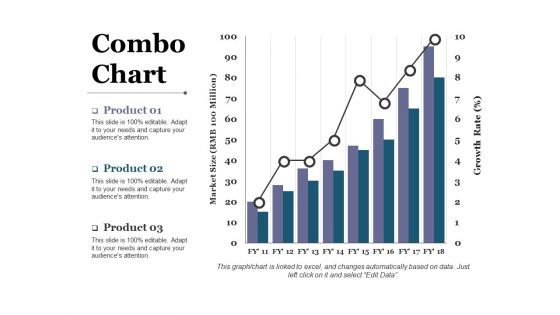
Combo Chart Ppt PowerPoint Presentation Gallery Layout
This is a combo chart ppt powerpoint presentation gallery layout. This is a three stage process. The stages in this process are business, marketing, graph, market size, growth rate.
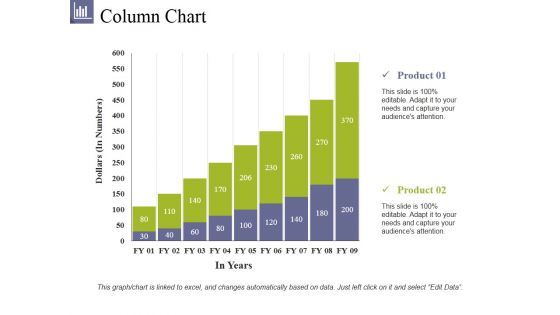
Column Chart Ppt PowerPoint Presentation File Summary
This is a column chart ppt powerpoint presentation file summary. This is a two stage process. The stages in this process are product, dollars, in years, bar graph, growth.
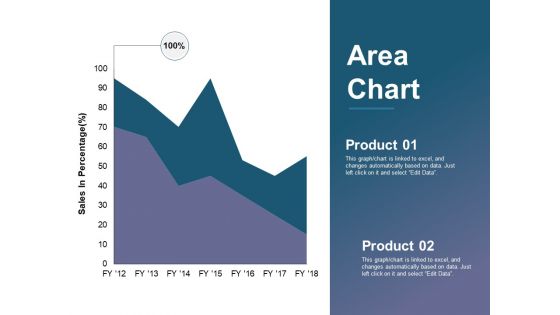
Area Chart Ppt PowerPoint Presentation Summary Information
This is a area chart ppt powerpoint presentation summary information. This is a two stage process. The stages in this process are business, sales in percentage, percentage, marketing, graph.
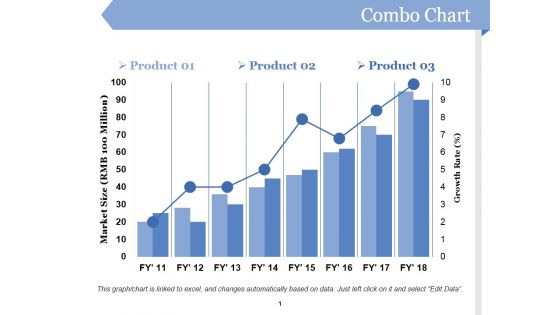
Combo Chart Ppt PowerPoint Presentation Ideas Professional
This is a combo chart ppt powerpoint presentation ideas professional. This is a three stage process. The stages in this process are business, marketing, market size, growth rate, graph.
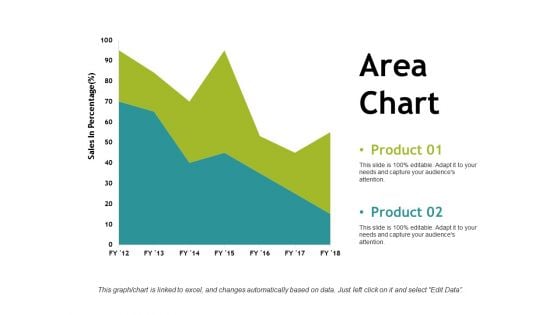
Area Chart Ppt PowerPoint Presentation File Visuals
This is a area chart ppt powerpoint presentation file visuals. This is a two stage process. The stages in this process are business, sales in percentage, marketing, graph, strategy, finance.
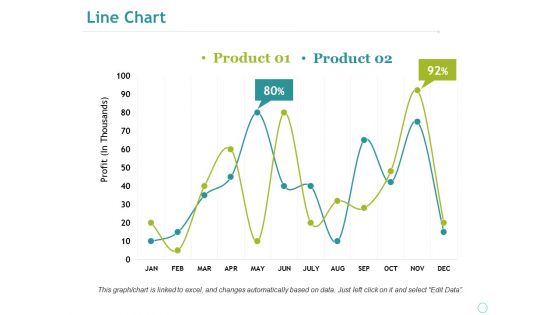
Line Chart Ppt PowerPoint Presentation Professional Portfolio
This is a line chart ppt powerpoint presentation professional portfolio. This is a two stage process. The stages in this process are business, marketing, profit, percentage, graph, strategy, finance.
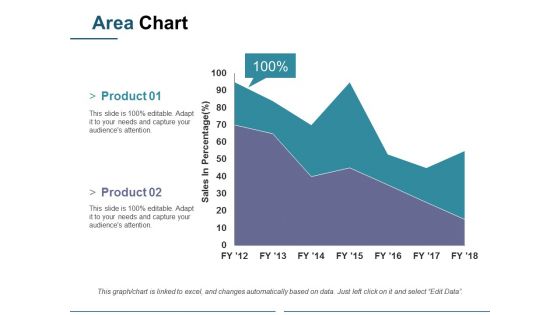
Area Chart Ppt PowerPoint Presentation Pictures Vector
This is a area chart ppt powerpoint presentation pictures vector. This is a two stage process. The stages in this process are sales in percentage, business, marketing, graph, percentage.
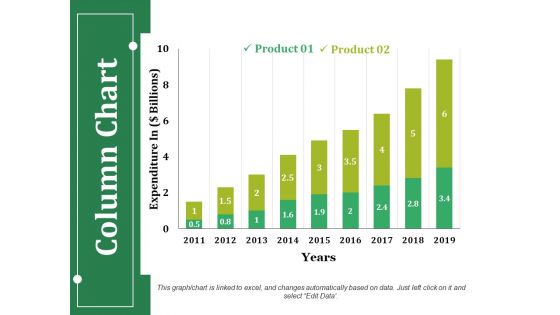
Column Chart Ppt PowerPoint Presentation Infographics Guidelines
This is a column chart ppt powerpoint presentation infographics guidelines. This is a two stage process. The stages in this process are product, expenditure in, years, business, bar graph.
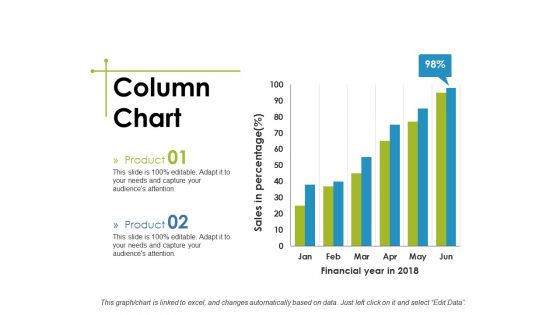
Column Chart Ppt PowerPoint Presentation Show Structure
This is a column chart ppt powerpoint presentation show structure. This is a two stage process. The stages in this process are business, financial year in, sales in percentage, marketing, graph.
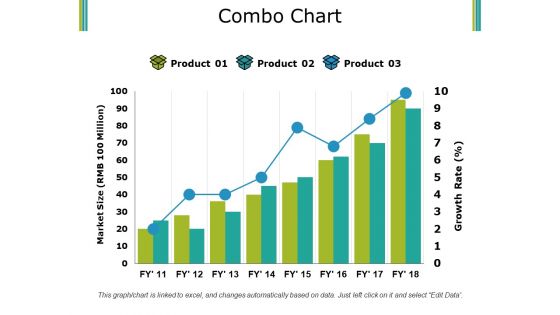
Combo Chart Ppt PowerPoint Presentation Pictures Summary
This is a combo chart ppt powerpoint presentation pictures summary. This is a three stage process. The stages in this process are product, market size, growth rate, bar graph, success.
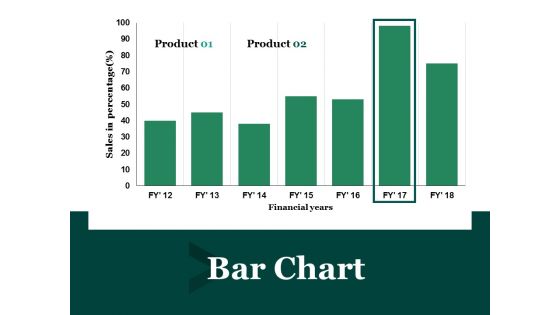
Bar Chart Ppt PowerPoint Presentation Layouts Template
This is a bar chart ppt powerpoint presentation layouts template. This is a two stage process. The stages in this process are financial year, sales in percentage, business, marketing, finance.


 Continue with Email

 Home
Home


