Process Icon
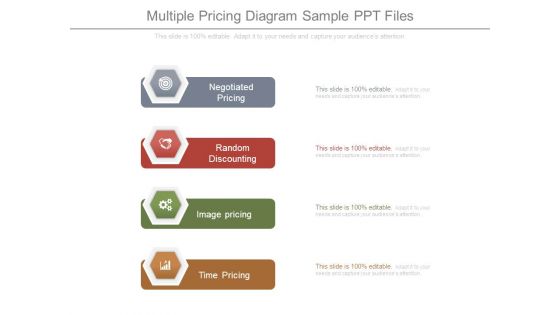
Multiple Pricing Diagram Sample Ppt Files
This is a multiple pricing diagram sample ppt files. This is a four stage process. The stages in this process are negotiated pricing, random discounting, image pricing, time pricing.
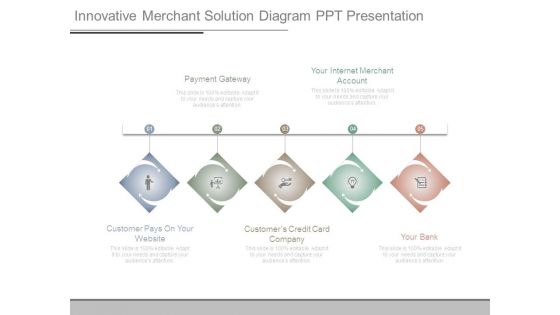
Innovative Merchant Solution Diagram Ppt Presentation
This is a innovative merchant solution diagram ppt presentation. This is a five stage process. The stages in this process are payment gateway, your internet merchant account, customer pays on your website, customers credit card company, your bank.
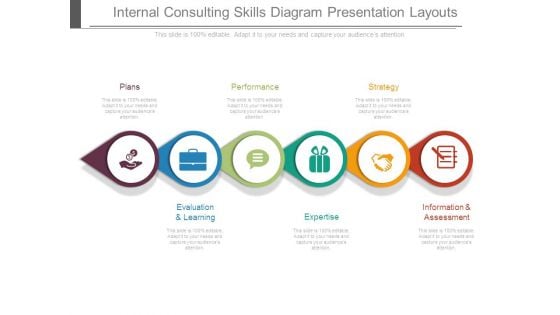
Internal Consulting Skills Diagram Presentation Layouts
This is a internal consulting skills diagram presentation layouts. This is a six stage process. The stages in this process are plans, performance, strategy, evaluation and learning, expertise, information and assessment.
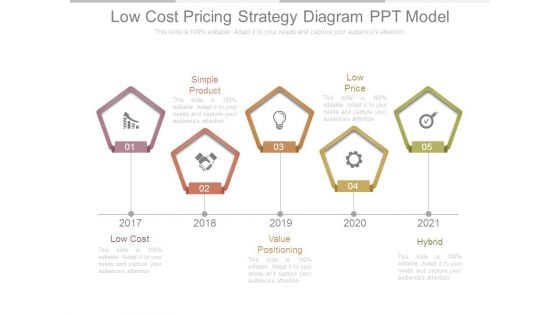
Low Cost Pricing Strategy Diagram Ppt Model
This is a low cost pricing strategy diagram ppt model. This is a five stage process. The stages in this process are simple product, low price, low cost, value positioning, hybrid.
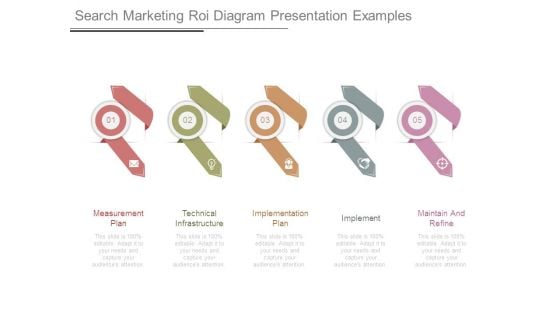
Search Marketing Roi Diagram Presentation Examples
This is a search marketing roi diagram presentation examples. This is a five stage process. The stages in this process are measurement plan, technical infrastructure, implementation plan, implement, maintain and refine.
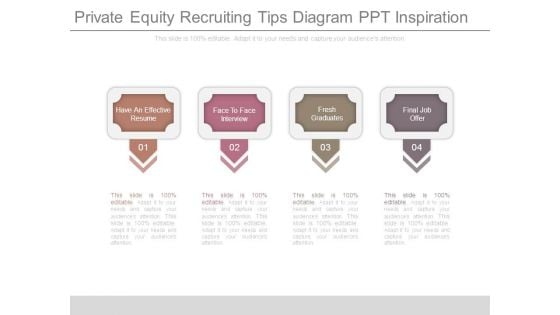
Private Equity Recruiting Tips Diagram Ppt Inspiration
This is a private equity recruiting tips diagram ppt inspiration. This is a four stage process. The stages in this process are have an effective resume, face to face interview, fresh graduates, final job offer.

Recycling Business Opportunity Diagram Powerpoint Slide Clipart
This is a recycling business opportunity diagram powerpoint slide clipart. This is a eight stage process. The stages in this process are cash flow, action flow, the public, recycling fund, help, think, our planet, stop.
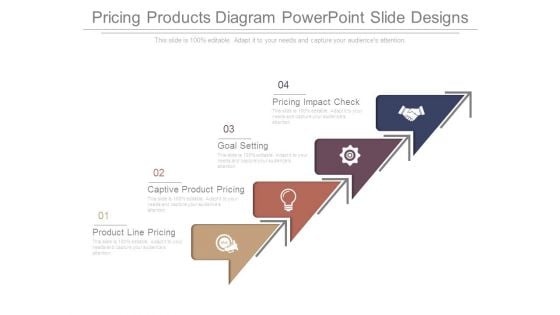
Pricing Products Diagram Powerpoint Slide Designs
This is a pricing products diagram powerpoint slide designs. This is a four stage process. The stages in this process are pricing impact check, goal setting, captive product pricing, product line pricing.
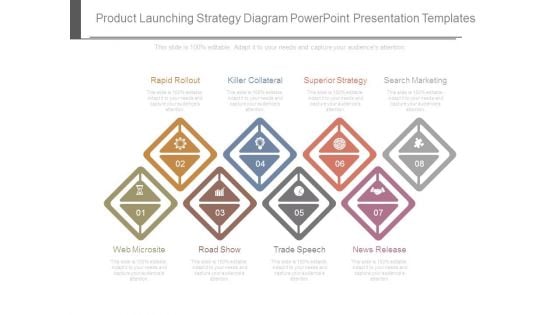
Product Launching Strategy Diagram Powerpoint Presentation Templates
This is a product launching strategy diagram powerpoint presentation templates. This is a eight stage process. The stages in this process are rapid rollout, killer collateral, superior strategy, search marketing, news release, trade speech, road show, web microsite.
Profit Loss Analysis Diagram Ppt Slide Examples
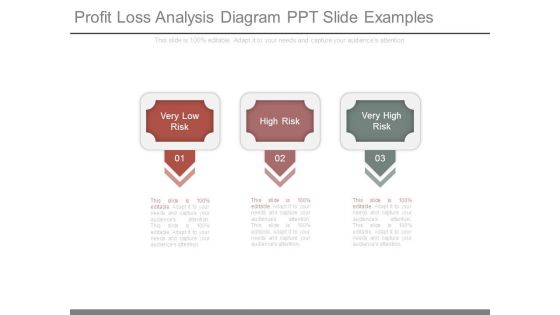
This is a profit loss analysis diagram ppt slide examples. This is a three stage process. The stages in this process are very low risk, high risk, very high risk.
Business Debt Financing Diagram Powerpoint Slide Show
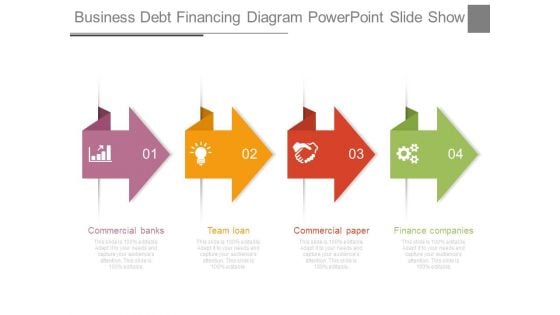
This is a business debt financing diagram powerpoint slide show. This is a four stage process. The stages in this process are commercial banks, team loan, commercial paper, finance companies.

Business Direct Marketing Diagram Powerpoint Slides
This is a business direct marketing diagram powerpoint slides. This is a five stage process. The stages in this process are direct mail, direct advertising, direct selling, broadcast, promote.
Business Planning And Strategy Diagram Ppt Inspiration
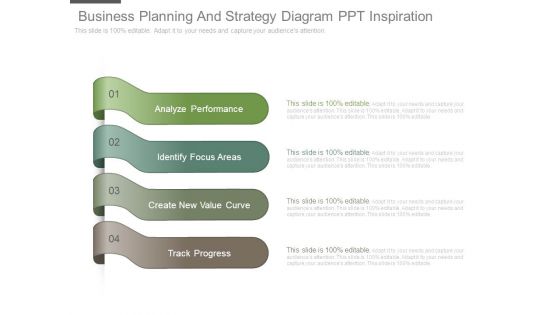
This is a business planning and strategy diagram ppt inspiration. This is a four stage process. The stages in this process are analyze performance, identify focus areas, create new value curve, track progress.
Technology Industry Growth Diagram Presentation Portfolio
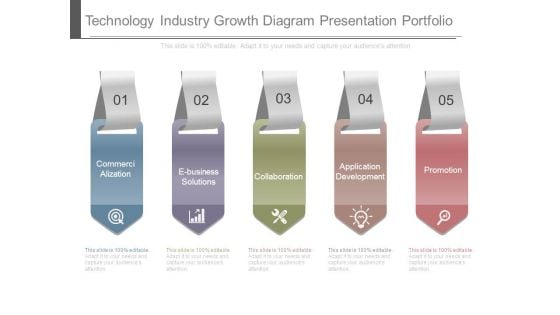
This is a technology industry growth diagram presentation portfolio. This is a five stage process. The stages in this process are commercialization, e business solutions, collaboration, application development, promotion.
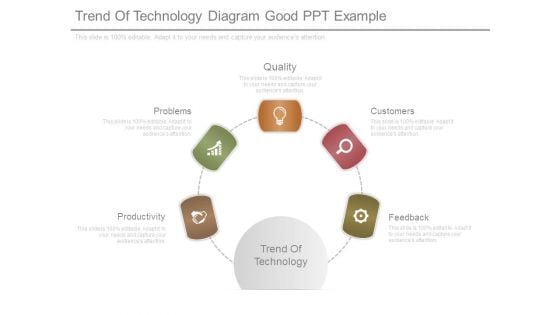
Trend Of Technology Diagram Good Ppt Example
This is a trend of technology diagram good ppt example. This is a five stage process. The stages in this process are productivity, problems, quality, customers, feedback, trend of technology.
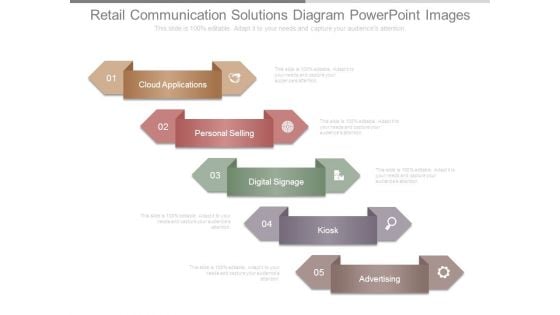
Retail Communication Solutions Diagram Powerpoint Images
This is a retail communication solutions diagram powerpoint images. This is a five stage process. The stages in this process are cloud applications, personal selling, digital signage, kiosk, advertising.
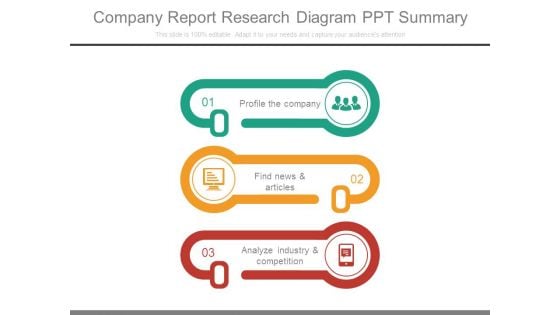
Company Report Research Diagram Ppt Summary
This is a company report research diagram ppt summary. This is a three stage process. The stages in this process are profile the company, find news and articles, analyze industry and competition.
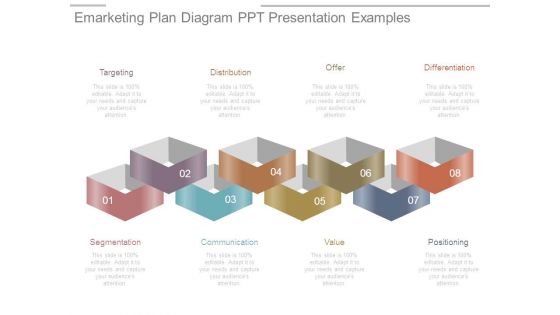
Emarketing Plan Diagram Ppt Presentation Examples
This is a emarketing plan diagram ppt presentation examples. This is a eight stage process. The stages in this process are targeting, distribution, offer, differentiation, segmentation, communication, value, positioning.
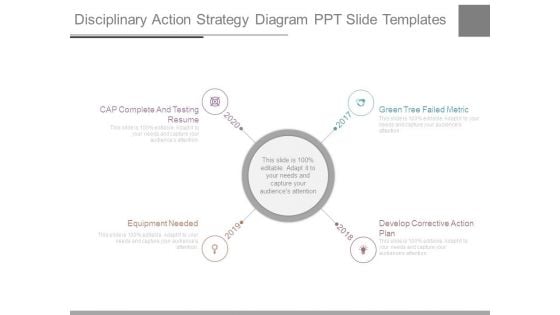
Disciplinary Action Strategy Diagram Ppt Slide Templates
This is a disciplinary action strategy diagram ppt slide templates. This is a four stage process. The stages in this process are cap complete and testing resume, equipment needed, green tree failed metric, develop corrective action plan.

Executive Team Building Exercises Diagram Presentation Images
This is a executive team building exercises diagram presentation images. This is a six stage process. The stages in this process are trust, promote, planning, build, increase, decision making.
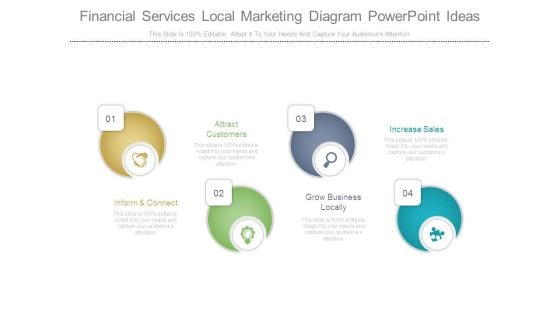
Financial Services Local Marketing Diagram Powerpoint Ideas
This is a financial services local marketing diagram powerpoint ideas. This is a four stage process. The stages in this process are inform and connect, attract customers, grow business locally, increase sales.
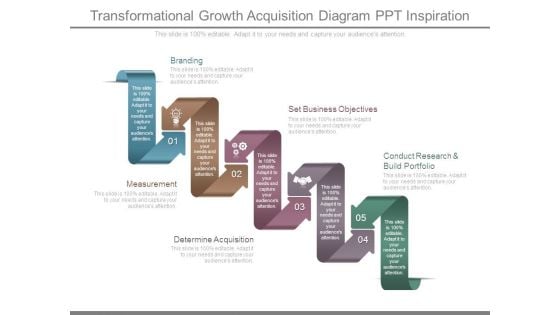
Transformational Growth Acquisition Diagram Ppt Inspiration
This is a transformational growth acquisition diagram ppt inspiration. This is a five stage process. The stages in this process are branding, set business objectives, conduct research and build portfolio, determine acquisition, measurement.
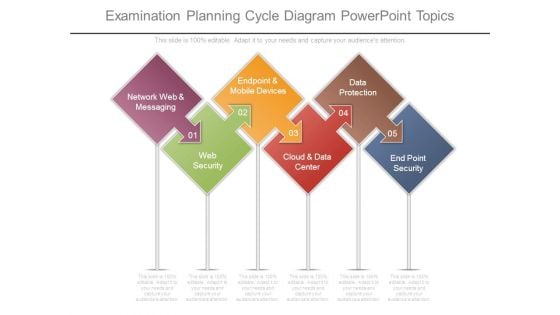
Examination Planning Cycle Diagram Powerpoint Topics
This is a examination planning cycle diagram powerpoint topics. This is a five stage process. The stages in this process are network web and messaging, web security, endpoint and mobile devices, cloud and data center, data protection, end point security.
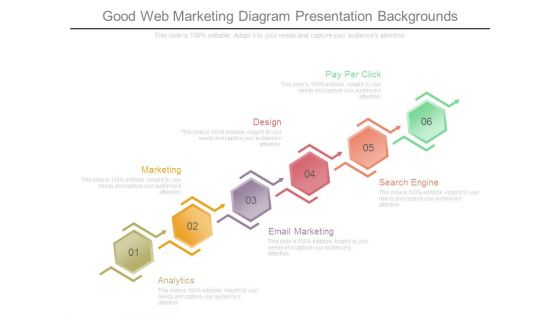
Good Web Marketing Diagram Presentation Backgrounds
This is a good web marketing diagram presentation backgrounds. This is a six stage process. The stages in this process are analytics, marketing, email marketing, design, search engine, pay per click.
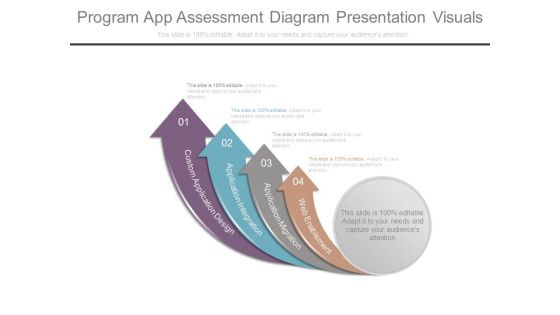
Program App Assessment Diagram Presentation Visuals
This is a program app assessment diagram presentation visuals. This is a four stage process. The stages in this process are custom application design, application integration, application migration, web enablement.
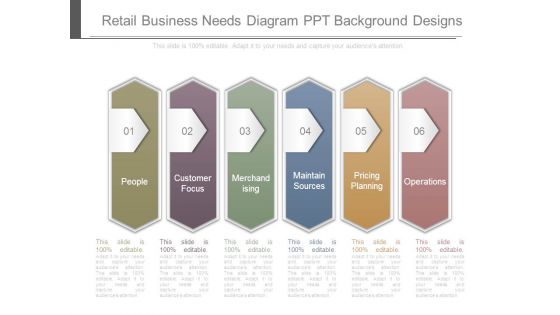
Retail Business Needs Diagram Ppt Background Designs
This is a retail business needs diagram ppt background designs. This is a six stage process. The stages in this process are people, customer focus, merchandising, maintain sources, pricing planning, operations.
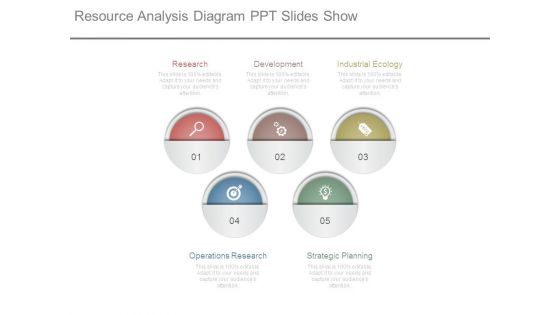
Resource Analysis Diagram Ppt Slides Show
This is a resource analysis diagram ppt slides show. This is a five stage process. The stages in this process are research, development, industrial ecology, operations research, strategic planning.
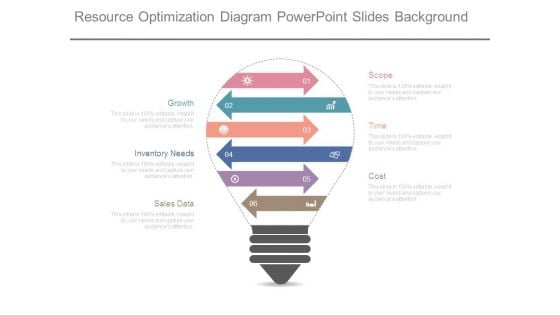
Resource Optimization Diagram Powerpoint Slides Background
This is a resource optimization diagram powerpoint slides background. This is a six stage process. The stages in this process are scope, time, cost, growth, inventory needs, sales data.
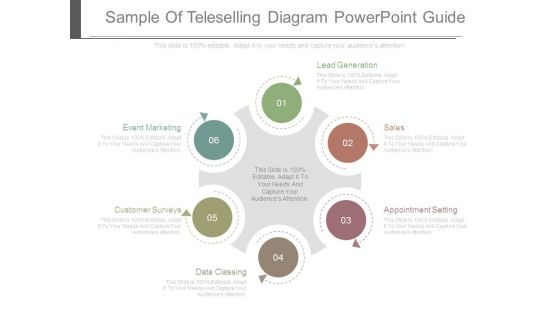
Sample Of Teleselling Diagram Powerpoint Guide
This is a sample of teleselling diagram powerpoint guide. This is a six stage process. The stages in this process are lead generation, sales, appointment setting, data classing, customer surveys, event marketing.
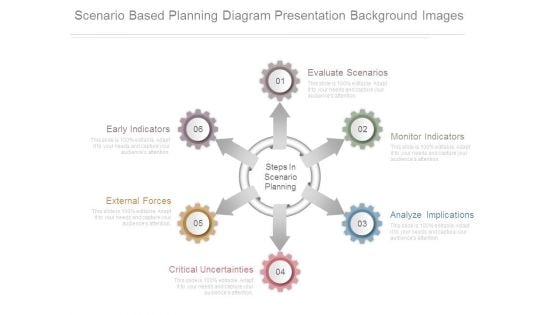
Scenario Based Planning Diagram Presentation Background Images
This is a scenario based planning diagram presentation background images. This is a six stage process. The stages in this process are evaluate scenarios, monitor indicators, analyze implications, critical uncertainties, external forces, early indicators, steps in scenario planning.
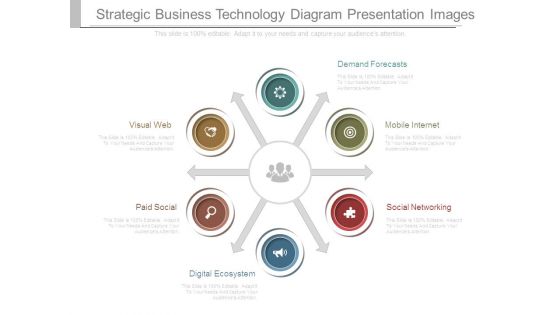
Strategic Business Technology Diagram Presentation Images
This is a strategic business technology diagram presentation images. This is a six stage process. The stages in this process are demand forecasts, mobile internet, social networking, digital ecosystem, paid social, visual web.
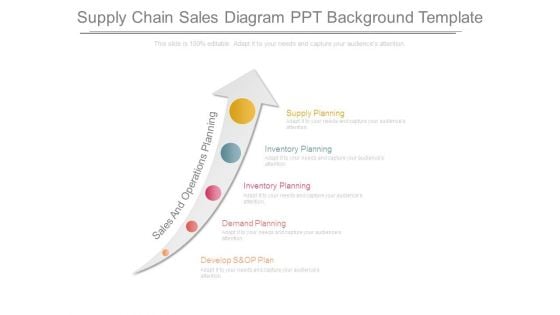
Supply Chain Sales Diagram Ppt Background Template
This is a supply chain sales diagram ppt background template. This is a one stage process. The stages in this process are sales and operations planning, supply planning, inventory planning, demand planning, develop s and op plan.
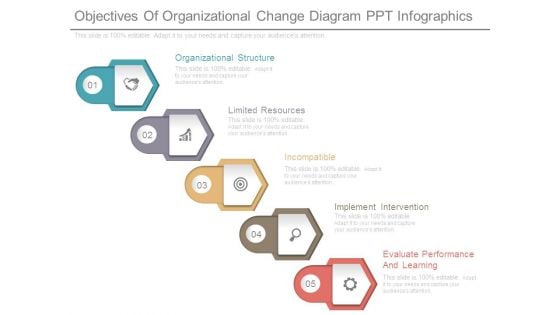
Objectives Of Organizational Change Diagram Ppt Infographics
This is a objectives of organizational change diagram ppt infographics. This is a five stage process. The stages in this process are organizational structure, limited resources, incompatible, implement intervention, evaluate performance and learning.
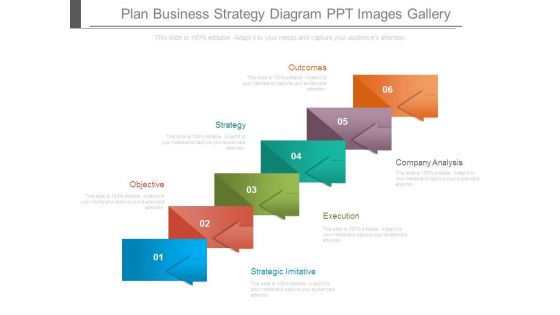
Plan Business Strategy Diagram Ppt Images Gallery
This is a plan business strategy diagram ppt images gallery. This is a six stage process. The stages in this process are outcomes, strategy, objective, company analysis, execution, strategic imitative.
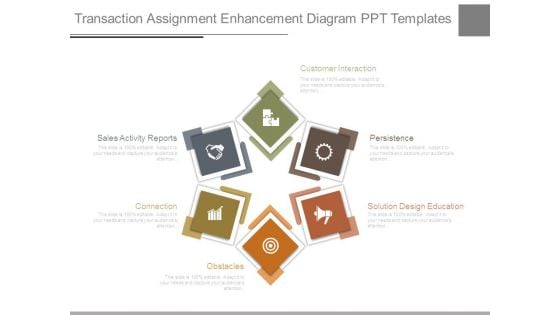
Transaction Assignment Enhancement Diagram Ppt Templates
This is a transaction assignment enhancement diagram ppt templates. This is a six stage process. The stages in this process are customer interaction, persistence, solution design education, obstacles, connection, sales activity reports.
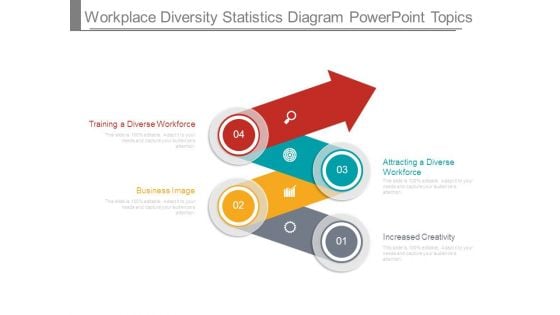
Workplace Diversity Statistics Diagram Powerpoint Topics
This is a workplace diversity statistics diagram powerpoint topics. This is a four stage process. The stages in this process are increased creativity, business image, attracting a diverse workforce, training a diverse workforce.
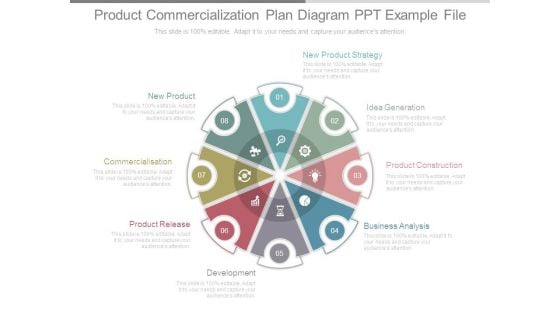
Product Commercialization Plan Diagram Ppt Example File
This is a product commercialization plan diagram ppt example file. This is a eight stage process. The stages in this process are new product, commercialisation, product release, development, new product strategy, idea generation, product construction, business analysis.
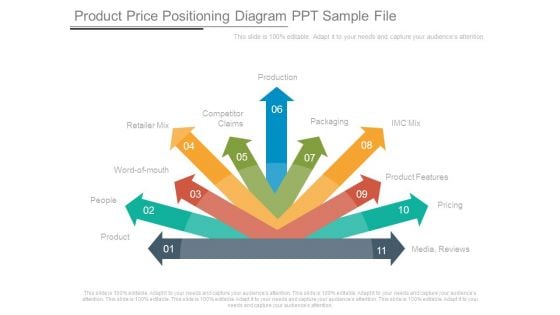
Product Price Positioning Diagram Ppt Sample File
This is a product price positioning diagram ppt sample file. This is a eleven stage process. The stages in this process are product, people, word of mouth, retailer mix, competitor claims, production, packaging, imc mix, product features, pricing, media reviews.
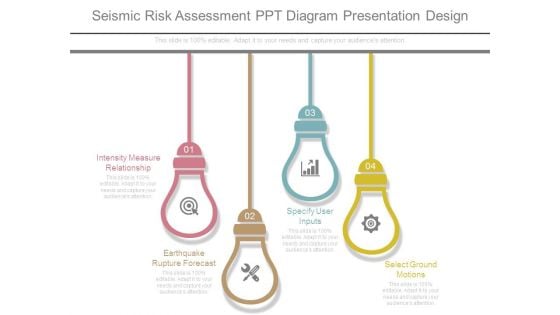
Seismic Risk Assessment Ppt Diagram Presentation Design
This is a seismic risk assessment ppt diagram presentation design. This is a four stage process. The stages in this process are intensity measure relationship, earthquake rupture forecast, specify user inputs, select ground motions.

Service Distribution Ppt Diagram Ppt Example File
This is a seo service distribution ppt diagram ppt example file. This is a seven stage process. The stages in this process are input, design, output sale, bank account credit history, merchant store, research, money collection.
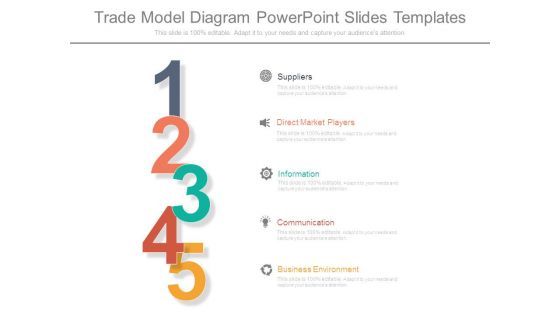
Trade Model Diagram Powerpoint Slides Templates
This is a trade model diagram powerpoint slides templates. This is a five stage process. The stages in this process are suppliers, direct market players, information, communication, business environment.
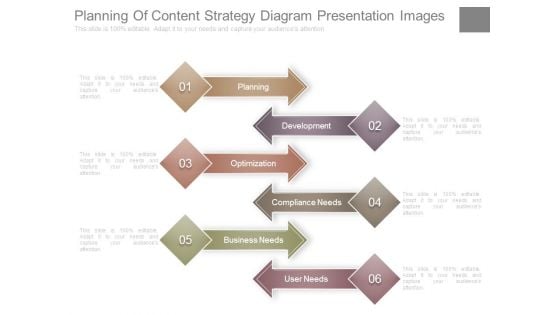
Planning Of Content Strategy Diagram Presentation Images
This is a planning of content strategy diagram presentation images. This is a six stage process. The stages in this process are planning, development, optimization, compliance needs, business needs, user needs.
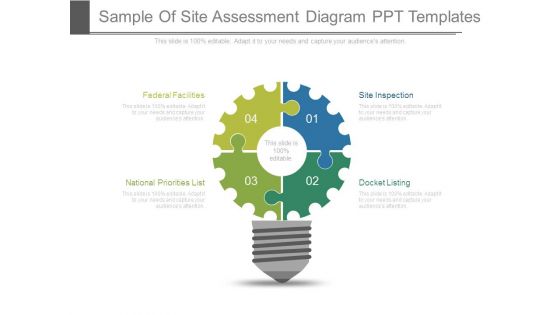
Sample Of Site Assessment Diagram Ppt Templates
This is a sample of site assessment diagram ppt templates. This is a four stage process. The stages in this process are federal facilities, national priorities list, docket listing, site inspection.
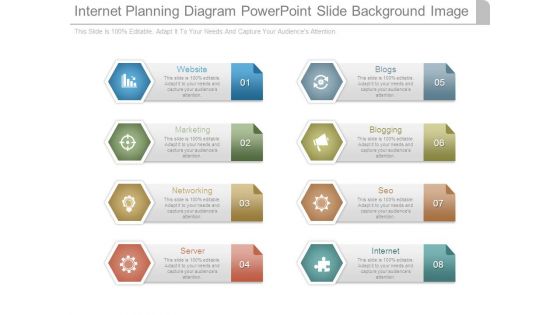
Internet Planning Diagram Powerpoint Slide Background Image
This is a internet planning diagram powerpoint slide background image. This is a eight stage process. The stages in this process are website, marketing, networking, server, blogs, blogging, seo, internet.
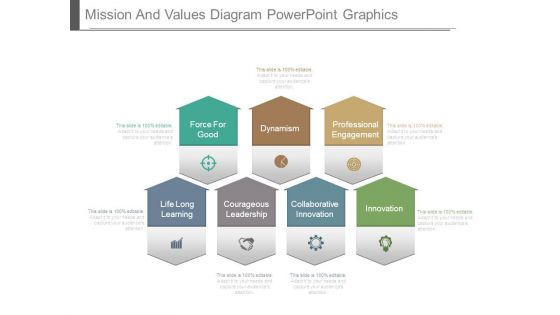
Mission And Values Diagram Powerpoint Graphics
This is a mission and values diagram powerpoint graphics. This is a seven stage process. The stages in this process are force for good, dynamism, professional engagement, life long learning, courageous leadership, collaborative innovation, innovation.
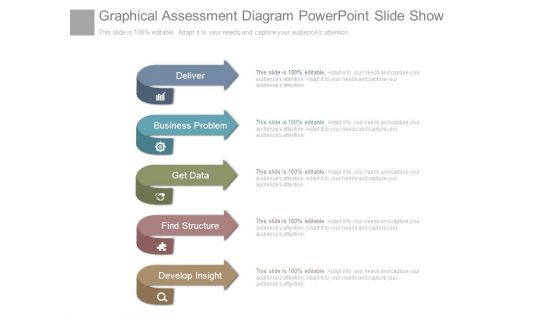
Graphical Assessment Diagram Powerpoint Slide Show
This is a graphical assessment diagram powerpoint slide show. This is a five stage process. The stages in this process are deliver, business problem, get data, find structure, develop insight.
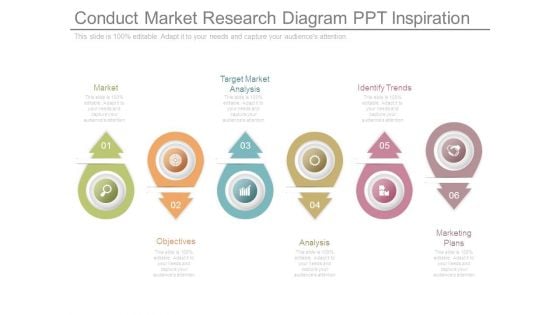
Conduct Market Research Diagram Ppt Inspiration
This is a conduct market research diagram ppt inspiration. This is a six stage process. The stages in this process are market, target market analysis, identify trends, objectives, analysis, marketing plans.
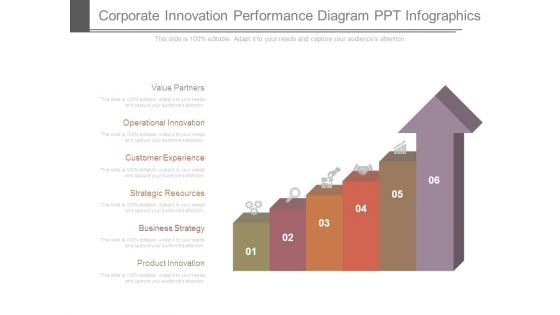
Corporate Innovation Performance Diagram Ppt Infographics
This is a corporate innovation performance diagram ppt infographics. This is a six stage process. The stages in this process are value partners, operational innovation, customer experience, strategic resources, business strategy, product innovation.
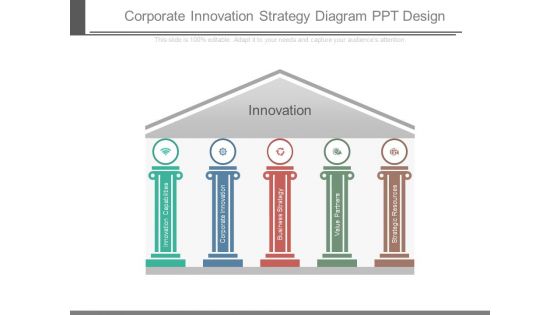
Corporate Innovation Strategy Diagram Ppt Design
This is a corporate innovation strategy diagram ppt design. This is a five stage process. The stages in this process are innovation, innovation capabilities, corporate innovation, business strategy, value partners, strategic resources.
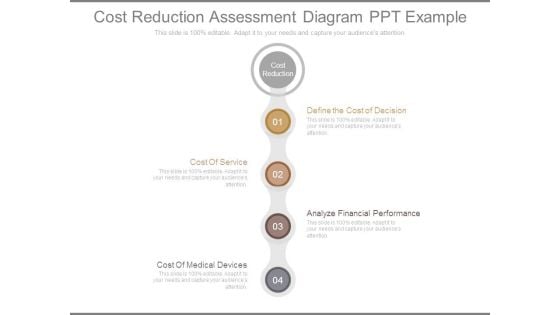
Cost Reduction Assessment Diagram Ppt Example
This is a cost reduction assessment diagram ppt example. This is a four stage process. The stages in this process are define the cost of decision, cost of service, analyze financial performance, cost of medical devices.

Market Attractiveness Diagram Powerpoint Slides Designs
This is a market attractiveness diagram powerpoint slides designs. This is a four stage process. The stages in this process are market attractiveness, attractiveness other considerations, internal attractiveness, financial and market attractiveness.
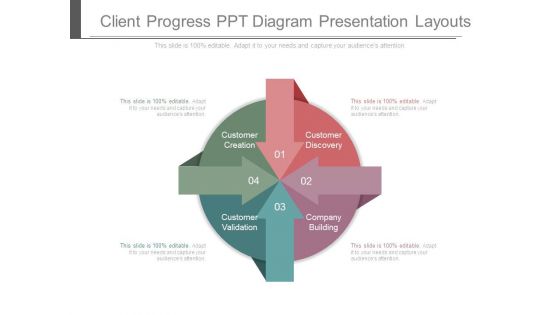
Client Progress Ppt Diagram Presentation Layouts
This is a client progress ppt diagram presentation layouts. This is a four stage process. The stages in this process are customer creation, customer validation, company building, customer discovery.
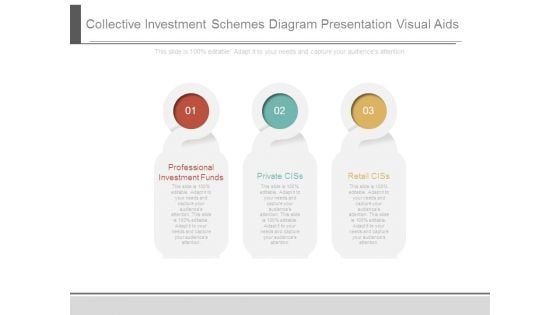
Collective Investment Schemes Diagram Presentation Visual Aids
This is a collective investment schemes diagram presentation visual aids. This is a three stage process. The stages in this process are professional investment funds, private ciss, retail ciss.
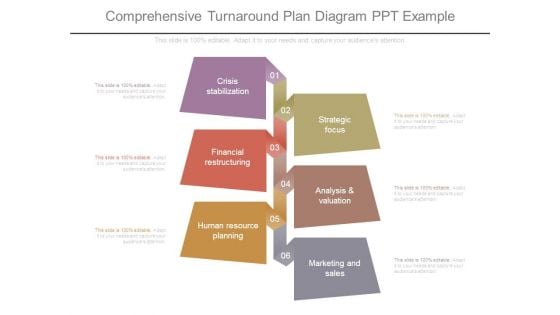
Comprehensive Turnaround Plan Diagram Ppt Example
This is a comprehensive turnaround plan diagram ppt example. This is a six stage process. The stages in this process are crisis stabilization, financial restructuring, human resource planning, strategic focus, analysis and valuation, marketing and sales.
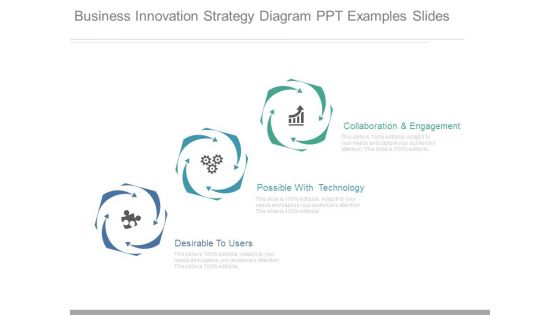
Business Innovation Strategy Diagram Ppt Examples Slides
This is a business innovation strategy diagram ppt examples slides. This is a three stage process. The stages in this process are desirable to users, possible with technology, collaboration and engagement.
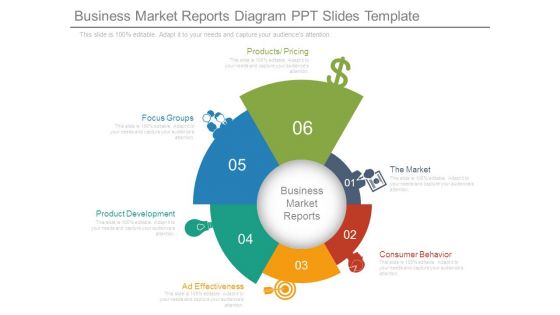
Business Market Reports Diagram Ppt Slides Template
This is a business market reports diagram ppt slides template. This is a six stage process. The stages in this process are business market reports, products pricing, the market, consumer behavior, ad effectiveness, product development, focus groups.
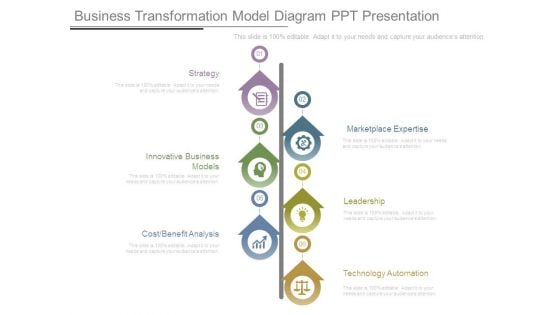
Business Transformation Model Diagram Ppt Presentation
This is a business transformation model diagram ppt presentation. This is a six stage process. The stages in this process are strategy, innovative business models, cost benefit analysis, marketplace expertise leadership, technology automation.
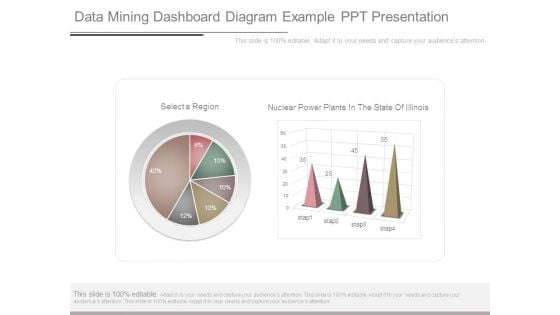
Data Mining Dashboard Diagram Example Ppt Presentation
This is a data mining dashboard diagram example ppt presentation. This is a six stage process. The stages in this process are select a region, nuclear power plants in the state of illinois.

Basic Localization Dashboard Diagram Ppt Example
This is a basic localization dashboard diagram ppt example. This is a two stage process. The stages in this process are quantity details of products sold by countries, products sold by month.
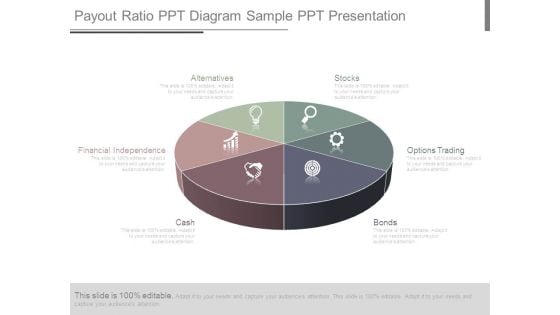
Payout Ratio Ppt Diagram Sample Ppt Presentation
This is a payout ratio ppt diagram sample ppt presentation. This is a six stage process. The stages in this process are stocks, options trading, bonds, cash, financial independence, alternatives.
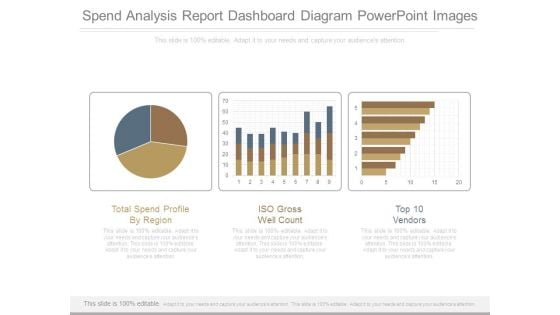
Spend Analysis Report Dashboard Diagram Powerpoint Images
This is a spend analysis report dashboard diagram powerpoint images. This is a three stage process. The stages in this process are total spend profile by region, iso gross well count, top 10 vendors.

Visual Mining Dashboard Diagram Ppt Example
This is a visual mining dashboard diagram ppt example. This is a three stage process. The stages in this process are incident costs range, incident vs incident costs, total incident cost.
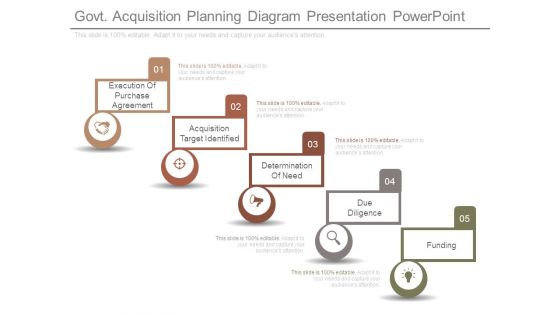
Govt Acquisition Planning Diagram Presentation Powerpoint
This is a govt acquisition planning diagram presentation powerpoint. This is a five stage process. The stages in this process are execution of purchase agreement, acquisition target identified, determination of need, due diligence, funding.
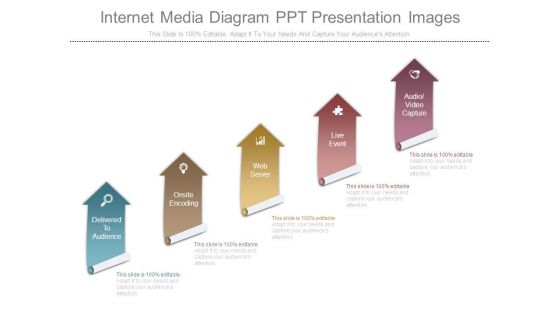
Internet Media Diagram Ppt Presentation Images
This is a internet media diagram ppt presentation images. This is a five stage process. The stages in this process are delivered to audience, onsite encoding, web server, live event, audio video capture.
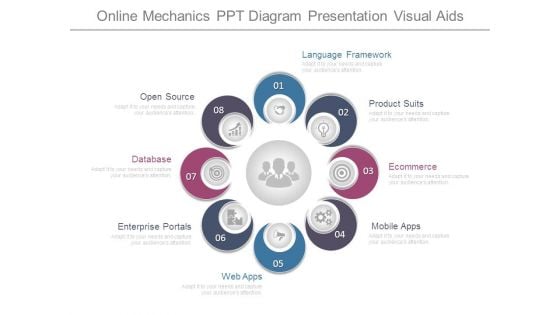
Online Mechanics Ppt Diagram Presentation Visual Aids
This is a online mechanics ppt diagram presentation visual aids. This is a eight stage process. The stages in this process are language framework, product suits, ecommerce, mobile apps, web apps, enterprise portals, database, open source.
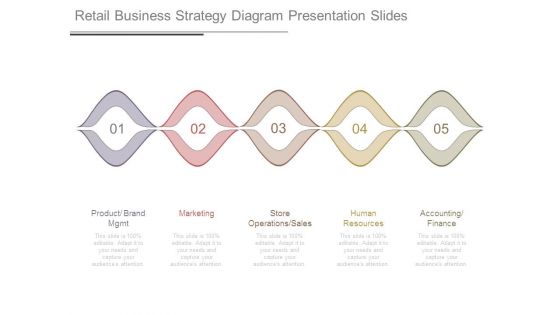
Retail Business Strategy Diagram Presentation Slides
This is a retail business strategy diagram presentation slides. This is a five stage process. The stages in this process are product brand mgmt, marketing, store operations sales, human resources, accounting finance.

Scheme Movement Diagram Powerpoint Slide Backgrounds
This is a scheme movement diagram powerpoint slide backgrounds. This is a eight stage process. The stages in this process are idea, target, execution, budget, plan, agreement, results, partnership.
Software Development Performance Metrics Diagram Ppt Slide
This is a software development performance metrics diagram ppt slide. This is a three stage process. The stages in this process are overall business strategy, situation analysis, priority setting.
Scamper Method Diagram Example Of Ppt
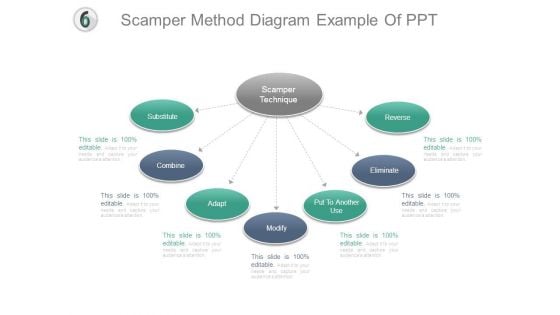
This is a scamper method diagram example of ppt. This is a seven stage process. The stages in this process are substitute, combine, adapt, modify, put to another use, eliminate, reverse, scamper technique.
Risk Reward Trading Diagram Powerpoint Slide Designs
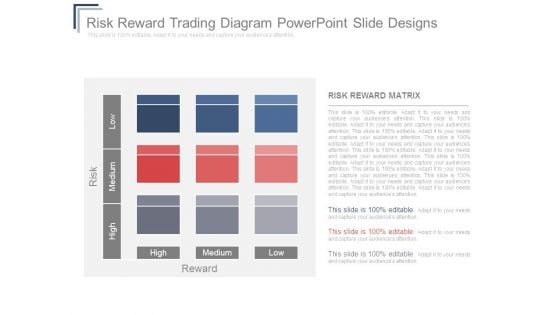
This is a risk reward trading diagram powerpoint slide designs. This is a three stage process. The stages in this process are reward, risk, high, medium, low, risk reward matrix.
Asset Allocation Decision Diagram Powerpoint Slide Influencers
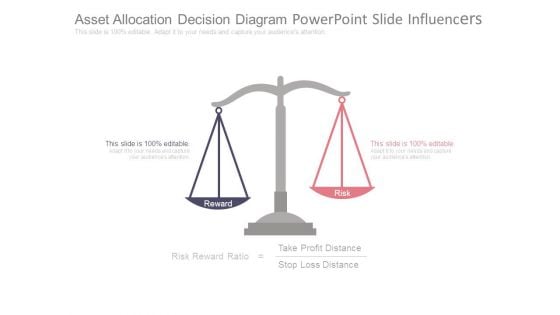
This is a asset allocation decision diagram powerpoint slide influencers. This is a two stage process. The stages in this process are risk reward ratio, take profit distance, stop loss distance, reward, risk.
Target Planning Diagram Powerpoint Slide Designs Download
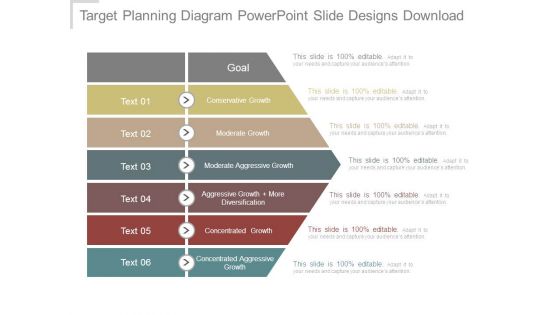
This is a target planning diagram powerpoint slide designs download. This is a six stage process. The stages in this process are goal, conservative growth, moderate growth, moderate aggressive growth, aggressive growth more diversification, concentrated growth, concentrated aggressive growth.
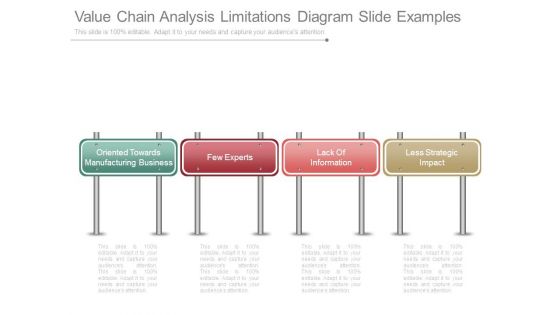
Value Chain Analysis Limitations Diagram Slide Examples
This is a value chain analysis limitations diagram slide examples. This is a four stage process. The stages in this process are oriented towards manufacturing business, few experts, lack of information, less strategic impact.

Value Chain Analysis Marketing Diagram Presentation
This is a value chain analysis marketing diagram presentation. This is a four stage process. The stages in this process are marketing activity, brand image, brand quality, economic values.
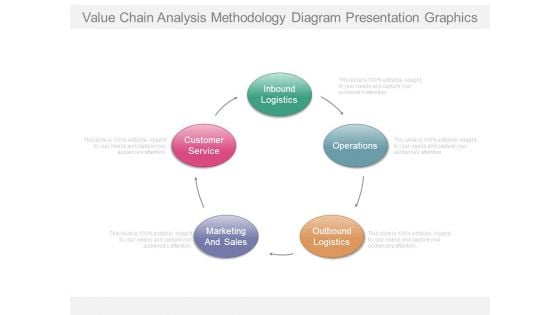
Value Chain Analysis Methodology Diagram Presentation Graphics
This is a value chain analysis methodology diagram presentation graphics. This is a five stage process. The stages in this process are customer service, marketing and sales, inbound logistics, operations, outbound logistics.
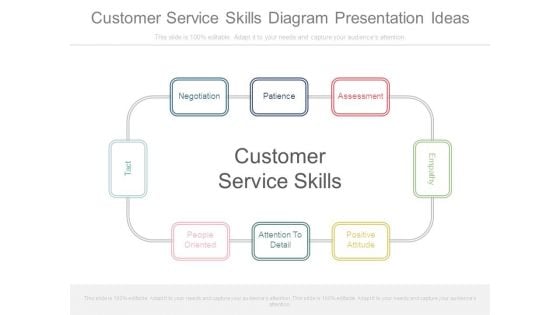
Customer Service Skills Diagram Presentation Ideas
This is a customer service skills diagram presentation ideas. This is a eight stage process. The stages in this process are people oriented, attention to detail, positive attitude, empathy, assessment, patience, negotiation, tact, customer service skills.
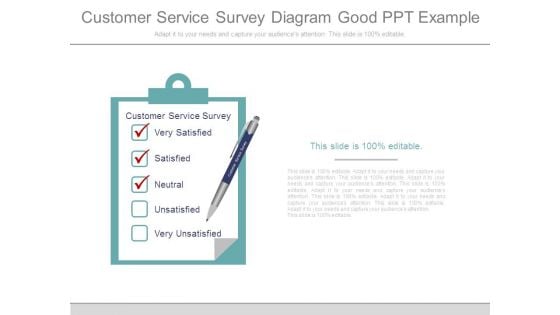
Customer Service Survey Diagram Good Ppt Example
This is a customer service survey diagram good ppt example. This is a three stage process. The stages in this process are customer service survey, very satisfied, satisfied, neutral, unsatisfied, very unsatisfied.
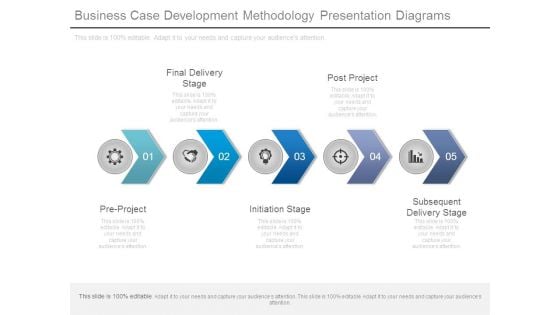
Business Case Development Methodology Presentation Diagrams
This is a business case development methodology presentation diagrams. This is a five stage process. The stages in this process are final delivery stage, post project, subsequent delivery stage, initiation stage, pre project.
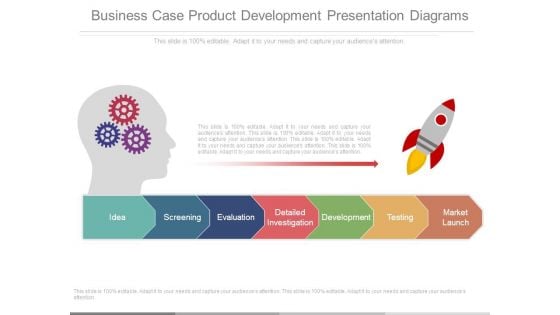
Business Case Product Development Presentation Diagrams
This is a business case product development presentation diagrams. This is a seven stage process. The stages in this process are idea, screening, evaluation, detailed investigation, development, testing, market launch.

Pricing Strategy And Tactics Diagram Presentation Powerpoint
This is a pricing strategy and tactics diagram presentation powerpoint. This is a five stage process. The stages in this process are price level, pricing policy, value communication, price structure, value creation.
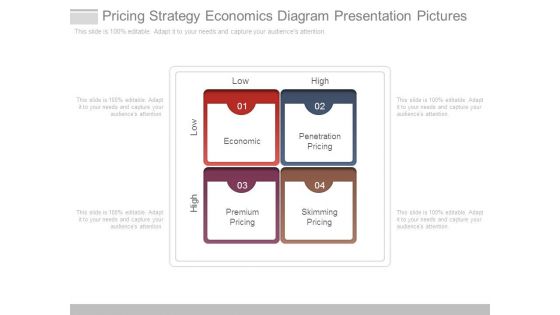
Pricing Strategy Economics Diagram Presentation Pictures
This is a pricing strategy economics diagram presentation pictures. This is a four stage process. The stages in this process are economic, penetration pricing, premium pricing, skimming pricing, high, low.
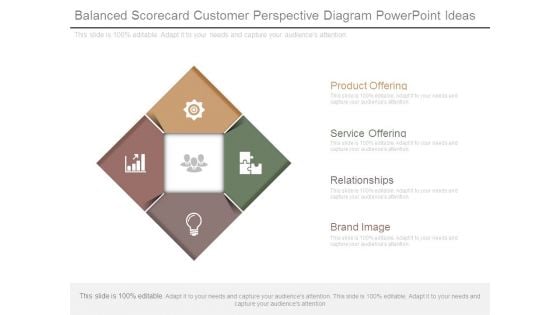
Balanced Scorecard Customer Perspective Diagram Powerpoint Ideas
This is a balanced scorecard customer perspective diagram powerpoint ideas. This is a four stage process. The stages in this process are product offering, service offering, relationships, brand image.
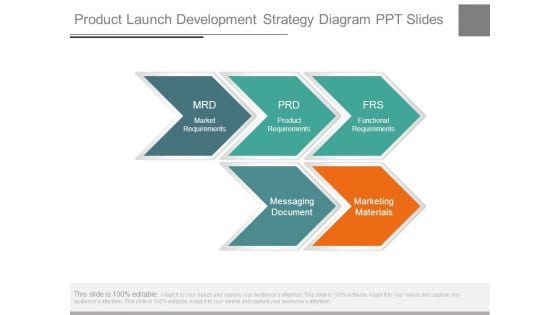
Product Launch Development Strategy Diagram Ppt Slides
This is a product launch development strategy diagram ppt slides. This is a five stage process. The stages in this process are market requirements, product requirements, functional requirements, messaging document, marketing materials.
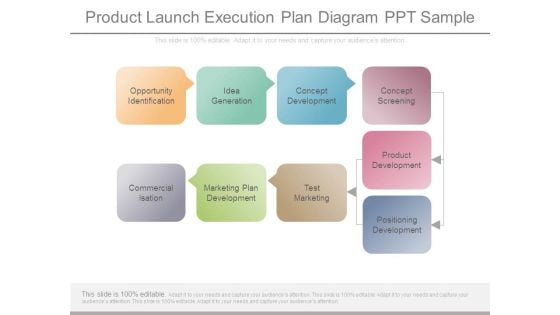
Product Launch Execution Plan Diagram Ppt Sample
This is a product launch execution plan diagram ppt sample. This is a nine stage process. The stages in this process are opportunity identification, idea generation, concept development, concept screening, product development, positioning development, commercialization, marketing plan development, test marketing.

Product Launch Strategy Report Diagram Ppt Sample
This is a product launch strategy report diagram ppt sample. This is a nine stage process. The stages in this process are target, consumer pulse, days, launch note, challenges, refine, goals, payment option, sales.
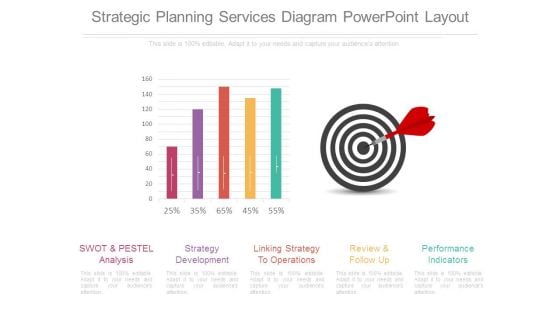
Strategic Planning Services Diagram Powerpoint Layout
This is a strategic planning services diagram powerpoint layout. This is a five stage process. The stages in this process are swot and pestel analysis, strategy development, linking strategy to operations, review and follow up, performance indicators.
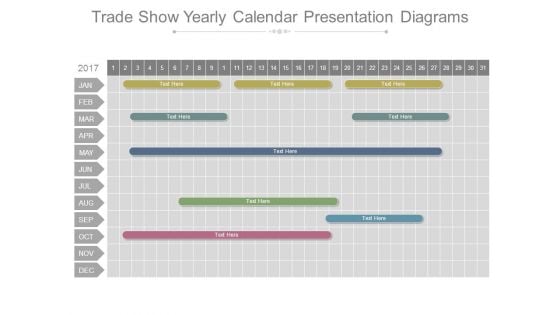
Trade Show Yearly Calendar Presentation Diagrams
This is a trade show yearly calendar presentation diagrams. This is a six stage process. The stages in this process are jan, feb, mar, apr, may, jun, jul, aug, sep, oct, nov, dec.
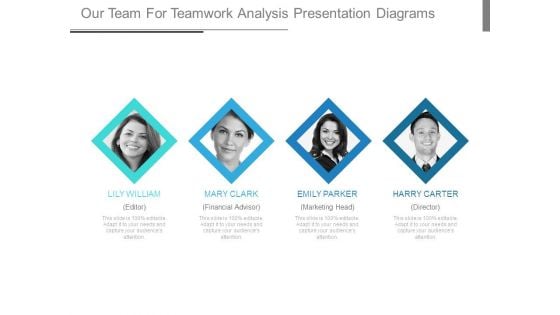
Our Team For Teamwork Analysis Presentation Diagrams
This is a our team for teamwork analysis presentation diagrams. This is a four stage process. The stages in this process are lily william editor, mary clark financial advisor, emily parker marketing head, harry carter director.
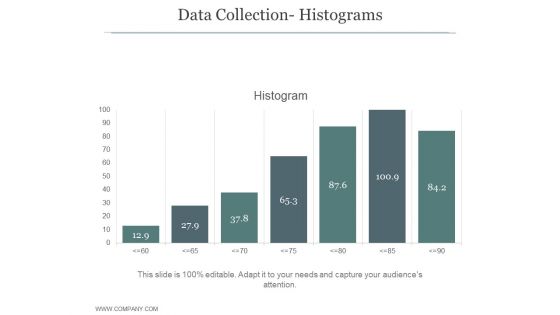
Data Collection Histograms Ppt PowerPoint Presentation Diagrams
This is a data collection histograms ppt powerpoint presentation diagrams. This is a seven stage process. The stages in this process are business, strategy, growth strategy, marketing, histogram, finance.
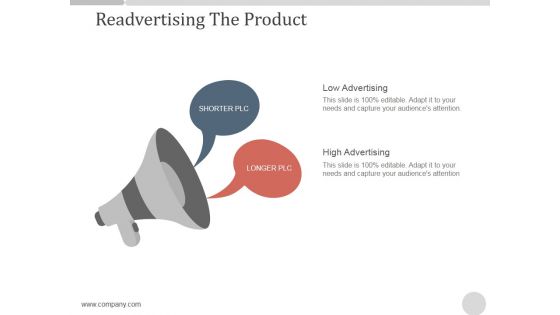
Readvertising The Product Ppt PowerPoint Presentation Diagrams
This is a readvertising the product ppt powerpoint presentation diagrams. This is a two stage process. The stages in this process are low advertising, high advertising, shorter plc, longer plc.
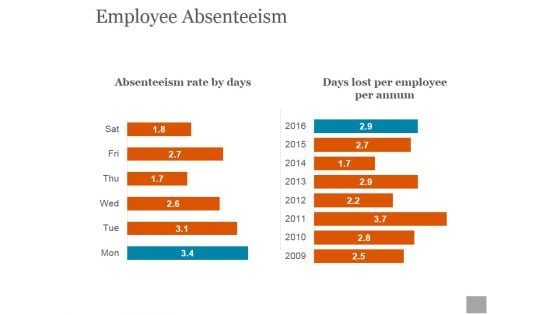
Employee Absenteeism Ppt PowerPoint Presentation Diagrams
This is a employee absenteeism ppt powerpoint presentation diagrams. This is a six stage process. The stages in this process are absenteeism rate by days, days lost per employee per annum.
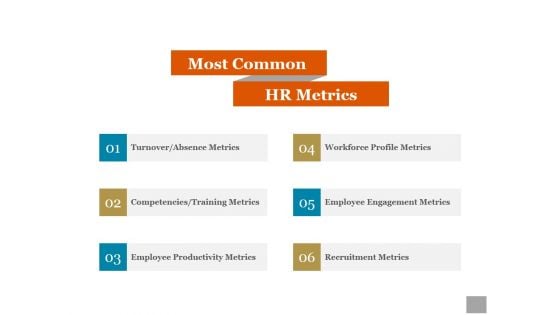
Most Common Ppt PowerPoint Presentation Diagrams
This is a most common ppt powerpoint presentation diagrams. This is a six stage process. The stages in this process are turnover absence metrics, competencies training metrics, employee productivity metrics, workforce profile metrics, employee engagement metrics, recruitment metrics.
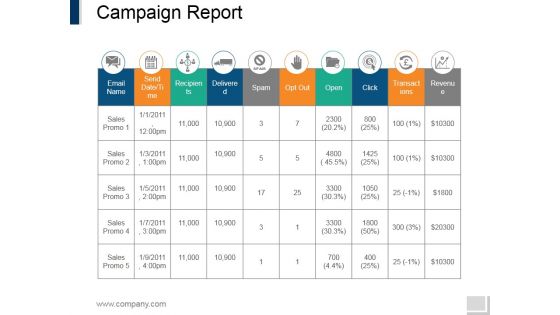
Campaign Report Ppt PowerPoint Presentation Infographics Diagrams
This is a campaign report ppt powerpoint presentation infographics diagrams. This is a nine stage process. The stages in this process are email name, send date, recipients, delivered, spam, transactions.
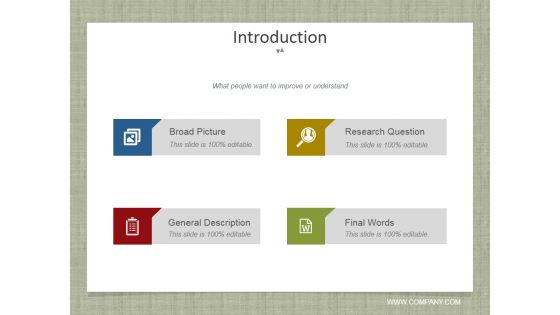
Introduction Ppt PowerPoint Presentation Model Diagrams
This is a introduction ppt powerpoint presentation model diagrams. This is a four stage process. The stages in this process are broad picture, research question, general description, final words.
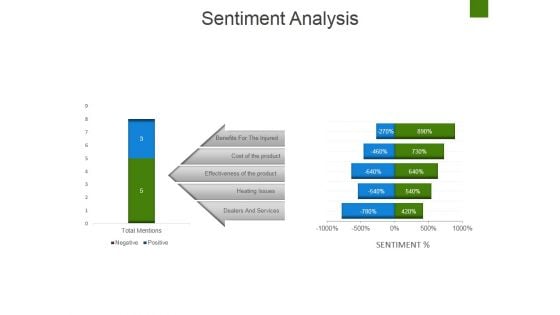
Sentiment Analysis Ppt PowerPoint Presentation Diagram Ppt
This is a sentiment analysis ppt powerpoint presentation diagram ppt. This is a two stage process. The stages in this process are benefits for the injured, cost of the product, effectiveness of the product, heating issues, dealers and services.
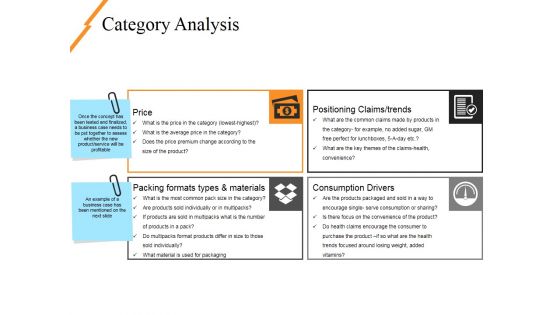
Category Analysis Ppt PowerPoint Presentation Diagram Ppt
This is a category analysis ppt powerpoint presentation diagram ppt. This is a two stage process. The stages in this process are price, positioning claims, consumption drivers, packing formats types and materials.

Thank You Ppt PowerPoint Presentation Slides Diagrams
This is a thank you ppt powerpoint presentation slides diagrams. This is a one stage process. The stages in this process are thank you, address, contact numbers, email address.
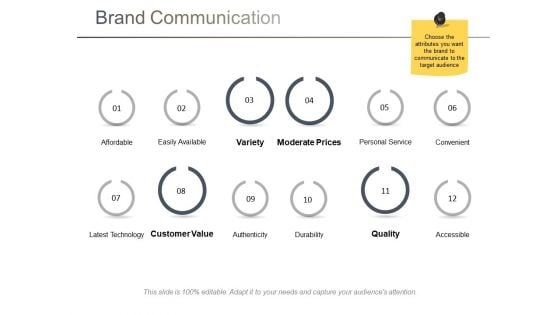
Brand Communication Ppt PowerPoint Presentation Diagram Lists
This is a brand communication ppt powerpoint presentation diagram lists. This is a twelve stage process. The stages in this process are affordable, easily available, variety, moderate prices, personal service.
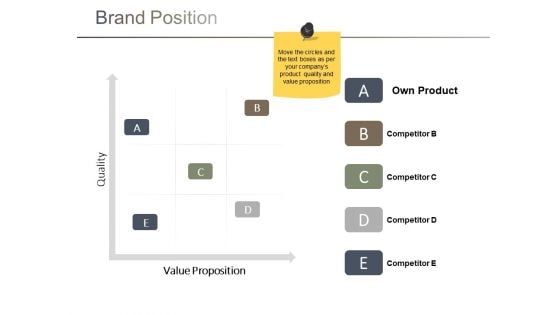
Brand Position Ppt PowerPoint Presentation Diagram Ppt
This is a brand position ppt powerpoint presentation diagram ppt. This is a five stage process. The stages in this process are quality, value proposition, own product, business, marketing.
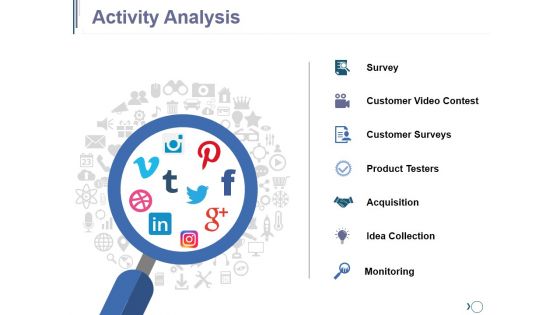
Activity Analysis Ppt PowerPoint Presentation Diagram Images
This is a activity analysis ppt powerpoint presentation diagram images. This is a one stage process. The stages in this process are survey, customer video contest, customer surveys, product testers, acquisition, idea collection.
About Us Ppt PowerPoint Presentation Inspiration Diagrams
This is a about us ppt powerpoint presentation inspiration diagrams. This is a three stage process. The stages in this process are target audiences, values client, business, planning, marketing.
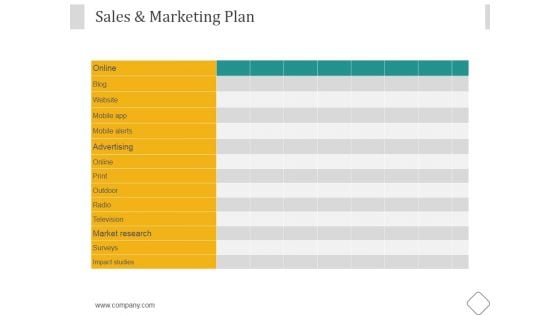
Sales And Marketing Plan Ppt PowerPoint Presentation Diagrams
This is a sales and marketing plan ppt powerpoint presentation diagrams. This is a seven stage process. The stages in this process are online, blog, website, mobile app, mobile alerts, mobile alerts.
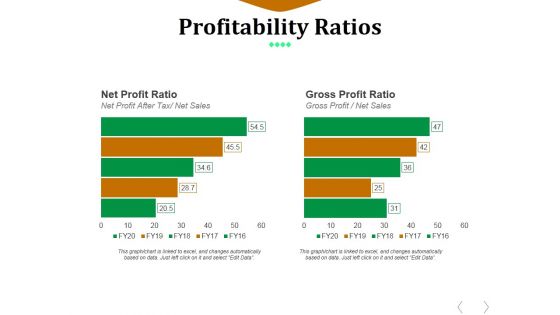
Profitability Ratios Template 2 Ppt PowerPoint Presentation Diagram Ppt
This is a profitability ratios template 2 ppt powerpoint presentation diagram ppt. This is a two stage process. The stages in this process are net profit ratio, gross profit ratio, net profit after tax, net sales.
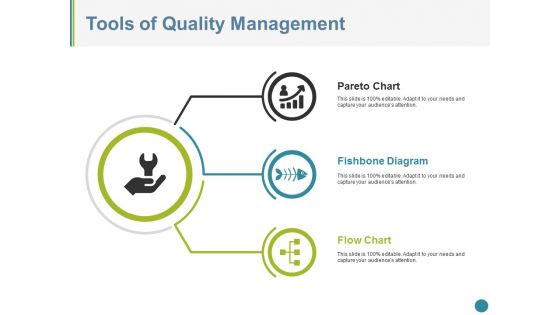
Tools Of Quality Management Ppt PowerPoint Presentation Inspiration Guide
This is a tools of quality management ppt powerpoint presentation inspiration guide. This is a three stage process. The stages in this process are pareto chart, fishbone diagram, flow chart.

Best Practices For Business Communication Strategy Ppt Powerpoint Presentation Diagrams
This is a best practices for business communication strategy ppt powerpoint presentation diagrams. This is a seven stage process. The stages in this process are human resource management, internal communication.
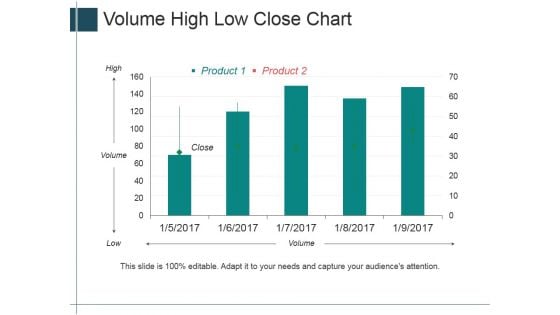
Volume High Low Close Chart Ppt PowerPoint Presentation Summary Layout Ideas
This is a volume high low close chart ppt powerpoint presentation summary layout ideas. This is a five stage process. The stages in this process are high, volume, low, close, product.
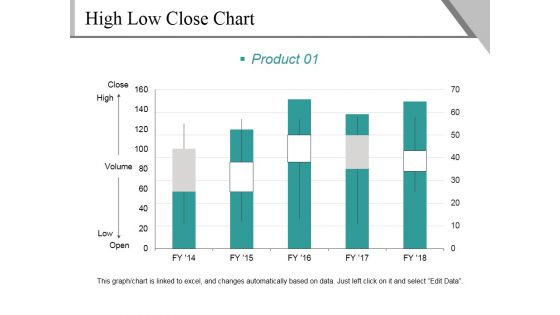
High Low Close Chart Template 1 Ppt PowerPoint Presentation Infographics Graphics Design
This is a high low close chart template 1 ppt powerpoint presentation infographics graphics design. This is a five stage process. The stages in this process are close, high, volume, low, open, product.
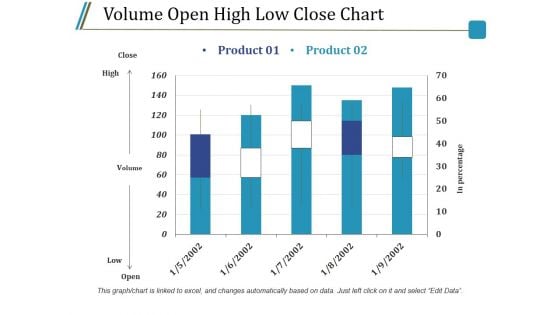
Volume Open High Low Close Chart Ppt PowerPoint Presentation Infographics Guide
This is a volume open high low close chart ppt powerpoint presentation infographics guide. This is a two stage process. The stages in this process are close, high, volume, low, open, product.
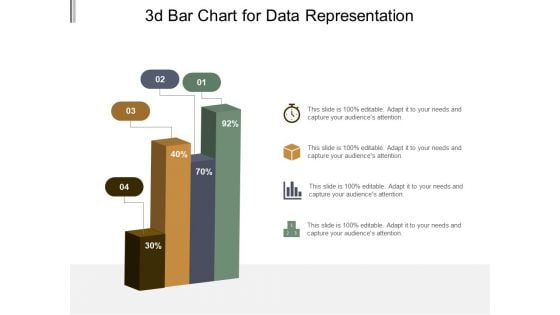
3D Bar Chart For Data Representation Ppt PowerPoint Presentation Model Graphic Tips
This is a 3d bar chart for data representation ppt powerpoint presentation model graphic tips. This is a four stage process. The stages in this process are art, colouring, paint brush.
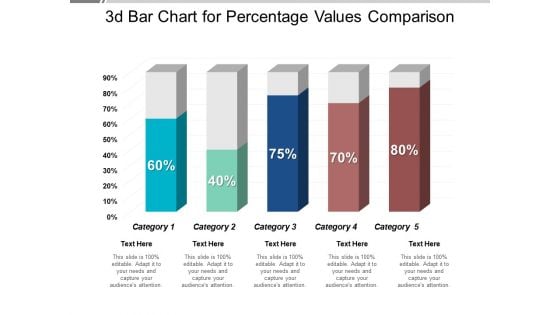
3D Bar Chart For Percentage Values Comparison Ppt PowerPoint Presentation Professional Visual Aids
This is a 3d bar chart for percentage values comparison ppt powerpoint presentation professional visual aids. This is a five stage process. The stages in this process are art, colouring, paint brush.
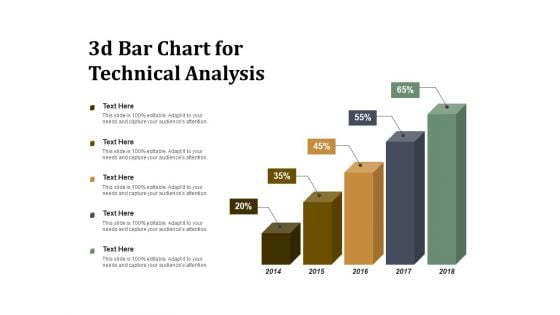
3D Bar Chart For Technical Analysis Ppt PowerPoint Presentation Summary Visuals
This is a 3d bar chart for technical analysis ppt powerpoint presentation summary visuals. This is a five stage process. The stages in this process are art, colouring, paint brush.
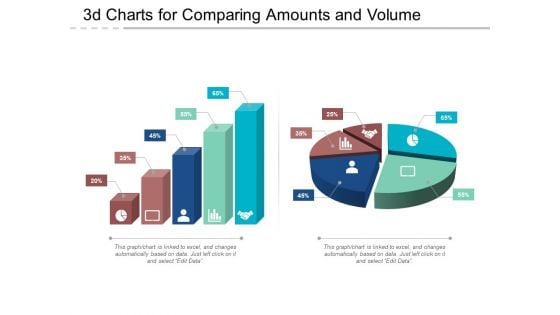
3D Charts For Comparing Amounts And Volume Ppt PowerPoint Presentation Show Deck
This is a 3d charts for comparing amounts and volume ppt powerpoint presentation show deck. This is a five stage process. The stages in this process are art, colouring, paint brush.
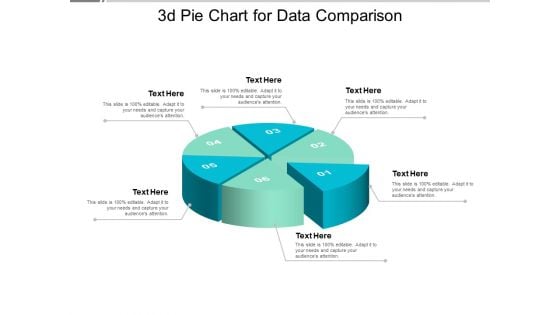
3D Pie Chart For Data Comparison Ppt PowerPoint Presentation Model Design Ideas
This is a 3d pie chart for data comparison ppt powerpoint presentation model design ideas. This is a six stage process. The stages in this process are art, colouring, paint brush.
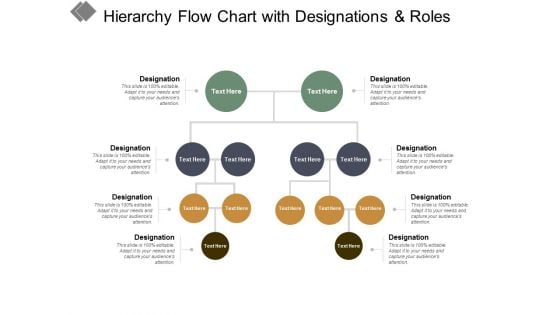
Hierarchy Flow Chart With Designations And Roles Ppt PowerPoint Presentation Styles Format Ideas
This is a hierarchy flow chart with designations and roles ppt powerpoint presentation styles format ideas. This is a four stage process. The stages in this process are business ownership, family business, owned business.
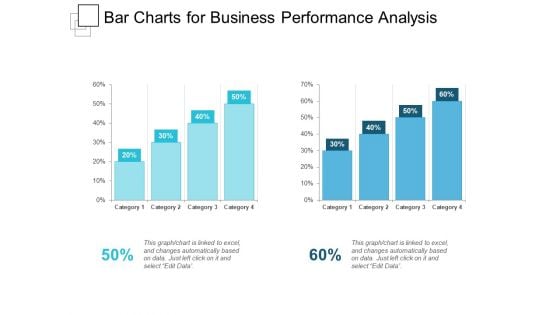
Bar Charts For Business Performance Analysis Ppt PowerPoint Presentation Show Slideshow
This is a bar charts for business performance analysis ppt powerpoint presentation show slideshow. This is a two stage process. The stages in this process are compare, comparison of two, competitive analysis.
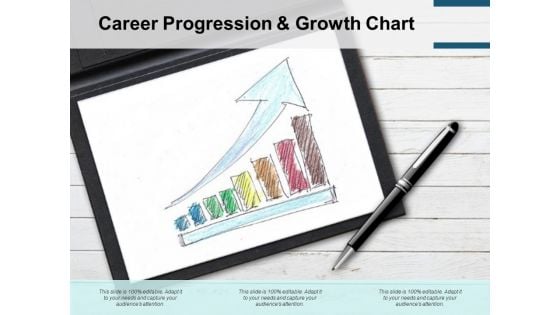
Career Progression And Growth Chart Ppt PowerPoint Presentation Professional Design Inspiration
This is a career progression and growth chart ppt powerpoint presentation professional design inspiration. This is a three stage process. The stages in this process are career progression, career aspiration, career promotion powerpoint presentation slides.
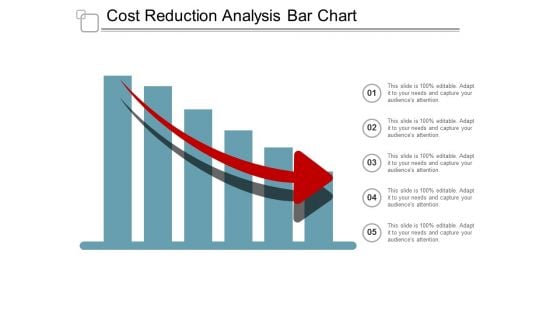
Cost Reduction Analysis Bar Chart Ppt Powerpoint Presentation File Graphics Design
This is a cost reduction analysis bar chart ppt powerpoint presentation file graphics design. This is a five stage process. The stages in this process are data analysis, data science, information science.
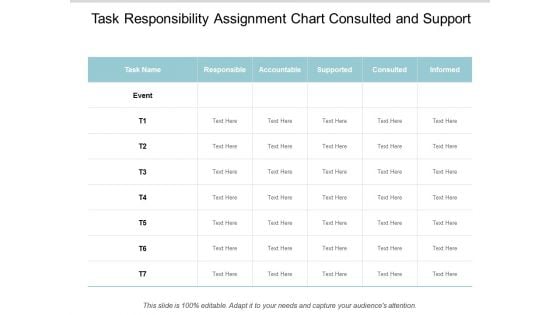
Task Responsibility Assignment Chart Consulted And Support Ppt Powerpoint Presentation Styles Background
This is a task responsibility assignment chart consulted and support ppt powerpoint presentation styles background. This is a seven stage process. The stages in this process are authority matrix, responsibility matrix, leadership matrix.
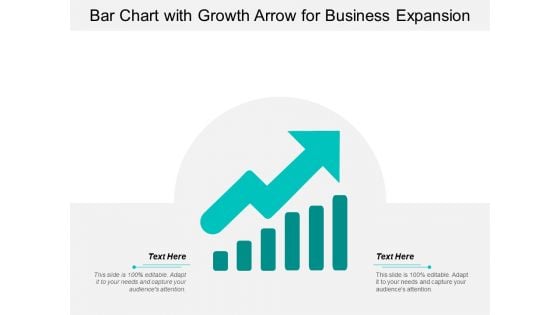
Bar Chart With Growth Arrow For Business Expansion Ppt Powerpoint Presentation File Vector
This is a bar chart with growth arrow for business expansion ppt powerpoint presentation file vector. This is a two stage process. The stages in this process are expanding, business development, business expansion.

Bar Chart With Magnifying Glass For Financial Analysis Ppt Powerpoint Presentation Infographics Designs Download
This is a bar chart with magnifying glass for financial analysis ppt powerpoint presentation infographics designs download. This is a three stage process. The stages in this process are business metrics, business kpi, business dashboard.

Business Analysis Data Charts And Reports Ppt Powerpoint Presentation Ideas Portrait
This is a business analysis data charts and reports ppt powerpoint presentation ideas portrait. This is a three stage process. The stages in this process are business metrics, business kpi, business dashboard.
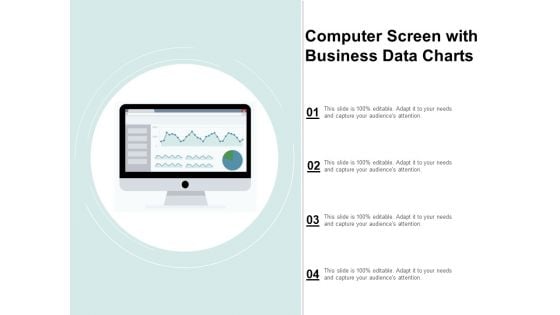
Computer Screen With Business Data Charts Ppt Powerpoint Presentation Show Vector
This is a computer screen with business data charts ppt powerpoint presentation show vector. This is a four stage process. The stages in this process are business metrics, business kpi, business dashboard.
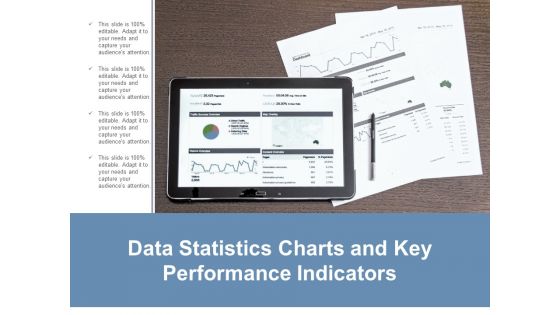
Data Statistics Charts And Key Performance Indicators Ppt Powerpoint Presentation Layouts Guide
This is a data statistics charts and key performance indicators ppt powerpoint presentation layouts guide. This is a four stage process. The stages in this process are business metrics, business kpi, business dashboard.
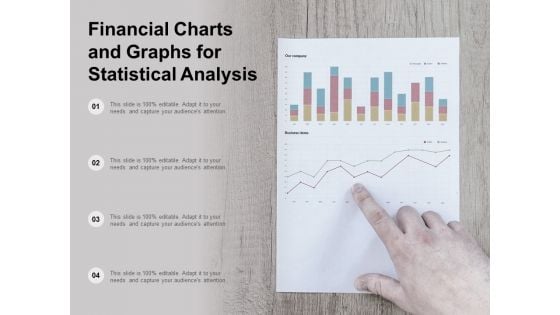
Financial Charts And Graphs For Statistical Analysis Ppt Powerpoint Presentation Show Layout
This is a financial charts and graphs for statistical analysis ppt powerpoint presentation show layout. This is a four stage process. The stages in this process are business metrics, business kpi, business dashboard.
Man Looking At Data Charts For Operation Kpi Evaluation Ppt Powerpoint Presentation Ideas Demonstration
This is a man looking at data charts for operation kpi evaluation ppt powerpoint presentation ideas demonstration. This is a four stage process. The stages in this process are business metrics, business kpi, business dashboard.
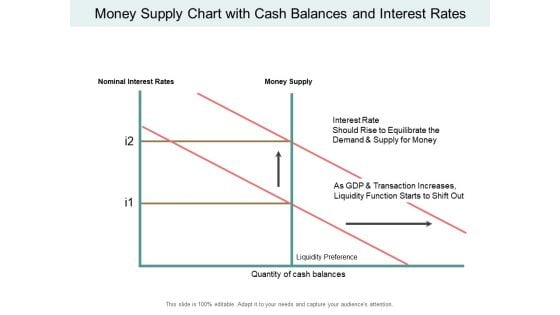
Money Supply Chart With Cash Balances And Interest Rates Ppt PowerPoint Presentation Inspiration Background Images
This is a money supply chart with cash balances and interest rates ppt powerpoint presentation inspiration background images. This is a two stage process. The stages in this process are liquidity, cash assets, solvency.
Market Performance Analysis Data Chart With Arrow Ppt PowerPoint Presentation Inspiration Graphics
This is a market performance analysis data chart with arrow ppt powerpoint presentation inspiration graphics. This is a four stage process. The stages in this process are marketing analytics, marketing performance, marketing discovery.
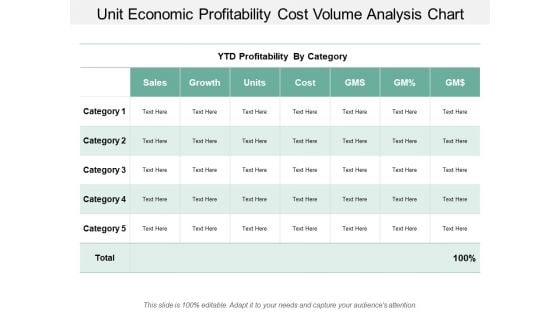
Unit Economic Profitability Cost Volume Analysis Chart Ppt PowerPoint Presentation Styles Graphics Design
This is a unit economic profitability cost volume analysis chart ppt powerpoint presentation styles graphics design. This is a five stage process. The stages in this process are business unit profitability, profitable organization, corporate unit profitability.
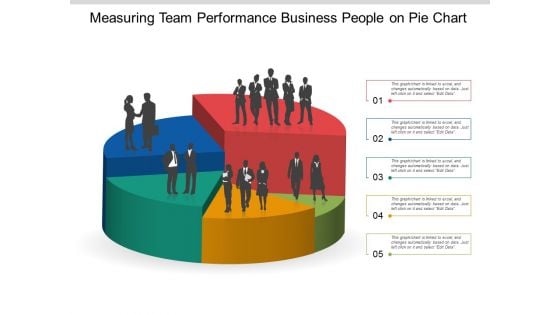
Measuring Team Performance Business People On Pie Chart Ppt Powerpoint Presentation Gallery Smartart
This is a measuring team performance business people on pie chart ppt powerpoint presentation gallery smartart. This is a five stage process. The stages in this process are team performance, member performance, group performance.
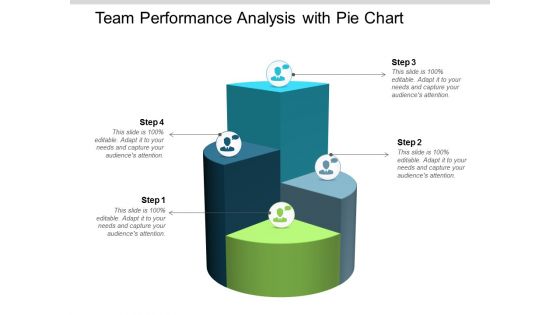
Team Performance Analysis With Pie Chart Ppt Powerpoint Presentation Infographic Template Slideshow
This is a team performance analysis with pie chart ppt powerpoint presentation infographic template slideshow. This is a four stage process. The stages in this process are team performance, member performance, group performance.

Comparison Chart Return On Capital Employed Ppt PowerPoint Presentation Portfolio Templates
This is a comparison chart return on capital employed ppt powerpoint presentation portfolio templates. This is a two stage process. The stages in this process are accounting ratio, roce, return on capital employed.
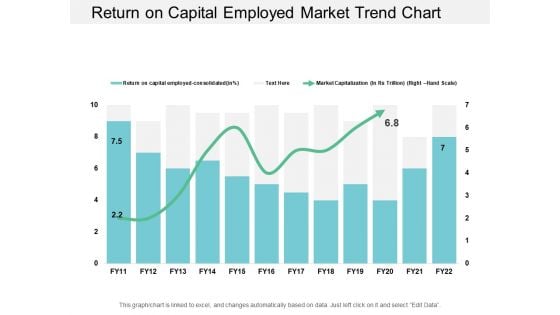
Return On Capital Employed Market Trend Chart Ppt PowerPoint Presentation Styles Examples
This is a return on capital employed market trend chart ppt powerpoint presentation styles examples. This is a two stage process. The stages in this process are accounting ratio, roce, return on capital employed.
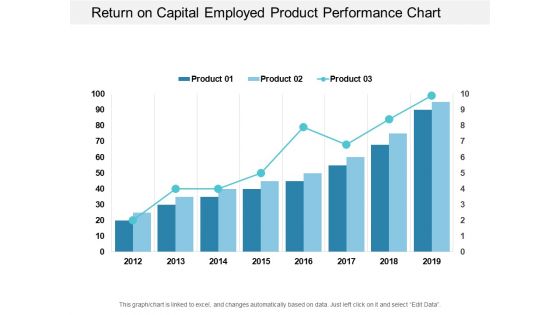
Return On Capital Employed Product Performance Chart Ppt PowerPoint Presentation Portfolio Visuals
This is a return on capital employed product performance chart ppt powerpoint presentation portfolio visuals. This is a three stage process. The stages in this process are accounting ratio, roce, return on capital employed.
Project Screen With Graphs And Charts For Visual Presentation Ppt PowerPoint Presentation Gallery Design Inspiration
This is a project screen with graphs and charts for visual presentation ppt powerpoint presentation gallery design inspiration. This is a four stage process. The stages in this process are visual aids, communication, business.
Visual Data Presentation With Bar Chart Ppt PowerPoint Presentation Portfolio Brochure
This is a visual data presentation with bar chart ppt powerpoint presentation portfolio brochure. This is a four stage process. The stages in this process are visual aids, communication, business.
Financial Success Arrow On Bar Chart Ppt PowerPoint Presentation Ideas Display
This is a financial success arrow on bar chart ppt powerpoint presentation ideas display. This is a four stage process. The stages in this process are rising arrow, growing arrow, increasing arrow.
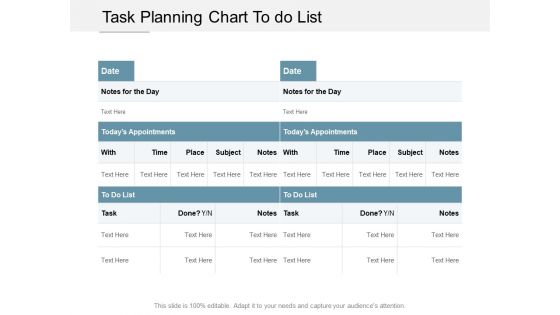
Task Planning Chart To Do List Ppt PowerPoint Presentation Infographics Picture Cpb
This is a task planning chart to do list ppt powerpoint presentation infographics picture cpb. This is a three stage process. The stages in this process are key activities, key highlights, list of activities.
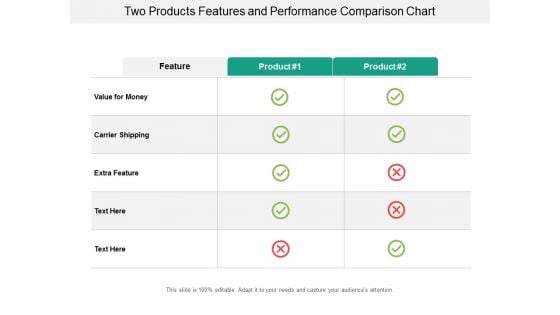
Two Products Features And Performance Comparison Chart Ppt Powerpoint Presentation Ideas Layout Ideas
This is a two products features and performance comparison chart ppt powerpoint presentation ideas layout ideas. This is a two stage process. The stages in this process are product differentiation, product comparison, brand differentiation.

Cause And Effect Diagram Fishbone Diagram Ppt PowerPoint Presentation Layouts Designs Download
This is a cause and effect diagram fishbone diagram ppt powerpoint presentation layouts designs download. This is a three stage process. The stages in this process are measurement, materials, method, environment, manpower, machine.

Pricing And Plan For Products And Services Ppt PowerPoint Presentation Themes
This is a pricing and plan for products and services ppt powerpoint presentation themes. This is a four stage process. The stages in this process are sales, business, marketing, product plan, service.
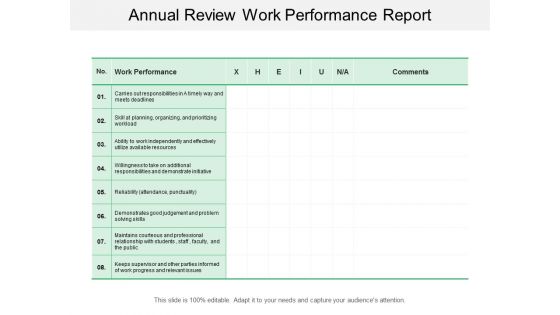
Annual Review Work Performance Report Ppt Powerpoint Presentation Styles Diagrams
This is a annual review work performance report ppt powerpoint presentation styles diagrams. This is a eight stage process. The stages in this process are year end review, annual review, yearly review.
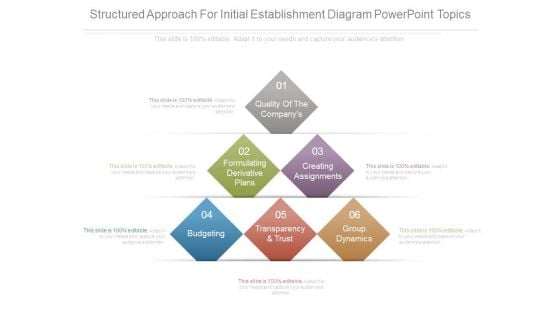
Structured Approach For Initial Establishment Diagram Powerpoint Topics
This is a structured approach for initial establishment diagram powerpoint topics. This is a six stage process. The stages in this process are quality of the company s, formulating derivative plans, creating assignments, budgeting, transparency and trust, group dynamics.
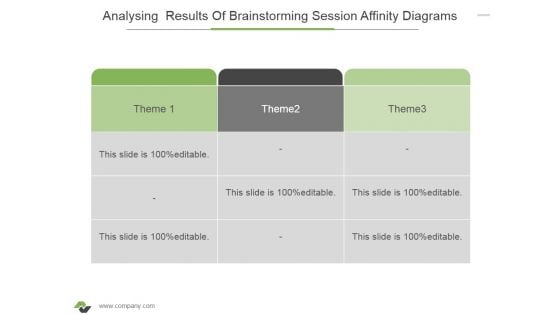
Analysing Results Of Brainstorming Session Affinity Diagrams Ppt PowerPoint Presentation Ideas Mockup
This is a analysing results of brainstorming session affinity diagrams ppt powerpoint presentation ideas mockup. This is a three stage process. The stages in this process are business, marketing, management, table, theme.

Key Elements Of Customer Service Essentials Diagram Example Of Ppt
This is a key elements of customer service essentials diagram example of ppt. This is a six stage process. The stages in this process are reliability, tangibles, assurance, customer, delight, loyalty.
Elevator Pitch Template 3 Ppt PowerPoint Presentation Diagrams
This is a elevator pitch template 3 ppt powerpoint presentation diagrams. This is a one stage process. The stages in this process are business, marketing, management, elevator pitch, information.
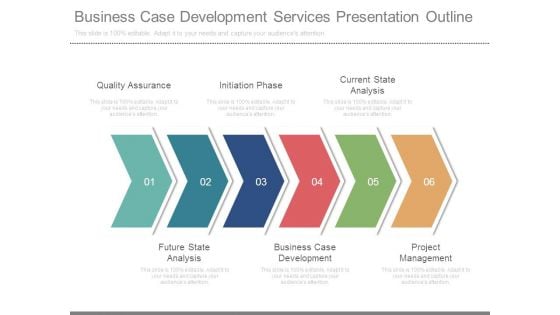
Business Case Development Services Presentation Outline
This is a business case development services presentation outline. This is a six stage process. The stages in this process are quality assurance, initiation phase, current state analysis, project management, business case development, future state analysis.
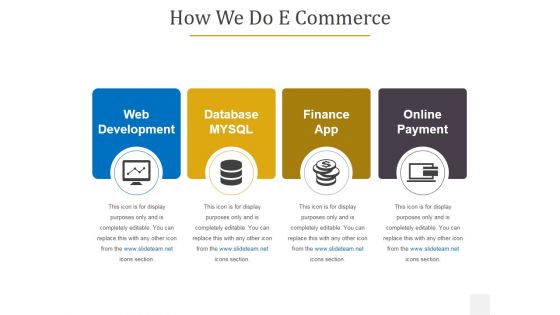
How We Do E Commerce Ppt PowerPoint Presentation Summary Diagrams
This is a how we do e commerce ppt powerpoint presentation summary diagrams. This is a four stage process. The stages in this process are web development, database mysql, finance app, online payment.
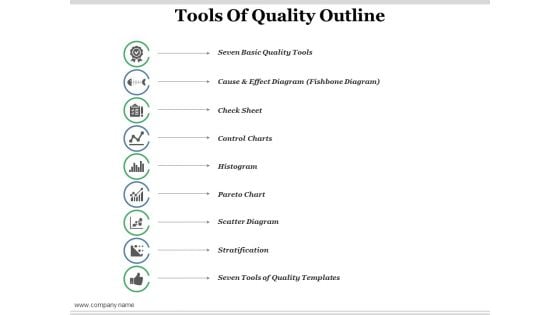
Tools Of Quality Outline Ppt PowerPoint Presentation Summary Introduction
This is a tools of quality outline ppt powerpoint presentation summary introduction. This is a nine stage process. The stages in this process are stratification, scatter diagram, histogram, control charts, seven basic quality tools.
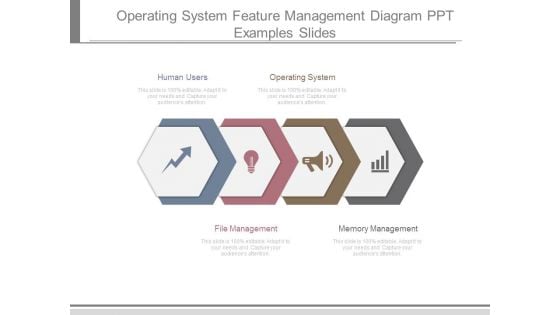
Operating System Feature Management Diagram Ppt Examples Slides
This is a operating system feature management diagram ppt examples slides. This is a four stage process. The stages in this process are human users, operating system, file management, memory management.
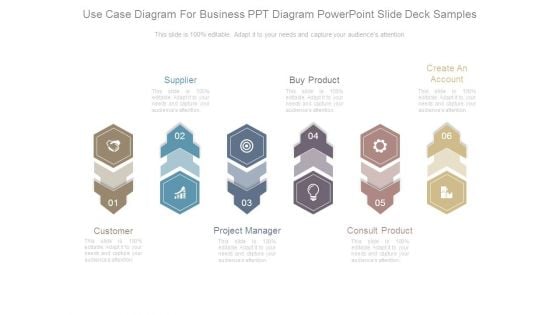
Use Case Diagram For Business Ppt Diagram Powerpoint Slide Deck Samples
This is a use case diagram for business ppt diagram powerpoint slide deck samples. This is a six stage process. The stages in this process are supplier, buy product, create an account, customer, project manager, consult product.
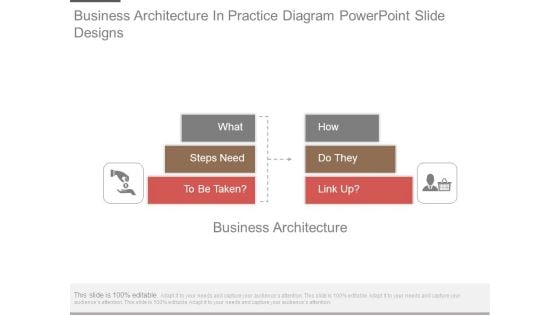
Business Architecture In Practice Diagram Powerpoint Slide Designs
This is a business architecture in practice diagram powerpoint slide designs. This is a six stage process. The stages in this process are what, steps need, to be taken, how, do they, link up.
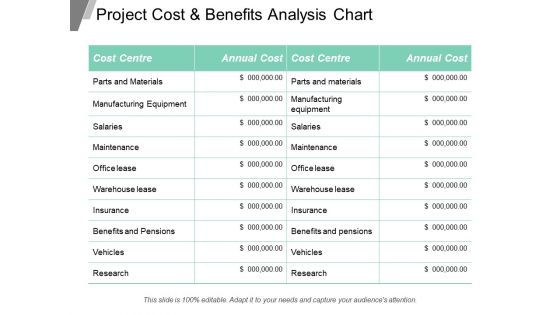
Project Cost And Benefits Analysis Chart Ppt Powerpoint Presentation Inspiration Slideshow
This is a balance scale with cost and benefits ppt powerpoint presentation show. This is a two stage process. The stages in this process are business, finance, marketing, strategy, compare, management.

Asset Inventory Management System Sample Diagram Powerpoint Show
This is a asset inventory management system sample diagram powerpoint show. This is a seven stage process. The stages in this process are customers manager, employee sales, products sale, product inventory, suppliers manager, rma and rtv, products purchase.
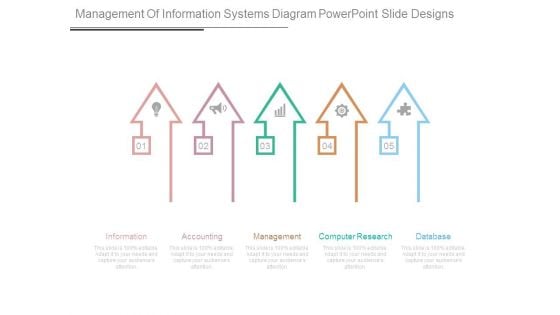
Management Of Information Systems Diagram Powerpoint Slide Designs
This is a management of information systems diagram powerpoint slide designs. This is a five stage process. The stages in this process are information, accounting, management, computer research, database.
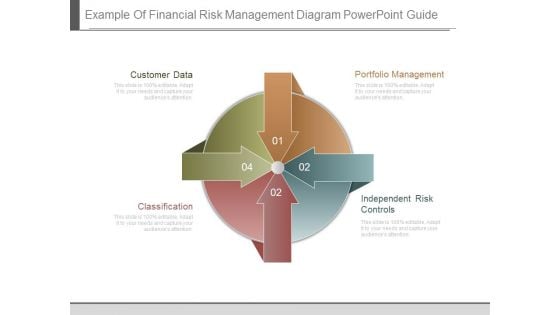
Example Of Financial Risk Management Diagram Powerpoint Guide
This is a example of financial risk management diagram powerpoint guide. This is a four stage process. The stages in this process are customer data, portfolio management, classification, independent risk controls.
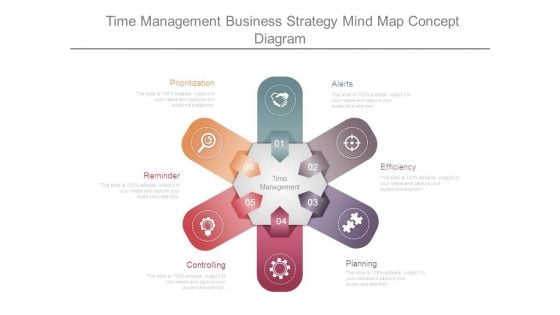
Time Management Business Strategy Mind Map Concept Diagram
This is a time management business strategy mind map concept diagram. This is a six stage process. The stages in this process are prioritization, alerts, efficiency, planning, controlling, reminder, time management.
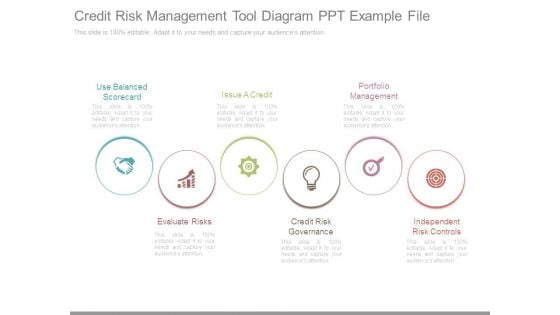
Credit Risk Management Tool Diagram Ppt Example File
This is a credit risk management tool diagram ppt example file. This is a six stage process. The stages in this process are use balanced scorecard, issue a credit, portfolio management, evaluate risks, credit risk governance, independent risk controls.
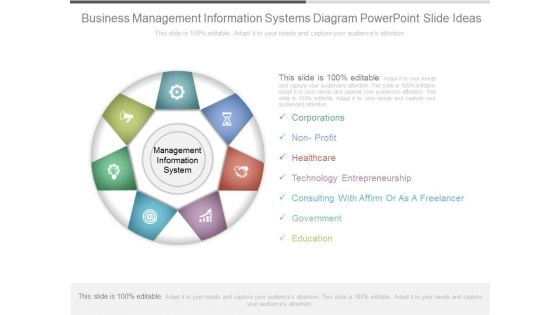
Business Management Information Systems Diagram Powerpoint Slide Ideas
This is a business management information systems diagram powerpoint slide ideas. This is a seven stage process. The stages in this process are corporations, non profit, healthcare, technology entrepreneurship, consulting with affirm or as a freelancer, government, education.
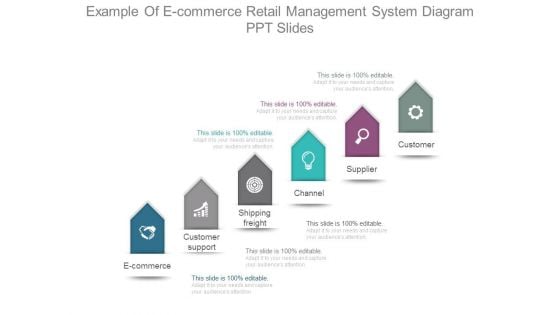
Example Of E Commerce Retail Management System Diagram Ppt Slides
This is a example of e commerce retail management system diagram ppt slides. This is a six stage process. The stages in this process are customer, supplier, channel, shipping freight, customer support, e commerce.
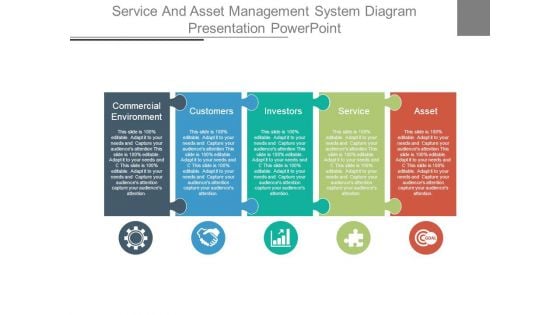
Service And Asset Management System Diagram Presentation Powerpoint
This is a service and asset management system diagram presentation powerpoint. This is a five stage process. The stages in this process are commercial environment, customers, investors, service, asset.
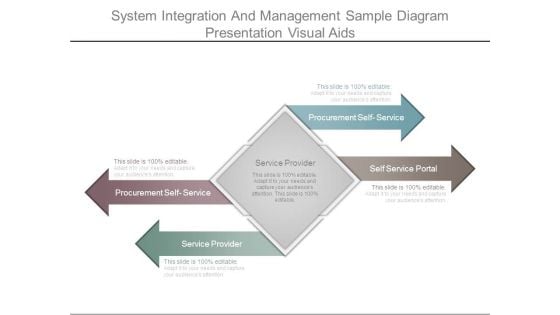
System Integration And Management Sample Diagram Presentation Visual Aids
This is a system integration and management sample diagram presentation visual aids. This is a four stage process. The stages in this process are procurement self service, service provider, self service portal.
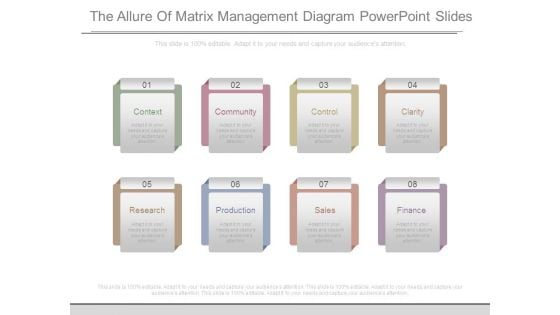
The Allure Of Matrix Management Diagram Powerpoint Slides
This is a the allure of matrix management diagram powerpoint slides. This is a eight stage process. The stages in this process are context, community, control, clarity, research, production, sales, finance.
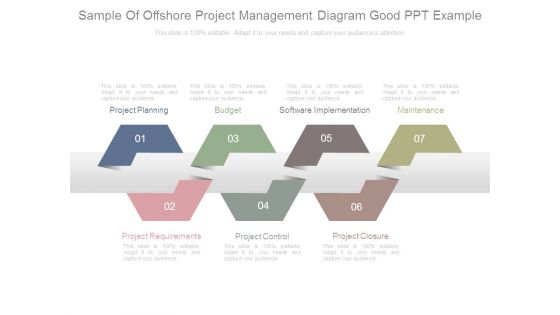
Sample Of Offshore Project Management Diagram Good Ppt Example
This is a sample of offshore project management diagram good ppt example. This is a seven stage process. The stages in this process are project planning, budget, software implementation, maintenance, project requirements, project control, project closure.

5 Steps Procedure Magnifying Glass Ppt PowerPoint Presentation Diagrams
This is a 5 steps procedure magnifying glass ppt powerpoint presentation diagrams. This is a five stage process. The stages in this process are technology, business, marketing, communication, success.
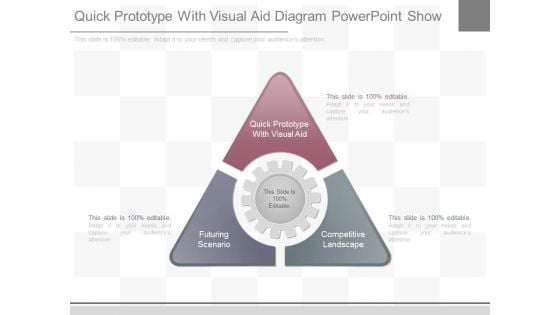
Quick Prototype With Visual Aid Diagram Powerpoint Show
This is a quick prototype with visual aid diagram powerpoint show. This is a three stage process. The stages in this process are quick prototype with visual aid, futuring scenario, competitive landscape.
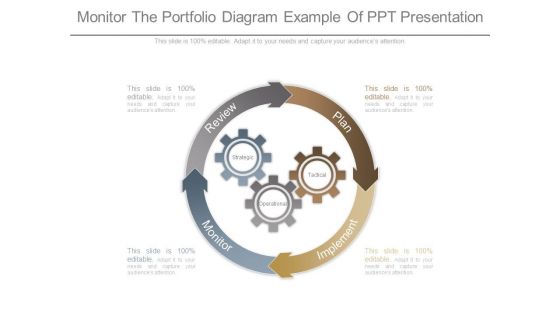
Monitor The Portfolio Diagram Example Of Ppt Presentation
This is a monitor the portfolio diagram example of ppt presentation. This is a four stage process. The stages in this process are review, plan, implement, monitor, strategic, operational, tactical.
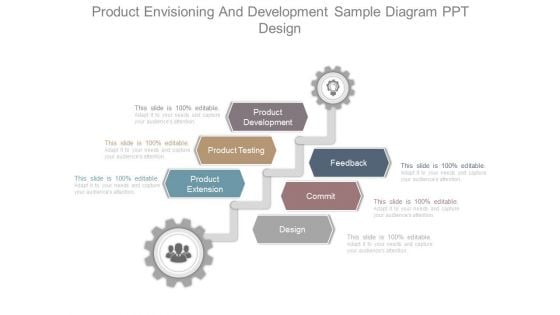
Product Envisioning And Development Sample Diagram Ppt Design
This is a product envisioning and development sample diagram ppt design. This is a six stage process. The stages in this process are product development, product testing, product extension, feedback, commit, design.
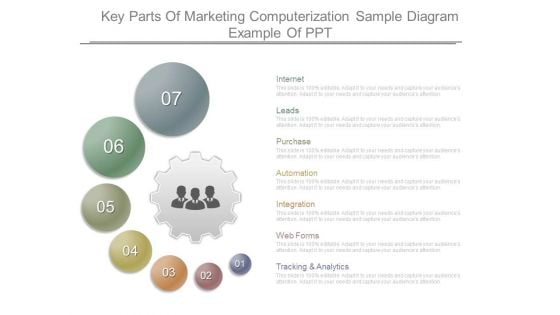
Key Parts Of Marketing Computerization Sample Diagram Example Of Ppt
This is a key parts of marketing computerization sample diagram example of ppt. This is a seven stage process. The stages in this process are tracking and analytics, web forms, integration, automation, purchase, leads, internet.

Example Of Planning Techniques For New Business Diagram Powerpoint Slides
This is a example of planning techniques for new business diagram powerpoint slides. This is a seven stage process. The stages in this process are business training, sales and marketing, business model, target groups, suppliers, community, regulators.
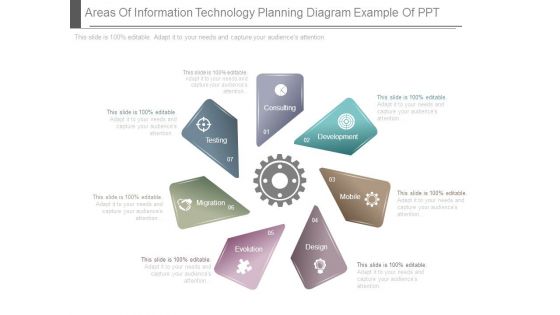
Areas Of Information Technology Planning Diagram Example Of Ppt
This is a areas of information technology planning diagram example of ppt. This is a seven stage process. The stages in this process are consulting, testing, migration, evolution, design, mobile, development.
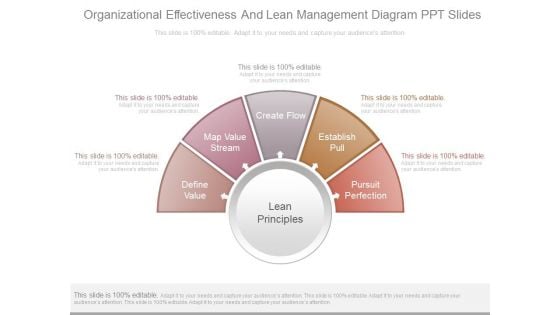
Organizational Effectiveness And Lean Management Diagram Ppt Slides
This is a organizational effectiveness and lean management diagram ppt slides. This is a five stage process. The stages in this process are lean principles, define value, map value stream, create flow, establish pull, pursuit perfection.
Ten Points Agenda Diagram With Text Boxes Ppt PowerPoint Presentation File Diagrams
This is a ten points agenda diagram with text boxes ppt powerpoint presentation file diagrams. This is a ten stage process. The stages in this process are 12 bullet points, 12 points, 12 points checklist.
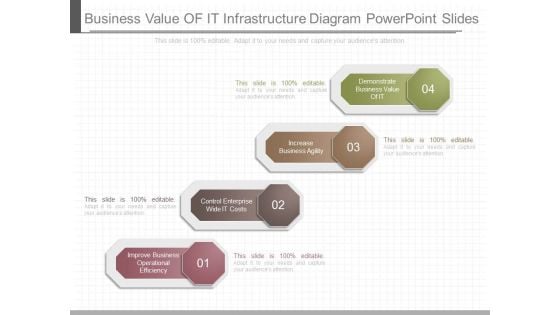
Business Value Of It Infrastructure Diagram Powerpoint Slides
This is a business value of it infrastructure diagram powerpoint slides. This is a four stage process. The stages in this process are demonstrate business value of it, increase business agility, control enterprise wide it costs, improve business operational efficiency.
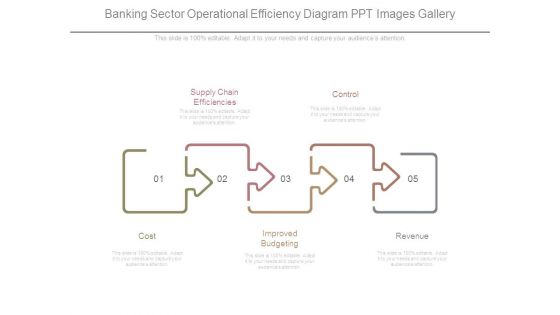
Banking Sector Operational Efficiency Diagram Ppt Images Gallery
This is a banking sector operational efficiency diagram ppt images gallery. This is a five stage process. The stages in this process are cost, supply chain efficiencies, improved budgeting, control, revenue.
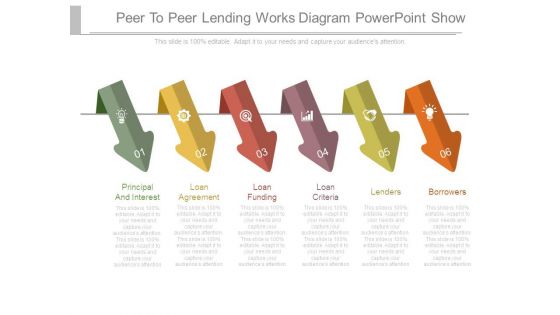
Peer To Peer Lending Works Diagram Powerpoint Show
This is a peer to peer lending works diagram powerpoint show. This is a six stage process. The stages in this process are principal and interest, loan agreement, loan funding, loan criteria, lenders, borrowers.
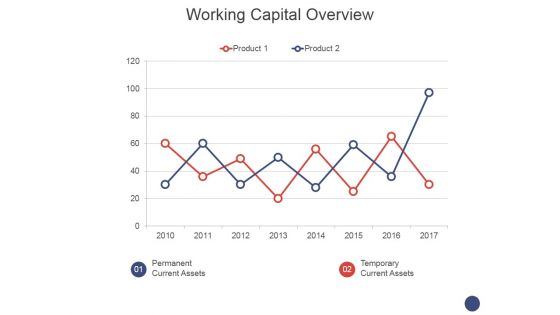
Working Capital Overview Ppt PowerPoint Presentation Layouts Diagrams
This is a working capital overview ppt powerpoint presentation layouts diagrams. This is a two stage process. The stages in this process are permanent current assets, temporary current assets.
Lego Blocks And Building Pieces Ppt Powerpoint Presentation Outline Diagrams
This is a lego blocks and building pieces ppt powerpoint presentation outline diagrams. This is a three stage process. The stages in this process are building blocks, lego bricks, building pieces.
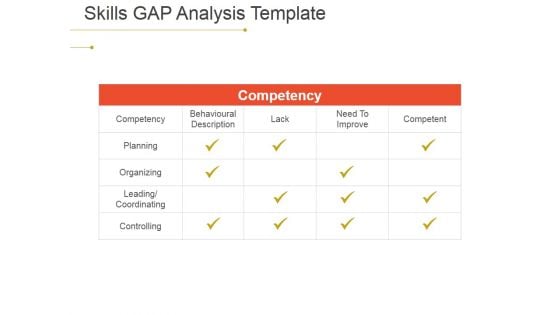
Skills Gap Analysis Ppt PowerPoint Presentation File Diagrams
This is a skills gap analysis ppt powerpoint presentation file diagrams. This is a four stage process. The stages in this process are competency, planning, organizing, leading coordinating, controlling, behavioural description, lack.
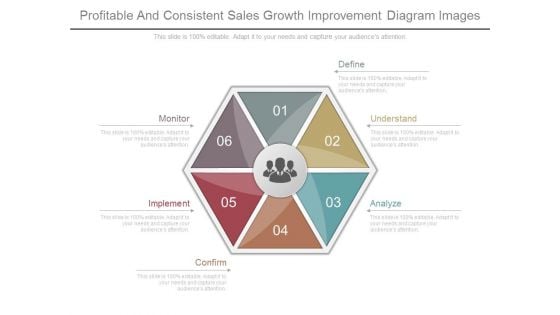
Profitable And Consistent Sales Growth Improvement Diagram Images
This is a profitable and consistent sales growth improvement diagram images. This is a six stage process. The stages in this process are executive staff, product management, development, sales and marketing.
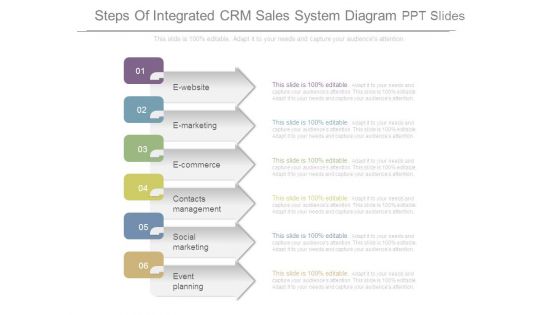
Steps Of Integrated Crm Sales System Diagram Ppt Slides
This is a steps of integrated crm sales system diagram ppt slides. This is a six stage process. The stages in this process are ewebsite, emarketing, ecommerce, contacts management, social marketing, event planning.

 Home
Home