Process Icon
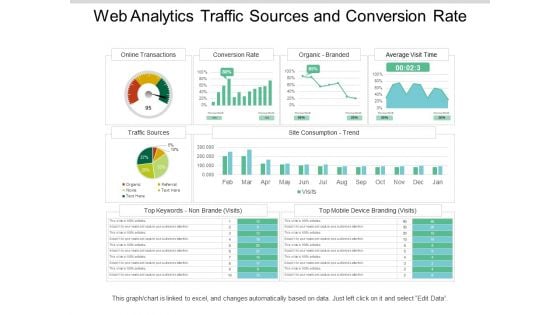
Web Analytics Traffic Sources And Conversion Rate Ppt PowerPoint Presentation Picture
This is a web analytics traffic sources and conversion rate ppt powerpoint presentation picture. This is a four stage process. The stages in this process are digital analytics, digital dashboard, marketing.
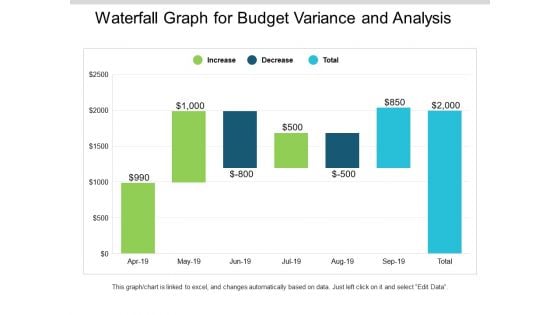
Waterfall Graph For Budget Variance And Analysis Ppt PowerPoint Presentation Slides Mockup
This is a waterfall graph for budget variance and analysis ppt powerpoint presentation slides mockup. This is a three stage process. The stages in this process are profit and loss, balance sheet, income statement, benefit and loss.
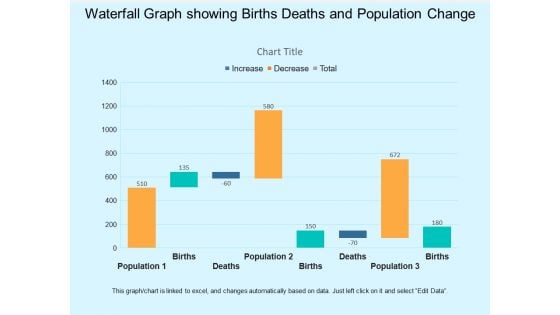
Waterfall Graph Showing Births Deaths And Population Change Ppt PowerPoint Presentation Infographic Template Visual Aids
This is a waterfall graph showing births deaths and population change ppt powerpoint presentation infographic template visual aids. This is a three stage process. The stages in this process are profit and loss, balance sheet, income statement, benefit and loss.
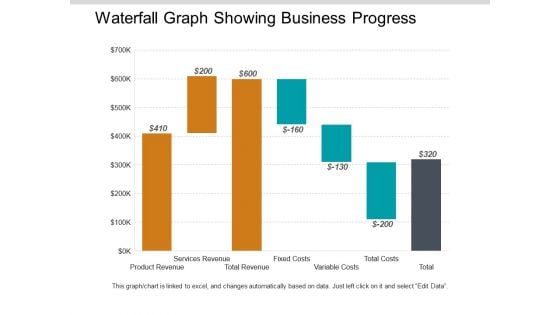
Waterfall Graph Showing Business Progress Ppt PowerPoint Presentation Styles Model
This is a waterfall graph showing business progress ppt powerpoint presentation styles model. This is a three stage process. The stages in this process are profit and loss, balance sheet, income statement, benefit and loss.
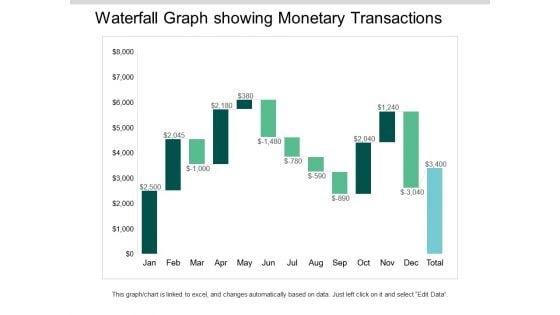
Waterfall Graph Showing Monetary Transactions Ppt PowerPoint Presentation Ideas Visuals
This is a waterfall graph showing monetary transactions ppt powerpoint presentation ideas visuals. This is a three stage process. The stages in this process are profit and loss, balance sheet, income statement, benefit and loss.
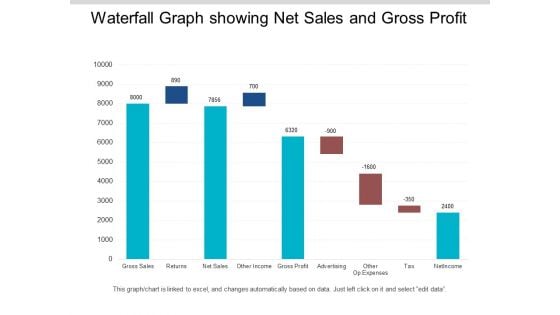
Waterfall Graph Showing Net Sales And Gross Profit Ppt PowerPoint Presentation Infographics Format
This is a waterfall graph showing net sales and gross profit ppt powerpoint presentation infographics format. This is a three stage process. The stages in this process are profit and loss, balance sheet, income statement, benefit and loss.
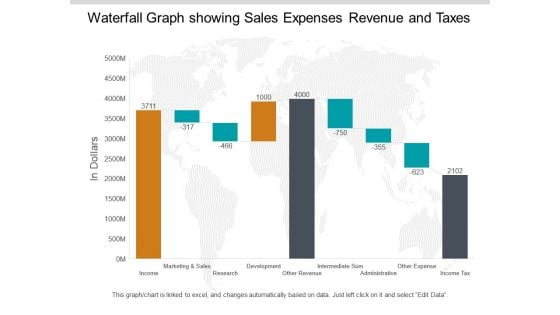
Waterfall Graph Showing Sales Expenses Revenue And Taxes Ppt PowerPoint Presentation Pictures Summary
This is a waterfall graph showing sales expenses revenue and taxes ppt powerpoint presentation pictures summary. This is a three stage process. The stages in this process are profit and loss, balance sheet, income statement, benefit and loss.
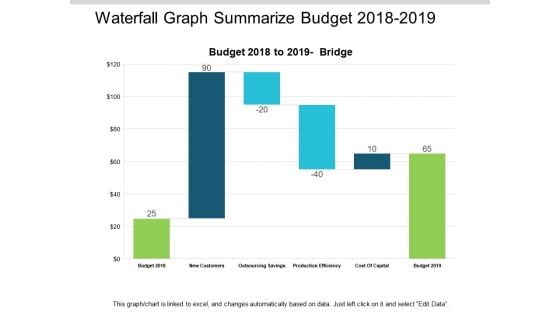
Waterfall Graph Summarize Budget 2018 To 2019 Ppt PowerPoint Presentation Summary Slides
This is a waterfall graph summarize budget 2018 to 2019 ppt powerpoint presentation summary slides. This is a three stage process. The stages in this process are profit and loss, balance sheet, income statement, benefit and loss.
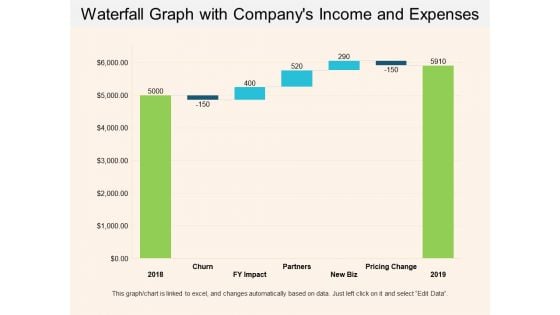
Waterfall Graph With Companys Income And Expenses Ppt PowerPoint Presentation Show Example Introduction
This is a waterfall graph with companys income and expenses ppt powerpoint presentation show example introduction. This is a three stage process. The stages in this process are profit and loss, balance sheet, income statement, benefit and loss.
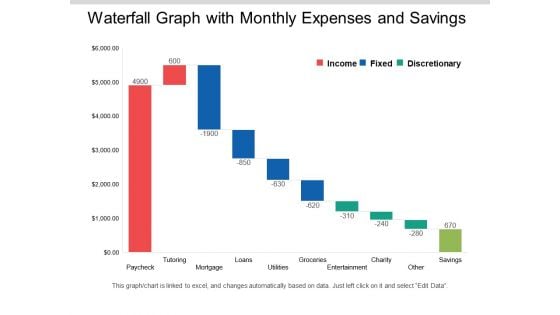
Waterfall Graph With Monthly Expenses And Savings Ppt PowerPoint Presentation Layouts Clipart Images
This is a waterfall graph with monthly expenses and savings ppt powerpoint presentation layouts clipart images. This is a three stage process. The stages in this process are profit and loss, balance sheet, income statement, benefit and loss.
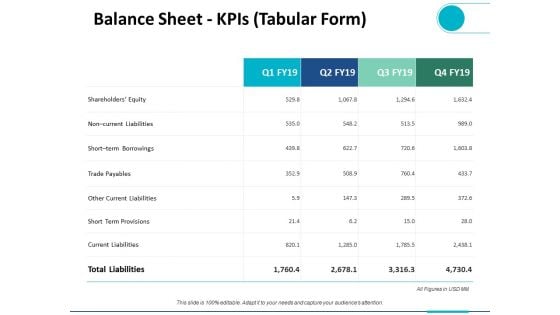
Balance Sheet Kpis Tabular Form Ppt PowerPoint Presentation Ideas Design Templates
This is a balance sheet kpis tabular form ppt powerpoint presentation ideas design templates. This is a four stage process. The stages in this process are finance, analysis, business, investment, marketing.
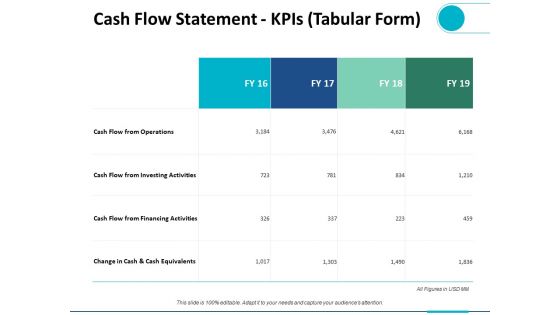
Cash Flow Statement Kpis Tabular Form Ppt PowerPoint Presentation Summary Infographic Template
This is a cash flow statement kpis tabular form ppt powerpoint presentation summary infographic template. This is a four stage process. The stages in this process are finance, analysis, business, investment, marketing.
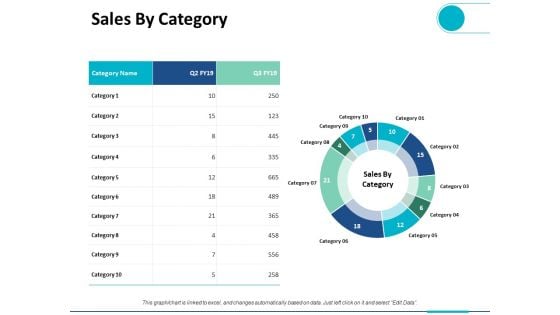
Sales By Category Ppt PowerPoint Presentation Ideas Graphics Design
This is a sales by category ppt powerpoint presentation ideas graphics design. This is a three stage process. The stages in this process are finance, analysis, business, investment, marketing.
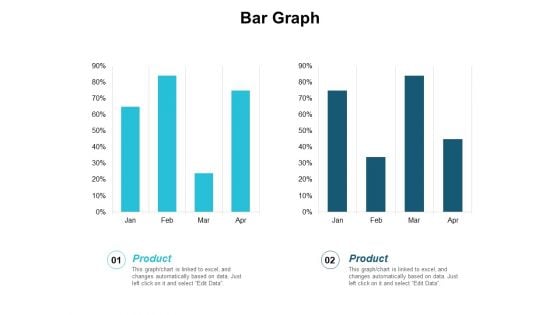
Bar Graph Finance Planning Ppt PowerPoint Presentation Infographic Template Master Slide
This is a bar graph finance planning ppt powerpoint presentation infographic template master slide. This is a two stage process. The stages in this process are finance, analysis, business, investment, marketing.
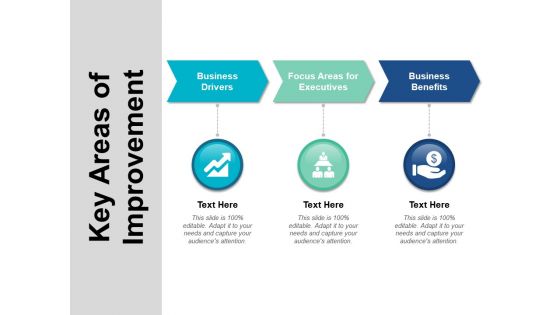
Key Areas Of Improvement Ppt PowerPoint Presentation Styles Files
This is a key areas of improvement ppt powerpoint presentation styles files. This is a three stage process. The stages in this process are decision tree, decision point, driver diagram.
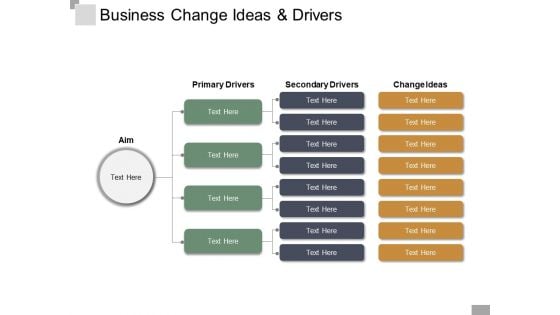
Business Change Ideas And Drivers Ppt PowerPoint Presentation Outline Pictures
This is a business change ideas and drivers ppt powerpoint presentation outline pictures. This is a three stage process. The stages in this process are decision tree, decision point, driver diagram.
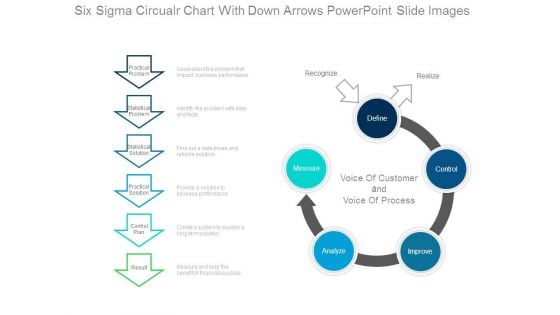
Six Sigma Circular Chart With Down Arrows Powerpoint Slide Images
This is a six sigma circular chart with down arrows powerpoint slide images. This is a five stage process. The stages in this process are recognize, realize, measure, define, analyze, improve, control, voice of customer and voice of process, practical problem, statistical problem, statistical solution, practical solution, control plan, result.
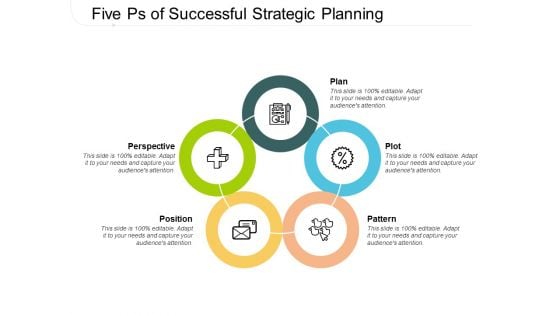
Five Ps Of Successful Strategic Planning Ppt PowerPoint Presentation Gallery Background
Presenting this set of slides with name five ps of successful strategic planning ppt powerpoint presentation gallery background. This is a five stage process. The stages in this process are 5 circle venn diagram, business process, venn diagram. This is a completely editable PowerPoint presentation and is available for immediate download. Download now and impress your audience.
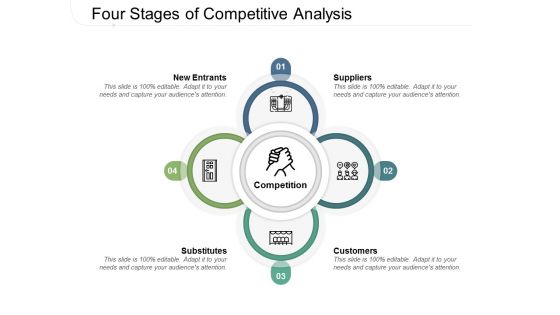
Four Stages Of Competitive Analysis Ppt PowerPoint Presentation Styles Background Image
Presenting this set of slides with name four stages of competitive analysis ppt powerpoint presentation styles background image. This is a four stage process. The stages in this process are 5 circle venn diagram, business process, venn diagram. This is a completely editable PowerPoint presentation and is available for immediate download. Download now and impress your audience.
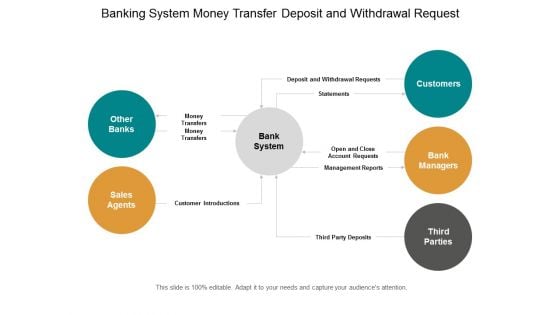
Banking System Money Transfer Deposit And Withdrawal Request Ppt Powerpoint Presentation Gallery Graphics Download
This is a banking system money transfer deposit and withdrawal request ppt powerpoint presentation gallery graphics download. This is a six stage process. The stages in this process are context diagram, context shapes, context visuals.
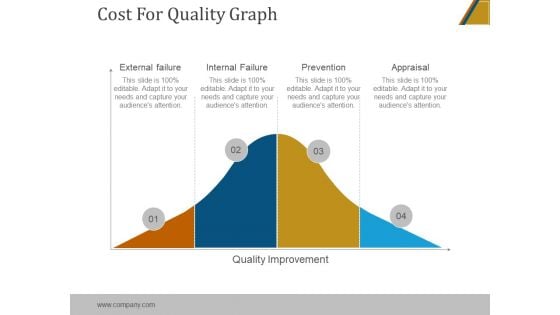
Cost For Quality Graph Ppt PowerPoint Presentation Graphics
This is a cost for quality graph ppt powerpoint presentation graphics. This is a four stage process. The stages in this process are external failure, internal failure, prevention, appraisal, quality improvement.

Four Vertical Columns For Percentage Comparison Ppt PowerPoint Presentation Introduction
This is a four vertical columns for percentage comparison ppt powerpoint presentation introduction. This is a four stage process. The stages in this process are business, marketing, success, management, presentation.
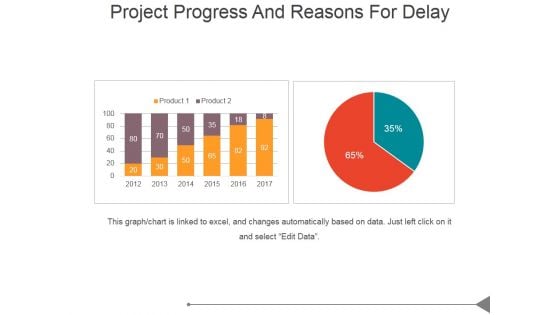
Project Progress And Reasons For Delay Ppt PowerPoint Presentation Designs Download
This is a project progress and reasons for delay ppt powerpoint presentation designs download. This is a two stage process. The stages in this process are business, marketing, success, bar graph, management.
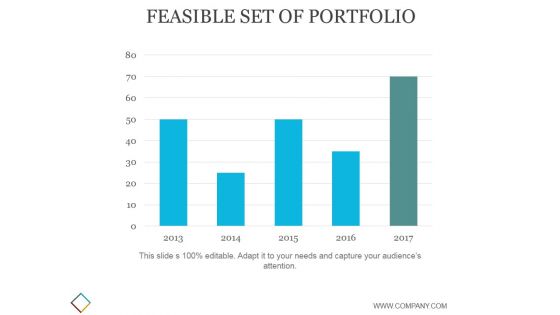
Feasible Set Of Portfolio Ppt PowerPoint Presentation Templates
This is a feasible set of portfolio ppt powerpoint presentation templates. This is a five stage process. The stages in this process are business, strategy, marketing, analysis, success, growth.
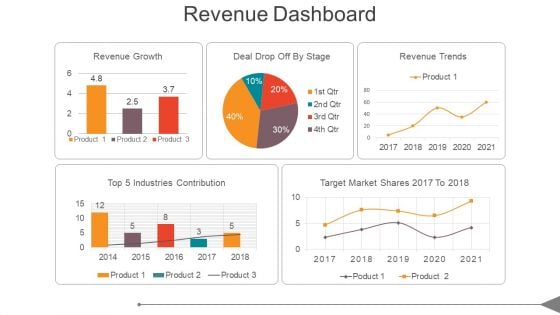
Revenue Dashboard Ppt PowerPoint Presentation Show
This is a revenue dashboard ppt powerpoint presentation show. This is a five stage process. The stages in this process are top 5 industries contribution, revenue growth, deal drop off by stage, revenue trends, target market shares 2017 to 2018.

Sales Performance Dashboard Ppt PowerPoint Presentation Good
This is a sales performance dashboard ppt powerpoint presentation good. This is a four stage process. The stages in this process are lead sources revenue share, total sales by month, opportunities total sales by probability, win loss ratio.
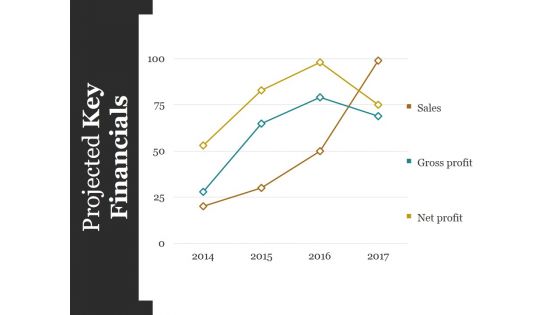
Projected Key Financials Template Ppt PowerPoint Presentation Styles Graphics Design
This is a projected key financials template ppt powerpoint presentation styles graphics design. This is a four stage process. The stages in this process are sales, gross profit, net profit.
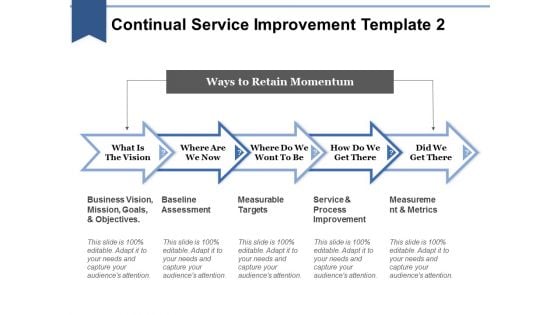
Continual Service Improvement Template 2 Ppt PowerPoint Presentation Gallery Themes
This is a continual service improvement template 2 ppt powerpoint presentation gallery themes. This is a five stage process. The stages in this process are business vision mission goals and objectives, baseline assessment, measurable targets, service and process improvement, measurement and metrics.
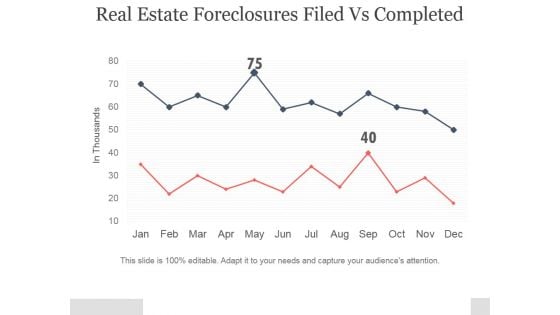
Real Estate Foreclosures Filed Vs Completed Ppt PowerPoint Presentation Gallery
This is a real estate foreclosures filed vs completed ppt powerpoint presentation gallery. This is a two stage process. The stages in this process are in thousands, business, marketing, success, management.
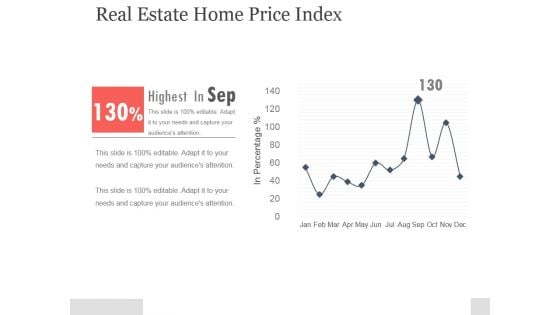
Real Estate Home Price Index Ppt PowerPoint Presentation Example
This is a real estate home price index ppt powerpoint presentation example. This is a one stage process. The stages in this process are bar graph, business, marketing, success, management.
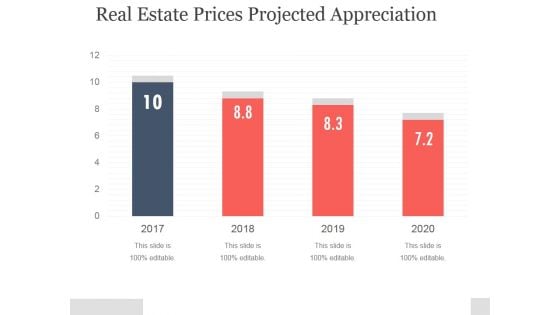
Real Estate Prices Projected Appreciation Ppt PowerPoint Presentation Layouts
This is a real estate prices projected appreciation ppt powerpoint presentation layouts. This is a four stage process. The stages in this process are business, marketing, success, management, presentation.
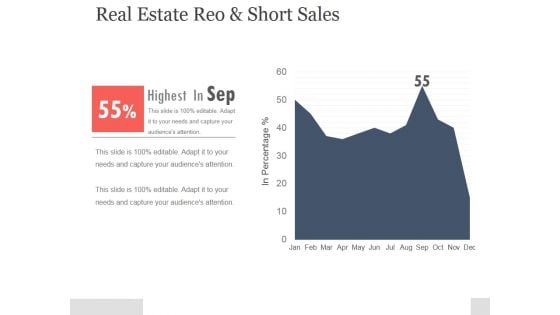
Real Estate Reo And Short Sales Ppt PowerPoint Presentation Rules
This is a real estate reo and short sales ppt powerpoint presentation rules. This is a one stage process. The stages in this process are business, marketing, success, management, growth.
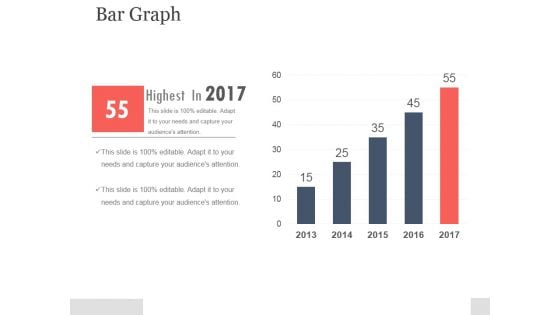
Bar Graph Template 1 Ppt PowerPoint Presentation Deck
This is a bar graph template 1 ppt powerpoint presentation deck. This is a five stage process. The stages in this process are bar graph, business, marketing, success, management.
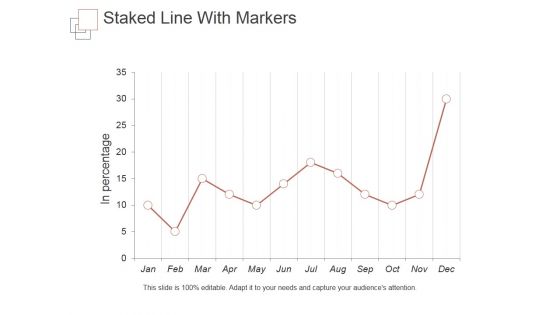
Staked Line With Markers Ppt PowerPoint Presentation Introduction
This is a staked line with markers ppt powerpoint presentation introduction. This is a one stage process. The stages in this process are in percentage, business, marketing, success, management.
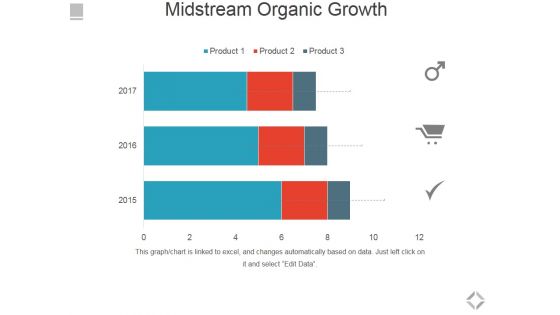
Midstream Organic Growth Ppt PowerPoint Presentation Ideas Graphics Tutorials
This is a midstream organic growth ppt powerpoint presentation ideas graphics tutorials. This is a three stage process. The stages in this process are business, marketing, bar graph, management, financials.
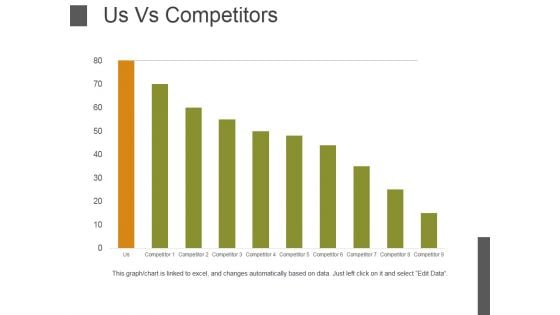
Us Vs Competitors Template 1 Ppt PowerPoint Presentation Model File Formats
This is a us vs competitors template 1 ppt powerpoint presentation model file formats. This is a nine stage process. The stages in this process are bar graph, business, marketing, management, success.
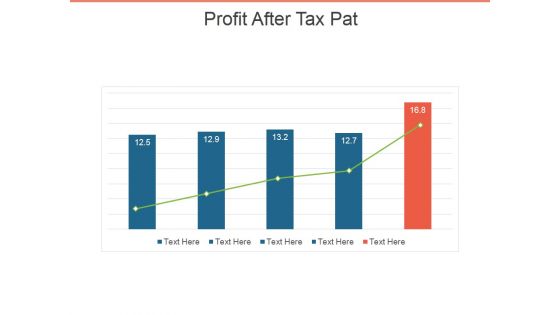
Profit After Tax Pat Ppt PowerPoint Presentation Inspiration Slide
This is a profit after tax pat ppt powerpoint presentation inspiration slide. This is a five stage process. The stages in this process are bar graph, business, marketing, growth, management.
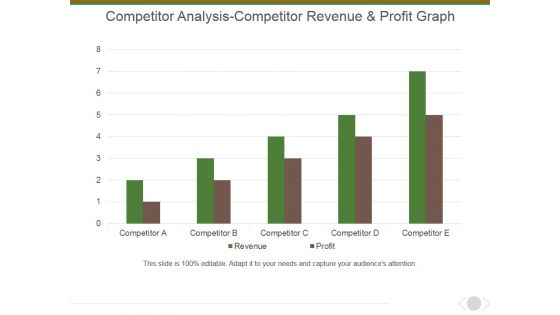
Competitor Analysis Competitor Revenue And Profit Graph Ppt PowerPoint Presentation Gallery Vector
This is a competitor analysis competitor revenue and profit graph ppt powerpoint presentation gallery vector. This is a five stage process. The stages in this process are bar graph, marketing, management, business, presentation.
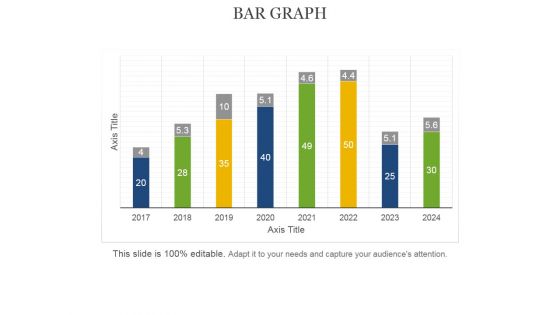
Bar Graph Ppt PowerPoint Presentation Professional Guide
This is a bar graph ppt powerpoint presentation professional guide. This is a eight stage process. The stages in this process are axis title, bar graph, business, marketing, management.
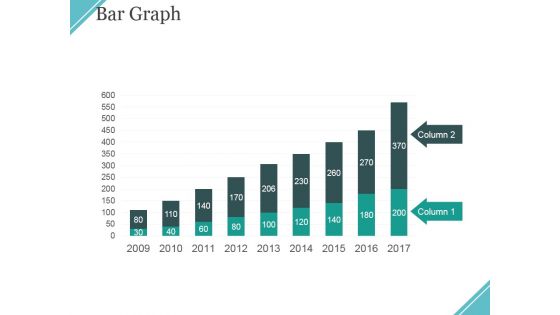
Bar Graph Ppt PowerPoint Presentation Gallery Example File
This is a bar graph ppt powerpoint presentation gallery example file. This is a two stage process. The stages in this process are column, bar graph, business, marketing, management.
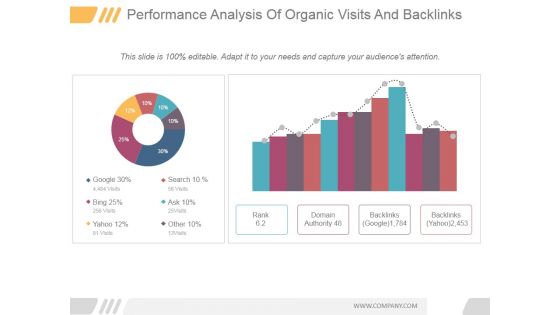
Performance Analysis Of Organic Visits And Backlinks Ppt PowerPoint Presentation Ideas
This is a performance analysis of organic visits and backlinks ppt powerpoint presentation ideas. This is a two stage process. The stages in this process are rank, domain authority, backlinks google, backlinks yahoo, google, bing.
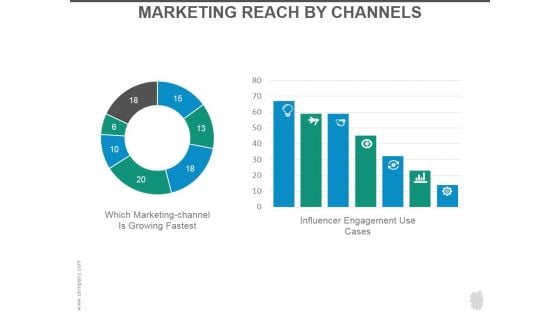
Marketing Reach By Channels Ppt PowerPoint Presentation Rules
This is a marketing reach by channels ppt powerpoint presentation rules. This is a two stage process. The stages in this process are which marketing channel is growing fastest, influencer engagement use cases.
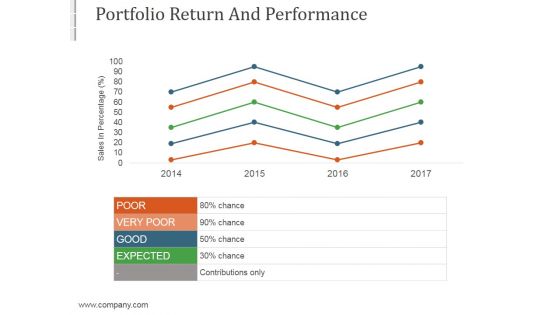
Portfolio Return And Performance Template4 Ppt PowerPoint Presentation Microsoft
This is a portfolio return and performance template4 ppt powerpoint presentation microsoft. This is a four stage process. The stages in this process are good, poor, very poor, expected, business.
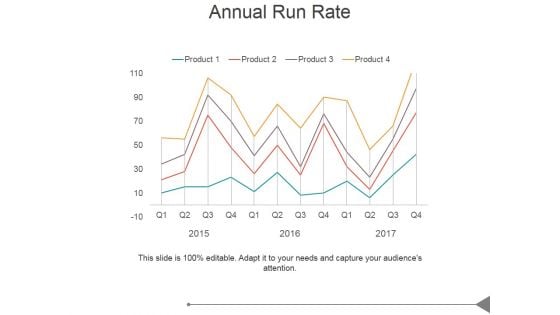
Annual Run Rate Ppt PowerPoint Presentation Designs Download
This is a annual run rate ppt powerpoint presentation designs download. This is a four stage process. The stages in this process are business, marketing, success, business plan, bar graph.
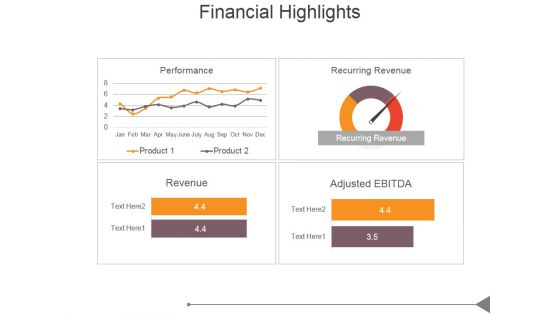
Financial Highlights Template 1 Ppt PowerPoint Presentation Model
This is a financial highlights template 1 ppt powerpoint presentation model. This is a four stage process. The stages in this process are business, marketing, success, business plan, bar graph.
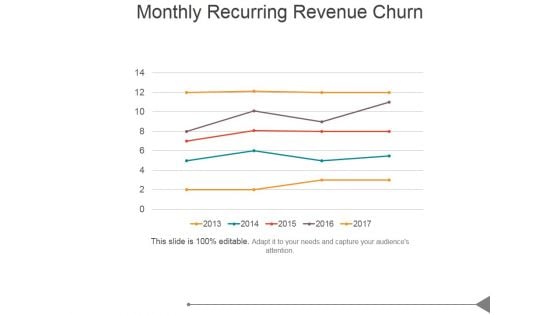
Monthly Recurring Revenue Churn Template 1 Ppt PowerPoint Presentation Clipart
This is a monthly recurring revenue churn template 1 ppt powerpoint presentation clipart. This is a one stage process. The stages in this process are business, marketing, success, in percentage, growth.
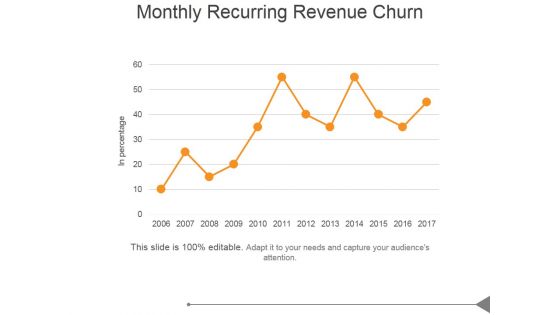
Monthly Recurring Revenue Churn Ppt PowerPoint Presentation Images
This is a monthly recurring revenue churn ppt powerpoint presentation images. This is a five stage process. The stages in this process are business, marketing, success, bar graph, growth.
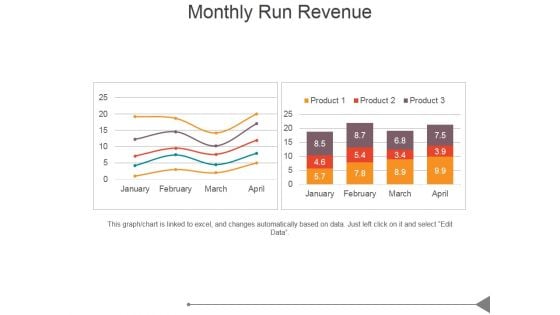
Monthly Run Revenue Ppt PowerPoint Presentation Design Ideas
This is a monthly run revenue ppt powerpoint presentation design ideas. This is a two stage process. The stages in this process are business, marketing, success, bar graph, growth.
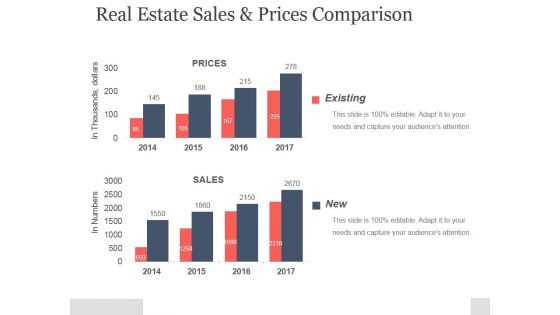
Real Estate Sales And Prices Comparison Ppt PowerPoint Presentation Example
This is a real estate sales and prices comparison ppt powerpoint presentation example. This is a two stage process. The stages in this process are existing, prices, sales, in thousands, dollars.
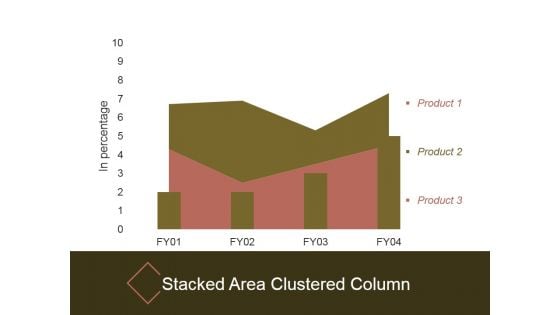
Stacked Area Clustered Column Ppt PowerPoint Presentation Clipart
This is a stacked area clustered column ppt powerpoint presentation clipart. This is a four stage process. The stages in this process are in percentage, stacked area clustered column, product.
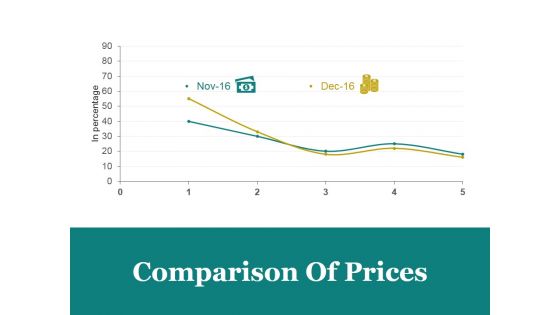
Comparison Of Prices Ppt PowerPoint Presentation Designs Download
This is a comparison of prices ppt powerpoint presentation designs download. This is a two stage process. The stages in this process are comparison of prices, marketing, in percentage, bar graph, business.
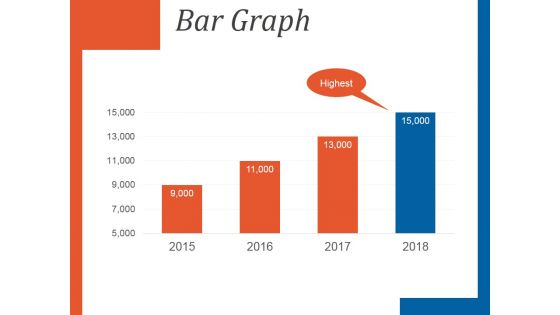
Bar Graph Template 2 Ppt PowerPoint Presentation Introduction
This is a bar graph template 2 ppt powerpoint presentation introduction. This is a four stage process. The stages in this process are bar graph, presentation, year, planning, marketing.
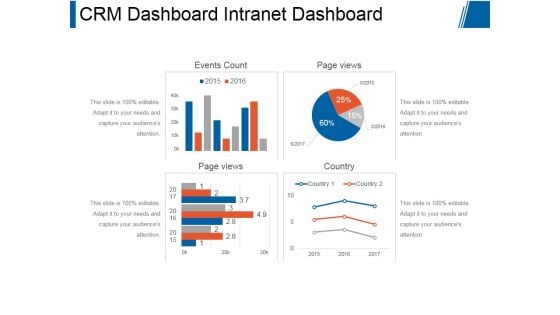
Crm Dashboard Intranet Dashboard Ppt PowerPoint Presentation Model
This is a crm dashboard intranet dashboard ppt powerpoint presentation model. This is a four stage process. The stages in this process are events count, page views, page views, country.
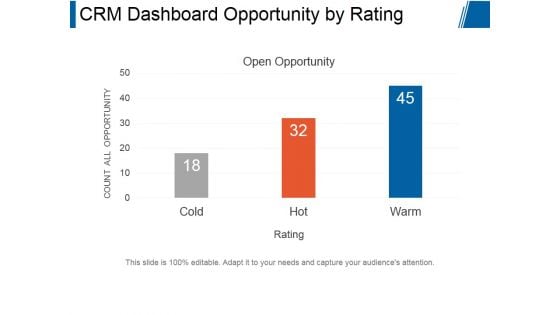
Crm Dashboard Opportunity By Rating Ppt PowerPoint Presentation Backgrounds
This is a crm dashboard opportunity by rating ppt powerpoint presentation backgrounds. This is a three stage process. The stages in this process are open opportunity, count all opportunity, rating.
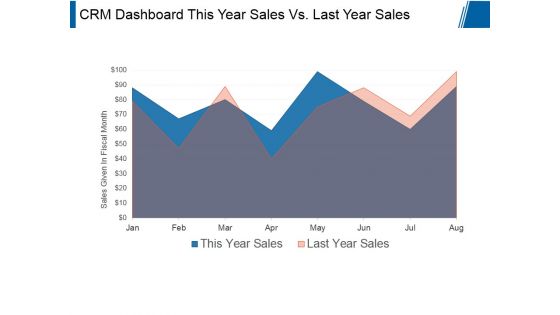
Crm Dashboard This Year Sales Vs Last Year Sales Ppt PowerPoint Presentation Styles
This is a crm dashboard this year sales vs last year sales ppt powerpoint presentation styles. This is a two stage process. The stages in this process are sales given in fiscal month, business, marketing, presentation, growth.
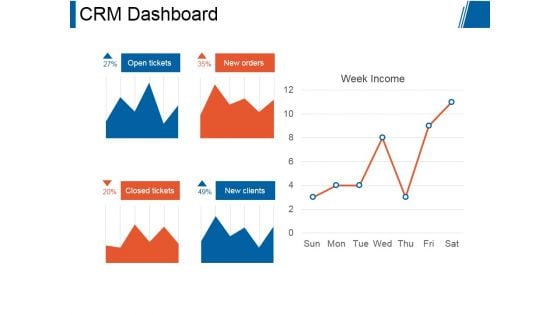
Crm Dashboard Ppt PowerPoint Presentation Good
This is a crm dashboard ppt powerpoint presentation good. This is a five stage process. The stages in this process are open tickets, new orders, closed tickets, new clients, week income.
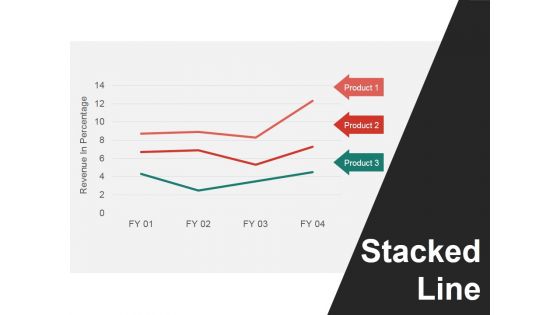
Stacked Line Ppt PowerPoint Presentation Summary Master Slide
This is a stacked line ppt powerpoint presentation summary master slide. This is a three stage process. The stages in this process are revenue in percentage, stacked line, product.
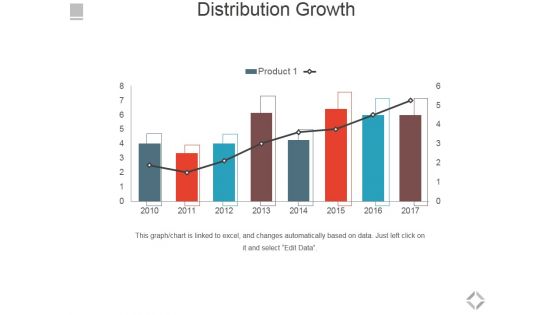
Distribution Growth Ppt PowerPoint Presentation Slides Clipart
This is a distribution growth ppt powerpoint presentation slides clipart. This is a eight stage process. The stages in this process are distribution growth, bar graph, business, marketing, success.
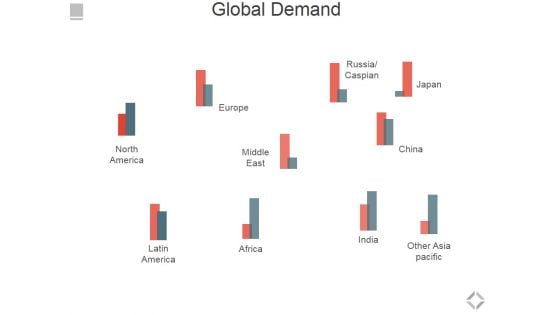
Global Demand Ppt PowerPoint Presentation Model Example Topics
This is a global demand ppt powerpoint presentation model example topics. This is a ten stage process. The stages in this process are europe, africa, latin america, north america, india.
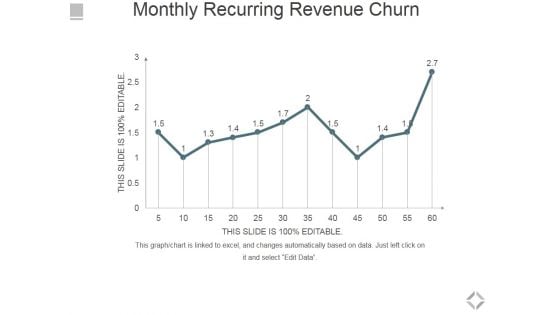
Monthly Recurring Revenue Churn Ppt PowerPoint Presentation Infographics Microsoft
This is a monthly recurring revenue churn ppt powerpoint presentation infographics microsoft. This is a one stage process. The stages in this process are bar graph, business, marketing, success, growth.
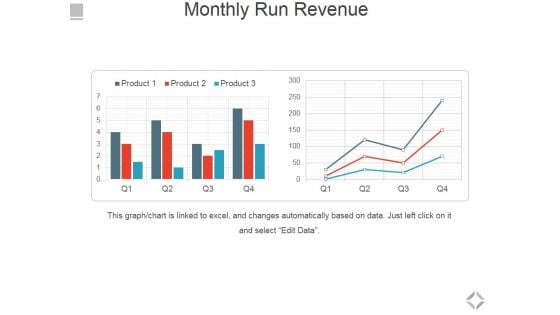
Monthly Run Revenue Ppt PowerPoint Presentation Show Styles
This is a monthly run revenue ppt powerpoint presentation show styles. This is a two stage process. The stages in this process are bar graph, business, marketing, success, growth.
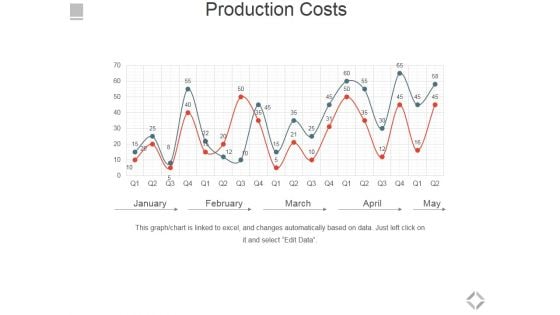
Production Costs Template 2 Ppt PowerPoint Presentation Gallery Picture
This is a production costs template 2 ppt powerpoint presentation gallery picture. This is a two stage process. The stages in this process are january, february, march, april, may.
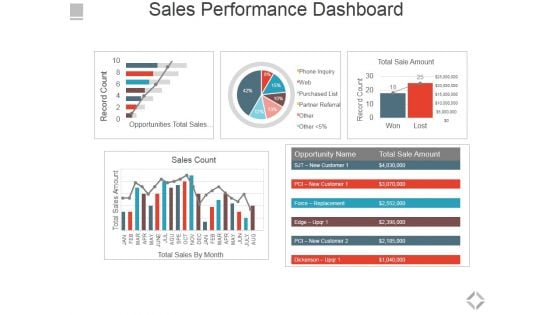
Sales Performance Dashboard Ppt PowerPoint Presentation File Graphics Pictures
This is a sales performance dashboard ppt powerpoint presentation file graphics pictures. This is a five stage process. The stages in this process are total sales by month, sales count, opportunities total sales by probability, total sale amount.
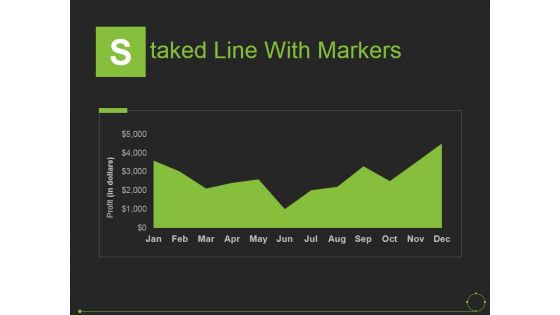
Staked Line With Markers Ppt PowerPoint Presentation Pictures Examples
This is a staked line with markers ppt powerpoint presentation pictures examples. This is a one stage process. The stages in this process are years, profit, product, business, marketing.
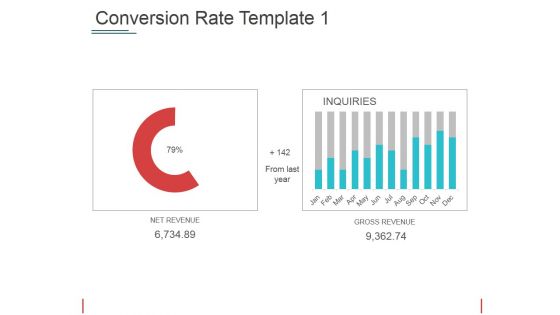
Conversion Rate Template 1 Ppt PowerPoint Presentation Visual Aids Files
This is a conversion rate template 1 ppt powerpoint presentation visual aids files. This is a two stage process. The stages in this process are net revenue gross revenue from last year.
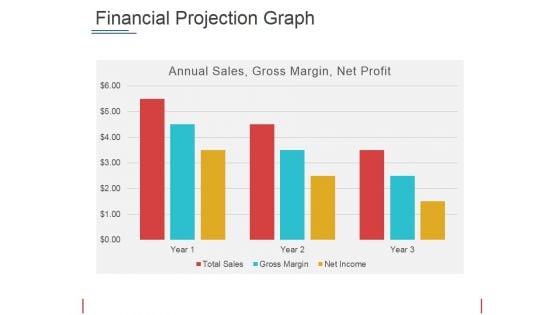
Financial Projection Graph Template 2 Ppt PowerPoint Presentation Show Picture
This is a financial projection graph template 2 ppt powerpoint presentation show picture. This is a three stage process. The stages in this process are annual sales, gross margin, net profit, years.
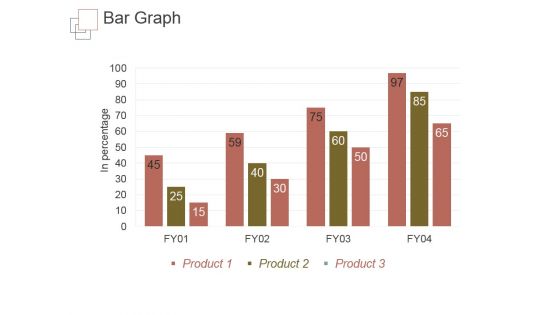
Bar Graph Ppt PowerPoint Presentation Gallery Skills
This is a bar graph ppt powerpoint presentation gallery skills. This is a four stage process. The stages in this process are in percentage, bar graph, business, marketing, product.
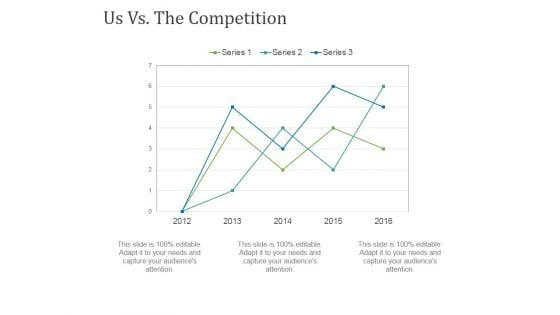
Us Vs The Competition Template 2 Ppt PowerPoint Presentation Summary Background Designs
This is a us vs the competition template 2 ppt powerpoint presentation summary background designs. This is a three stage process. The stages in this process are competition, business, marketing, growth, presentation.
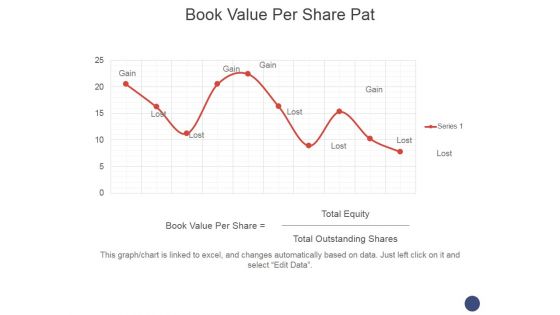
Book Value Per Share Pat Ppt PowerPoint Presentation Layouts Outfit
This is a book value per share pat ppt powerpoint presentation layouts outfit. This is a ten stage process. The stages in this process are book value per share, equity total, total outstanding shares.
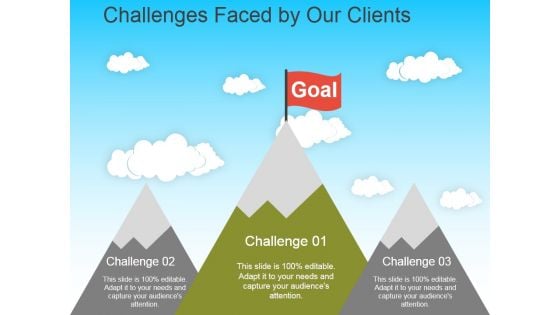
Challenges Faced By Our Clients Template 2 Ppt PowerPoint Presentation Infographic Template Gridlines
This is a challenges faced by our clients template 2 ppt powerpoint presentation infographic template gridlines. This is a three stage process. The stages in this process are goal, challenge, business, marketing, growth.
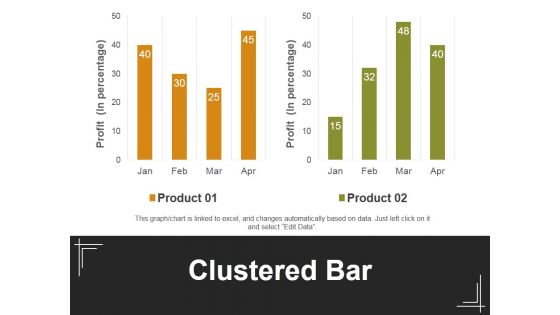
Clustered Bar Ppt PowerPoint Presentation Summary Design Inspiration
This is a clustered bar ppt powerpoint presentation summary design inspiration. This is a two stage process. The stages in this process are product, clustered bar, profit, business, marketing.
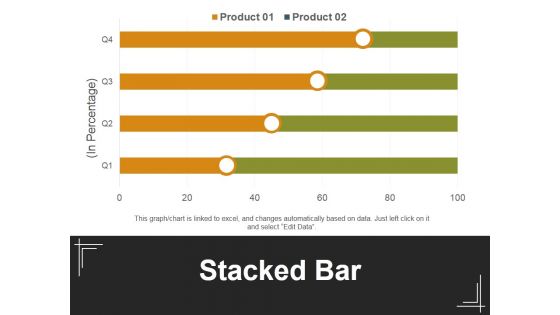
Stacked Bar Template 1 Ppt PowerPoint Presentation Inspiration Background Designs
This is a stacked bar template 1 ppt powerpoint presentation inspiration background designs. This is a four stage process. The stages in this process are in percentage, stacked bar, product, business, marketing.
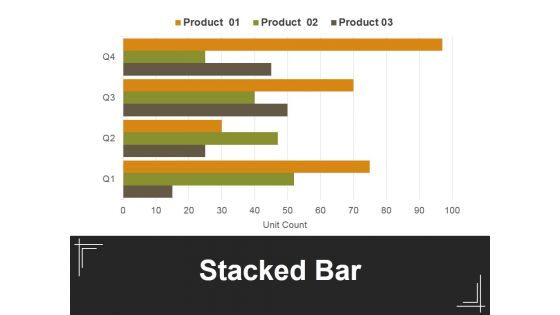
Stacked Bar Template 2 Ppt PowerPoint Presentation Professional Example
This is a stacked bar template 2 ppt powerpoint presentation professional example. This is a four stage process. The stages in this process are in percentage, stacked bar, product, business, marketing.
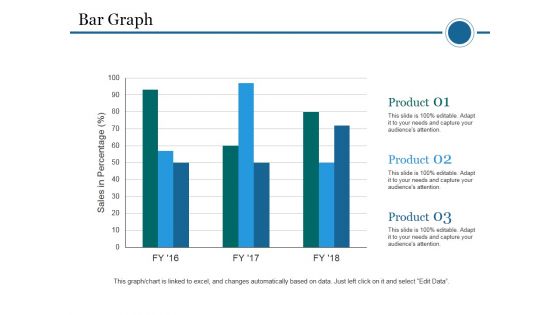
Bar Graph Ppt PowerPoint Presentation Infographic Template Template
This is a bar graph ppt powerpoint presentation infographic template template. This is a three stage process. The stages in this process are bar graph, sales in percentage, product, planning, business.
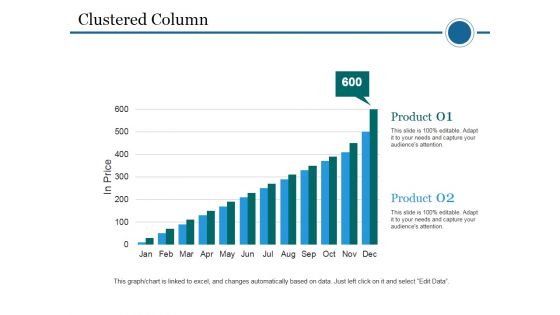
Clustered Column Ppt PowerPoint Presentation Inspiration Pictures
This is a clustered column ppt powerpoint presentation inspiration pictures. This is a two stage process. The stages in this process are clustered bar, product, planning, business, in price.
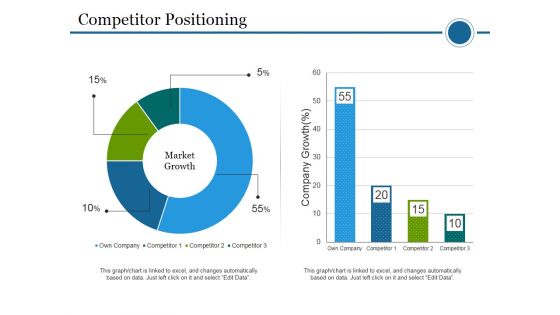
Competitor Positioning Ppt PowerPoint Presentation Infographics Gridlines
This is a competitor positioning ppt powerpoint presentation infographics gridlines. This is a two stage process. The stages in this process are competitor positioning, company, growth, market growth, business, marketing.
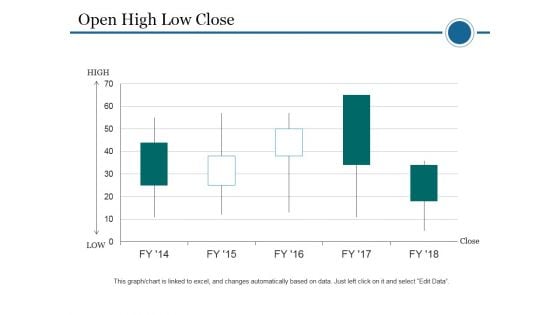
Open High Low Close Ppt PowerPoint Presentation Pictures Example Introduction
This is a open high low close ppt powerpoint presentation pictures example introduction. This is a five stage process. The stages in this process are high, low, close, business, marketing.
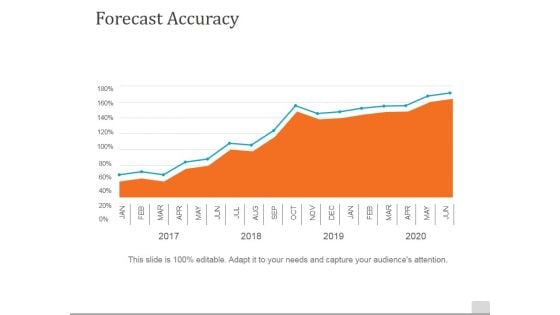
Forecast Accuracy Template 2 Ppt PowerPoint Presentation Pictures Grid
This is a forecast accuracy template 2 ppt powerpoint presentation pictures grid. This is a one stage process. The stages in this process are forecast accuracy, business, marketing, planning, years.
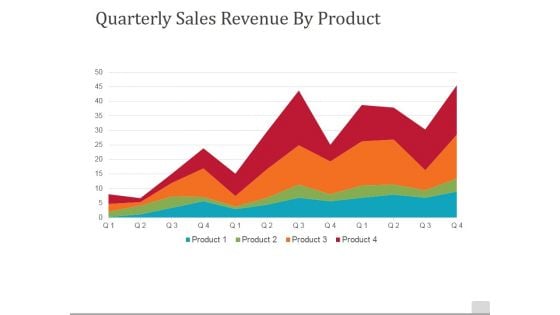
Quarterly Sales Revenue By Product Ppt PowerPoint Presentation File Background
This is a quarterly sales revenue by product ppt powerpoint presentation file background. This is a four stage process. The stages in this process are quarterly, sales revenue by product, business, marketing, success.
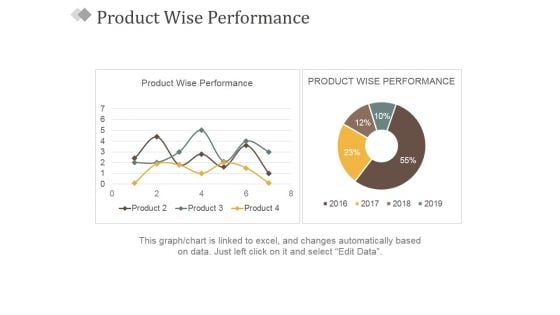
Product Wise Performance Ppt PowerPoint Presentation Slides Professional
This is a product wise performance ppt powerpoint presentation slides professional. This is a two stage process. The stages in this process are product wise performance, product wise performance.
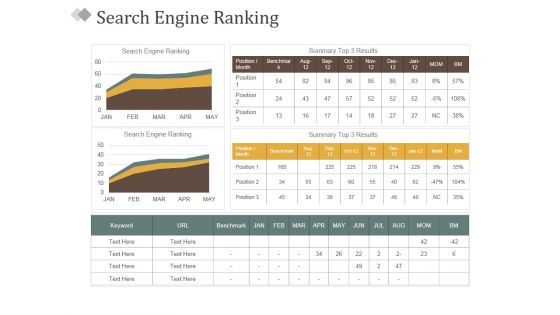
Search Engine Ranking Ppt PowerPoint Presentation Model Example Introduction
This is a search engine ranking ppt powerpoint presentation model example introduction. This is a five stage process. The stages in this process are search engine ranking, summary top 3 results, position, planning, business.
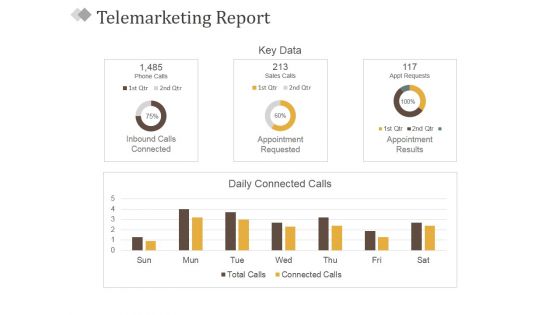
Telemarketing Report Template 1 Ppt PowerPoint Presentation Show Structure
This is a telemarketing report template 1 ppt powerpoint presentation show structure. This is a four stage process. The stages in this process are inbound calls connected, appointment requested, appointment results, key data, daily connected calls.
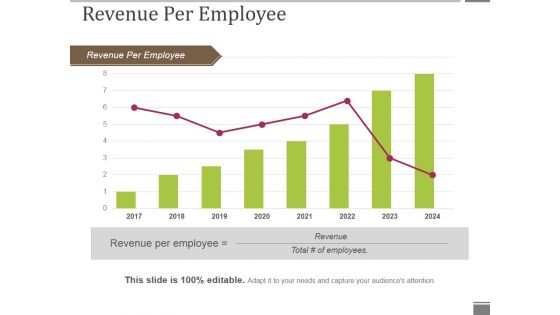
Revenue Per Employee Ppt PowerPoint Presentation Inspiration Objects
This is a revenue per employee ppt powerpoint presentation inspiration objects. This is a eight stage process. The stages in this process are revenue per employee, growth, marketing, business, planning.
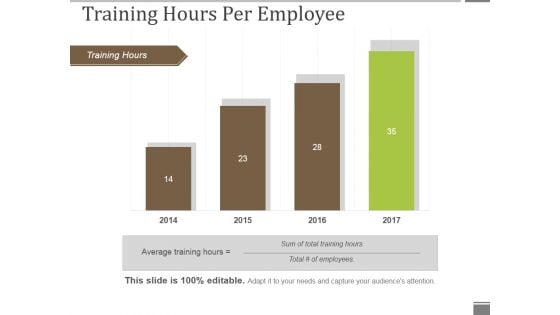
Training Hours Per Employee Ppt PowerPoint Presentation Professional Templates
This is a training hours per employee ppt powerpoint presentation professional templates. This is a four stage process. The stages in this process are training hours, years, planning, business, marketing.
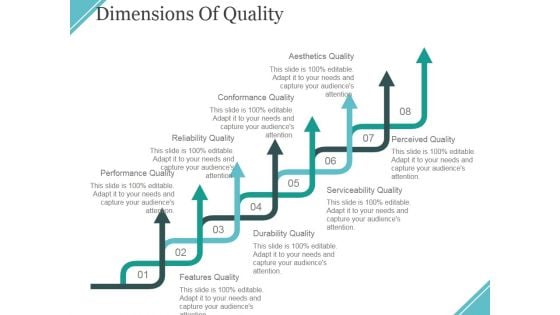
Dimensions Of Quality Ppt PowerPoint Presentation Layouts Design Inspiration
This is a dimensions of quality ppt powerpoint presentation layouts design inspiration. This is a eight stage process. The stages in this process are features quality, durability quality, serviceability quality, perceived quality, performance quality.
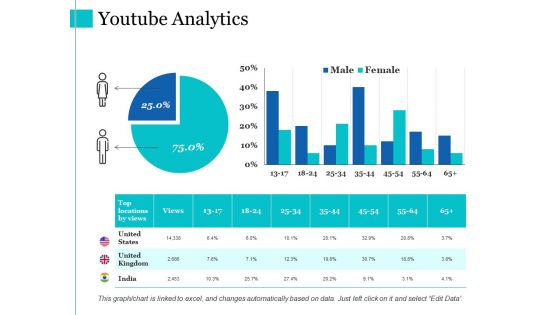
Youtube Analytics Ppt PowerPoint Presentation Layouts Graphic Images
This is a youtube analytics ppt powerpoint presentation layouts graphic images. This is a three stage process. The stages in this process are youtube analytics, finance, percentage, bar graph.
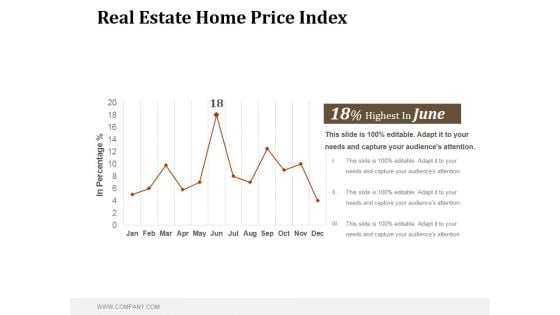
Real Estate Home Price Index Ppt PowerPoint Presentation Samples
This is a real estate home price index ppt powerpoint presentation samples. This is a one stage process. The stages in this process are in percentage, business, bar graph, marketing, success, management.
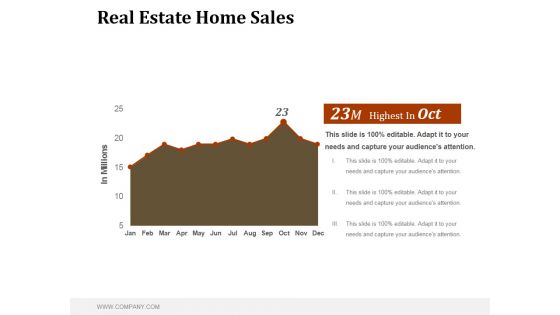
Real Estate Home Sales Ppt PowerPoint Presentation Model
This is a real estate home sales ppt powerpoint presentation model. This is a one stage process. The stages in this process are in millions, business, marketing, success, management.
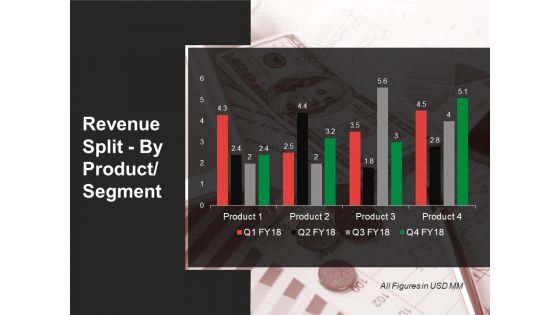
Revenue Split By Product Segment Template 2 Ppt PowerPoint Presentation Infographic Template Smartart
This is a revenue split by product segment template 2 ppt powerpoint presentation infographic template smartart. This is a four stage process. The stages in this process are Product, Business, Marketing, Strategy, Management.
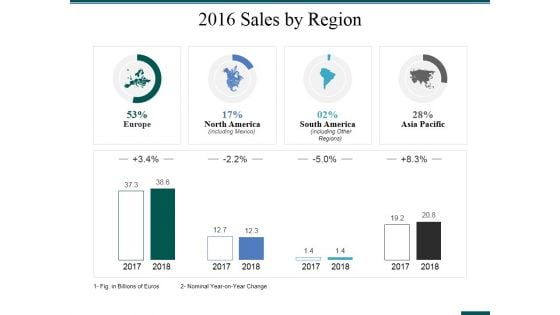
2016 Sales By Region Ppt PowerPoint Presentation Ideas Structure
This is a 2016 sales by region ppt powerpoint presentation ideas structure. This is a four stage process. The stages in this process are business, finance, strategy, management, location.
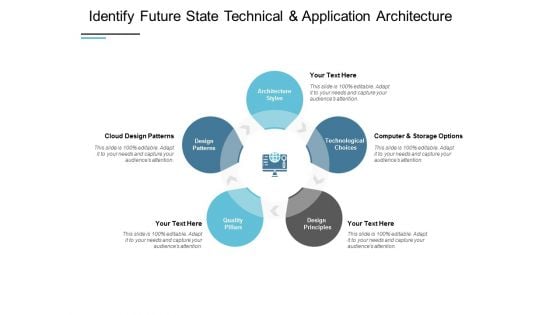
Identify Future State Technical And Application Architecture Ppt PowerPoint Presentation Show Slideshow
Presenting this set of slides with name identify future state technical and application architecture ppt powerpoint presentation show slideshow. This is a five stage process. The stages in this process are technological, quality pillars, storage options, process, management. This is a completely editable PowerPoint presentation and is available for immediate download. Download now and impress your audience.
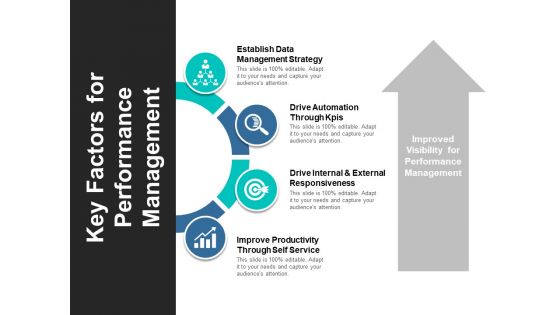
Key Factors For Performance Management Ppt PowerPoint Presentation Show Clipart
This is a key factors for performance management ppt powerpoint presentation show clipart. This is a four stage process. The stages in this process are decision tree, decision point, driver diagram.
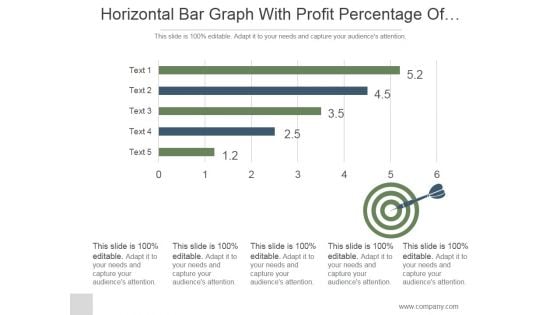
Horizontal Bar Graph With Profit Percentage Of Company Ppt PowerPoint Presentation Shapes
This is a horizontal bar graph with profit percentage of company ppt powerpoint presentation shapes. This is a five stage process. The stages in this process are business, strategy, marketing, analysis, slide bar, target.
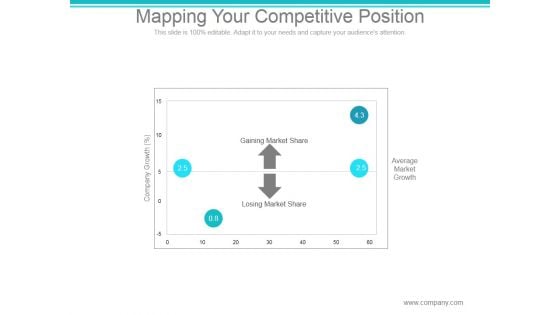
Mapping Your Competitive Position Ppt PowerPoint Presentation Files
This is a mapping your competitive position ppt powerpoint presentation files. This is a four stage process. The stages in this process are gaining market share, losing market share, company growth, average market growth.
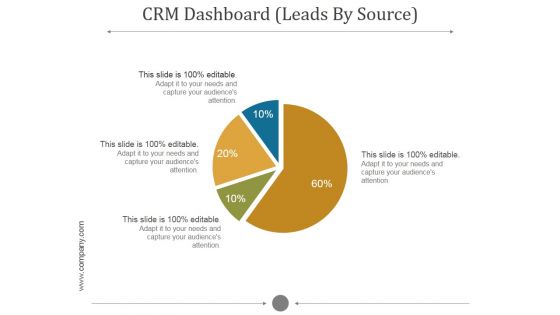
Crm Dashboard Leads By Source Ppt PowerPoint Presentation Example File
This is a crm dashboard leads by source ppt powerpoint presentation example file. This is a five stage process. The stages in this process are pie, division, finance, dashboard, percent.
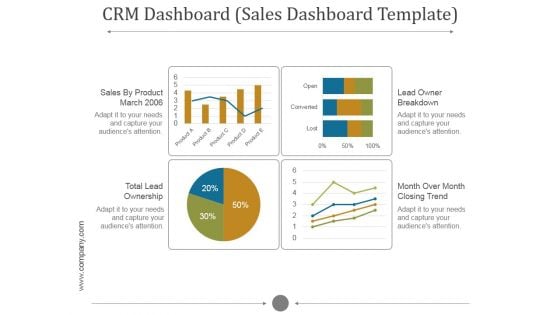
Crm Dashboard Sales Dashboard Template Ppt PowerPoint Presentation Inspiration
This is a crm dashboard sales dashboard template ppt powerpoint presentation inspiration. This is a five stage process. The stages in this process are sales by product march, lead owner breakdown, total lead ownership, month over month closing trend.
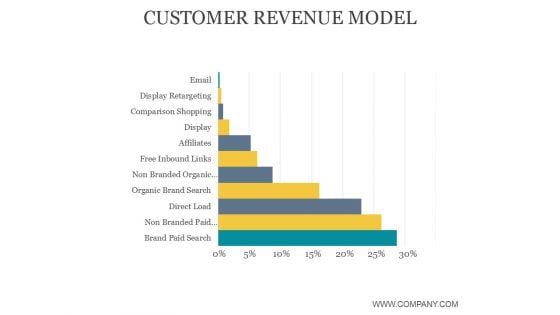
Customer Revenue Model Ppt PowerPoint Presentation Gallery
This is a customer revenue model ppt powerpoint presentation gallery. This is a seven stage process. The stages in this process are brand paid search, display, business, email, display retargeting.
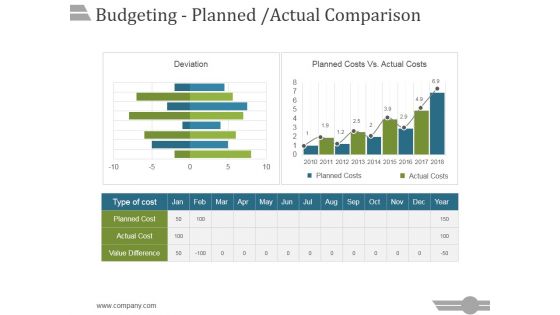
Budgeting Planned Actual Comparison Ppt PowerPoint Presentation Portfolio
This is a budgeting planned actual comparison ppt powerpoint presentation portfolio. This is a three stage process. The stages in this process are business, strategy, marketing, analysis, success, bar graph.
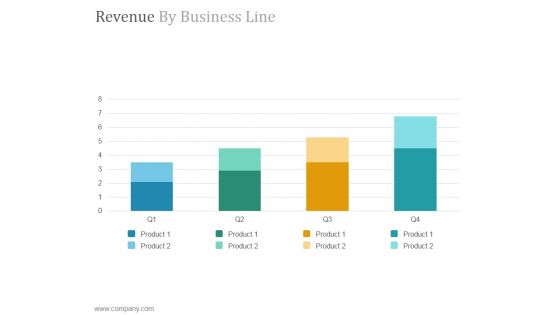
Revenue By Business Line Ppt PowerPoint Presentation Example File
This is a revenue by business line ppt powerpoint presentation example file. This is a four stage process. The stages in this process are product, growth, graph, business, success.
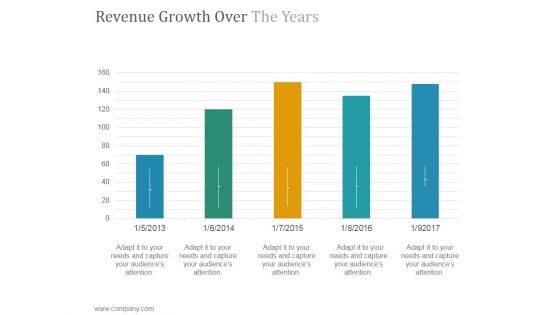
Revenue Growth Over The Years Ppt PowerPoint Presentation Example 2015
This is a revenue growth over the years ppt powerpoint presentation example 2015. This is a five stage process. The stages in this process are success, product, growth, graph, business.
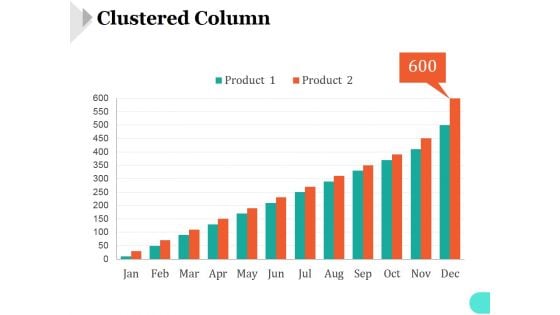
Clustered Column Template 1 Ppt PowerPoint Presentation Inspiration
This is a clustered column template 1 ppt powerpoint presentation inspiration. This is a twelve stage process. The stages in this process are bar graph, marketing, strategy, analysis, business, success.
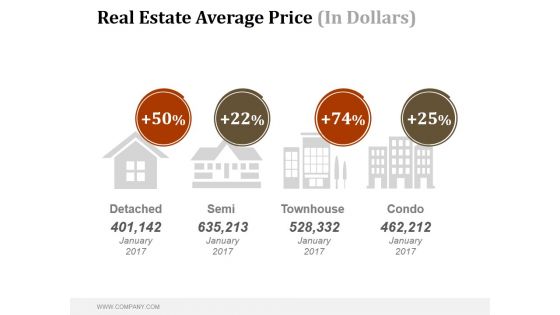
Real Estate Average Price In Dollars Ppt PowerPoint Presentation Inspiration
This is a real estate average price in dollars ppt powerpoint presentation inspiration. This is a four stage process. The stages in this process are detached, semi, townhouse, condo.
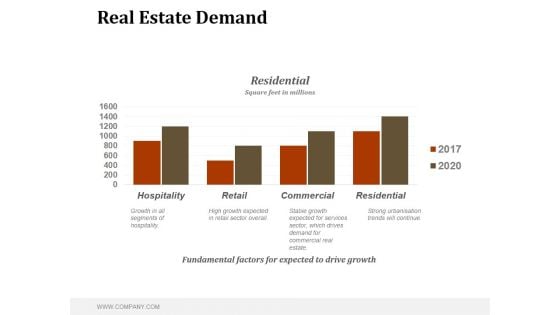
Real Estate Demand Ppt PowerPoint Presentation Graphics
This is a real estate demand ppt powerpoint presentation graphics. This is a four stage process. The stages in this process are fundamental factors for expected to drive growth, residential, square feet in millions.
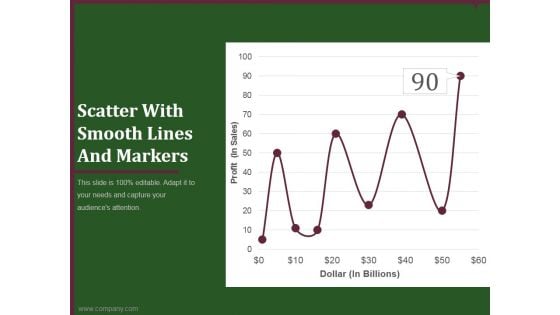
Scatter With Smooth Lines And Markers Ppt PowerPoint Presentation Example
This is a scatter with smooth lines and markers ppt powerpoint presentation example. This is a seven stage process. The stages in this process are business, marketing, success, growth, finance.
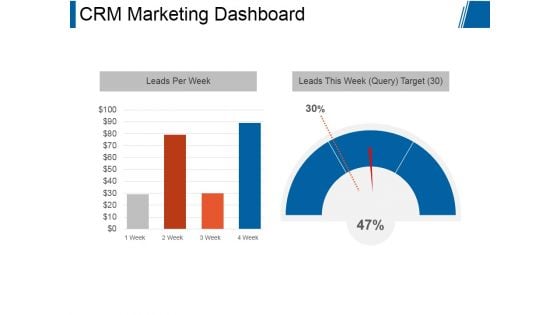
Crm Marketing Dashboard Ppt PowerPoint Presentation Designs
This is a crm marketing dashboard ppt powerpoint presentation designs. This is a two stage process. The stages in this process are leads per week, leads this week target.
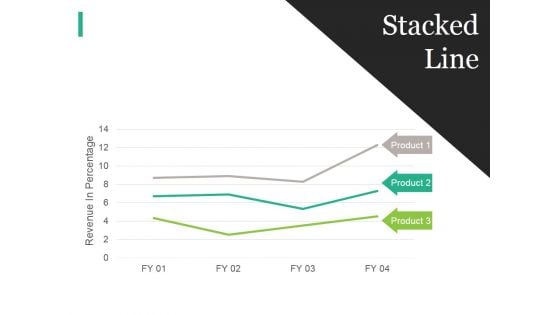
Stacked Line Ppt PowerPoint Presentation File Display
This is a stacked line ppt powerpoint presentation file display. This is a three stage process. The stages in this process are business, strategy, marketing, analysis, revenue in percentage, stacked line.
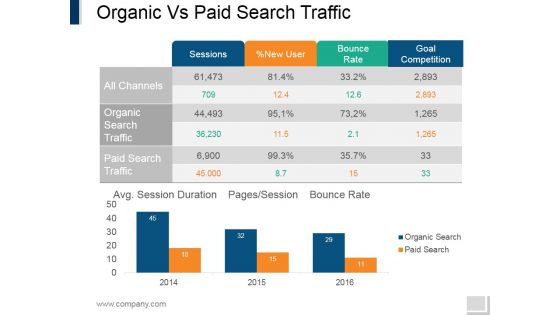
Organic Vs Paid Search Traffic Ppt PowerPoint Presentation Styles Sample
This is a organic vs paid search traffic ppt powerpoint presentation styles sample. This is a two stage process. The stages in this process are sessions, new user, bounce rate, goal competition, organic search traffic, paid search traffic.
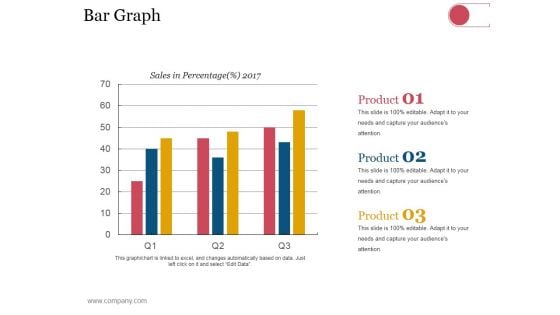
Bar Graph Ppt PowerPoint Presentation Visual Aids Model
This is a bar graph ppt powerpoint presentation visual aids model. This is a three stage process. The stages in this process are business, strategy, analysis, planning, sales in percentage.
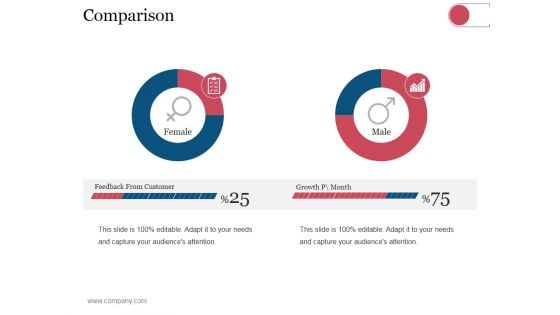
Comparison Ppt PowerPoint Presentation Pictures Templates
This is a comparison ppt powerpoint presentation pictures templates. This is a two stage process. The stages in this process are business, strategy, analysis, planning, feedback from customer, growth.
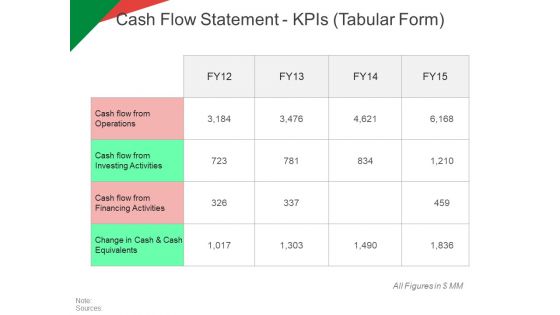
Cash Flow Statement Kpis Tabular Form Ppt PowerPoint Presentation Model Graphic Tips
This is a cash flow statement kpis tabular form ppt powerpoint presentation model graphic tips. This is a four stage process. The stages in this process are operations, investing activities, net increase in cash, financing activities.
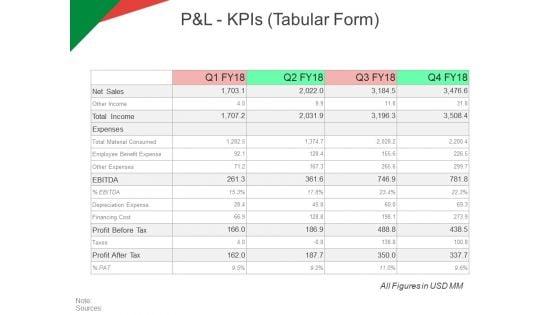
P And L Kpis Tabular Form Ppt PowerPoint Presentation Model Ideas
This is a p and l kpis tabular form ppt powerpoint presentation model ideas. This is a four stage process. The stages in this process are revenue, operating profit, cogs, net profit.
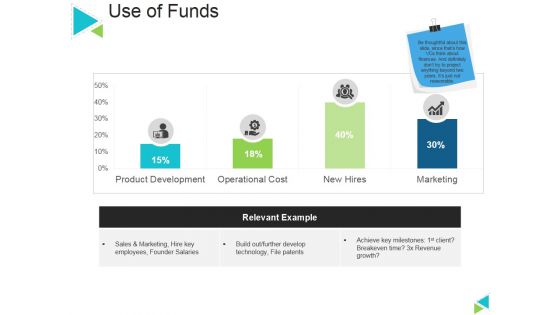
Use Of Funds Ppt PowerPoint Presentation Layouts Graphics Template
This is a use of funds ppt powerpoint presentation layouts graphics template. This is a four stage process. The stages in this process are relevant example, marketing, business, product development, new hires.
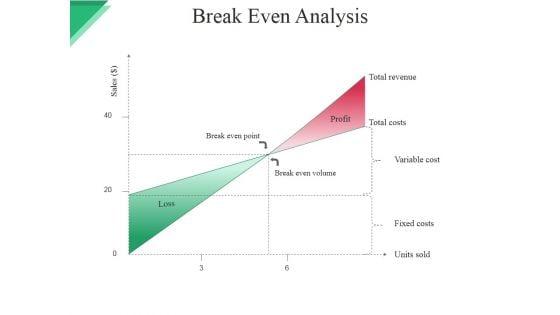
Break Even Analysis Ppt PowerPoint Presentation Styles Samples
This is a break even analysis ppt powerpoint presentation styles samples. This is a two stage process. The stages in this process are break even point, break even volume, profit, total revenue, total costs, variable cost.
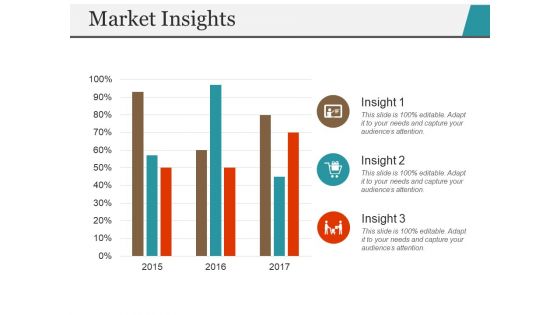
Market Insights Template 1 Ppt PowerPoint Presentation Ideas Topics
This is a market insights template 1 ppt powerpoint presentation ideas topics. This is a three stage process. The stages in this process are insight, finance, percentage, business, marketing, graph.
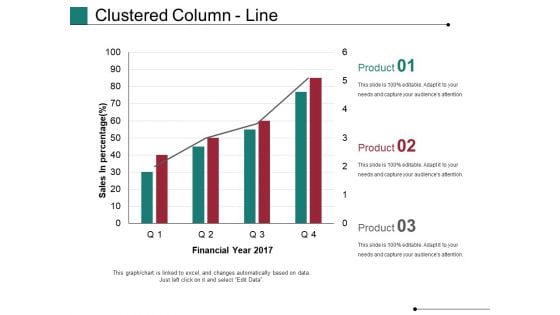
Clustered Column Line Ppt PowerPoint Presentation Model Rules
This is a clustered column line ppt powerpoint presentation model rules. This is a four stage process. The stages in this process are financial year, sales in percentage, business, marketing, growth, graph.
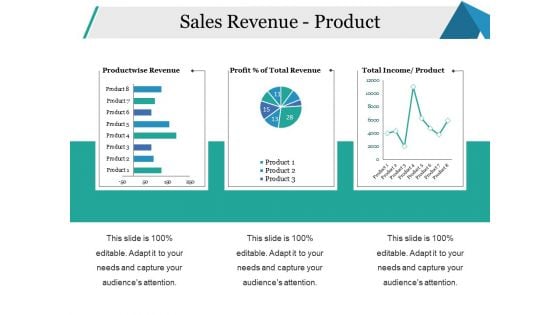
Sales Revenue Product Ppt PowerPoint Presentation Styles Skills
This is a sales revenue product ppt powerpoint presentation styles skills. This is a three stage process. The stages in this process are productwise revenue, income product, business, percentage, strategy.
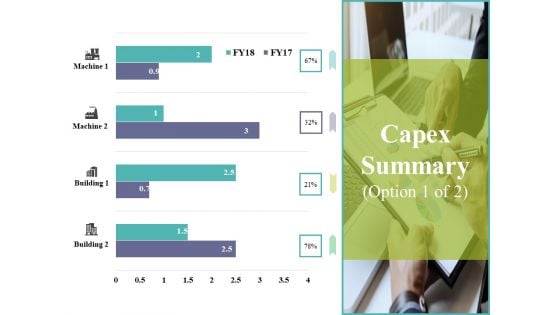
Capex Summary Template 1 Ppt PowerPoint Presentation Gallery Visuals
This is a capex summary template 1 ppt powerpoint presentation gallery visuals. This is a four stage process. The stages in this process are building, machine, business, marketing, graph.
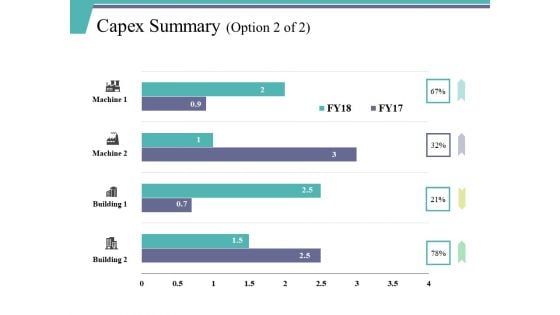
Capex Summary Template 2 Ppt PowerPoint Presentation File Background Designs
This is a capex summary template 2 ppt powerpoint presentation file background designs. This is a four stage process. The stages in this process are building, machine, business, marketing, graph.
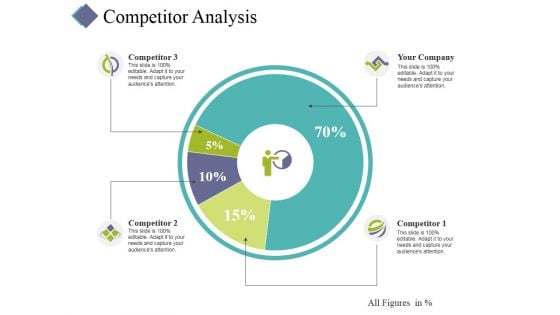
Competitor Analysis Template 2 Ppt PowerPoint Presentation Styles Background Designs
This is a competitor analysis template 2 ppt powerpoint presentation styles background designs. This is a four stage process. The stages in this process are competitor analysis, finance, marketing, strategy, business.
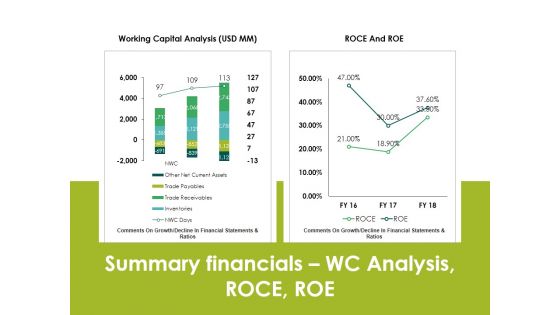
Summary Financials Wc Analysis Roce Roe Ppt PowerPoint Presentation Pictures Outfit
This is a summary financials wc analysis roce roe ppt powerpoint presentation pictures outfit. This is a two stage process. The stages in this process are business, finance, analysis, marketing, strategy, growth.
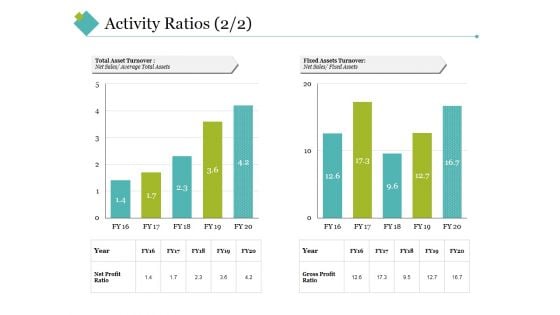
Activity Ratios Template 4 Ppt PowerPoint Presentation Styles Slideshow
This is a activity ratios template 4 ppt powerpoint presentation styles slideshow. This is a two stage process. The stages in this process are total asset turnover, fixed assets turnover, net sales, year, net profit ratio, gross profit ratio.
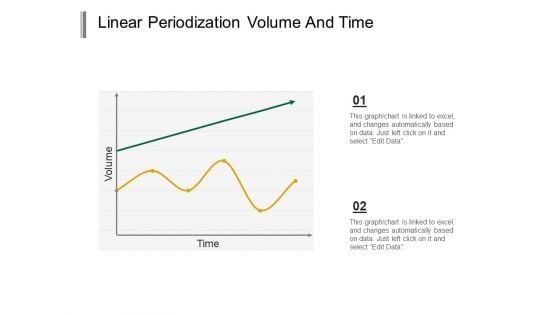
Linear Periodization Volume And Time Ppt PowerPoint Presentation Summary Topics
This is a linear periodization volume and time ppt powerpoint presentation summary topics. This is a two stage process. The stages in this process are linear periodization, linear growth, linear progression.
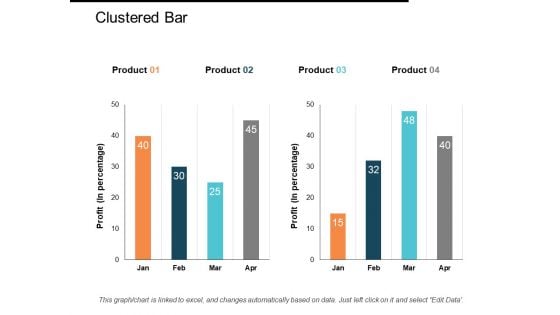
Clustered Bar Ppt PowerPoint Presentation Gallery Inspiration
This is a clustered bar ppt powerpoint presentation gallery inspiration. This is a four stage process. The stages in this process are clustered bar, product, profit, business, bar graph.
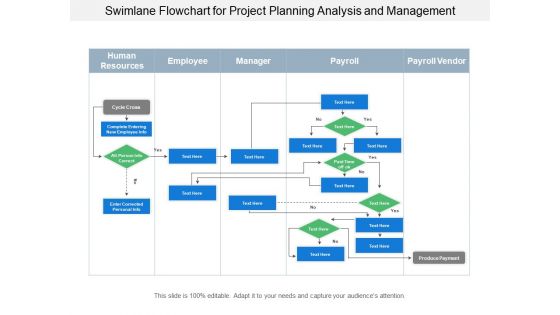
Swimlane Flowchart For Project Planning Analysis And Management Ppt PowerPoint Presentation Portfolio Tips
This is a swimlane flowchart for project planning analysis and management ppt powerpoint presentation portfolio tips. This is a five stage process. The stages in this process are swim lane diagram, flowchart, management.
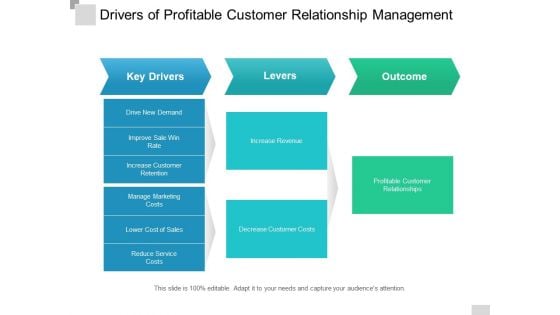
Drivers Of Profitable Customer Relationship Management Ppt PowerPoint Presentation Inspiration Example Topics
This is a drivers of profitable customer relationship management ppt powerpoint presentation inspiration example topics. This is a three stage process. The stages in this process are decision tree, decision point, driver diagram.
Venn Daigram And Sales Ppt PowerPoint Presentation Visual Aids Summary
This is a venn diagram and sales ppt powerpoint presentation visual aids summary. This is a five stage process. The stages in this process are marketing, business, management, planning, strategy.
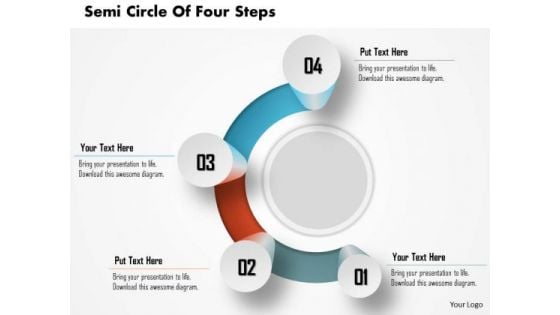
Consulting Slides Semi Circle Of Four Steps Business Presentation
This diagram is designed with graphics of semicircle of four steps. This PowerPoint layout will be ideal choice for illustrate four steps in presentations on product development, development process, process management, project management, etc.
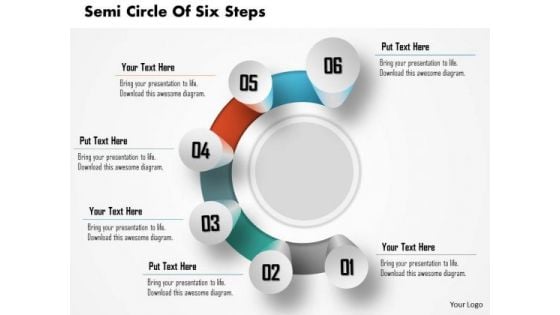
Consulting Slides Semi Circle Of Six Steps Business Presentation
This diagram is designed with graphics of semicircle of six steps. This PowerPoint layout will be ideal choice for illustrate six steps in presentations on product development, development process, process management, project management, etc.
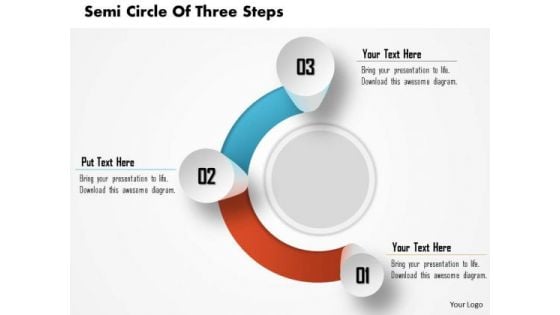
Consulting Slides Semi Circle Of Three Steps Business Presentation
This diagram is designed with graphics of semicircle of three steps. This PowerPoint layout will be ideal choice for illustrate three steps in presentations on product development, development process, process management, project management, etc.
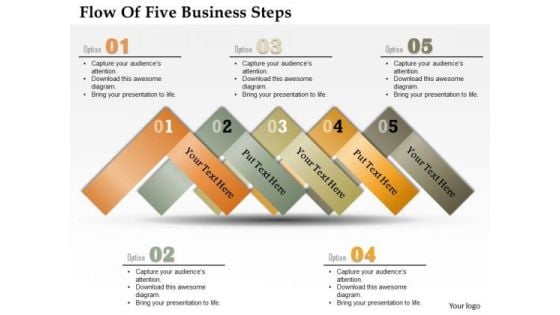
Consulting Slides Flow Of Five Business Steps Business Presentation
This diagram can be used in analyzing, designing, documenting or managing a process or program. Arrows represents flow of Information. It helps help the viewer to understand a process.
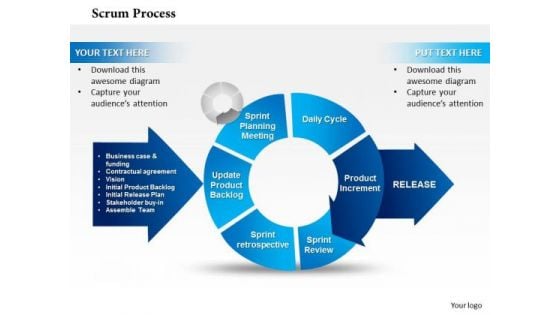
Business Framework Scrum PowerPoint Presentation
Scrum is a process framework that focuses on close customer collaboration, incremental delivery, disciplined change management, and rapid development and deployment. This diagram enables the users to create their own display of the required processes in an easy way.
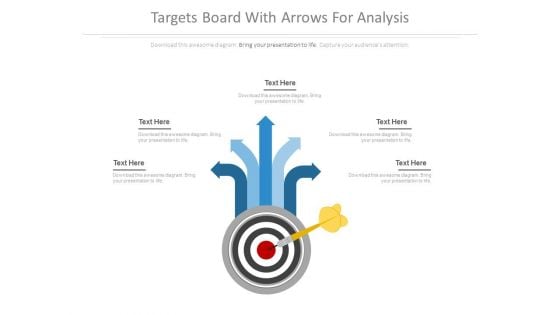
Targets Board With Arrows For Analysis Powerpoint Slides
This PowerPoint template has been designed with target diagram with arrows. Download this slide design for target management development processes. Enlighten others on the process with this innovative PowerPoint template.
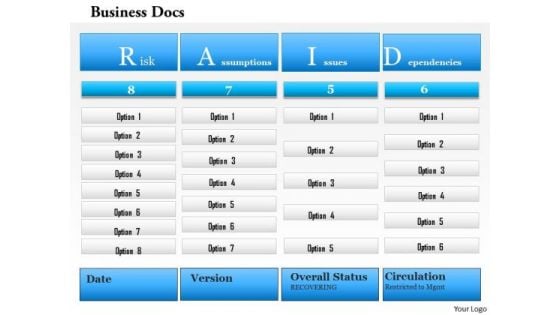
Business Framework Business Doc1 PowerPoint Presentation
A .sequential cube diagram is used to design this Power Point template slide. This PPT slide contain the step by step integration and development process for any business. Use this PPT slide for your business process related presentation.
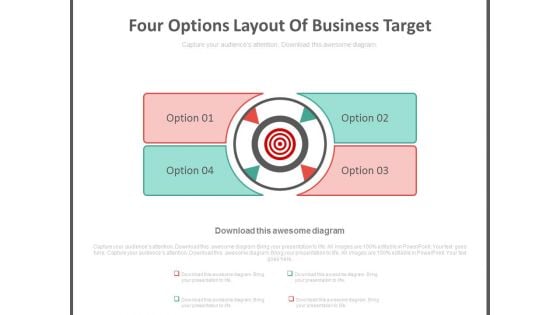
Four Options Layout Of Business Target Powerpoint Slides
This business slide contains graphics of four options layout. This PowerPoint diagram is suitable to present business process flows for target achievement. Enlighten others on the process with this innovative PowerPoint template.
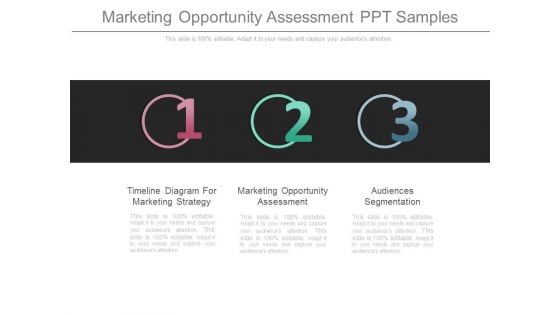
Marketing Opportunity Assessment Ppt Samples
This is a marketing opportunity assessment ppt samples. This is a three stage process. The stages in this process are timeline diagram for marketing strategy, marketing opportunity assessment, audiences segmentation.
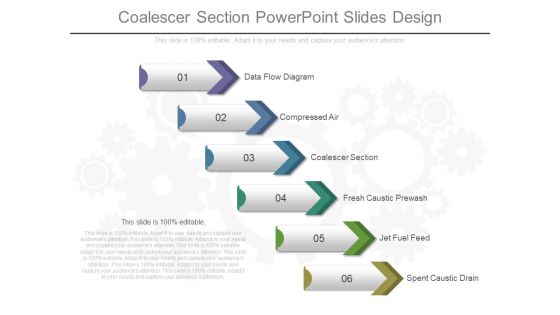
Coalescer Section Powerpoint Slides Design
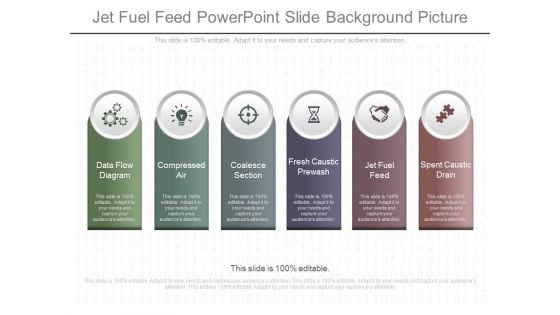
Jet Fuel Feed Powerpoint Slide Background Picture
This is a jet fuel feed powerpoint slide background picture. This is a six stage process. The stages in this process are data flow diagram, compressed air, coalesce section, fresh caustic prewash, jet fuel feed, spent caustic drain.
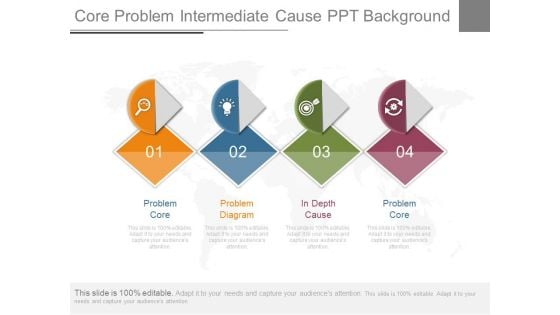
Core Problem Intermediate Cause Ppt Background
This is a core problem intermediate cause ppt background. This is a four stage process. The stages in this process are problem core, problem diagram, in depth cause, problem core.
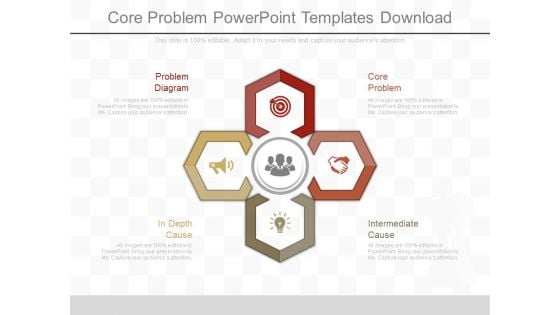
Core Problem Powerpoint Templates Download
This is a core problem powerpoint templates download. This is a four stage process. The stages in this process are problem diagram, in depth cause, intermediate cause, core problem.
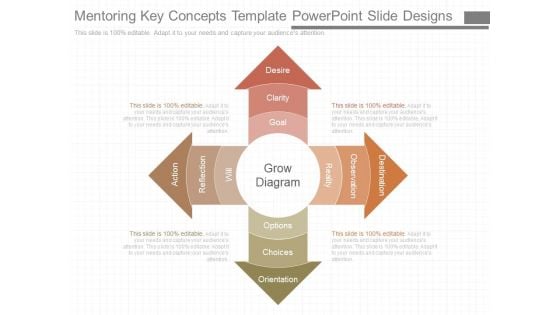
Mentoring Key Concepts Template Powerpoint Slide Designs
This is a mentoring key concepts template powerpoint slide designs. This is a four stage process. The stages in this process are grow diagram, will, reflection, action, reality, observation, destination, options, choices, orientation, desire, clarity, goal.
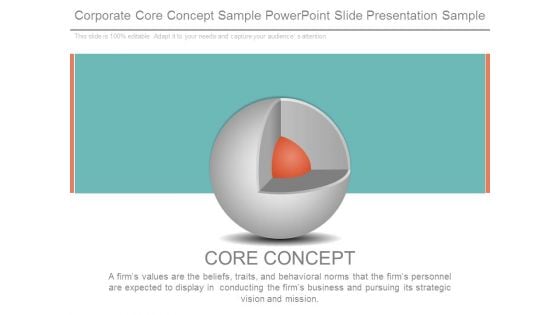
Corporate Core Concept Sample Powerpoint Slide Presentation Sample
This is a corporate core concept sample powerpoint slide presentation sample. This is a one stage process. The stages in this process are core concept, business, presentation, diagram, strategy.
Mind Map Design For Customer Journey Mapping Ppt Design
This is a mind map design for customer journey mapping ppt design. This is a two stage process. The stages in this process are mind map, diagram, concept, idea, brainstorm.
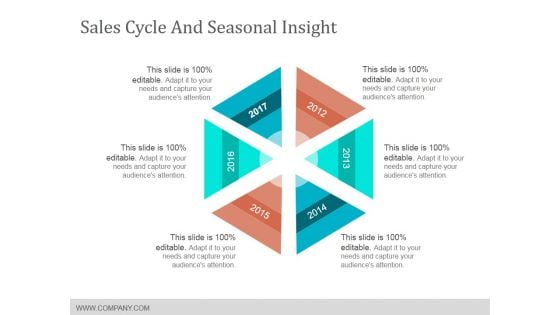
Sales Cycle And Seasonal Insight Template 1 Ppt PowerPoint Presentation Visual Aids Slides
This is a sales cycle and seasonal insight template 1 ppt powerpoint presentation visual aids slides. This is a six stage process. The stages in this process are year, diagram, business, marketing.
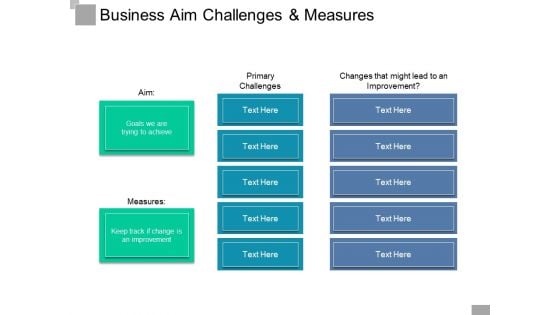
Business Aim Challenges And Measures Ppt PowerPoint Presentation Infographic Template Influencers
This is a business aim challenges and measures ppt powerpoint presentation infographic template influencers. This is a three stage process. The stages in this process are decision tree, decision point, driver diagram.
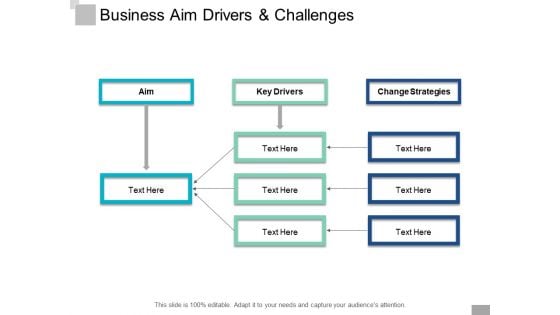
Business Aim Drivers And Challenges Ppt PowerPoint Presentation Styles Example Topics
This is a business aim drivers and challenges ppt powerpoint presentation styles example topics. This is a three stage process. The stages in this process are decision tree, decision point, driver diagram.
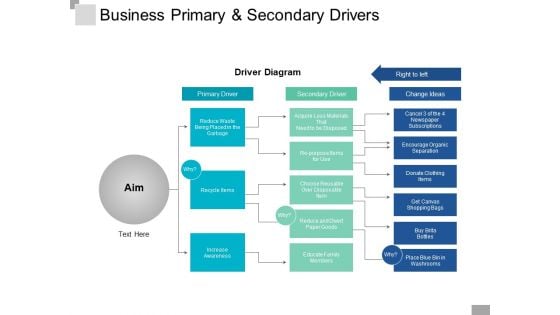
Business Primary And Secondary Drivers Ppt PowerPoint Presentation Microsoft
This is a business primary and secondary drivers ppt powerpoint presentation microsoft. This is a three stage process. The stages in this process are decision tree, decision point, driver diagram.
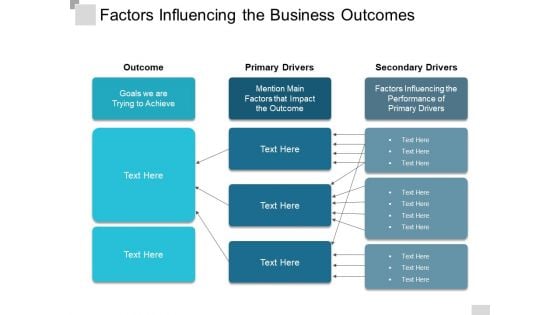
Factors Influencing The Business Outcomes Ppt PowerPoint Presentation Ideas Demonstration
This is a factors influencing the business outcomes ppt powerpoint presentation ideas demonstration. This is a three stage process. The stages in this process are decision tree, decision point, driver diagram.
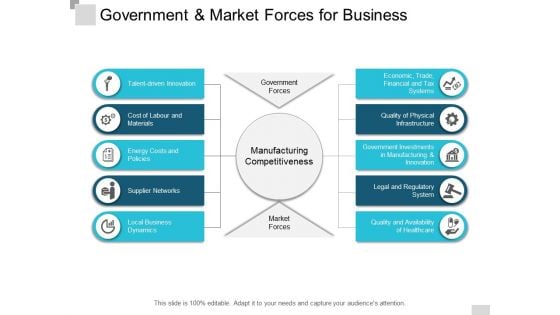
Government And Market Forces For Business Ppt PowerPoint Presentation Styles Gallery
This is a government and market forces for business ppt powerpoint presentation styles gallery. This is a ten stage process. The stages in this process are decision tree, decision point, driver diagram.
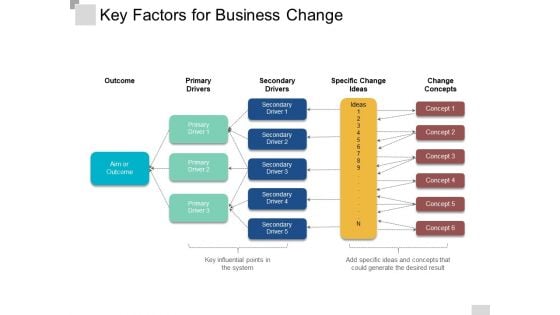
Key Factors For Business Change Ppt PowerPoint Presentation Ideas Files
This is a key factors for business change ppt powerpoint presentation ideas files. This is a four stage process. The stages in this process are decision tree, decision point, driver diagram.
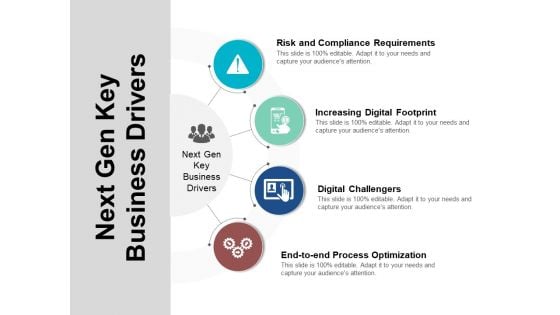
Next Gen Key Business Drivers Ppt PowerPoint Presentation File Gridlines
This is a next gen key business drivers ppt powerpoint presentation file gridlines. This is a four stage process. The stages in this process are decision tree, decision point, driver diagram.
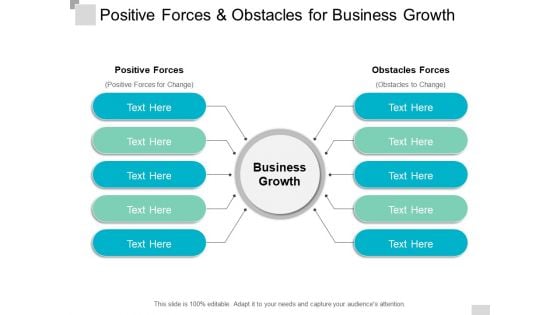
Positive Forces And Obstacles For Business Growth Ppt PowerPoint Presentation Slides Professional
This is a positive forces and obstacles for business growth ppt powerpoint presentation slides professional. This is a ten stage process. The stages in this process are decision tree, decision point, driver diagram.
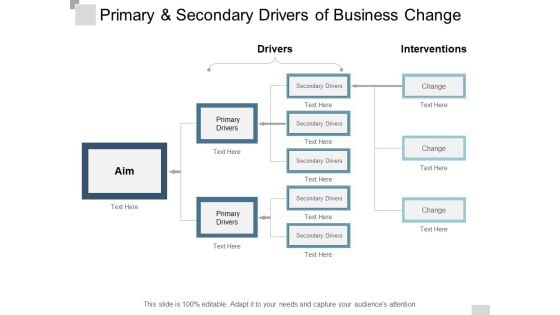
Primary And Secondary Drivers Of Business Change Ppt PowerPoint Presentation Summary Sample
This is a primary and secondary drivers of business change ppt powerpoint presentation summary sample. This is a three stage process. The stages in this process are decision tree, decision point, driver diagram.
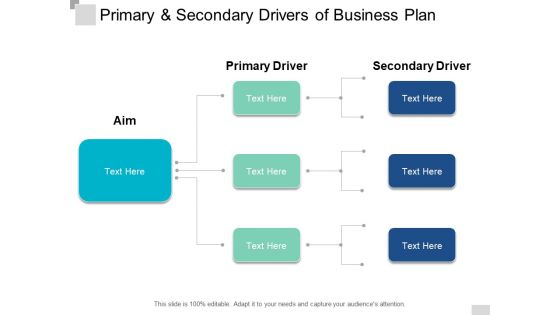
Primary And Secondary Drivers Of Business Plan Ppt PowerPoint Presentation Gallery Backgrounds
This is a primary and secondary drivers of business plan ppt powerpoint presentation gallery backgrounds. This is a three stage process. The stages in this process are decision tree, decision point, driver diagram.
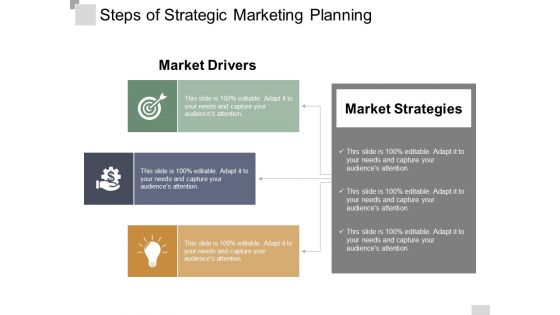
Steps Of Strategic Marketing Planning Ppt PowerPoint Presentation Pictures Template
This is a steps of strategic marketing planning ppt powerpoint presentation pictures template. This is a three stage process. The stages in this process are decision tree, decision point, driver diagram.
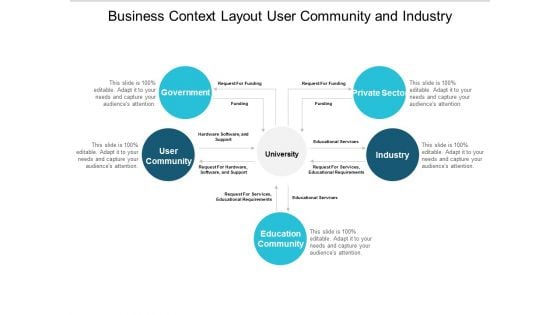
Business Context Layout User Community And Industry Ppt Powerpoint Presentation Gallery Guide
This is a business context layout user community and industry ppt powerpoint presentation gallery guide. This is a five stage process. The stages in this process are context diagram, context shapes, context visuals.
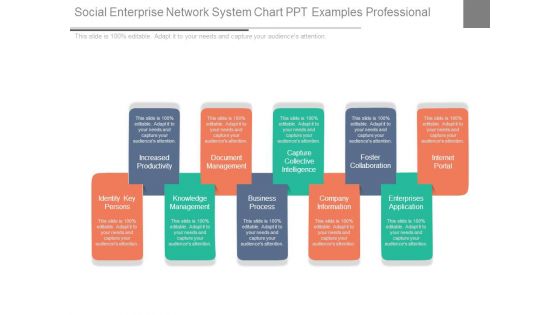
Social Enterprise Network System Chart Ppt Examples Professional
This is a social enterprise network system chart ppt examples professional. This is a ten stage process. The stages in this process are increased productivity, document management, capture collective intelligence, foster collaboration, internet portal, enterprises application, company information, business process, knowledge management, identity key persons.
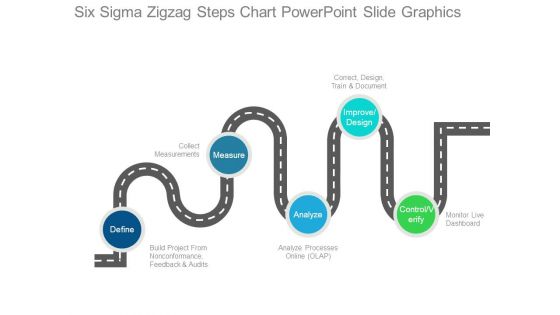
Six Sigma Zigzag Steps Chart Powerpoint Slide Graphics
This is a six sigma zigzag steps chart powerpoint slide graphics. This is a five stage process. The stages in this process are define, build project from nonconformance feedback and audits, collect measurements, measure, analyze, analyze processes online olap, improve design, correct design train and document, monitor live dashboard, control verify.
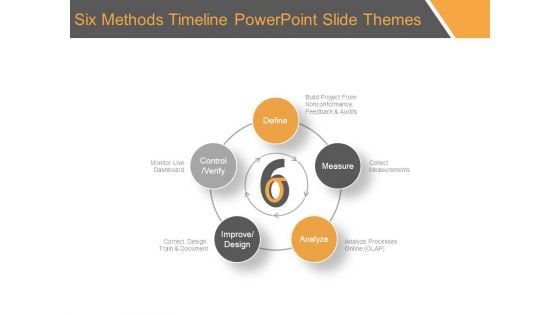
Six Methods Timeline Powerpoint Slide Themes
This is a six methods timeline powerpoint slide themes. This is a five stage process. The stages in this process are define, measure, analyze, improve design, control verify, build project from nonconformance, feedback and audits, collect measurements, analyze processes online, correct, design, train and document, monitor live dashboard.

Rational Perspectives On Decision Making Chart Ppt Slides
This is a rational perspectives on decision making chart ppt slides. This is a six stage process. The stages in this process are recognition of decision requirement, diagnosis and analysis of causes, development of alternatives, selection of desired alternative, implementation of chosen alternative, evaluation and feedback, decision making process.
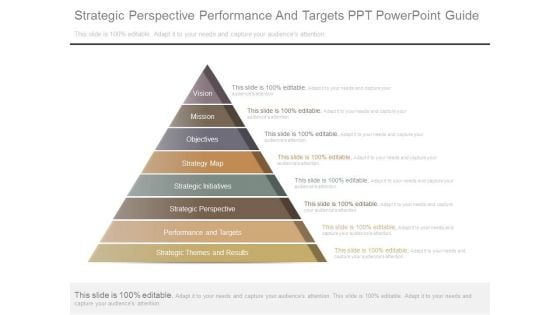
Strategic Perspective Performance And Targets Ppt Powerpoint Guide
This is a strategic perspective performance and targets ppt powerpoint guide. This is a eight stage process. The stages in this process are vision, mission, objectives, strategy map, strategic initiatives, strategic perspective, performance and targets, strategic themes and results.
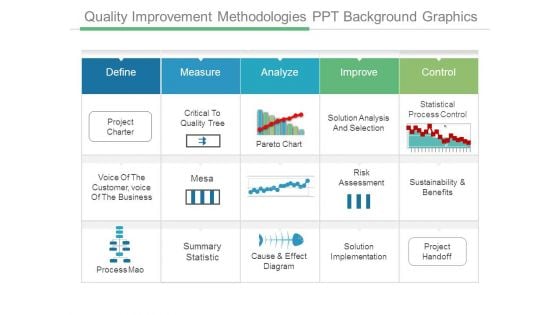
Quality Improvement Methodologies Ppt Background Graphics
This is a quality improvement methodologies ppt background graphics. This is a five stage process. The stages in this process are define, measure, analyze, improve, control, project charter, critical to quality tree, pareto chart, solution analysis and selection, statistical process control, voice of the customer, voice of the business, mesa, risk assessment, sustainability and benefits, process mao, summary statistic, cause and effect diagram, solution implementation, project handoff.
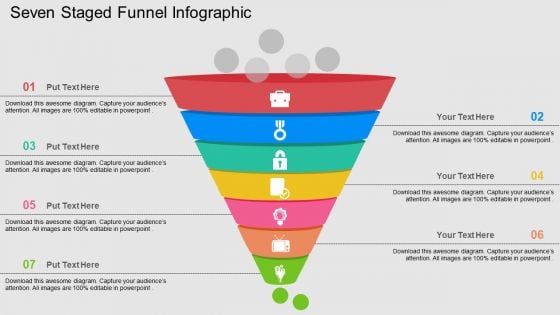
Seven Staged Funnel Infographic Powerpoint Templates
Funnel diagram with icons have been displayed in this business slide. This business diagram slide helps to exhibit sales process. Use this diagram to build an exclusive presentation.
Timeline Arrow Ppt PowerPoint Presentation Model Themes
Presenting this set of slides with name timeline arrow ppt powerpoint presentation model themes. This is a two stage process. The stages in this process are timeline, process, management, planning, business. This is a completely editable PowerPoint presentation and is available for immediate download. Download now and impress your audience.
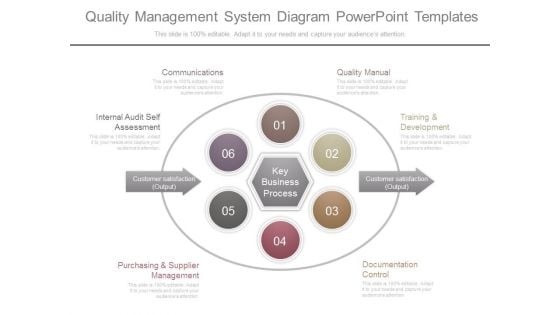
Quality Management System Diagram Powerpoint Templates
This is a quality management system diagram powerpoint templates. This is a nine stage process. The stages in this process are communications, internal audit self assessment, purchasing and supplier management, quality manual, training and development, documentation control, customer satisfaction output, customer satisfaction output, key business process.
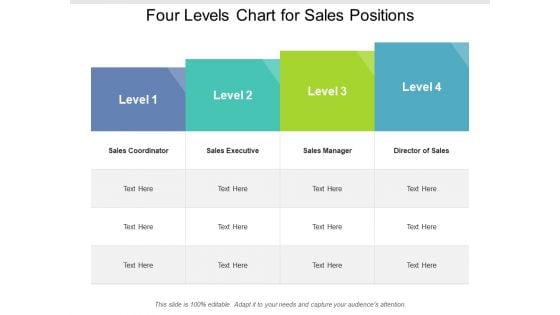
Four Levels Chart For Sales Positions Ppt PowerPoint Presentation Show
Presenting this set of slides with name four levels chart for sales positions ppt powerpoint presentation show. This is a four stage process. The stages in this process are Multi Level Growth Table, Process, Planning. This is a completely editable PowerPoint presentation and is available for immediate download. Download now and impress your audience.

Linear Representation Of Procedure Using 3 Stages Wire Schematic PowerPoint Slides
We present our linear representation of procedure using 3 stages wire schematic PowerPoint Slides.Use our Arrows PowerPoint Templates because,This is an amazing graphic to pin-point the manner and processes for them to follow in order to interconnect with each other. Use our Symbol PowerPoint Templates because, You have the ideas to develop the teams vision of where they need to be in the future. Use our Leadership PowerPoint Templates because,This diagram can be used to illustrate the logical path or system Use our Abstract PowerPoint Templates because,you can Organize your thoughts and illuminate your ideas accordingly. Use our Business PowerPoint Templates because,You have selected your team man for manUse these PowerPoint slides for presentations relating to Abstract, Arrow, Blank, Business, Chart, Circular, Circulation, Concept, Conceptual, Design, Diagram, Executive, Flow, Icon, Idea, Illustration, Linear, Management, Model, Numbers, Organization, Procedure, Process, Progression, Resource, Sequence, Sequential, Stages, Steps, Strategy. The prominent colors used in the PowerPoint template are Yellow, Gray, White Entice them with our Linear Representation Of Procedure Using 3 Stages Wire Schematic PowerPoint Slides. Lure them with your thoughts.
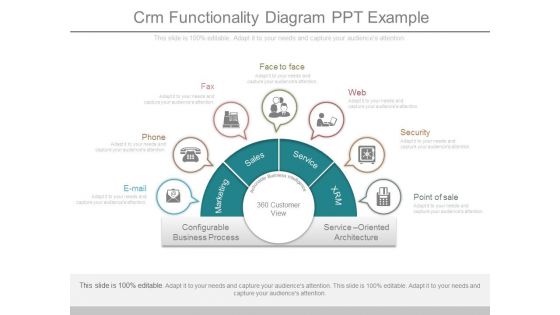
Crm Functionality Diagram Ppt Example
This is a crm functionality diagram ppt example. This is a seven stage process. The stages in this process are e mail, phone, fax, face to face, web, security, point of sale, marketing, sales, service, xrm, configurable business process, service oriented architecture, 360 customer view.
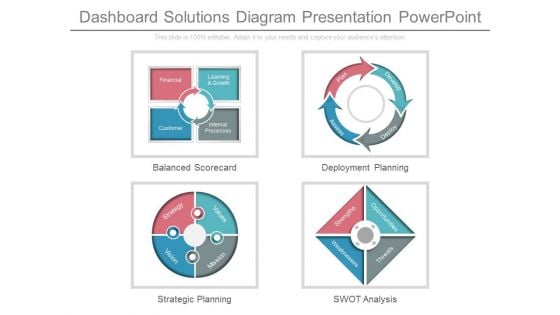
Dashboard Solutions Diagram Presentation Powerpoint
This is a dashboard solutions diagram presentation powerpoint. This is a four stage process. The stages in this process are financial, learning and growth, customer, internal processes, balanced scorecard, values, mission, strategy, vision, strategic planning, plan, develop, assess, deploy, deployment planning, strengths, opportunities, weaknesses, threats, swot analysis.
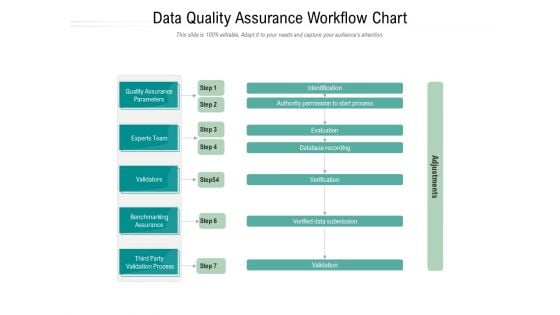
Data Quality Assurance Workflow Chart Ppt PowerPoint Presentation Slides Layout Ideas PDF
Presenting this set of slides with name data quality assurance workflow chart ppt powerpoint presentation slides layout ideas pdf. This is a five stage process. The stages in this process are quality assurance parameters, experts team, validators, benchmarking assurance, party validation process, adjustments. This is a completely editable PowerPoint presentation and is available for immediate download. Download now and impress your audience.
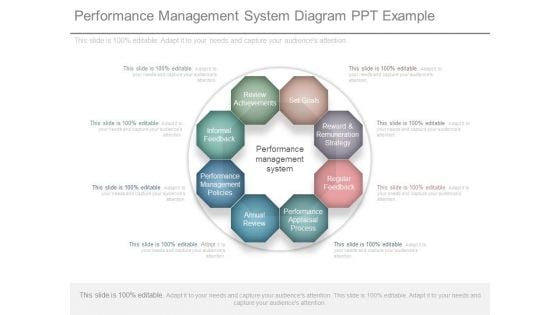
Performance Management System Diagram Ppt Example
This is a performance management system diagram ppt example. This is a eight stage process. The stages in this process are performance management policies, informal feedback, review achievements, set goals, reward and remuneration strategy, regular feedback, performance appraisal process, annual review, performance management system.
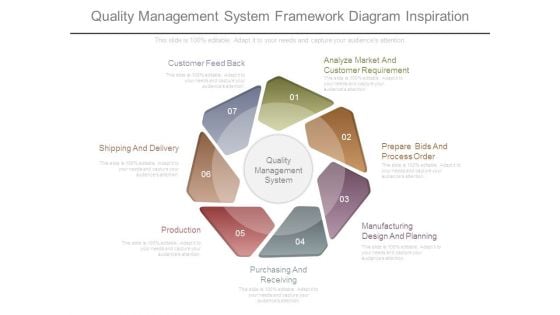
Quality Management System Framework Diagram Inspiration
This is a quality management system framework diagram inspiration. This is a seven stage process. The stages in this process are analyze market and customer requirement, prepare bids and process order, manufacturing design and planning, purchasing and receiving, production, shipping and delivery, customer feed back.
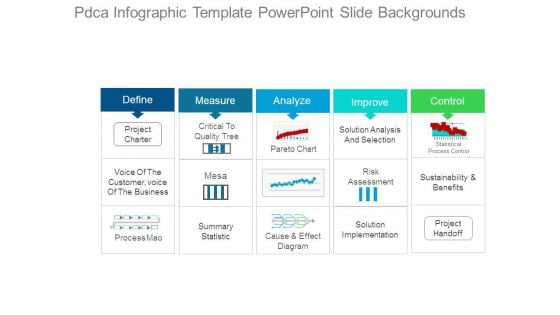
Pdca Infographic Template Powerpoint Slide Backgrounds
This is a pdca infographic template powerpoint slide backgrounds. This is a five stage process. The stages in this process are define, measure, analyze, improve, control, project charter, critical to quality tree, pareto chart, solution analysis and selection, statistical process control, voice of the customer voice of the business, mesa, risk assessment, sustainability and benefits, process mao, summary statistic, cause and effect diagram, solution implementation, project handoff.
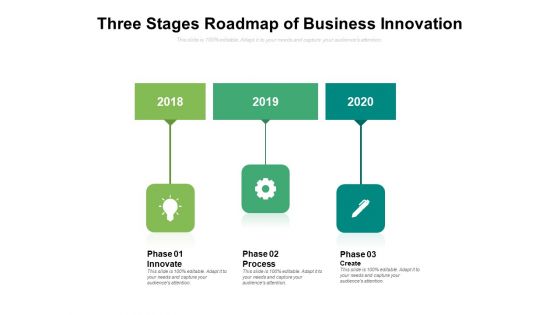
Three Stages Roadmap Of Business Innovation Ppt PowerPoint Presentation Slides Visuals PDF
Presenting this set of slides with name three stages roadmap of business innovation ppt powerpoint presentation slides visuals pdf. This is a three stage process. The stages in this process are phase 01 innovate, phase 02 process, phase 03 create, 2018 to 2020. This is a completely editable PowerPoint presentation and is available for immediate download. Download now and impress your audience.
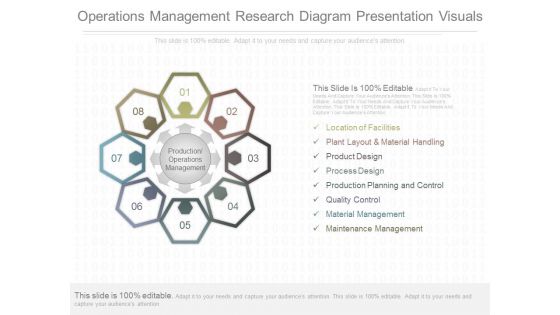
Operations Management Research Diagram Presentation Visuals
This is a operations management research diagram presentation visuals. This is a eight stage process. The stages in this process are location of facilities, plant layout and material handling, product design, process design, production planning and control, quality control, material management, maintenance management.
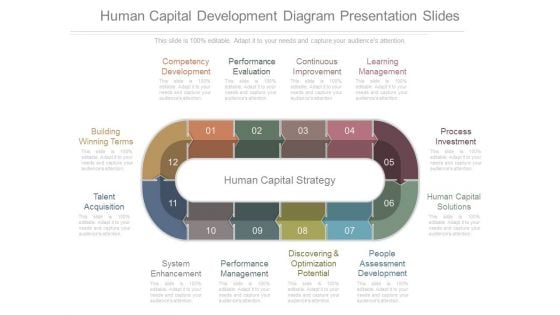
Human Capital Development Diagram Presentation Slides
This is a human capital development diagram presentation slides. This is a twelve stage process. The stages in this process are competency development, performance evaluation, continuous improvement, learning management, building winning terms, talent acquisition, human capital strategy, process investment, human capital solutions, people assessment development, discovering and optimization potential, performance management, system enhancement.
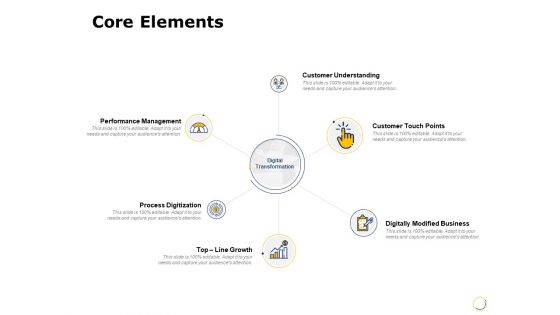
Core Elements Ppt PowerPoint Presentation File Diagrams
Presenting this set of slides with name core elements ppt powerpoint presentation file diagrams. This is a six stage process. The stages in this process are customer understanding, customer touch points, digitally modified business, top line growth, process digitization, performance management. This is a completely editable PowerPoint presentation and is available for immediate download. Download now and impress your audience.
Lego Growth Gears Ppt PowerPoint Presentation Outline Themes
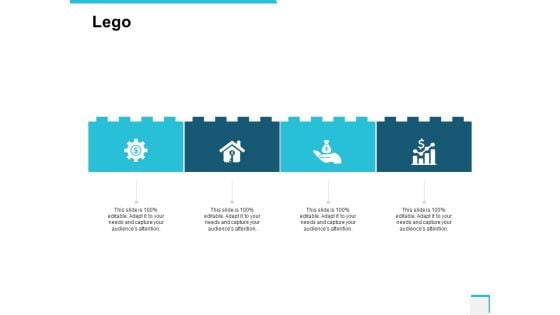
Presenting this set of slides with name lego growth gears ppt powerpoint presentation outline themes. This is a four stage process. The stages in this process are lego, marketing, process, management, planning. This is a completely editable PowerPoint presentation and is available for immediate download. Download now and impress your audience.
Sustainable Sales Productivity Improvement Diagram Powerpoint Show
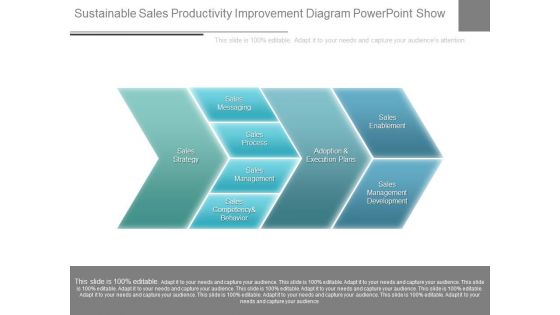
This is a sustainable sales productivity improvement diagram powerpoint show. This is a four stage process. The stages in this process are sales strategy, sales messaging, sales process, sales management, sales competency and behavior, adoption and execution plans, sales enablement, sales management development.
Value Chain Analysis In Quality Management Diagram Slides
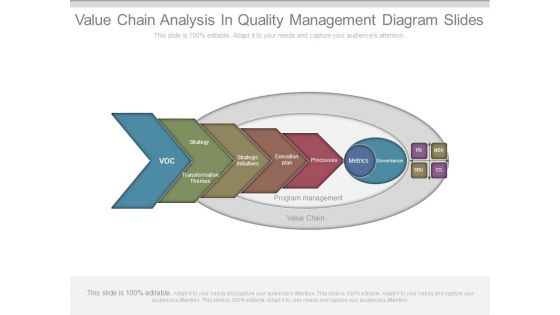
This is a value chain analysis in quality management diagram slides. This is a five stage process. The stages in this process are voc, strategy, themes, transformation, strategic initiatives, execution plan, processes, metrics, governance, program management, value chain, pd, mbu, sbu, cs.
Sales Efficiency Improvement Sample Diagram Powerpoint Slides
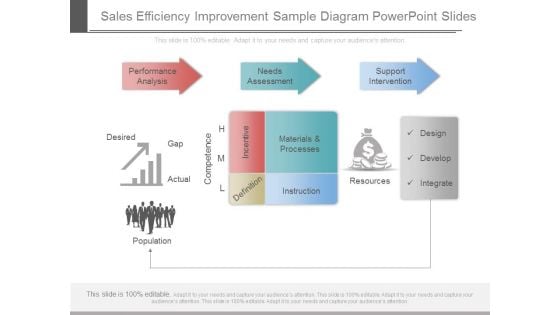
This is a sales efficiency improvement sample diagram powerpoint slides. This is a three stage process. The stages in this process are performance analysis, needs assessment, support intervention, design, develop, integrate, desired, gap, actual, population, competence, hml, incentive, definition, materials and processes, instruction, resources.

 Home
Home