Process Infographic
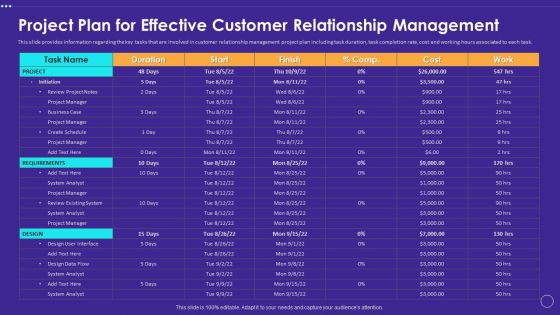
Project Plan For Effective Customer Relationship Management Infographics PDF
This slide provides information regarding the key tasks that are involved in customer relationship management project plan including task duration, task completion rate, cost and working hours associated to each task. The best PPT templates are a great way to save time, energy, and resources. Slidegeeks have 100 percent editable powerpoint slides making them incredibly versatile. With these quality presentation templates, you can create a captivating and memorable presentation by combining visually appealing slides and effectively communicating your message. Download Project Plan For Effective Customer Relationship Management Infographics PDF from Slidegeeks and deliver a wonderful presentation.
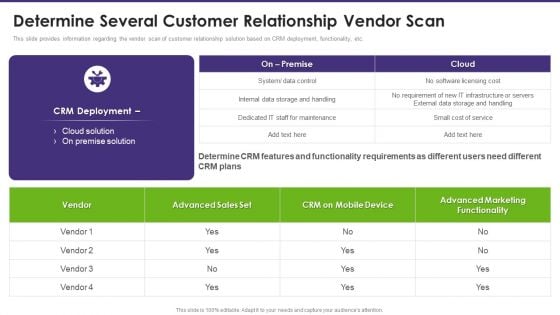
Customer Relationship Management Determine Several Customer Relationship Vendor Infographics PDF
This slide provides information regarding the vendor scan of customer relationship solution based on CRM deployment, functionality, etc. Boost your pitch with our creative Customer Relationship Management Determine Several Customer Relationship Vendor Infographics PDF. Deliver an awe-inspiring pitch that will mesmerize everyone. Using these presentation templates you will surely catch everyones attention. You can browse the ppts collection on our website. We have researchers who are experts at creating the right content for the templates. So you dont have to invest time in any additional work. Just grab the template now and use them.
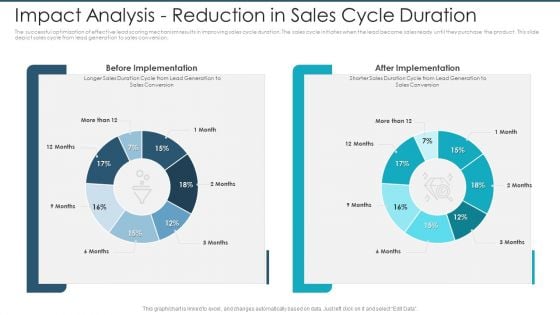
Impact Analysis Reduction In Sales Cycle Duration Infographics PDF
The successful optimization of effective lead scoring mechanism results in improving sales cycle duration. The sales cycle initiates when the lead become sales ready until they purchase the product. This slide depict sales cycle from lead generation to sales conversion.Deliver an awe-inspiring pitch with this creative impact analysis reduction in sales cycle duration infographics pdf. bundle. Topics like before implementation, after implementation can be discussed with this completely editable template. It is available for immediate download depending on the needs and requirements of the user.
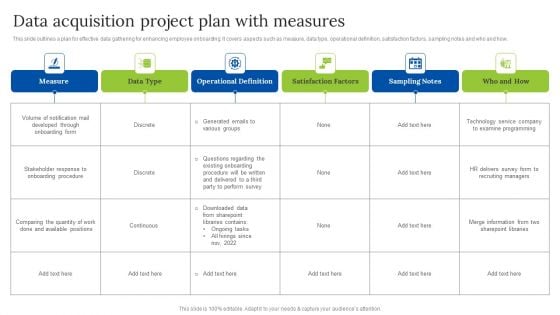
Data Acquisition Project Plan With Measures Infographics PDF
This slide outlines a plan for effective data gathering for enhancing employee onboarding. It covers aspects such as measure, data type, operational definition, satisfaction factors, sampling notes and who and how.Showcasing this set of slides titled Data Acquisition Project Plan With Measures Infographics PDF. The topics addressed in these templates are Stakeholder Response, Onboarding Procedure, Recruiting Managers. All the content presented in this PPT design is completely editable. Download it and make adjustments in color, background, font etc. as per your unique business setting.
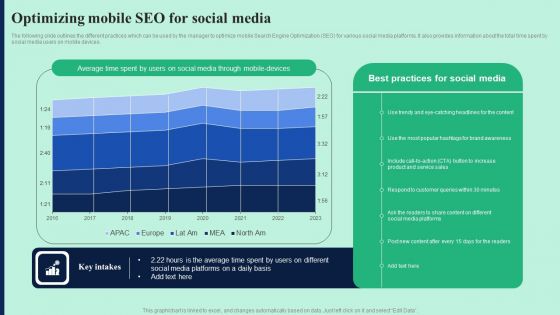
Optimizing Mobile SEO For Social Media Infographics PDF
The following slide outlines the different practices which can be used by the manager to optimize mobile Search Engine Optimization SEO for various social media platforms. It also provides information about the total time spent by social media users on mobile devices. There are so many reasons you need a Optimizing Mobile SEO For Social Media Infographics PDF. The first reason is you can not spend time making everything from scratch, Thus, Slidegeeks has made presentation templates for you too. You can easily download these templates from our website easily.
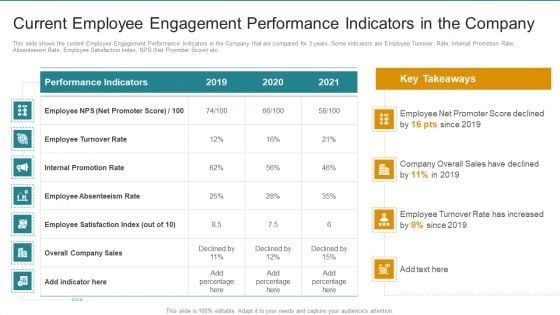
Current Employee Engagement Performance Indicators In The Company Infographics PDF
This slide shows the current Employee Engagement Performance Indicators in the Company that are compared for 3 years. Some indicators are Employee Turnover Rate, Internal Promotion Rate, Absenteeism Rate, Employee Satisfaction Index, NPS Net Promoter Score etc. Deliver an awe inspiring pitch with this creative Current Employee Engagement Performance Indicators In The Company Infographics PDF bundle. Topics like Net Promoter Score, Internal Promotion Rate, Employee Turnover Rate can be discussed with this completely editable template. It is available for immediate download depending on the needs and requirements of the user.
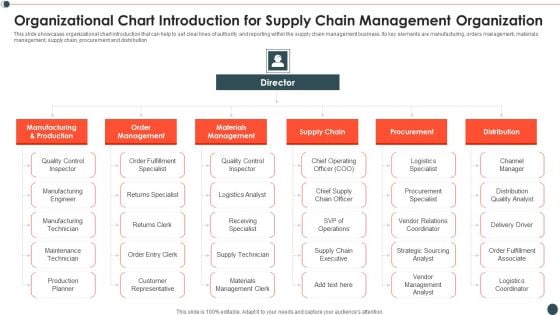
Organizational Chart Introduction For Supply Chain Management Organization Infographics PDF
This slide showcases organizational chart introduction that can help to set clear lines of authority and reporting within the supply chain management business. Its key elements are manufacturing, orders management, materials management, supply chain, procurement and distribution.Showcasing this set of slides titled Organizational Chart Introduction For Supply Chain Management Organization Infographics PDF The topics addressed in these templates are Manufacturing Production, Order Management, Materials Management All the content presented in this PPT design is completely editable. Download it and make adjustments in color, background, font etc. as per your unique business setting.
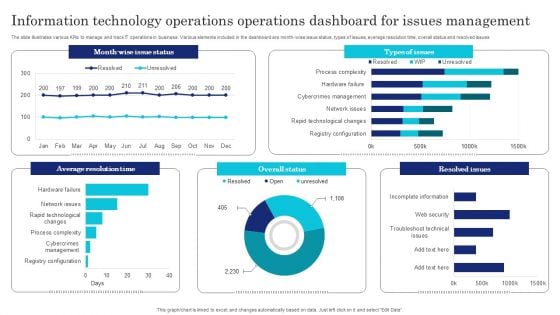
Information Technology Operations Operations Dashboard For Issues Management Infographics PDF
The slide illustrates various KPIs to manage and track IT operations in business. Various elements included in the dashboard are month-wise issue status, types of issues, average resolution time, overall status and resolved issues. Showcasing this set of slides titled Information Technology Operations Operations Dashboard For Issues Management Infographics PDF. The topics addressed in these templates are Information Technology Operations, Operations Dashboard, Issues Management. All the content presented in this PPT design is completely editable. Download it and make adjustments in color, background, font etc. as per your unique business setting.
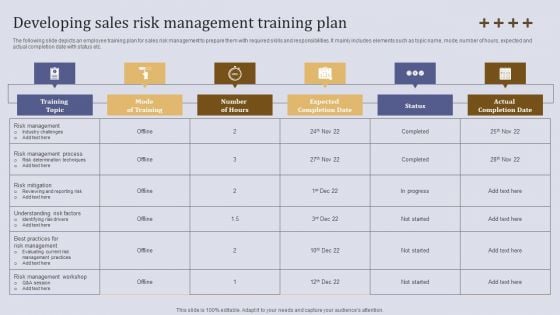
Developing Sales Risk Management Training Plan Ppt Slides Infographics PDF
The following slide depicts an employee training plan for sales risk management to prepare them with required skills and responsibilities. It mainly includes elements such as topic name, mode, number of hours, expected and actual completion date with status etc. The best PPT templates are a great way to save time, energy, and resources. Slidegeeks have 100 percent editable powerpoint slides making them incredibly versatile. With these quality presentation templates, you can create a captivating and memorable presentation by combining visually appealing slides and effectively communicating your message. Download Developing Sales Risk Management Training Plan Ppt Slides Infographics PDF from Slidegeeks and deliver a wonderful presentation.
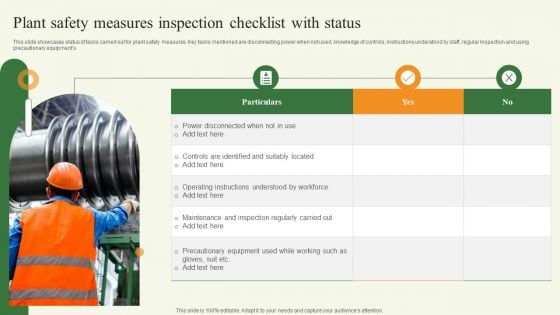
Plant Safety Measures Inspection Checklist With Status Infographics PDF
This slide showcases status of tasks carried out for plant safety measures. Key tasks mentioned are disconnecting power when not used, knowledge of controls, instructions understood by staff, regular inspection and using precautionary equipments. Showcasing this set of slides titled Plant Safety Measures Inspection Checklist With Status Infographics PDF. The topics addressed in these templates are Plant Safety Measures, Inspection Checklist With Status, Equipment. All the content presented in this PPT design is completely editable. Download it and make adjustments in color, background, font etc. as per your unique business setting.
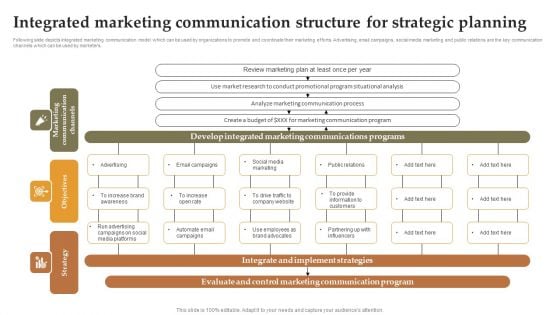
Integrated Marketing Communication Structure For Strategic Planning Infographics PDF
Following slide depicts integrated marketing communication model which can be used by organizations to promote and coordinate their marketing efforts. Advertising, email campaigns, social media marketing and public relations are the key communication channels which can be used by marketers. Showcasing this set of slides titled Integrated Marketing Communication Structure For Strategic Planning Infographics PDF. The topics addressed in these templates are Integrate And Implement Strategies, Evaluate And Control Marketing. All the content presented in this PPT design is completely editable. Download it and make adjustments in color, background, font etc. as per your unique business setting.
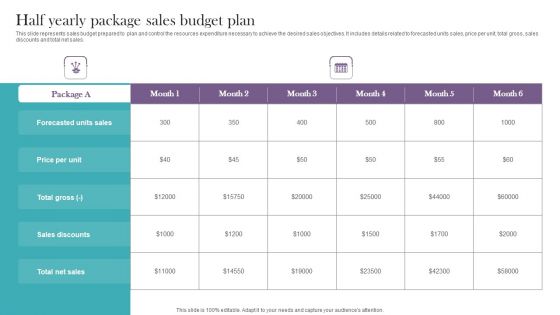
Half Yearly Package Sales Budget Plan Infographics PDF
This slide represents sales budget prepared to plan and control the resources expenditure necessary to achieve the desired sales objectives. It includes details related to forecasted units sales, price per unit, total gross, sales discounts and total net sales. Showcasing this set of slides titled Half Yearly Package Sales Budget Plan Infographics PDF. The topics addressed in these templates are Half Yearly Package, Sales Budget Plan. All the content presented in this PPT design is completely editable. Download it and make adjustments in color, background, font etc. as per your unique business setting.
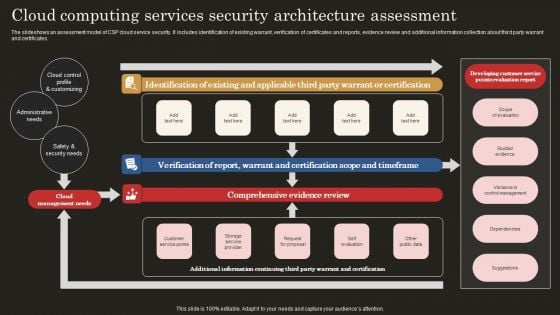
Cloud Computing Services Security Architecture Assessment Infographics PDF
The slideshows an assessment model of CSP cloud service security. It includes identification of existing warrant, verification of certificates and reports, evidence review and additional information collection about third party warrant and certificates. Showcasing this set of slides titled Cloud Computing Services Security Architecture Assessment Infographics PDF. The topics addressed in these templates are Cloud Control Profile, Administrative Need, Safety Security Needs. All the content presented in this PPT design is completely editable. Download it and make adjustments in color, background, font etc. as per your unique business setting.
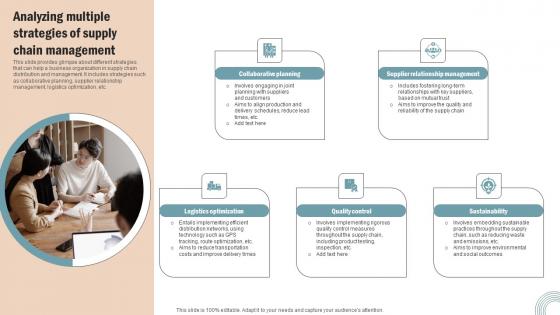
Analyzing Multiple Strategies Operations Strategy Improve Business Productivity Infographics Pdf
This slide provides glimpse about different strategies that can help a business organization in supply chain distribution and management. It includes strategies such as collaborative planning, supplier relationship management, logistics optimization, etc. Want to ace your presentation in front of a live audience Our Analyzing Multiple Strategies Operations Strategy Improve Business Productivity Infographics Pdf can help you do that by engaging all the users towards you. Slidegeeks experts have put their efforts and expertise into creating these impeccable powerpoint presentations so that you can communicate your ideas clearly. Moreover, all the templates are customizable, and easy to edit and downloadable. Use these for both personal and commercial use. This slide provides glimpse about different strategies that can help a business organization in supply chain distribution and management. It includes strategies such as collaborative planning, supplier relationship management, logistics optimization, etc.

Overview Of Grey Hat Hackers Ppt Infographics Pictures PDF
This slide depicts the grey hat hackers and how they first hack any system, computer, software, or network and then ask for permission. This is a overview of grey hat hackers ppt infographics pictures pdf template with various stages. Focus and dispense information on five stages using this creative set, that comes with editable features. It contains large content boxes to add your information on topics like systems, security. You can also showcase facts, figures, and other relevant content using this PPT layout. Grab it now.
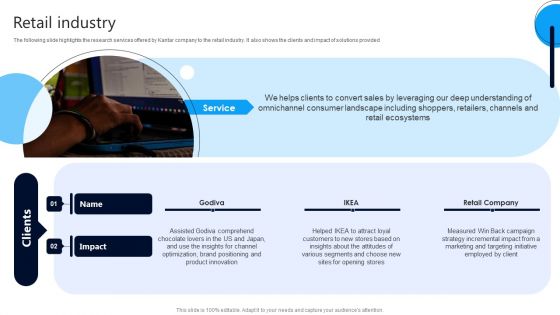
Market Research Evaluation Company Outline Retail Industry Infographics PDF
The following slide highlights the research services offered by Kantar company to the retail industry. It also shows the clients and impact of solutions provided. Are you in need of a template that can accommodate all of your creative concepts This one is crafted professionally and can be altered to fit any style. Use it with Google Slides or PowerPoint. Include striking photographs, symbols, depictions, and other visuals. Fill, move around, or remove text boxes as desired. Test out color palettes and font mixtures. Edit and save your work, or work with colleagues. Download Market Research Evaluation Company Outline Retail Industry Infographics PDF and observe how to make your presentation outstanding. Give an impeccable presentation to your group and make your presentation unforgettable.

HR Roles And Responsibilities Employee Performance Improvement Strategies Infographics Pdf
This slide covers roles and responsibilities of HR managers to enhance employee performance at workplace. It involves training and development, designing workplace policies, monitoring performance and rewarding and recognition. Make sure to capture your audiences attention in your business displays with our gratis customizable HR Roles And Responsibilities Employee Performance Improvement Strategies Infographics Pdf. These are great for business strategies, office conferences, capital raising or task suggestions. If you desire to acquire more customers for your tech business and ensure they stay satisfied, create your own sales presentation with these plain slides. This slide covers roles and responsibilities of HR managers to enhance employee performance at workplace. It involves training and development, designing workplace policies, monitoring performance and rewarding and recognition.
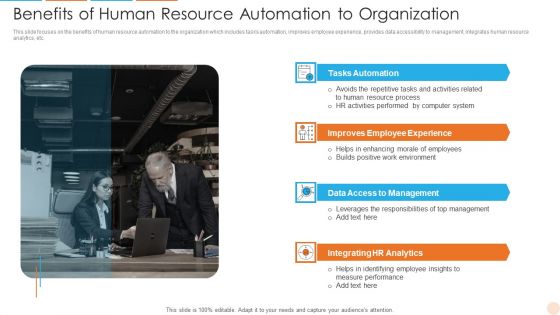
Benefits Of Human Resource Automation To Organization Infographics PDF
This slide focuses on the benefits of human resource automation to the organization which includes tasks automation, improves employee experience, provides data accessibility to management, integrates human resource analytics, etc. Persuade your audience using this Benefits Of Human Resource Automation To Organization Infographics PDF. This PPT design covers four stages, thus making it a great tool to use. It also caters to a variety of topics including Access To Management, Integrating HR Analytics, Improves Employee Experience. Download this PPT design now to present a convincing pitch that not only emphasizes the topic but also showcases your presentation skills.
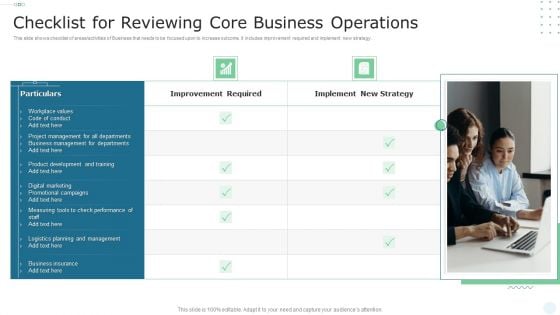
Checklist For Reviewing Core Business Operations Infographics PDF
This slide shows checklist of areas or activities of Business that needs to be focused upon to increase outcome. It includes improvement required and implement new strategy. Persuade your audience using this Checklist For Reviewing Core Business Operations Infographics PDF. This PPT design covers two stages, thus making it a great tool to use. It also caters to a variety of topics including Improvement Required, Implement New Strategy. Download this PPT design now to present a convincing pitch that not only emphasizes the topic but also showcases your presentation skills.
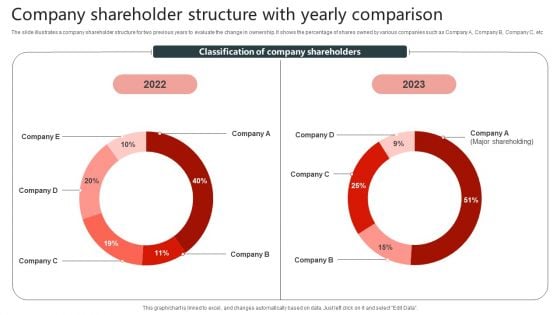
Company Shareholder Structure With Yearly Comparison Infographics PDF
The slide illustrates a company shareholder structure for two previous years to evaluate the change in ownership. It shows the percentage of shares owned by various companies such as Company A, Company B, Company C, etc. Pitch your topic with ease and precision using this Company Shareholder Structure With Yearly Comparison Infographics PDF. This layout presents information on Structure With Yearly Comparison, Company Shareholder. It is also available for immediate download and adjustment. So, changes can be made in the color, design, graphics or any other component to create a unique layout.
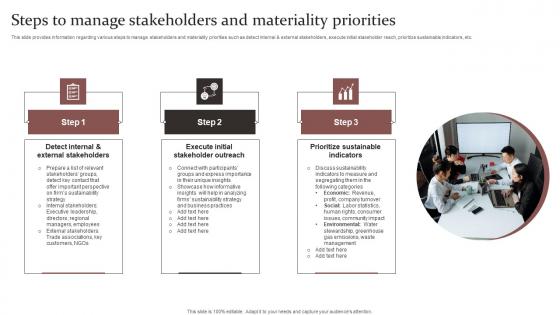
Steps To Manage Responsible Technology Governance Manual Infographics Pdf
This slide provides information regarding various steps to manage stakeholders and materiality priorities such as detect internal and external stakeholders, execute initial stakeholder reach, prioritize sustainable indicators, etc. There are so many reasons you need a Steps To Manage Responsible Technology Governance Manual Infographics Pdf. The first reason is you can not spend time making everything from scratch, Thus, Slidegeeks has made presentation templates for you too. You can easily download these templates from our website easily. This slide provides information regarding various steps to manage stakeholders and materiality priorities such as detect internal and external stakeholders, execute initial stakeholder reach, prioritize sustainable indicators, etc.
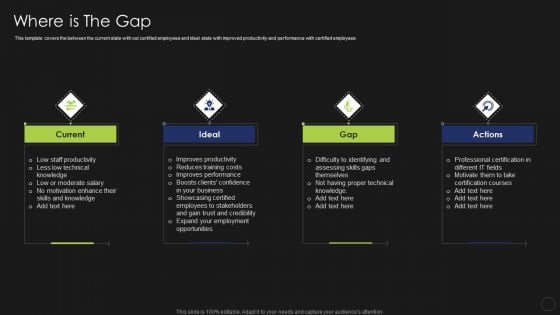
Information Technology Certifications Advantages Where Is The Gap Infographics PDF
This template covers the between the current state with out certified employees and ideal state with improved productivity and performance with certified employees. This is a Information Technology Certifications Advantages Where Is The Gap Infographics PDF template with various stages. Focus and dispense information on four stages using this creative set, that comes with editable features. It contains large content boxes to add your information on topics like Current, Ideal, Gap, Actions. You can also showcase facts, figures, and other relevant content using this PPT layout. Grab it now.

Warehouse Automation Deployment Strategies For Implementing Warehouse Automation Infographics PDF
This slide covers major strategies that can be applied for optimizing the company warehouse. It includes technologies such as goods to person, voice picking, and drones. It also includes features such as double verification mechanisms, improves workers ergonomics, real-time information via the headset and WMS connection, etc. Presenting Warehouse Automation Deployment Strategies For Implementing Warehouse Automation Infographics PDF to provide visual cues and insights. Share and navigate important information on three stages that need your due attention. This template can be used to pitch topics like Voice Picking, Drones Goods Person Technology. In addtion, this PPT design contains high resolution images, graphics, etc, that are easily editable and available for immediate download.
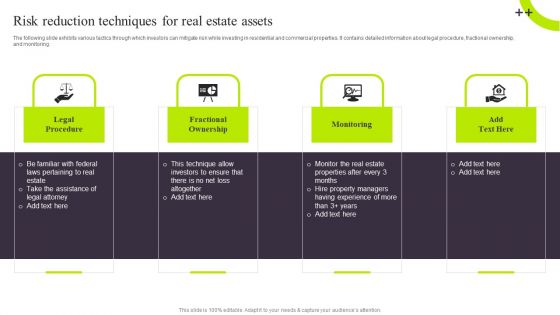
Risk Reduction Techniques For Real Estate Assets Infographics PDF
The following slide exhibits various tactics through which investors can mitigate risk while investing in residential and commercial properties. It contains detailed information about legal procedure, fractional ownership, and monitoring. The Risk Reduction Techniques For Real Estate Assets Infographics PDF is a compilation of the most recent design trends as a series of slides. It is suitable for any subject or industry presentation, containing attractive visuals and photo spots for businesses to clearly express their messages. This template contains a variety of slides for the user to input data, such as structures to contrast two elements, bullet points, and slides for written information. Slidegeeks is prepared to create an impression.
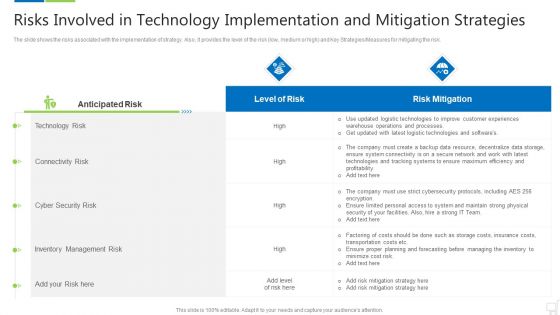
Risks Involved In Technology Implementation And Mitigation Strategies Infographics PDF
The slide shows the risks associated with the implementation of strategy. Also, it provides the level of the risk low, medium or high and Key Strategies Measures for mitigating the risk. Deliver and pitch your topic in the best possible manner with this risks involved in technology implementation and mitigation strategies infographics pdf. Use them to share invaluable insights on technology risk, connectivity risk, inventory management risk and impress your audience. This template can be altered and modified as per your expectations. So, grab it now.

Change Administration Strategies Introduction To The Playbook Infographics PDF
Purpose of the following slide is to provide an overview of the entire playbook as it provides brief introduction of digital transformation as a latest trend of the industry. The following also provides a page wise description of multiple sections of the playbook. Deliver and pitch your topic in the best possible manner with this Change Administration Strategies Introduction To The Playbook Infographics PDF. Use them to share invaluable insights on Executing Transformation Strategy, Develop Roadmap, Executing Vision and impress your audience. This template can be altered and modified as per your expectations. So, grab it now.
Contact Details Snow Ploughing Deal Proposal Ppt Infographics Show PDF
This slide represents contact details for snow ploughing deal proposal including address, contact number, office details, etc. Slidegeeks is one of the best resources for PowerPoint templates. You can download easily and regulate Contact Details Snow Ploughing Deal Proposal Ppt Infographics Show PDF for your personal presentations from our wonderful collection. A few clicks is all it takes to discover and get the most relevant and appropriate templates. Use our Templates to add a unique zing and appeal to your presentation and meetings. All the slides are easy to edit and you can use them even for advertisement purposes.
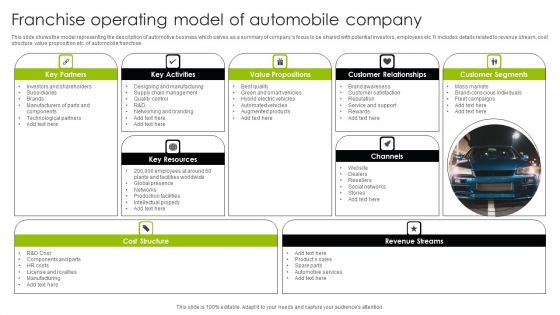
Franchise Operating Model Of Automobile Company Ppt Styles Infographics PDF
This slide shows the model representing the description of automotive business which serves as a summary of companys focus to be shared with potential investors, employees etc. It includes details related to revenue stream, cost structure, value proposition etc. of automobile franchise. Showcasing this set of slides titled Franchise Operating Model Of Automobile Company Ppt Styles Infographics PDF. The topics addressed in these templates are Cost Structure, Revenue Streams, Key Resources, Value Propositions. All the content presented in this PPT design is completely editable. Download it and make adjustments in color, background, font etc. as per your unique business setting.
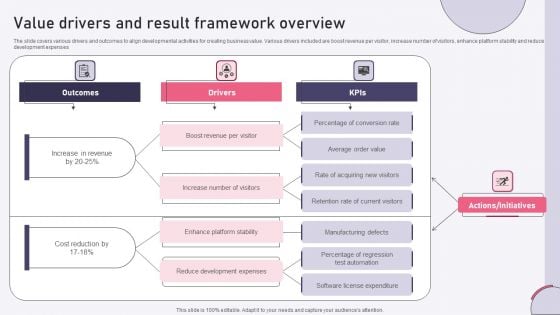
Value Drivers And Result Framework Overview Ppt Infographics Ideas PDF
The slide covers various drivers and outcomes to align developmental activities for creating business value. Various drivers included are boost revenue per visitor, increase number of visitors, enhance platform stability and reduce development expenses. Pitch your topic with ease and precision using this Value Drivers And Result Framework Overview Ppt Infographics Ideas PDF. This layout presents information on Outcomes, Drivers, Kpis, Boost Revenue, Per Visitor. It is also available for immediate download and adjustment. So, changes can be made in the color, design, graphics or any other component to create a unique layout.
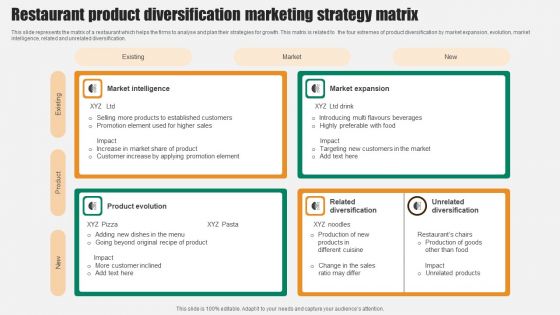
Restaurant Product Diversification Marketing Strategy Matrix Infographics PDF
This slide represents the matrix of a restaurant which helps the firms to analyse and plan their strategies for growth. This matrix is related to the four extremes of product diversification by market expansion, evolution, market intelligence, related and unrelated diversification. Showcasing this set of slides titled Restaurant Product Diversification Marketing Strategy Matrix Infographics PDF. The topics addressed in these templates are Market Intelligence, Market Expansion, Product Evolution. All the content presented in this PPT design is completely editable. Download it and make adjustments in color, background, font etc. as per your unique business setting.
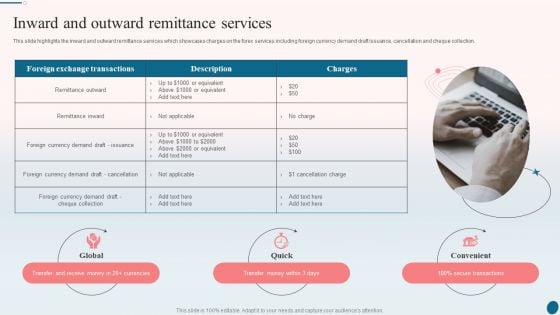
Banking Operations Management Inward And Outward Remittance Services Infographics PDF
This slide highlights the inward and outward remittance services which showcases charges on the forex services including foreign currency demand draft issuance, cancellation and cheque collection. Presenting Banking Operations Management Inward And Outward Remittance Services Infographics PDF to provide visual cues and insights. Share and navigate important information on three stages that need your due attention. This template can be used to pitch topics like Global, Quick, Convenient. In addtion, this PPT design contains high resolution images, graphics, etc, that are easily editable and available for immediate download.
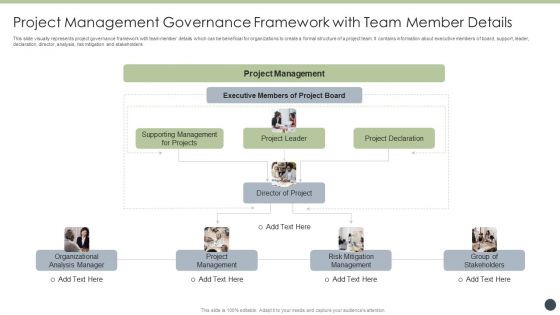
Project Management Governance Framework With Team Member Details Infographics PDF
This slide visually represents project governance framework with team member details which can be beneficial for organizations to create a formal structure of a project team. It contains information about executive members of board, support, leader, declaration, director, analysis, risk mitigation and stakeholders Persuade your audience using this Project Management Governance Framework With Team Member Details Infographics PDF. This PPT design covers three stages, thus making it a great tool to use. It also caters to a variety of topics including Supporting Management, Project Management, Organizational Analysis Manager. Download this PPT design now to present a convincing pitch that not only emphasizes the topic but also showcases your presentation skills.
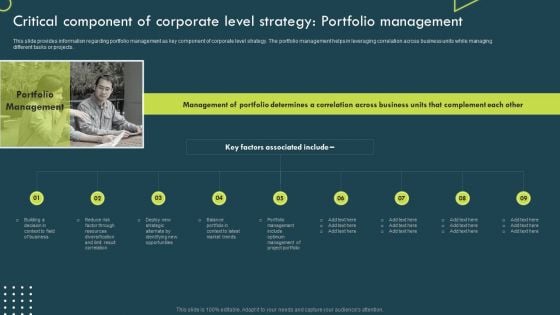
Critical Component Of Corporate Level Strategy Portfolio Management Infographics PDF
This slide provides information regarding portfolio management as key component of corporate level strategy. The portfolio management helps in leveraging correlation across business units while managing different tasks or projects. Present like a pro with Critical Component Of Corporate Level Strategy Portfolio Management Infographics PDF Create beautiful presentations together with your team, using our easy-to-use presentation slides. Share your ideas in real-time and make changes on the fly by downloading our templates. So whether you are in the office, on the go, or in a remote location, you can stay in sync with your team and present your ideas with confidence. With Slidegeeks presentation got a whole lot easier. Grab these presentations today.
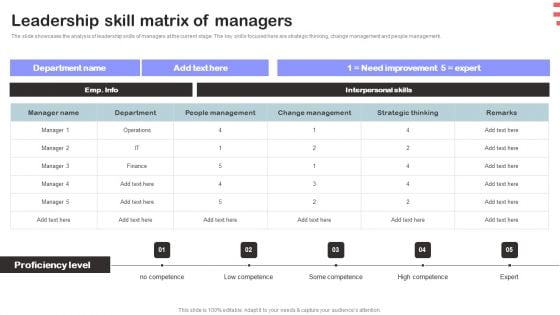
Corporate Training Program Leadership Skill Matrix Of Managers Infographics PDF
The slide showcases the analysis of leadership skills of managers at the current stage. The key skills focused here are strategic thinking, change management and people management. Find a pre designed and impeccable Corporate Training Program Leadership Skill Matrix Of Managers Infographics PDF. The templates can ace your presentation without additional effort. You can download these easy to edit presentation templates to make your presentation stand out from others. So, what are you waiting for Download the template from Slidegeeks today and give a unique touch to your presentation.
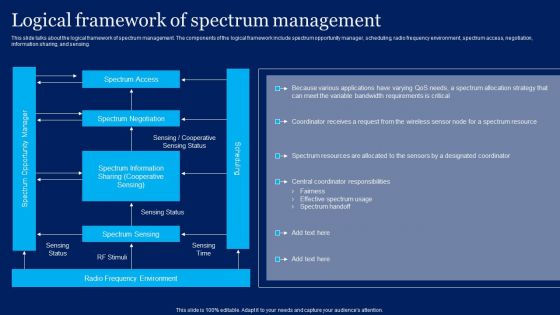
Cognitive Sensor Network Logical Framework Of Spectrum Management Infographics PDF
This slide talks about the logical framework of spectrum management. The components of the logical framework include spectrum opportunity manager, scheduling, radio frequency environment, spectrum access, negotiation, information sharing, and sensing. This Cognitive Sensor Network Logical Framework Of Spectrum Management Infographics PDF is perfect for any presentation, be it in front of clients or colleagues. It is a versatile and stylish solution for organizing your meetings. The product features a modern design for your presentation meetings. The adjustable and customizable slides provide unlimited possibilities for acing up your presentation. Slidegeeks has done all the homework before launching the product for you. So, do not wait, grab the presentation templates today
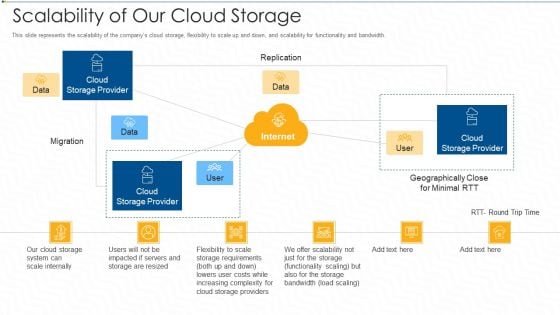
Scalability Of Our Cloud Storage Ppt Infographics File Formats PDF
This slide represents the scalability of the companys cloud storage, flexibility to scale up and down, and scalability for functionality and bandwidth. Presenting scalability of our cloud storage ppt infographics file formats pdf to provide visual cues and insights. Share and navigate important information on one stages that need your due attention. This template can be used to pitch topics like system, requirements, geographically. In addtion, this PPT design contains high resolution images, graphics, etc, that are easily editable and available for immediate download.
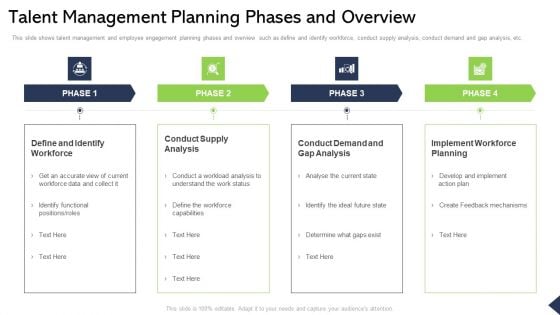
Talent Management Planning Phases And Overview Ppt Infographics Diagrams PDF
This slide shows talent management and employee engagement planning phases and overview such as define and identify workforce, conduct supply analysis, conduct demand and gap analysis, etc. Presenting talent management planning phases and overview ppt infographics diagrams pdf to provide visual cues and insights. Share and navigate important information on four stages that need your due attention. This template can be used to pitch topics like identify workforce, conduct supply analysis, conduct demand and gap analysis, implement workforce planning. In addtion, this PPT design contains high resolution images, graphics, etc, that are easily editable and available for immediate download.
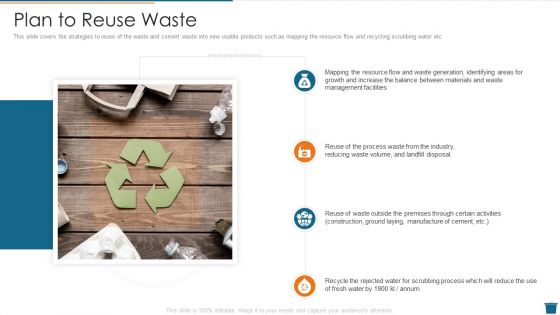
Factory Waste Management Plan To Reuse Waste Infographics PDF
This slide covers the strategies to reuse of the waste and convert waste into new usable products such as mapping the resource flow and recycling scrubbing water etc. This is a factory waste management plan to reuse waste infographics pdf template with various stages. Focus and dispense information on five stages using this creative set, that comes with editable features. It contains large content boxes to add your information on topics like management facilities, growth, balance. You can also showcase facts, figures, and other relevant content using this PPT layout. Grab it now.
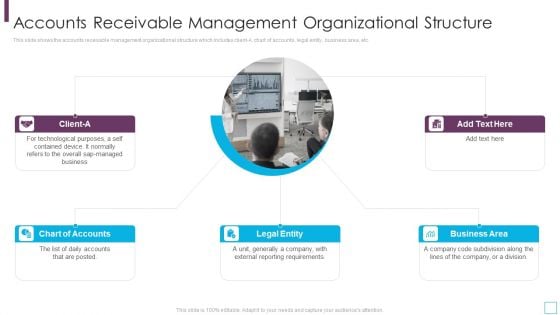
Key Strategies For Account Receivable Management Organizational Structure Infographics PDF
This slide shows the accounts receivable management organizational structure which includes client-A, chart of accounts, legal entity, business area, etc.This is a key strategies for account receivable management organizational structure infographics pdf template with various stages. Focus and dispense information on five stages using this creative set, that comes with editable features. It contains large content boxes to add your information on topics like chart of accounts, business area, external reporting requirements You can also showcase facts, figures, and other relevant content using this PPT layout. Grab it now.

Workforce Management Planning With Role Requirements Infographics PDF
This slide shows staff management plan for role requirements. It provides information about role, project accountability, competencies required, number of employees needed, estimated start date and duration required. Pitch your topic with ease and precision using this workforce management planning with role requirements infographics pdf This layout presents information on evaluation team, web developer, project accountability. It is also available for immediate download and adjustment. So, changes can be made in the color, design, graphics or any other component to create a unique layout.
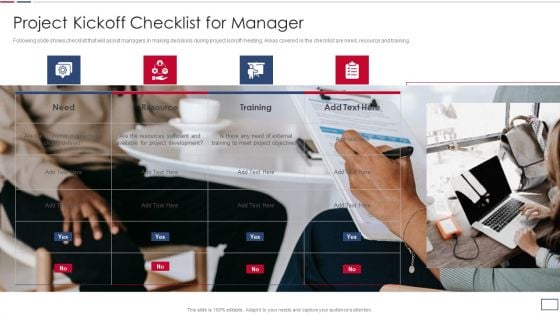
Software Developer Playbook Project Kickoff Checklist For Manager Infographics PDF
Following slide shows checklist that will assist managers in making decisions during project kickoff meeting. Areas covered in the checklist are need, resource and training. Presenting software developer playbook project kickoff checklist for manager infographics pdf to provide visual cues and insights. Share and navigate important information on one stages that need your due attention. This template can be used to pitch topics like resource, training, project objectives. In addtion, this PPT design contains high resolution images, graphics, etc, that are easily editable and available for immediate download.
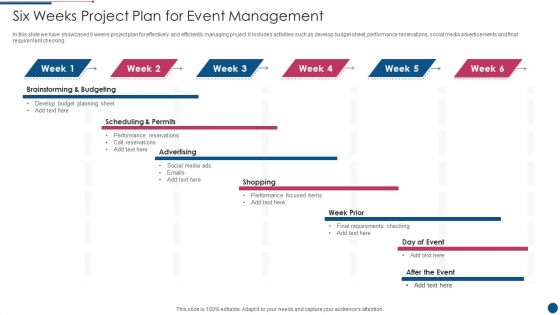
Six Weeks Project Plan For Event Management Infographics PDF
In this slide we have showcased 6 weeks project plan for effectively and efficiently managing project. It includes activities such as develop budget sheet, performance reservations, social media advertisements and final requirement checking. Pitch your topic with ease and precision using this Six Weeks Project Plan For Event Management Infographics PDF. This layout presents information on Advertising, Budget, Develop. It is also available for immediate download and adjustment. So, changes can be made in the color, design, graphics or any other component to create a unique layout.
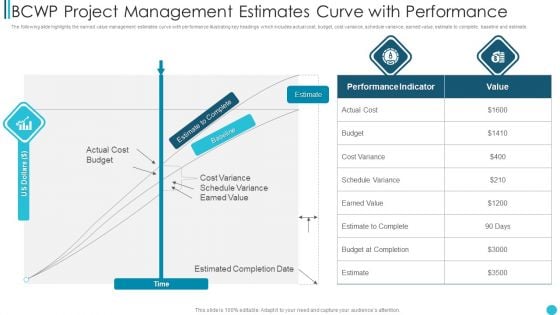
BCWP Project Management Estimates Curve With Performance Infographics PDF
The following slide highlights the earned value management estimates curve with performance illustrating key headings which includes actual cost, budget, cost variance, schedule variance, earned value, estimate to complete, baseline and estimate.Showcasing this set of slides titled BCWP Project Management Estimates Curve With Performance Infographics PDF The topics addressed in these templates are Cost Variance, Schedule Variance, Eames Value All the content presented in this PPT design is completely editable. Download it and make adjustments in color, background, font etc. as per your unique business setting.
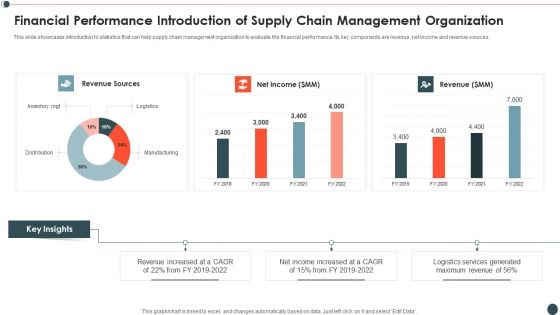
Financial Performance Introduction Of Supply Chain Management Organization Infographics PDF
This slide showcases introduction to statistics that can help supply chain management organization to evaluate the financial performance. Its key components are revenue, net income and revenue sources.Pitch your topic with ease and precision using this Financial Performance Introduction Of Supply Chain Management Organization Infographics PDF This layout presents information on Revenue Sources, Revenue Increased, Income Increased It is also available for immediate download and adjustment. So, changes can be made in the color, design, graphics or any other component to create a unique layout.
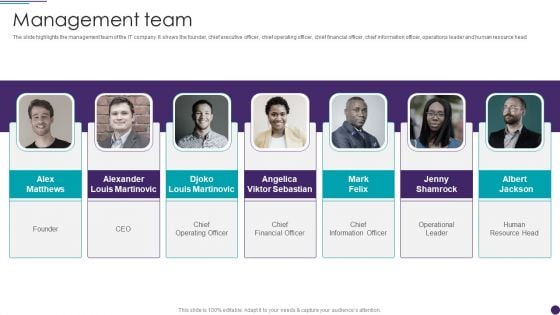
IT Services Business Profile Management Team Infographics PDF
The slide highlights the management team of the IT company. It shows the founder, chief executive officer, chief operating officer, chief financial officer, chief information officer, operations leader and human resource head This is a IT Services Business Profile Management Team Infographics PDF template with various stages. Focus and dispense information on seven stages using this creative set, that comes with editable features. It contains large content boxes to add your information on topics like Chief Financial Officer, Chief Operating Officer, Chief Information Officer. You can also showcase facts, figures, and other relevant content using this PPT layout. Grab it now.
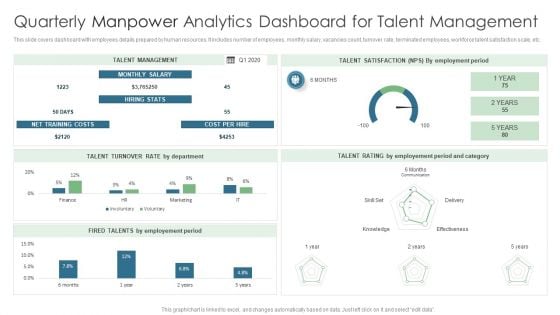
Quarterly Manpower Analytics Dashboard For Talent Management Infographics PDF
This slide covers dashboard with employees details prepared by human resources. It includes number of employees, monthly salary, vacancies count, turnover rate, terminated employees, workforce talent satisfaction scale, etc. Showcasing this set of slides titled Quarterly Manpower Analytics Dashboard For Talent Management Infographics PDF. The topics addressed in these templates are Talent Management, Cost Per Hire, Net Training Costs. All the content presented in this PPT design is completely editable. Download it and make adjustments in color, background, font etc. as per your unique business setting.
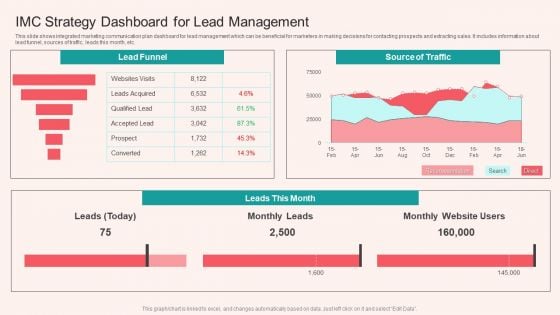
IMC Strategy Dashboard For Lead Management Infographics PDF
This slide shows integrated marketing communication plan dashboard for lead management which can be beneficial for marketers in making decisions for contacting prospects and extracting sales. It includes information about lead funnel, sources of traffic, leads this month, etc. Showcasing this set of slides titled IMC Strategy Dashboard For Lead Management Infographics PDF. The topics addressed in these templates are Source Of Traffic, Lead Funnel. All the content presented in this PPT design is completely editable. Download it and make adjustments in color, background, font etc. as per your unique business setting.

Project Management Progress Status Report Ppt Infographics Gallery PDF
This slide showcase project management progress report in which task status is shown through colors. It covers three colors to showcase status such as red, yellow and green. Showcasing this set of slides titled Project Management Progress Status Report Ppt Infographics Gallery PDF. The topics addressed in these templates are Overall Status, Accomplishments, Critical Issues, Major Risks. All the content presented in this PPT design is completely editable. Download it and make adjustments in color, background, font etc. as per your unique business setting.
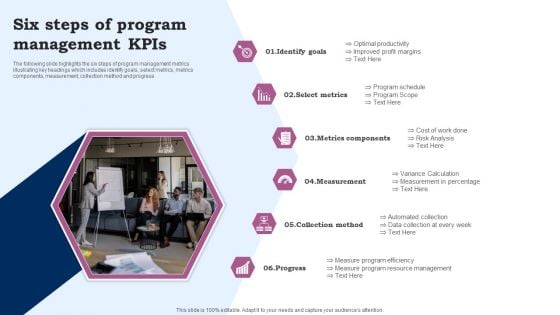
Six Steps Of Program Management Kpis Ppt Infographics Information PDF
The following slide highlights the six steps of program management metrics illustrating key headings which includes identify goals, select metrics, metrics components, measurement, collection method and progress. Presenting Six Steps Of Program Management Kpis Ppt Infographics Information PDF to dispense important information. This template comprises six stages. It also presents valuable insights into the topics including Identify Goals, Select Metrics, Metrics Components. This is a completely customizable PowerPoint theme that can be put to use immediately. So, download it and address the topic impactfully.
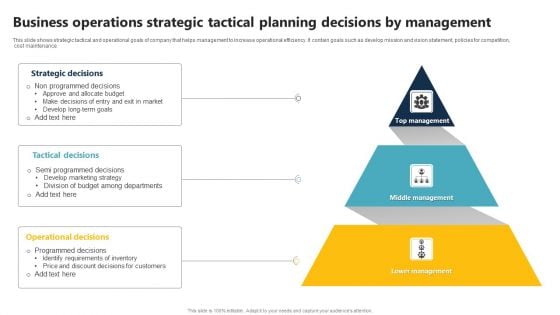
Business Operations Strategic Tactical Planning Decisions By Management Infographics PDF
This slide shows strategic tactical and operational goals of company that helps management to increase operational efficiency. It contain goals such as develop mission and vision statement, policies for competition, cost maintenance. Presenting Business Operations Strategic Tactical Planning Decisions By Management Infographics PDF to dispense important information. This template comprises three stages. It also presents valuable insights into the topics including Strategic Decisions, Tactical Decisions, Operational Decisions. This is a completely customizable PowerPoint theme that can be put to use immediately. So, download it and address the topic impactfully.
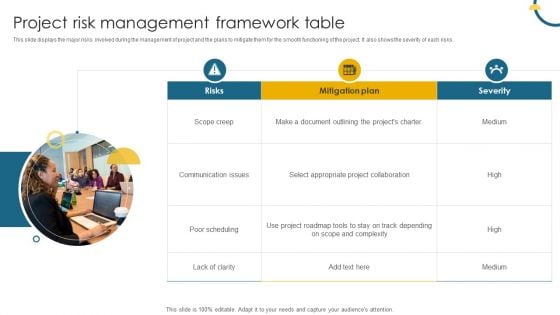
Project Risk Management Framework Table Ppt Infographics Slide PDF
This slide displays the major risks involved during the management of project and the plans to mitigate them for the smooth functioning of the project. It also shows the severity of each risks. Presenting Project Risk Management Framework Table Ppt Infographics Slide PDF to dispense important information. This template comprises three stages. It also presents valuable insights into the topics including Scope Creep, Risks, Mitigation Plan. This is a completely customizable PowerPoint theme that can be put to use immediately. So, download it and address the topic impactfully.

Web Design Company Overview Our Experienced Management Team Infographics PDF
This slide shows the management team of web designing company which includes chief executive officer, senior web developer, chief technology officer and senior marketing executive. Present like a pro with Web Design Company Overview Our Experienced Management Team Infographics PDF Create beautiful presentations together with your team, using our easy to use presentation slides. Share your ideas in real time and make changes on the fly by downloading our templates. So whether you are in the office, on the go, or in a remote location, you can stay in sync with your team and present your ideas with confidence. With Slidegeeks presentation got a whole lot easier. Grab these presentations today.
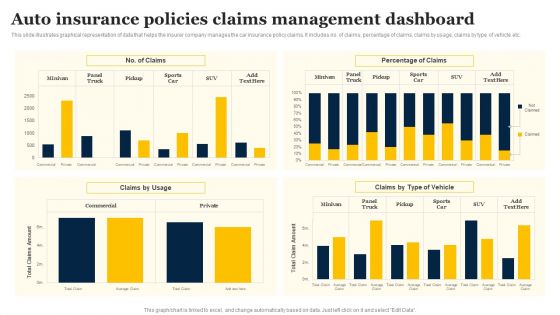
Auto Insurance Policies Claims Management Dashboard Infographics PDF
This slide illustrates graphical representation of data that helps the insurer company manages the car insurance policy claims. It includes no. of claims, percentage of claims, claims by usage, claims by type of vehicle etc. Pitch your topic with ease and precision using this Auto Insurance Policies Claims Management Dashboard Infographics PDF. This layout presents information on Percentage Claims, Claims Usage, Claims Type Vehicle. It is also available for immediate download and adjustment. So, changes can be made in the color, design, graphics or any other component to create a unique layout.
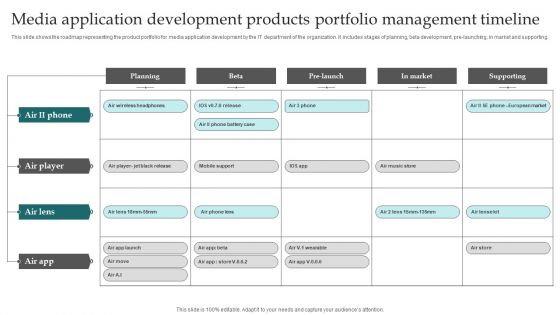
Media Application Development Products Portfolio Management Timeline Infographics PDF
This slide shows the roadmap representing the product portfolio for media application development by the IT department of the organization. It includes stages of planning, beta development, pre-launching, in market and supporting. Pitch your topic with ease and precision using this Media Application Development Products Portfolio Management Timeline Infographics PDF. This layout presents information on Planning, Market, Products Portfolio Management Timeline. It is also available for immediate download and adjustment. So, changes can be made in the color, design, graphics or any other component to create a unique layout.
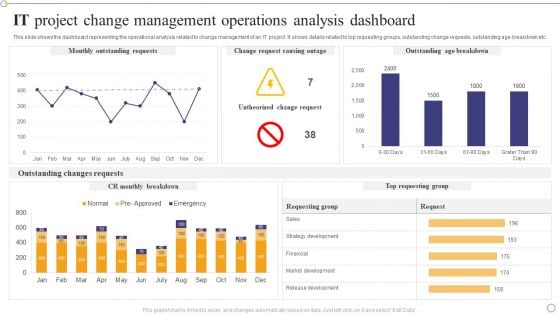
IT Project Change Management Operations Analysis Dashboard Infographics PDF
This slide shows the dashboard representing the operational analysis related to change management of an IT project. It shows details related to top requesting groups, outstanding change requests, outstanding age breakdown etc.Pitch your topic with ease and precision using this IT Project Change Management Operations Analysis Dashboard Infographics PDF. This layout presents information on Outstanding Requests, Outstanding Breakdown, Outstanding Changes. It is also available for immediate download and adjustment. So, changes can be made in the color, design, graphics or any other component to create a unique layout.
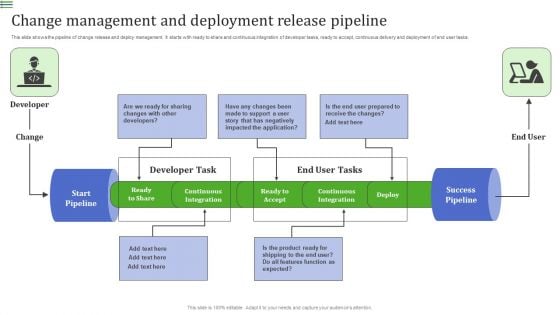
Change Management And Deployment Release Pipeline Infographics PDF
This slide shows the pipeline of change release and deploy management. It starts with ready to share and continuous integration of developer tasks, ready to accept, continuous delivery and deployment of end user tasks.Showcasing this set of slides titled Change Management And Deployment Release Pipeline Infographics PDF. The topics addressed in these templates are Continuous Integration, Continuous Integration, Success Pipeline. All the content presented in this PPT design is completely editable. Download it and make adjustments in color, background, font etc. as per your unique business setting.
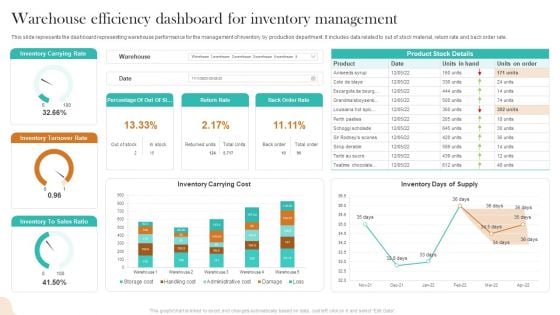
Warehouse Efficiency Dashboard For Inventory Management Infographics PDF
This slide represents the dashboard representing warehouse performance for the management of inventory by production department. It includes data related to out of stock material, return rate and back order rate. Showcasing this set of slides titled Warehouse Efficiency Dashboard For Inventory Management Infographics PDF. The topics addressed in these templates are Inventory Carrying Rate, Inventory Turnover Rate, Inventory Carrying Cost. All the content presented in this PPT design is completely editable. Download it and make adjustments in color, background, font etc. as per your unique business setting.
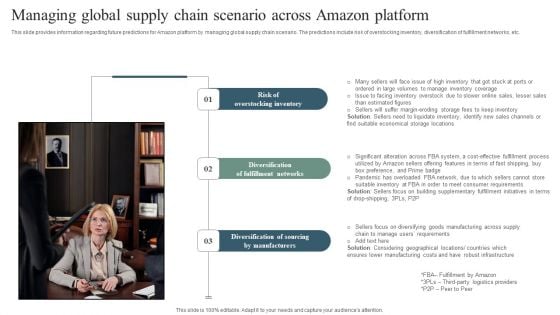
Managing Global Supply Chain Scenario Across Amazon Platform Infographics PDF
This slide provides information regarding future predictions for Amazon platform by managing global supply chain scenario. The predictions include risk of overstocking inventory, diversification of fulfillment networks, etc. Present like a pro with Managing Global Supply Chain Scenario Across Amazon Platform Infographics PDF Create beautiful presentations together with your team, using our easy-to-use presentation slides. Share your ideas in real-time and make changes on the fly by downloading our templates. So whether you are in the office, on the go, or in a remote location, you can stay in sync with your team and present your ideas with confidence. With Slidegeeks presentation got a whole lot easier. Grab these presentations today.
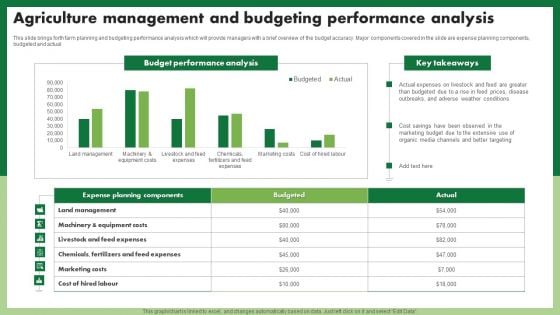
Agriculture Management And Budgeting Performance Analysis Infographics PDF
This slide brings forth farm planning and budgeting performance analysis which will provide managers with a brief overview of the budget accuracy. Major components covered in the slide are expense planning components, budgeted and actual. Showcasing this set of slides titled Agriculture Management And Budgeting Performance Analysis Infographics PDF. The topics addressed in these templates are Budget Performance Analysis. All the content presented in this PPT design is completely editable. Download it and make adjustments in color, background, font etc. as per your unique business setting.
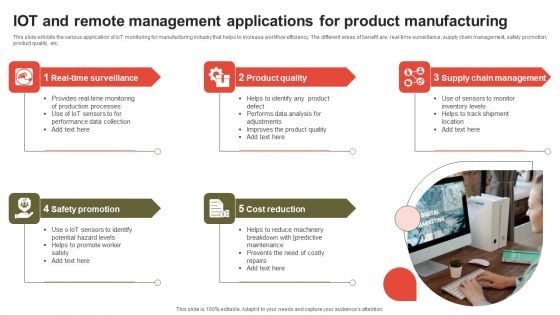
IOT And Remote Management Applications For Product Manufacturing Infographics PDF
This slide exhibits the various application of IoT monitoring for manufacturing industry that helps to increase workflow efficiency. The different areas of benefit are real-time surveillance, supply chain management, safety promotion, product quality, etc. Presenting IOT And Remote Management Applications For Product Manufacturing Infographics PDF to dispense important information. This template comprises five stages. It also presents valuable insights into the topics including Product Quality, Cost Reduction, Safety Promotion. This is a completely customizable PowerPoint theme that can be put to use immediately. So, download it and address the topic impactfully.


 Continue with Email

 Home
Home


