Process Loop
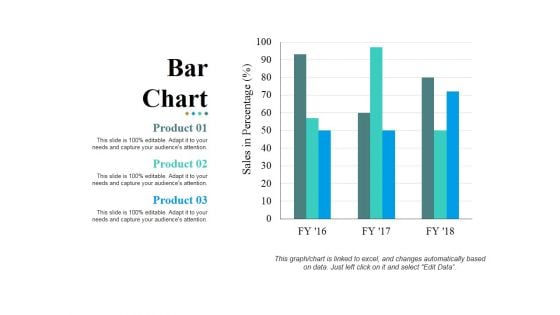
Bar Chart Ppt PowerPoint Presentation Layouts Pictures
This is a bar chart ppt powerpoint presentation layouts pictures. This is a three stage process. The stages in this process are bar graph, product, sales in percentage, business, marketing.
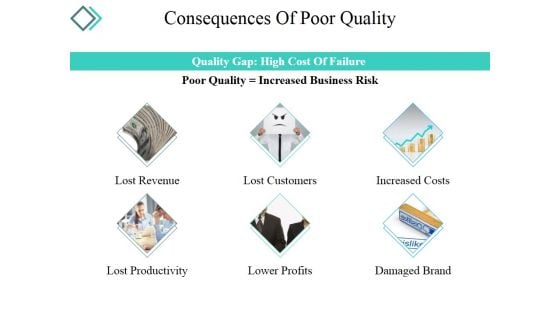
Consequences Of Poor Quality Ppt PowerPoint Presentation Show Grid
This is a consequences of poor quality ppt powerpoint presentation show grid. This is a six stage process. The stages in this process are lost revenue, lost customers, increased costs, lost productivity, lower profits.
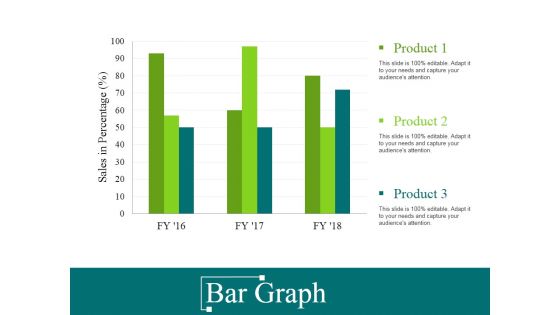
Bar Graph Ppt PowerPoint Presentation Gallery Grid
This is a bar graph ppt powerpoint presentation gallery grid. This is a three stage process. The stages in this process are sales in percentage, product, finance, business, marketing.
Combo Chart Ppt PowerPoint Presentation Icon Design Templates
This is a combo chart ppt powerpoint presentation icon design templates. This is a three stage process. The stages in this process are market size, growth rate, product, business, success.
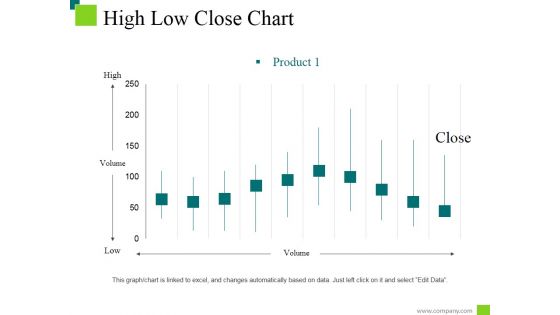
High Low Close Chart Ppt PowerPoint Presentation Styles Information
This is a high low close chart ppt powerpoint presentation styles information. This is a ten stage process. The stages in this process are low, high, product, volume, close.
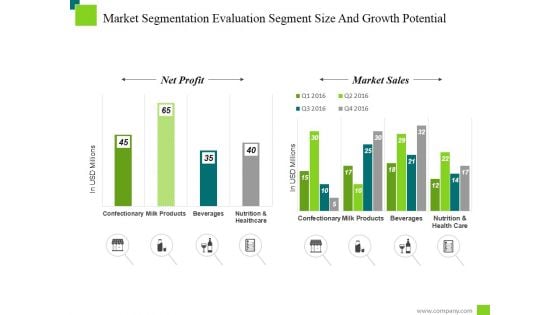
Market Segmentation Evaluation Segment Size And Growth Potential Ppt PowerPoint Presentation Model
This is a market segmentation evaluation segment size and growth potential ppt powerpoint presentation model. This is a two stage process. The stages in this process are net profit, market sales, milk products, confectionary.
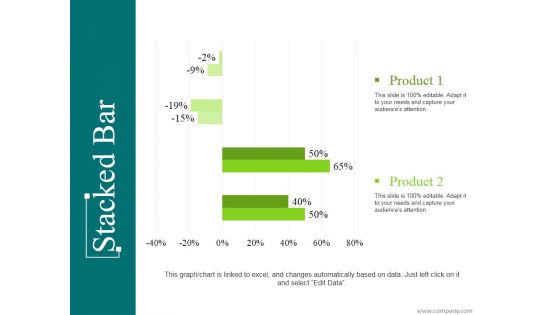
Stacked Bar Template 1 Ppt PowerPoint Presentation Ideas Design Templates
This is a stacked bar template 1 ppt powerpoint presentation ideas design templates. This is a two stage process. The stages in this process are product, finance, percentage, business, marketing.
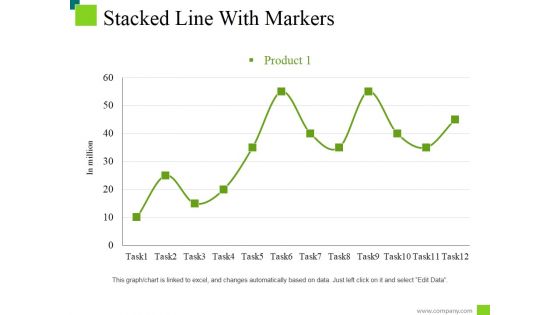
Stacked Line With Markers Ppt PowerPoint Presentation Infographic Template Deck
This is a stacked line with markers ppt powerpoint presentation infographic template deck. This is a twelve stage process. The stages in this process are product, task, business, marketing, success.
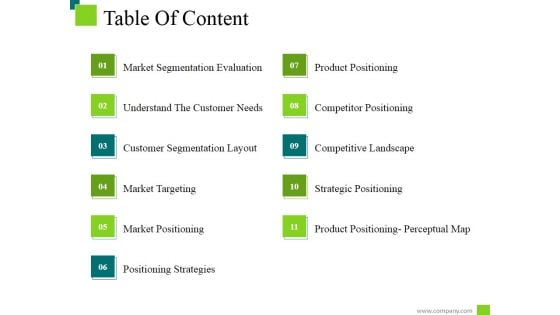
Table Of Content Ppt PowerPoint Presentation Infographic Template Topics
This is a table of content ppt powerpoint presentation infographic template topics. This is a eleven stage process. The stages in this process are market segmentation evaluation, product positioning, competitor positioning, competitive landscape.
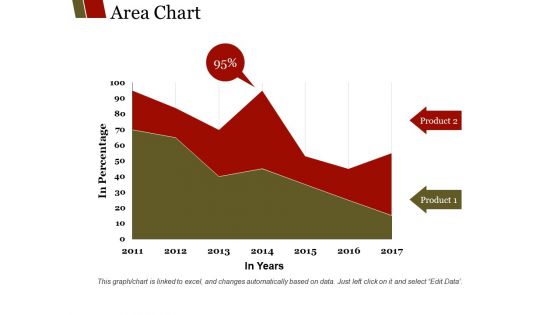
Area Chart Ppt PowerPoint Presentation Show Templates
This is a area chart ppt powerpoint presentation show templates. This is a two stage process. The stages in this process are product, in percentage, in years, finance, graph.
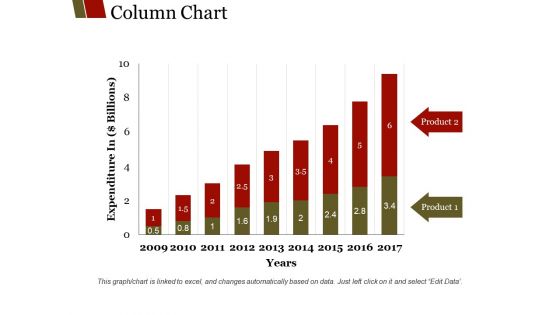
Column Chart Ppt PowerPoint Presentation Summary Graphics
This is a column chart ppt powerpoint presentation summary graphics. This is a nine stage process. The stages in this process are product, years, expenditure in billions, graph, business.
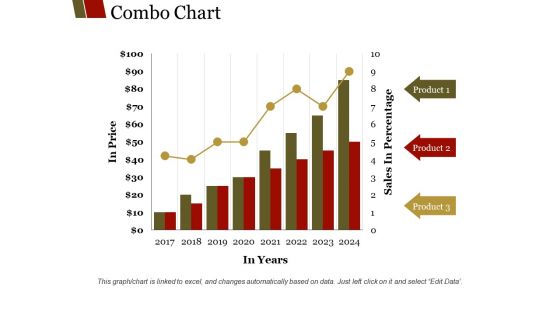
Combo Chart Ppt PowerPoint Presentation Summary Layouts
This is a combo chart ppt powerpoint presentation summary layouts. This is a eight stage process. The stages in this process are product, sales in percentage, in years, in price, graph.
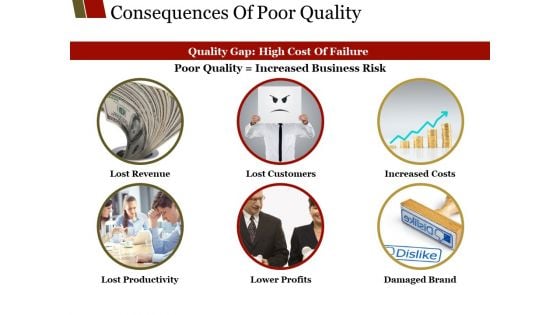
Consequences Of Poor Quality Ppt PowerPoint Presentation Portfolio Graphics Tutorials
This is a consequences of poor quality ppt powerpoint presentation portfolio graphics tutorials. This is a six stage process. The stages in this process are lost revenue, lost customers, increased costs, lower profits, lost productivity.
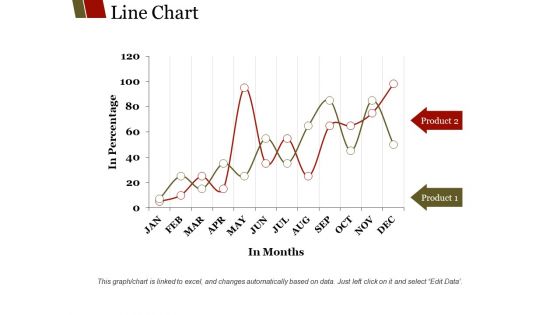
Line Chart Ppt PowerPoint Presentation Show Background Designs
This is a line chart ppt powerpoint presentation show background designs. This is a two stage process. The stages in this process are product, in months, in percentage, business.
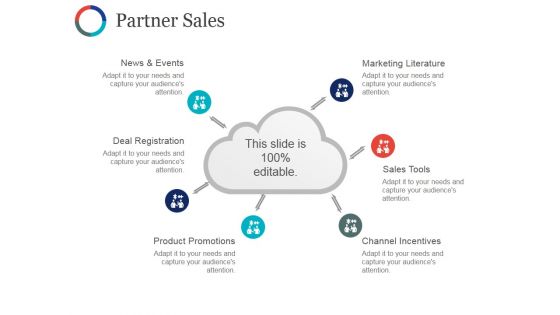
Partner Sales Ppt PowerPoint Presentation Inspiration Graphics Download
This is a partner sales ppt powerpoint presentation inspiration graphics download. This is a six stage process. The stages in this process are news and events, deal registration, product promotions, marketing literature, sales tools, channel incentives.
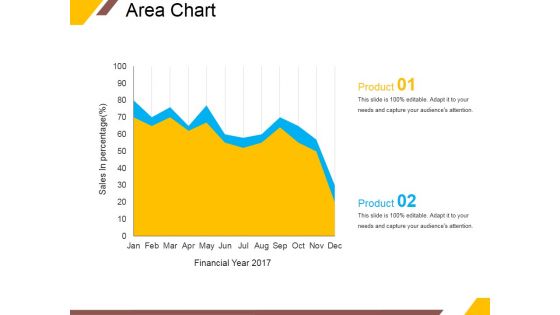
Area Chart Ppt PowerPoint Presentation Layouts Vector
This is a area chart ppt powerpoint presentation layouts vector. This is a two stage process. The stages in this process are area chart, product, sales in percentage, financial year.
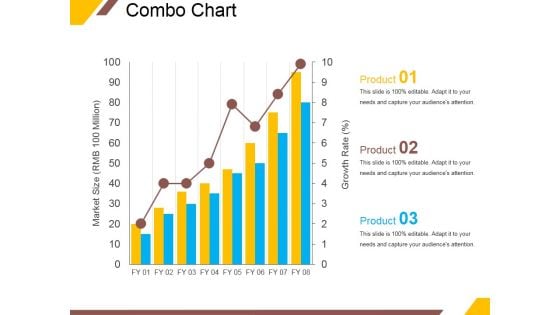
Combo Chart Ppt PowerPoint Presentation Professional Slide Download
This is a combo chart ppt powerpoint presentation professional slide download. This is a three stage process. The stages in this process are market size, growth rate, product, graph, growth.
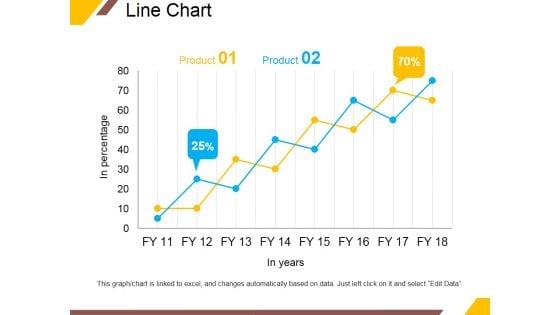
Line Chart Ppt PowerPoint Presentation Portfolio Infographic Template
This is a line chart ppt powerpoint presentation portfolio infographic template. This is a two stage process. The stages in this process are product, in years, business, percentage, growth.
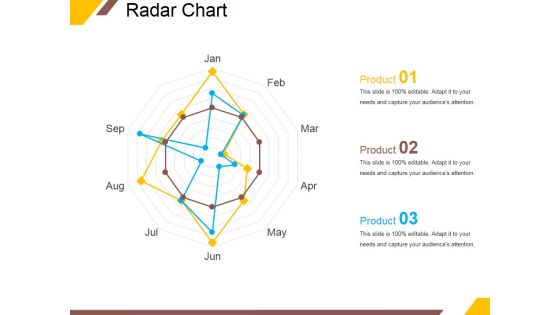
Radar Chart Ppt PowerPoint Presentation Slides Layout Ideas
This is a radar chart ppt powerpoint presentation slides layout ideas. This is a three stage process. The stages in this process are product, shapes, business, marketing, radar chart.
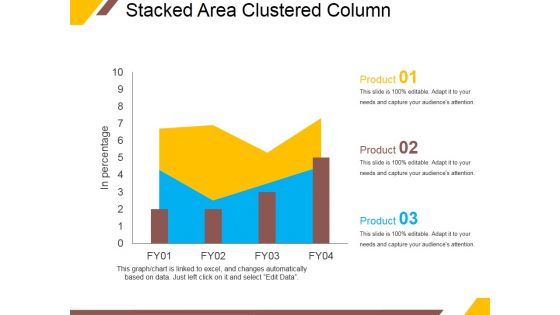
Stacked Area Clustered Column Ppt PowerPoint Presentation Inspiration Shapes
This is a stacked area clustered column ppt powerpoint presentation inspiration shapes. This is a four stage process. The stages in this process are in percentage, product, growth, success, graph.
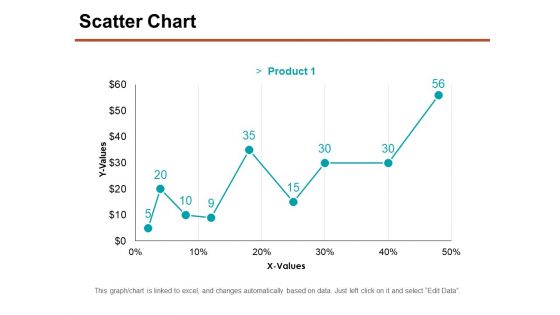
Scatter Chart Ppt PowerPoint Presentation Ideas Templates
This is a scatter chart ppt powerpoint presentation ideas templates. This is a nine stage process. The stages in this process are y values, x values, product, graph, business.
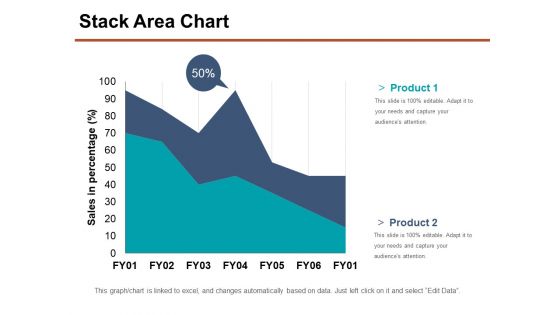
Stack Area Chart Ppt PowerPoint Presentation Show Samples
This is a stack area chart ppt powerpoint presentation show samples. This is a two stage process. The stages in this process are product, sales in percentage, business, marketing, percentage.
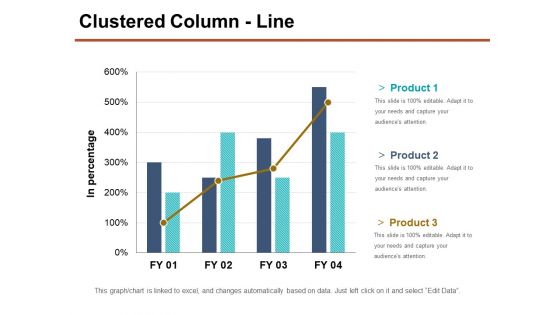
Clustered Column Line Ppt PowerPoint Presentation Inspiration Layouts
This is a clustered column line ppt powerpoint presentation inspiration layouts. This is a four stage process. The stages in this process are in percentage, product, business, strategy, graph.
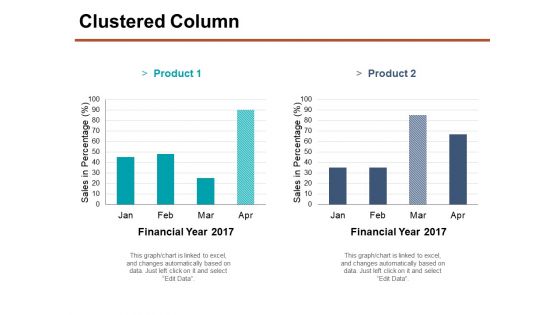
Clustered Column Ppt PowerPoint Presentation Portfolio Smartart
This is a clustered column ppt powerpoint presentation portfolio smartart. This is a two stage process. The stages in this process are financial year, product, sales in percentage, finance, business, graph.
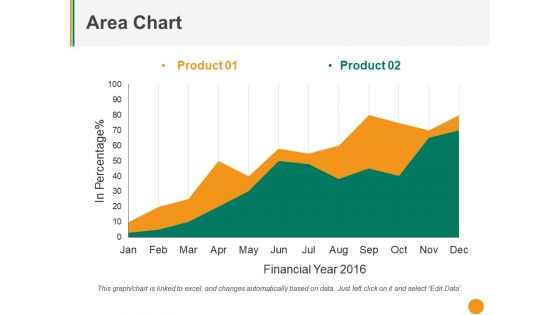
Area Chart Ppt PowerPoint Presentation File Graphic Tips
This is a area chart ppt powerpoint presentation file graphic tips. This is a two stage process. The stages in this process are product, in percentage, financial year, business, growth.
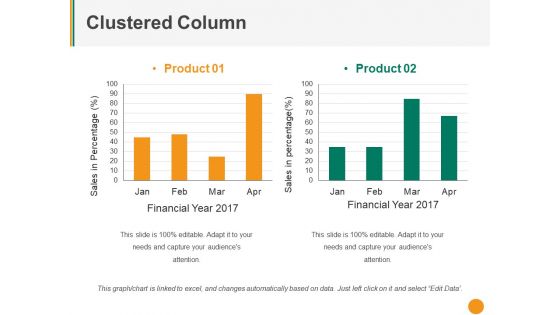
Clustered Column Ppt PowerPoint Presentation Pictures Mockup
This is a clustered column ppt powerpoint presentation pictures mockup. This is a two stage process. The stages in this process are product, sales in percentage, financial year, graph, business.
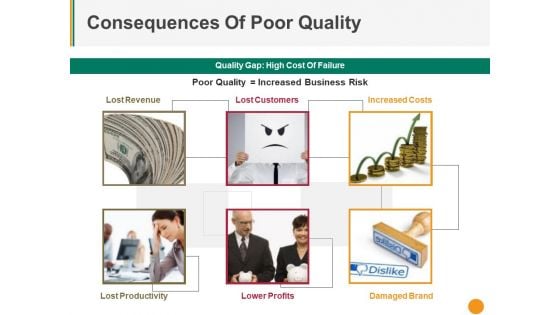
Consequences Of Poor Quality Ppt PowerPoint Presentation Gallery Layout Ideas
This is a consequences of poor quality ppt powerpoint presentation gallery layout ideas. This is a six stage process. The stages in this process are lost revenue, lost productivity, lower profits, lost customers, increased costs.
Open High Low Close Ppt PowerPoint Presentation Icon Model
This is a open high low close ppt powerpoint presentation icon model. This is a five stage process. The stages in this process are high, low, product, business, finance.
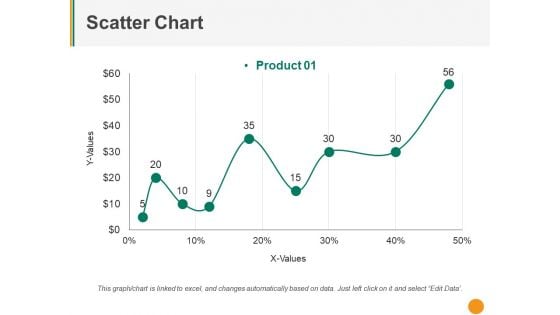
Scatter Chart Ppt PowerPoint Presentation Summary Smartart
This is a scatter chart ppt powerpoint presentation summary smartart. This is a nine stage process. The stages in this process are y values, x values, product, business, graph.
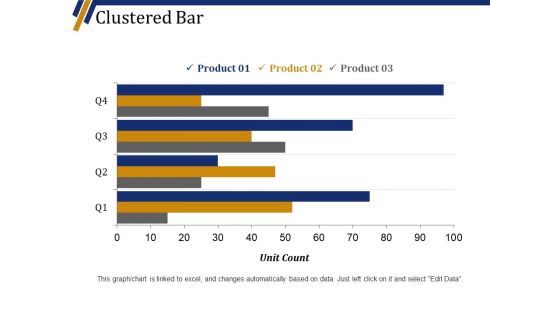
Clustered Bar Ppt PowerPoint Presentation Show Slide Portrait
This is a clustered bar ppt powerpoint presentation show slide portrait. This is a four stage process. The stages in this process are product, unit count, graph, business, marketing.
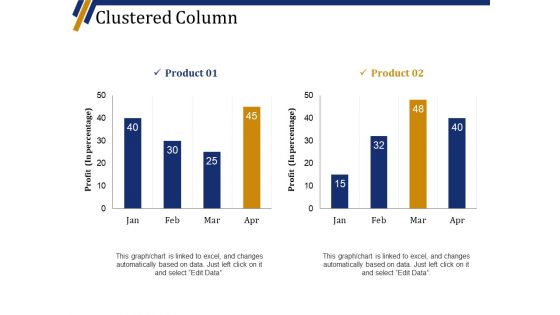
Clustered Column Ppt PowerPoint Presentation Professional Graphic Tips
This is a clustered column ppt powerpoint presentation professional graphic tips. This is a two stage process. The stages in this process are product, profit in percentage, graph, business, marketing.
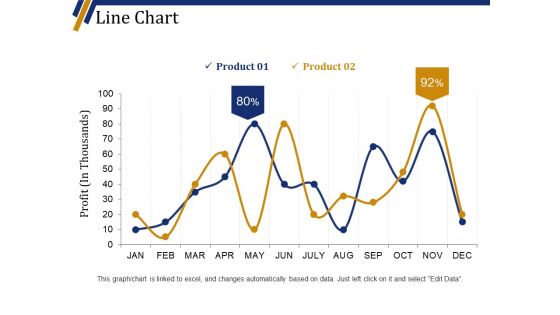
Line Chart Ppt PowerPoint Presentation Portfolio Background Designs
This is a line chart ppt powerpoint presentation portfolio background designs. This is a two stage process. The stages in this process are product, business, finance, marketing, profit in thousands.
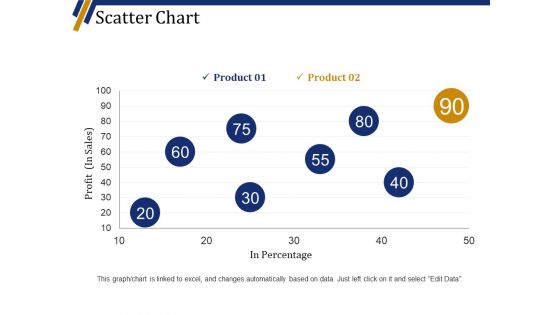
Scatter Chart Ppt PowerPoint Presentation Summary Visuals
This is a scatter chart ppt powerpoint presentation summary visuals. This is a eight stage process. The stages in this process are product, profit in sales, in percentage, finance, business.
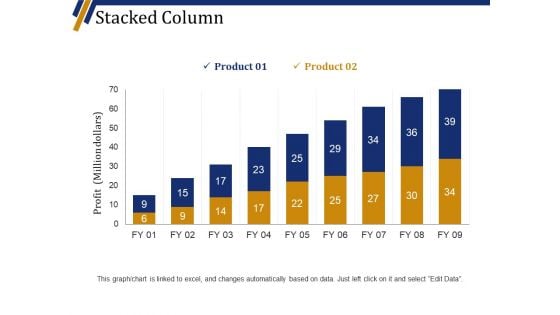
Stacked Column Ppt PowerPoint Presentation Professional Template
This is a stacked column ppt powerpoint presentation professional template. This is a nine stage process. The stages in this process are product, profit million dollars, business, marketing, graph.
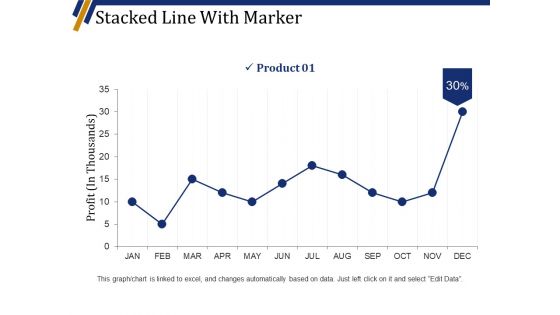
Stacked Line With Marker Ppt PowerPoint Presentation Professional Pictures
This is a stacked line with marker ppt powerpoint presentation professional pictures. This is a twelve stage process. The stages in this process are product, profit in thousands, business, graph, marketing.
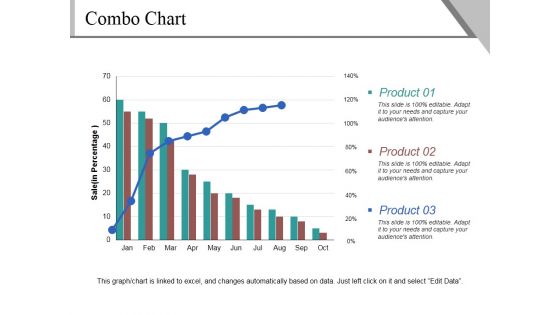
Combo Chart Ppt PowerPoint Presentation Ideas Visual Aids
This is a combo chart ppt powerpoint presentation ideas visual aids. This is a three stage process. The stages in this process are product, sales, bar graph, business, marketing.
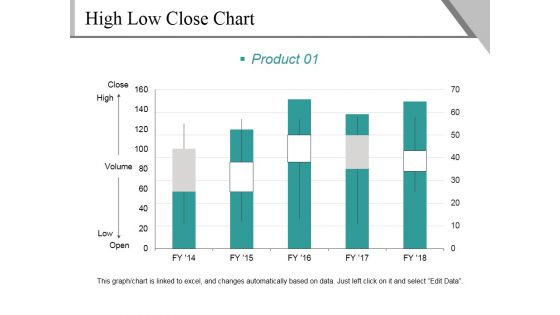
High Low Close Chart Template 1 Ppt PowerPoint Presentation Infographics Graphics Design
This is a high low close chart template 1 ppt powerpoint presentation infographics graphics design. This is a five stage process. The stages in this process are close, high, volume, low, open, product.
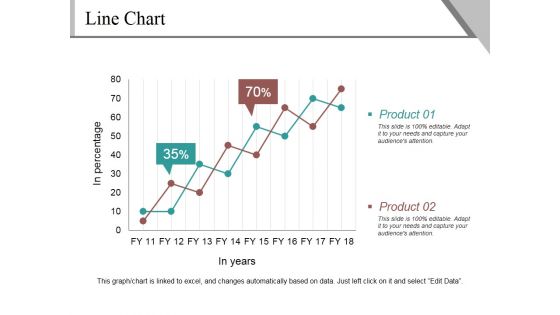
Line Chart Ppt PowerPoint Presentation Infographics Example
This is a line chart ppt powerpoint presentation infographics example. This is a two stage process. The stages in this process are product, in percentage, in years, finance, growth.
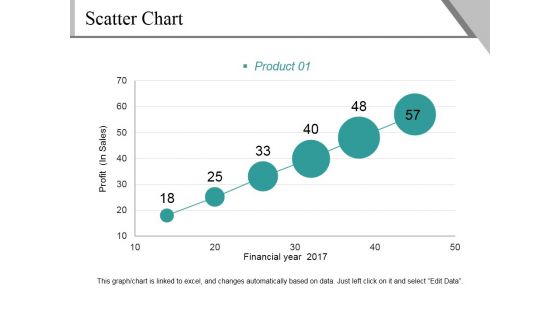
Scatter Chart Ppt PowerPoint Presentation File Background Image
This is a scatter chart ppt powerpoint presentation file background image. This is a six stage process. The stages in this process are profit, financial year, product, growth, success.
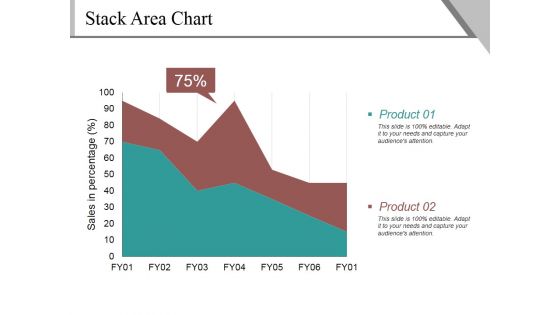
Stack Area Chart Ppt PowerPoint Presentation Gallery Guidelines
This is a stack area chart ppt powerpoint presentation gallery guidelines. This is a two stage process. The stages in this process are sales in percentage, product, percentage, business.
Bar Chart Ppt PowerPoint Presentation Icon Demonstration
This is a bar chart ppt powerpoint presentation icon demonstration. This is a seven stage process. The stages in this process are product, sales in percentage, financial year, graph.
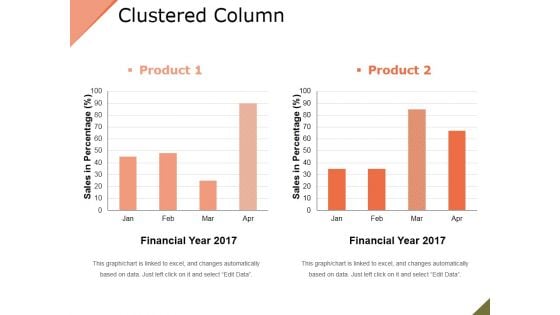
Clustered Column Ppt PowerPoint Presentation File Slide
This is a clustered column ppt powerpoint presentation file slide. This is a two stage process. The stages in this process are product, financial year, sales in percentage, bar graph.
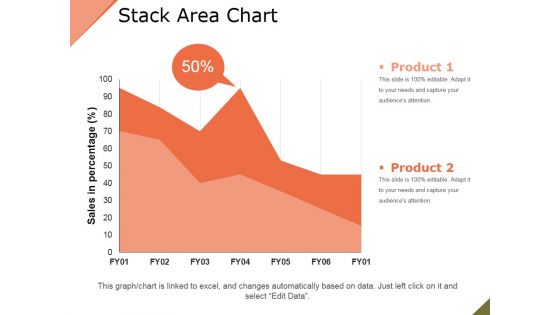
Stack Area Chart Ppt PowerPoint Presentation Example File
This is a stack area chart ppt powerpoint presentation example file. This is a two stage process. The stages in this process are product, sales in percentage, percentage, finance.

Clustered Column Line Ppt PowerPoint Presentation Slide
This is a clustered column line ppt powerpoint presentation slide. This is a three stage process. The stages in this process are bar graph, growth, finance, product, sales in percentage.
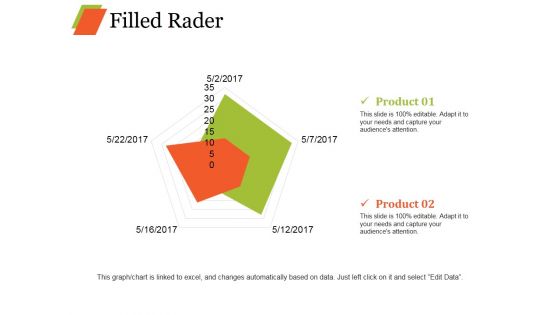
Filled Rader Ppt PowerPoint Presentation Inspiration Graphic Tips
This is a filled rader ppt powerpoint presentation inspiration graphic tips. This is a two stage process. The stages in this process are radar chart, shapes, product, business, marketing.
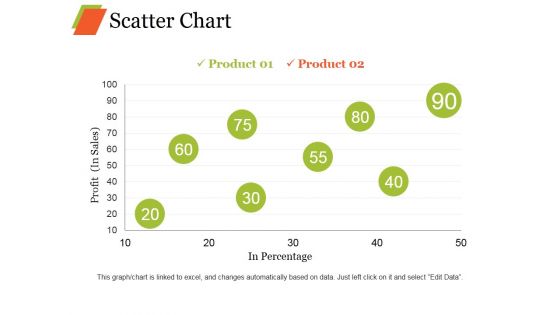
Scatter Chart Ppt PowerPoint Presentation Professional Graphic Images
This is a scatter chart ppt powerpoint presentation professional graphic images. This is a eight stage process. The stages in this process are product, profit, in percentage growth, business.
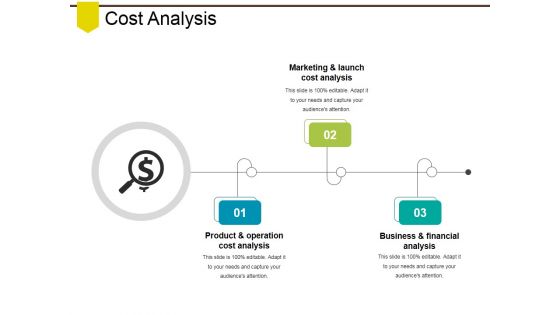
Cost Analysis Ppt PowerPoint Presentation Infographics Visual Aids
This is a cost analysis ppt powerpoint presentation infographics visual aids. This is a three stage process. The stages in this process are product and operation cost analysis, marketing and launch cost analysis, business and financial analysis.
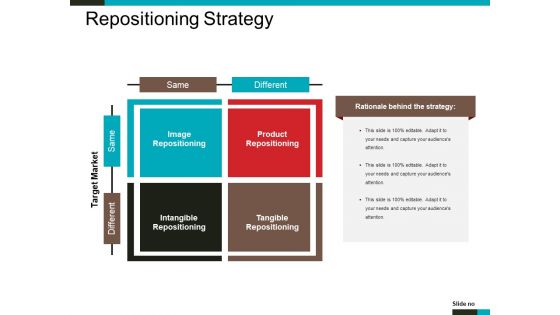
Repositioning Strategy Ppt PowerPoint Presentation Infographic Template Structure
This is a repositioning strategy ppt powerpoint presentation infographic template structure. This is a four stage process. The stages in this process are image repositioning, product repositioning, tangible repositioning, intangible repositioning, target market.
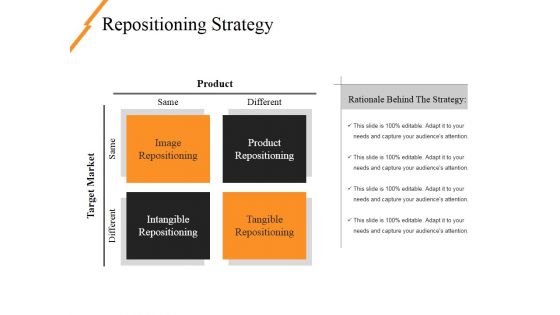
Repositioning Strategy Ppt PowerPoint Presentation Gallery Guidelines
This is a repositioning strategy ppt powerpoint presentation gallery guidelines. This is a four stage process. The stages in this process are product, target market, same, different, image repositioning.
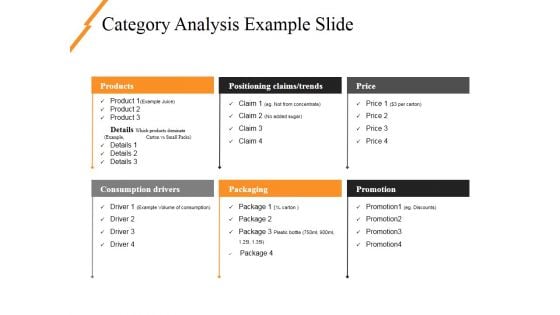
Category Analysis Example Slide Ppt PowerPoint Presentation File Pictures
This is a category analysis example slide ppt powerpoint presentation file pictures. This is a six stage process. The stages in this process are products, positioning claims, price, consumption drivers, packaging.
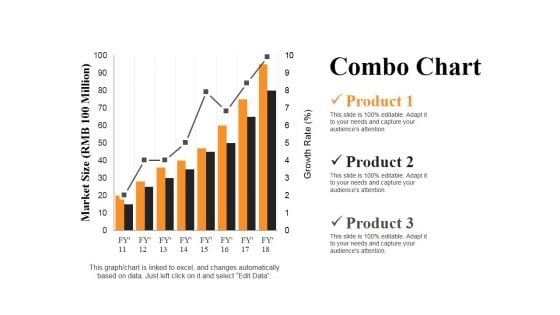
Combo Chart Ppt PowerPoint Presentation Summary Slides
This is a combo chart ppt powerpoint presentation summary slides. This is a three stage process. The stages in this process are market size, product, growth rate, bar graph, success.
Scatter Chart Ppt PowerPoint Presentation Icon Example Introduction
This is a scatter chart ppt powerpoint presentation icon example introduction. This is a two stage process. The stages in this process are product, profit, in percentage, growth, scattered chart.
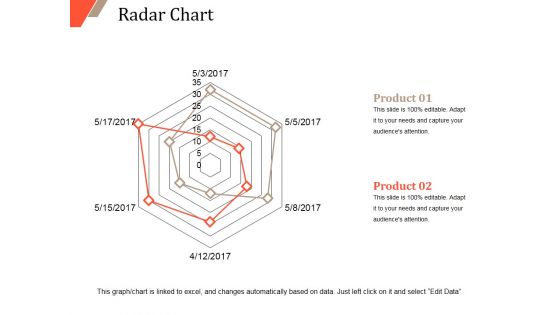
Radar Chart Ppt PowerPoint Presentation Portfolio Design Templates
This is a radar chart ppt powerpoint presentation portfolio design templates. This is a two stage process. The stages in this process are radar chart, product, finance, marketing, strategy, business.
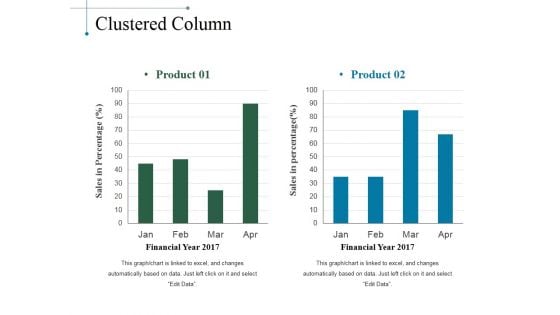
Clustered Column Ppt PowerPoint Presentation Slides Smartart
This is a clustered column ppt powerpoint presentation slides smartart. This is a two stage process. The stages in this process are product, sales in percentage, financial year, bar graph.
Stacked Line Ppt PowerPoint Presentation Icon Format Ideas
This is a stacked line ppt powerpoint presentation icon format ideas. This is a three stage process. The stages in this process are product, in percentage, stacked line, finance.
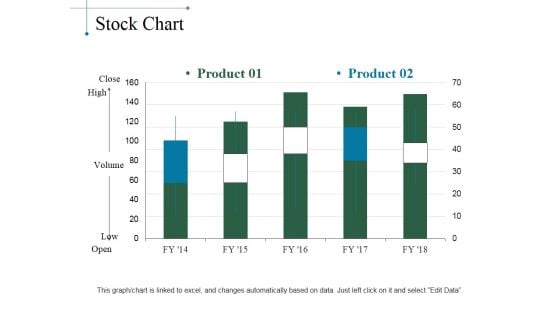
Stock Chart Ppt PowerPoint Presentation Layouts Designs Download
This is a stock chart ppt powerpoint presentation layouts designs download. This is a five stage process. The stages in this process are product, close, high, volume, low, open.
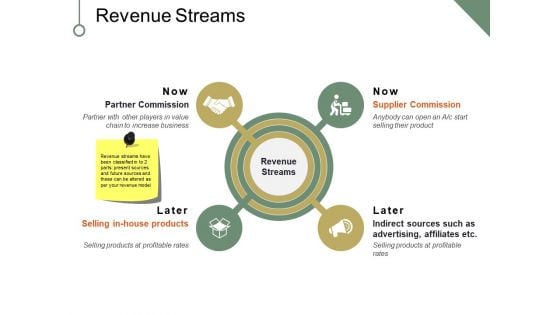
Revenue Streams Ppt PowerPoint Presentation Portfolio Maker
This is a revenue streams ppt powerpoint presentation portfolio maker. This is a four stage process. The stages in this process are partner commission, selling in house products, supplier commission, indirect sources such as advertising affiliates etc, business, icons.
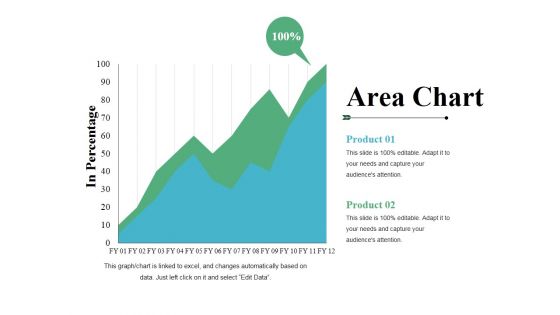
Area Chart Ppt PowerPoint Presentation Infographics Visual Aids
This is a area chart ppt powerpoint presentation infographics visual aids. This is a two stage process. The stages in this process are product, area chart, in percentage, growth, success.
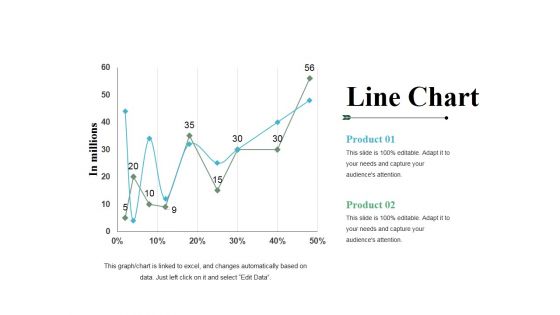
Line Chart Ppt PowerPoint Presentation File Templates
This is a line chart ppt powerpoint presentation file templates. This is a two stage process. The stages in this process are product, line chart, growth, percentage, in millions.
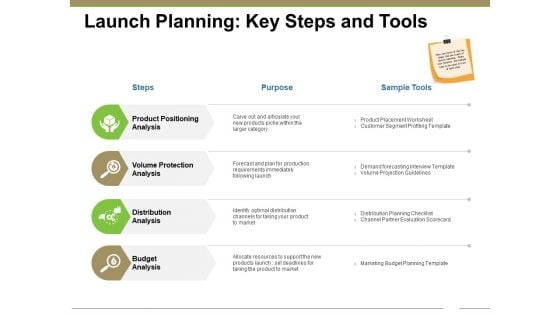
Launch Planning Key Steps And Tools Ppt PowerPoint Presentation Infographic Template Inspiration
This is a launch planning key steps and tools ppt powerpoint presentation infographic template inspiration. This is a four stage process. The stages in this process are product positioning analysis, volume protection analysis, distribution analysis, budget analysis, business.


 Continue with Email

 Home
Home


