Procurement Dashboard
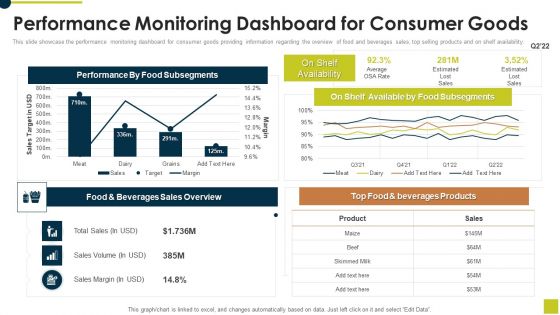
Performance Monitoring Dashboard For Consumer Goods Ppt Professional Ideas PDF
This slide showcase the performance monitoring dashboard for consumer goods providing information regarding the overview of food and beverages sales, top selling products and on shelf availability. Deliver an awe inspiring pitch with this creative Performance Monitoring Dashboard For Consumer Goods Ppt Professional Ideas PDF bundle. Topics like Food And Beverages, Sales Overview, Top Food Beverages, Products can be discussed with this completely editable template. It is available for immediate download depending on the needs and requirements of the user.
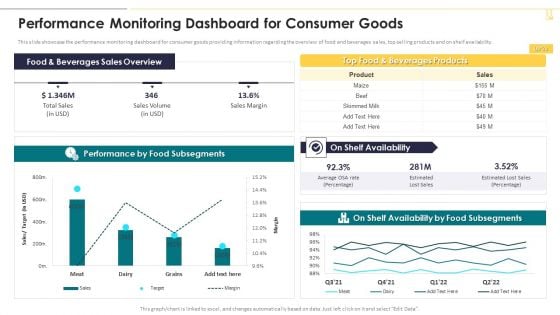
Performance Monitoring Dashboard For Consumer Goods Themes PDF
This slide showcase the performance monitoring dashboard for consumer goods providing information regarding the overview of food and beverages sales, top selling products and on shelf availability. Deliver an awe inspiring pitch with this creative Performance Monitoring Dashboard For Consumer Goods Themes PDF bundle. Topics like Beverages Sales Overview, Beverages Products, Availability can be discussed with this completely editable template. It is available for immediate download depending on the needs and requirements of the user.
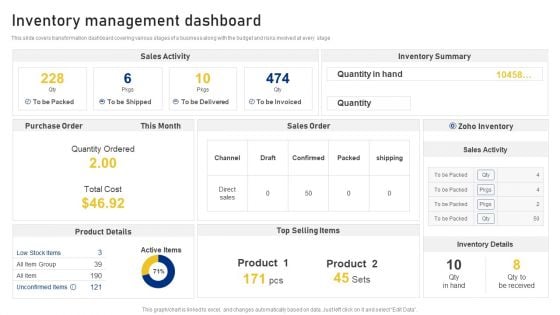
Reshaping Business In Digital Inventory Management Dashboard Mockup PDF
This slide covers transformation dashboard covering various stages of a business along with the budget and risks involved at every stage Deliver and pitch your topic in the best possible manner with this Reshaping Business In Digital Inventory Management Dashboard Mockup PDF. Use them to share invaluable insights on Sales Activity, Inventory Summary, Quantity, Sales Order and impress your audience. This template can be altered and modified as per your expectations. So, grab it now.
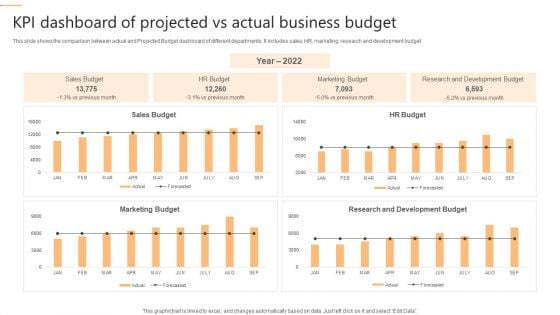
KPI Dashboard Of Projected Vs Actual Business Budget Pictures PDF
This slide shows the comparison between actual and Projected Budget dashboard of different departments. It includes sales, HR, marketing, research and development budget. Showcasing this set of slides titled KPI Dashboard Of Projected Vs Actual Business Budget Pictures PDF. The topics addressed in these templates are Marketing Budget, Development Budget, Sales Budget. All the content presented in this PPT design is completely editable. Download it and make adjustments in color, background, font etc. as per your unique business setting.
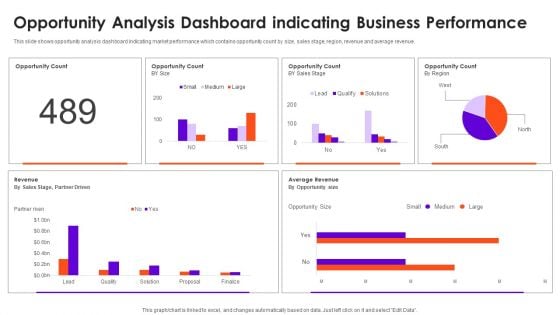
Opportunity Analysis Dashboard Indicating Business Performance Information Rules PDF
This slide shows opportunity analysis dashboard indicating market performance which contains opportunity count by size, sales stage, region, revenue and average revenue. Pitch your topic with ease and precision using this Opportunity Analysis Dashboard Indicating Business Performance Information Rules PDF. This layout presents information on Opportunity Count, Revenue, Sales. It is also available for immediate download and adjustment. So, changes can be made in the color, design, graphics or any other component to create a unique layout.
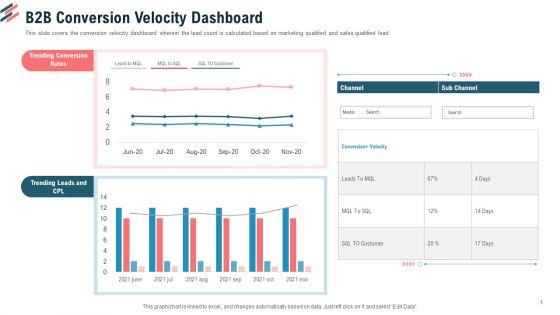
B2B Conversion Velocity Dashboard Ppt Outline Slide Portrait PDF
This slide covers the conversion velocity dashboard wherein the lead count is calculated based on marketing qualified and sales qualified lead.Deliver an awe-inspiring pitch with this creative B2B conversion velocity dashboard ppt outline slide portrait pdf. bundle. Topics like trending conversion rates, trending leads and cpl can be discussed with this completely editable template. It is available for immediate download depending on the needs and requirements of the user.
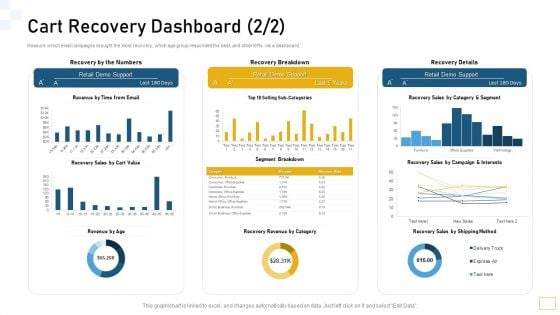
Guidelines Customer Conduct Assessment Cart Recovery Dashboard Introduction PDF
Measure which email campaigns brought the most recovery, which age group responded the best, and other KPIs via a dashboard. Deliver an awe-inspiring pitch with this creative guidelines customer conduct assessment cart recovery dashboard introduction pdf bundle. Topics like recovery revenue, recovery sales, segment breakdown can be discussed with this completely editable template. It is available for immediate download depending on the needs and requirements of the user.
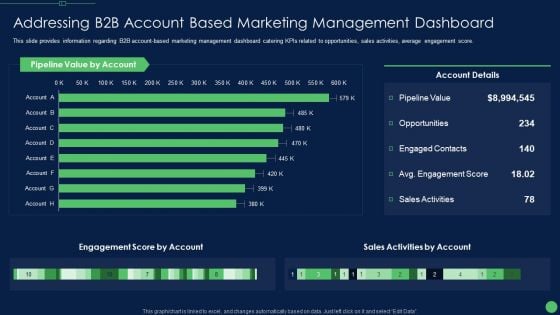
Addressing B2B Account Based Marketing Management Dashboard Structure PDF
This slide provides information regarding B2B account based marketing management dashboard catering KPIs related to opportunities, sales activities, average engagement score.Deliver an awe inspiring pitch with this creative addressing b2b account based marketing management dashboard structure pdf bundle. Topics like pipeline value, opportunities, engaged contacts can be discussed with this completely editable template. It is available for immediate download depending on the needs and requirements of the user.
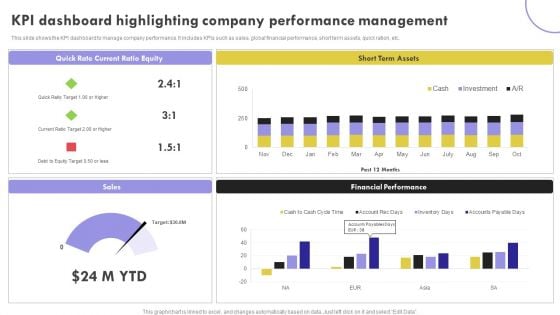
KPI Dashboard Highlighting Company Performance Management Inspiration PDF
This slide shows the KPI dashboard to manage company performance. It includes KPIs such as sales, global financial performance, short term assets, quick ration, etc.Showcasing this set of slides titled KPI Dashboard Highlighting Company Performance Management Inspiration PDF. The topics addressed in these templates are Current Ratio, Term Assets, Financial Performance. All the content presented in this PPT design is completely editable. Download it and make adjustments in color, background, font etc. as per your unique business setting.
Essential Merchandise Store Activities Tracking Dashboard Merchandise Playbook Topics PDF
This slide provides details regarding the dashboard for tracking retail store activities in terms of customer retention, rate of return, volume sales, rate of return, number of new and returning customers, etc. Deliver an awe inspiring pitch with this creative Essential Merchandise Store Activities Tracking Dashboard Merchandise Playbook Topics PDF bundle. Topics like Rate Return Customer, Customer Retention Number, New And Returning can be discussed with this completely editable template. It is available for immediate download depending on the needs and requirements of the user.
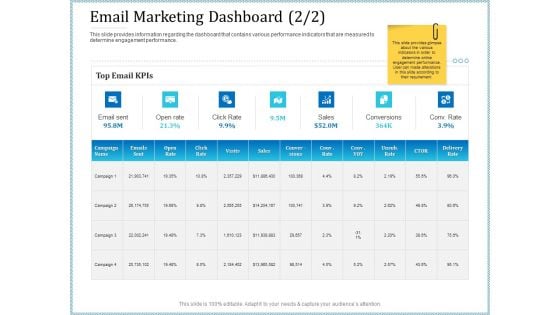
Leveraged Client Engagement Email Marketing Dashboard Rate Rules PDF
This slide provides information regarding the dashboard that contains various performance indicators that are measured to determine engagement performance. Deliver and pitch your topic in the best possible manner with this leveraged client engagement email marketing dashboard rate rules pdf. Use them to share invaluable insights on campaign, sales, conversions and impress your audience. This template can be altered and modified as per your expectations. So, grab it now.
Scrum Master Dashboard For Project Management Priority Icons PDF
This slide provides information regarding scrum master dashboard for project management to track overall project progress. Deliver an awe-inspiring pitch with this creative scrum master dashboard for project management priority icons pdf bundle. Topics like projects, key resources, marketing sight, sales pipeline, forecast can be discussed with this completely editable template. It is available for immediate download depending on the needs and requirements of the user.
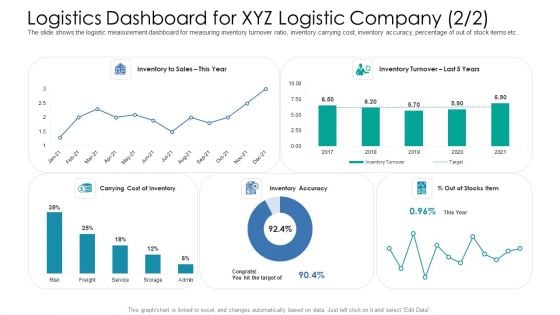
Logistics Dashboard For XYZ Logistic Company Cost Ppt Example PDF
The slide shows the logistic measurement dashboard for measuring inventory turnover ratio, inventory carrying cost, inventory accuracy, percentage of out of stock items etc.Deliver an awe-inspiring pitch with this creative logistics dashboard for XYZ logistic company cost ppt example pdf. bundle. Topics like inventory to sales, carrying cost of inventory, inventory accuracy, 2017 to 2021 can be discussed with this completely editable template. It is available for immediate download depending on the needs and requirements of the user.
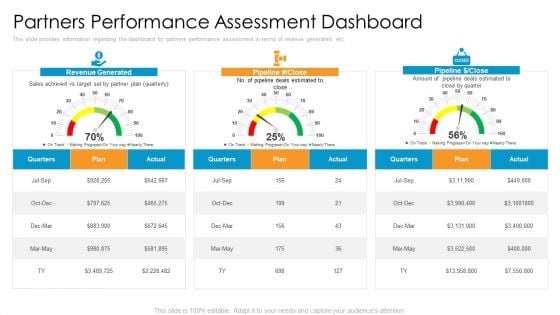
Partner Advertisement Strategy Partners Performance Assessment Dashboard Diagrams PDF
This slide provides information regarding the dashboard for partners performance assessment in terms of revenue generated, etc. Deliver and pitch your topic in the best possible manner with this partner advertisement strategy partners performance assessment dashboard diagrams pdf. Use them to share invaluable insights on revenue generated, sales, target and impress your audience. This template can be altered and modified as per your expectations. So, grab it now.
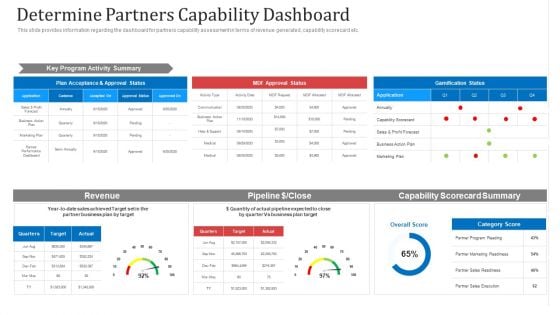
Determine Partners Capability Dashboard Ppt Pictures Format PDF
This slide provides information regarding the dashboard for partners capability assessment in terms of revenue generated, capability scorecard etc. Deliver and pitch your topic in the best possible manner with this determine partners capability dashboard ppt pictures format pdf. Use them to share invaluable insights on revenue, target, business plan, sales and impress your audience. This template can be altered and modified as per your expectations. So, grab it now.
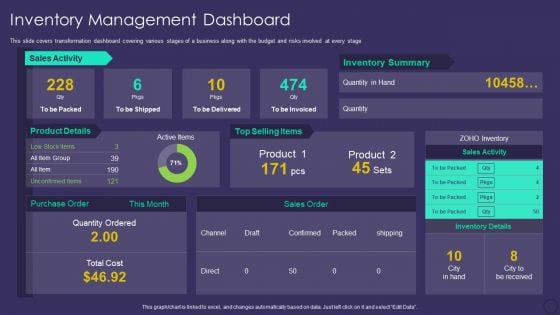
Comprehensive Business Digitization Deck Inventory Management Dashboard Rules PDF
This slide covers transformation dashboard covering various stages of a business along with the budget and risks involved at every stage. Deliver an awe inspiring pitch with this creative comprehensive business digitization deck inventory management dashboard rules pdf bundle. Topics like inventory, sales, quantity can be discussed with this completely editable template. It is available for immediate download depending on the needs and requirements of the user.
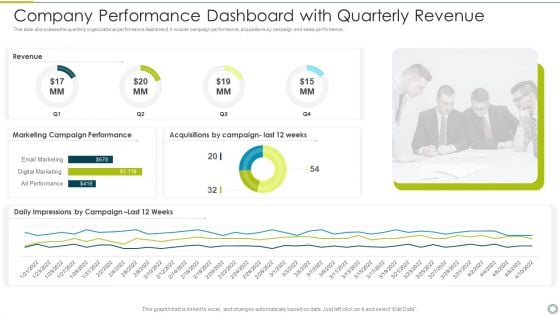
Company Performance Dashboard With Quarterly Revenue Download PDF
This slide showcases the quarterly organizational performance dashboard. It include campaign performance, acquisitions by campaign and sales performance. Showcasing this set of slides titled company performance dashboard with quarterly revenue download pdf. The topics addressed in these templates are marketing, performance. All the content presented in this PPT design is completely editable. Download it and make adjustments in color, background, font etc. as per your unique business setting.
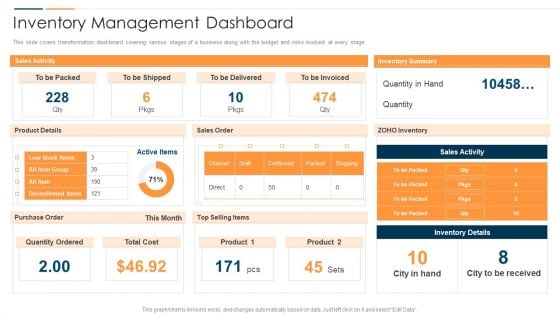
Revolution In Online Business Inventory Management Dashboard Ideas PDF
This slide covers transformation dashboard covering various stages of a business along with the budget and risks involved at every stage. Deliver and pitch your topic in the best possible manner with this Revolution In Online Business Inventory Management Dashboard Ideas PDF. Use them to share invaluable insights on Sales Activity Product, Top Selling Items, Quantity Ordered Active and impress your audience. This template can be altered and modified as per your expectations. So, grab it now.
Accelerate Online Journey Now Inventory Management Dashboard Introduction PDF
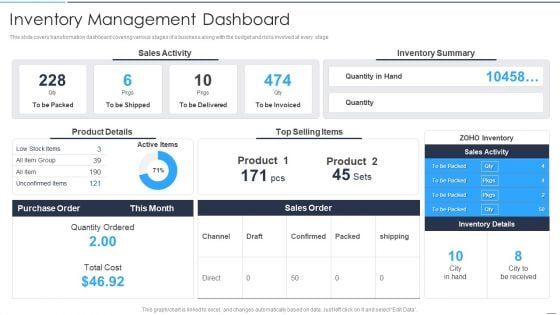
This slide covers transformation dashboard covering various stages of a business along with the budget and risks involved at every stage Deliver an awe inspiring pitch with this creative Accelerate Online Journey Now Inventory Management Dashboard Introduction PDF bundle. Topics like Sales Activity, Inventory Summary, Product can be discussed with this completely editable template. It is available for immediate download depending on the needs and requirements of the user.
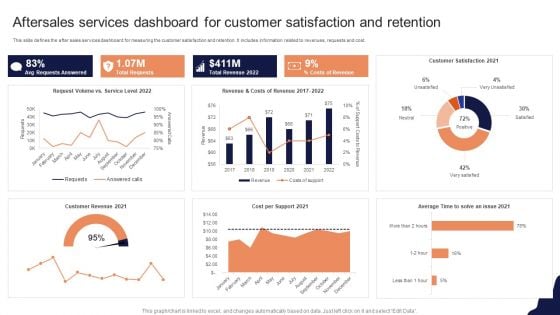
Aftersales Services Dashboard For Customer Satisfaction And Retention Template PDF
This slide defines the after sales services dashboard for measuring the customer satisfaction and retention. It includes information related to revenues, requests and cost.Showcasing this set of slides titled Aftersales Services Dashboard For Customer Satisfaction And Retention Template PDF The topics addressed in these templates are Requests Answered, Total Requests, Customer Satisfaction All the content presented in this PPT design is completely editable. Download it and make adjustments in color, background, font etc. as per your unique business setting.
CRM Implementation Strategy CRM Implementation Dashboard With Customer Icons PDF
This slide showcases the dashboard for CRM which includes the revenue, marketing expenses, satisfaction rate, conversion funnel, tickets volume by priority, and expected sales this year.Deliver an awe inspiring pitch with this creative CRM Implementation Strategy CRM Implementation Dashboard With Customer Icons PDF bundle. Topics like Conversion Funnel, Customer Satisfaction, Marketing Expenses can be discussed with this completely editable template. It is available for immediate download depending on the needs and requirements of the user.
Stock Requirement Plan Dashboard With Inventory Management Icons PDF
The following slide highlights the material requirement planning dashboard with inventory management, It illustrates business overview, inventory management, product sale by region, debtor summary and transaction. Pitch your topic with ease and precision using this Stock Requirement Plan Dashboard With Inventory Management Icons PDF. This layout presents information on Transaction, Debtor Summary, Business Overview. It is also available for immediate download and adjustment. So, changes can be made in the color, design, graphics or any other component to create a unique layout.
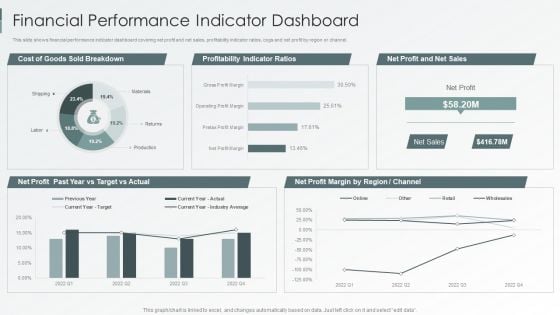
Enterprise Sustainability Performance Metrics Financial Performance Indicator Dashboard Themes PDF
This slide shows financial performance indicator dashboard covering net profit and net sales, profitability indicator ratios, cogs and net profit by region or channel.Deliver an awe inspiring pitch with this creative Enterprise Sustainability Performance Metrics Financial Performance Indicator Dashboard Themes PDF bundle. Topics like Profitability Indicator, Sold Breakdown, Target Actual can be discussed with this completely editable template. It is available for immediate download depending on the needs and requirements of the user.
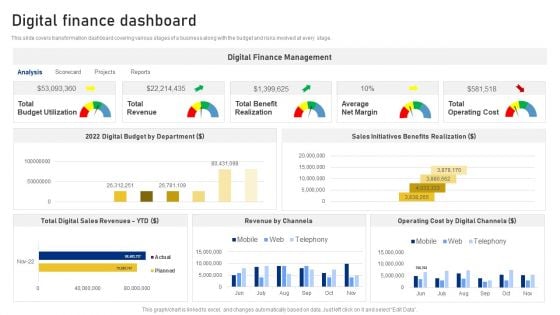
Reshaping Business In Digital Digital Finance Dashboard Topics PDF
This slide covers transformation dashboard covering various stages of a business along with the budget and risks involved at every stage. Deliver and pitch your topic in the best possible manner with this Reshaping Business In Digital Digital Finance Dashboard Topics PDF. Use them to share invaluable insights on Digital Finance Management, Total Digital, Sales Revenues and impress your audience. This template can be altered and modified as per your expectations. So, grab it now.
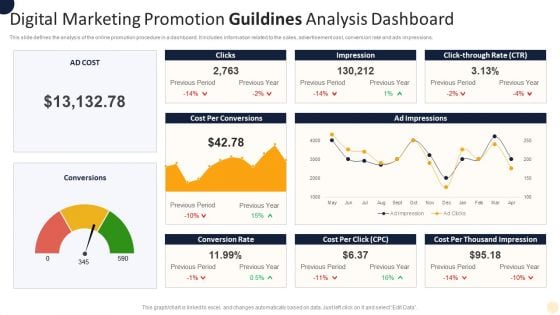
Digital Marketing Promotion Guildines Analysis Dashboard Rules PDF
This slide defines the analysis of the online promotion procedure in a dashboard. It includes information related to the sales, advertisement cost, conversion rate and ads impressions. Showcasing this set of slides titled Digital Marketing Promotion Guildines Analysis Dashboard Rules PDF. The topics addressed in these templates are Impression, Conversion Rate, Thousand Impression. All the content presented in this PPT design is completely editable. Download it and make adjustments in color, background, font etc. as per your unique business setting.
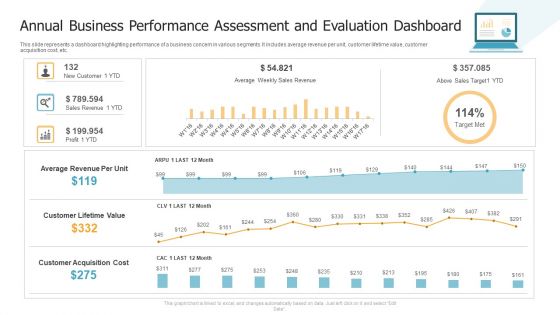
Annual Business Performance Assessment And Evaluation Dashboard Brochure PDF
This slide represents a dashboard highlighting performance of a business concern in various segments. It includes average revenue per unit, customer lifetime value, customer acquisition cost, etc. Showcasing this set of slides titled Annual Business Performance Assessment And Evaluation Dashboard Brochure PDF. The topics addressed in these templates are Profit, Sales Revenue, New Customer. All the content presented in this PPT design is completely editable. Download it and make adjustments in color, background, font etc. as per your unique business setting.
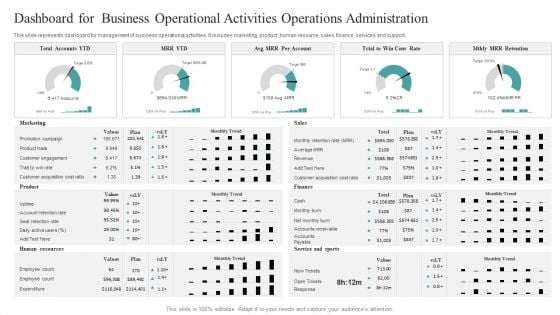
Dashboard For Business Operational Activities Operations Administration Designs PDF
This slide represents dashboard for management of business operational activities. It includes marketing, product, human resource, sales, finance, services and support. Pitch your topic with ease and precision using this Dashboard For Business Operational Activities Operations Administration Designs PDF. This layout presents information on Marketing, Product, Human Resources. It is also available for immediate download and adjustment. So, changes can be made in the color, design, graphics or any other component to create a unique layout.
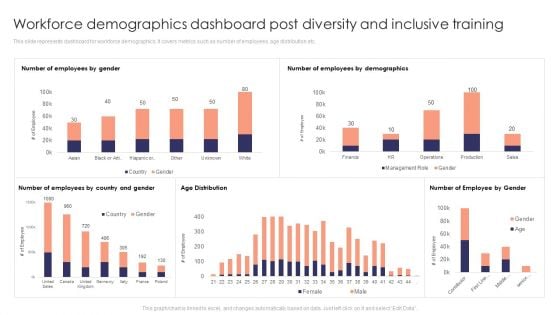
Workforce Demographics Dashboard Post Diversity And Inclusive Training Background PDF
This slide represents dashboard for workforce demographics. It covers metrics such as number of employees, age distribution etc. Make sure to capture your audiences attention in your business displays with our gratis customizable Workforce Demographics Dashboard Post Diversity And Inclusive Training Background PDF. These are great for business strategies, office conferences, capital raising or task suggestions. If you desire to acquire more customers for your tech business and ensure they stay satisfied, create your own sales presentation with these plain slides.
Fundamentals Of Reinforcement Performance Tracking Dashboard For Reinforcement Elements PDF
This slide represents the performance tracking dashboard for the reinforcement learning model based on different time frames and categories. Make sure to capture your audiences attention in your business displays with our gratis customizable Fundamentals Of Reinforcement Performance Tracking Dashboard For Reinforcement Elements PDF. These are great for business strategies, office conferences, capital raising or task suggestions. If you desire to acquire more customers for your tech business and ensure they stay satisfied, create your own sales presentation with these plain slides.
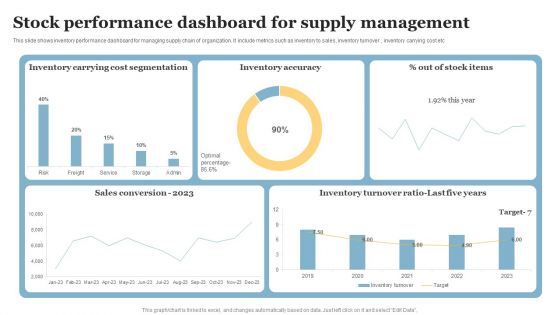
Stock Performance Dashboard For Supply Management Template PDF
This slide shows inventory performance dashboard for managing supply chain of organization. It include metrics such as inventory to sales, inventory turnover , inventory carrying cost etc. Showcasing this set of slides titled Stock Performance Dashboard For Supply Management Template PDF. The topics addressed in these templates are Inventory Carrying, Cost Segmentation, Inventory Accuracy. All the content presented in this PPT design is completely editable. Download it and make adjustments in color, background, font etc. as per your unique business setting.
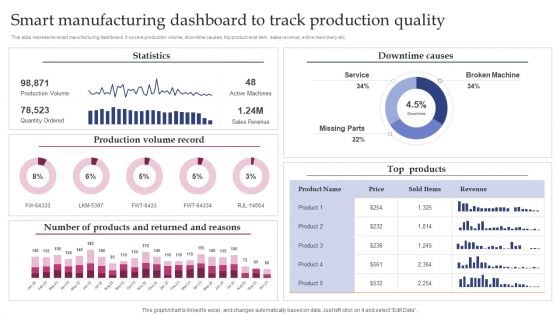
Smart Manufacturing Dashboard To Track Production Quality Professional PDF
This slide represents smart manufacturing dashboard. It covers production volume, downtime causes, top product sold item, sales revenue, active machinery etc. Find a pre-designed and impeccable Smart Manufacturing Dashboard To Track Production Quality Professional PDF. The templates can ace your presentation without additional effort. You can download these easy-to-edit presentation templates to make your presentation stand out from others. So, what are you waiting for. Download the template from Slidegeeks today and give a unique touch to your presentation.
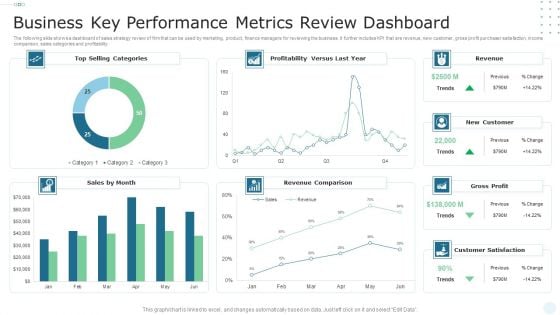
Business Key Performance Metrics Review Dashboard Portrait PDF
The following slide shows a dashboard of sales strategy review of firm that can be used by marketing, product, finance managers for reviewing the business. It further includes KPI that are revenue, new customer, gross profit purchaser satisfaction, income comparison, sales categories and profitability. Showcasing this set of slides titled Business Key Performance Metrics Review Dashboard Portrait PDF. The topics addressed in these templates are Sales, Revenue Comparison, Profitability. All the content presented in this PPT design is completely editable. Download it and make adjustments in color, background, font etc. as per your unique business setting.
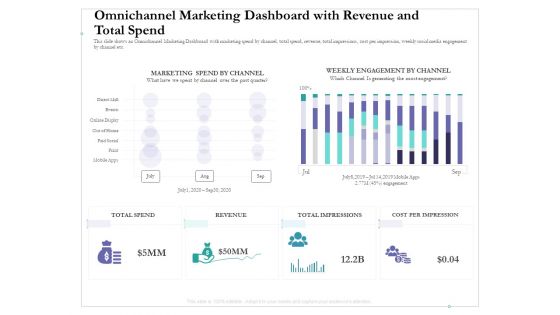
Omnichannel Marketing Dashboard With Revenue And Total Spend Structure PDF
This slide shows an Omnichannel Marketing Dashboard with marketing spend by channel, total spend, revenue, total impressions, cost per impression, weekly social media engagement by channel etc. Deliver and pitch your topic in the best possible manner with this omnichannel marketing dashboard with revenue and total spend structure pdf. Use them to share invaluable insights on marketing spend by channel, weekly engagement by channel, cost per impression and impress your audience. This template can be altered and modified as per your expectations. So, grab it now.
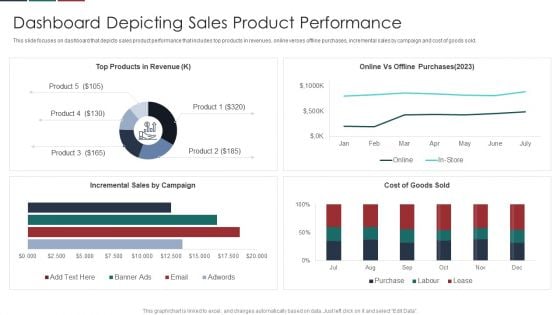
Deliver Efficiency Innovation Dashboard Depicting Sales Product Performance Themes PDF
This slide focuses on dashboard that depicts sales product performance that includes top products in revenues, online verses offline purchases, incremental sales by campaign and cost of goods sold. Deliver an awe inspiring pitch with this creative Deliver Efficiency Innovation Dashboard Depicting Sales Product Performance Themes PDF bundle. Topics like Top Products Revenue, Online Vs Offline Purchases, Incremental Sales Campaign, Cost Goods Sold can be discussed with this completely editable template. It is available for immediate download depending on the needs and requirements of the user.
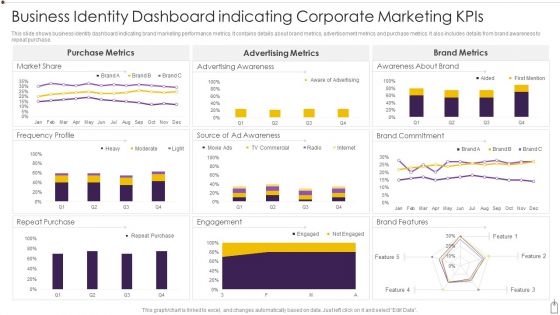
Business Identity Dashboard Indicating Corporate Marketing Kpis Diagrams PDF
This slide shows business identity dashboard indicating brand marketing performance metrics. It contains details about brand metrics, advertisement metrics and purchase metrics. It also includes details from brand awareness to repeat purchase. Showcasing this set of slides titled Business Identity Dashboard Indicating Corporate Marketing Kpis Diagrams PDF. The topics addressed in these templates are Purchase, Engagement, Market Share. All the content presented in this PPT design is completely editable. Download it and make adjustments in color, background, font etc. as per your unique business setting.

Shopping Cart Conversion Rate Dashboard Ppt Model Graphics PDF
This slide shows shopping cart conversion rate dashboard. It includes details of online revenue share, shipping error rate, shopping cart conversion rate, coupon conversion, product views per session and revenue per visitors. Deliver an awe-inspiring pitch with this creative shopping cart conversion rate dashboard ppt model graphics pdf. bundle. Topics like shopping cart conversion rate, coupon cart conversion, product views per session, revenue per visitors, avg product views can be discussed with this completely editable template. It is available for immediate download depending on the needs and requirements of the user.
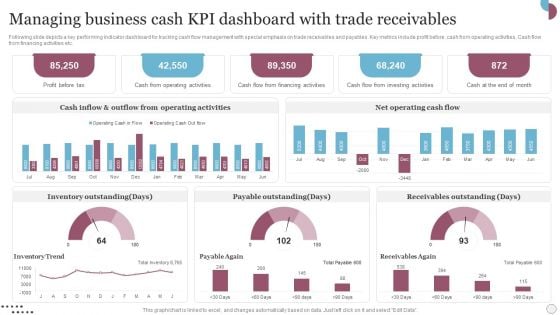
Managing Business Cash Kpi Dashboard With Trade Receivables Slides PDF
Following slide depicts a key performing indicator dashboard for tracking cash flow management with special emphasis on trade receivables and payables. Key metrics include profit before, cash from operating activities, Cash flow from financing activities etc. Showcasing this set of slides titled Managing Business Cash Kpi Dashboard With Trade Receivables Slides PDF. The topics addressed in these templates are Inventory Outstanding, Payable Outstanding, Receivables Outstanding. All the content presented in this PPT design is completely editable. Download it and make adjustments in color, background, font etc. as per your unique business setting.
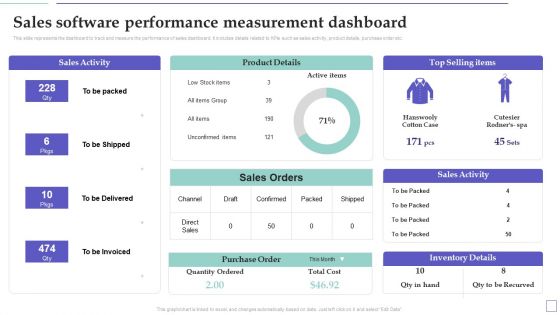
System Deployment Project Sales Software Performance Measurement Dashboard Summary PDF
This slide represents the dashboard to track and measure the performance of sales dashboard. It includes details related to KPIs such as sales activity, product details, purchase order etc. Welcome to our selection of the System Deployment Project Sales Software Performance Measurement Dashboard Summary PDF. These are designed to help you showcase your creativity and bring your sphere to life. Planning and Innovation are essential for any business that is just starting out. This collection contains the designs that you need for your everyday presentations. All of our PowerPoints are 100 percent editable, so you can customize them to suit your needs. This multi-purpose template can be used in various situations. Grab these presentation templates today.
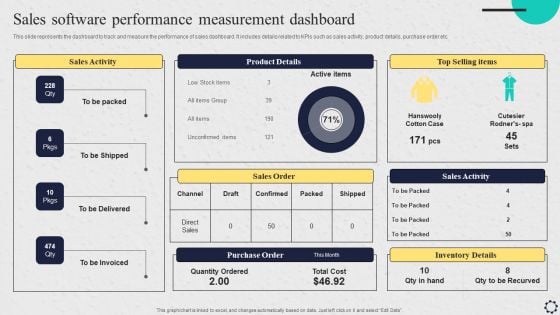
Software Implementation Strategy Sales Software Performance Measurement Dashboard Template PDF
This slide represents the dashboard to track and measure the performance of sales dashboard. It includes details related to KPIs such as sales activity, product details, purchase order etc. Coming up with a presentation necessitates that the majority of the effort goes into the content and the message you intend to convey. The visuals of a PowerPoint presentation can only be effective if it supplements and supports the story that is being told. Keeping this in mind our experts created Software Implementation Strategy Sales Software Performance Measurement Dashboard Template PDF to reduce the time that goes into designing the presentation. This way, you can concentrate on the message while our designers take care of providing you with the right template for the situation.
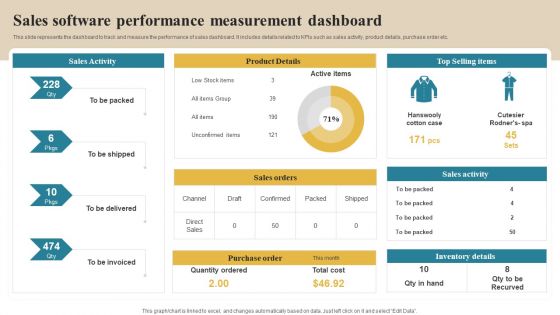
Software Implementation Technique Sales Software Performance Measurement Dashboard Slides PDF
This slide represents the dashboard to track and measure the performance of sales dashboard. It includes details related to KPIs such as sales activity, product details, purchase order etc. This modern and well arranged Software Implementation Technique Sales Software Performance Measurement Dashboard Slides PDF provides lots of creative possibilities. It is very simple to customize and edit with the Powerpoint Software. Just drag and drop your pictures into the shapes. All facets of this template can be edited with Powerpoint no extra software is necessary. Add your own material, put your images in the places assigned for them, adjust the colors, and then you can show your slides to the world, with an animated slide included.
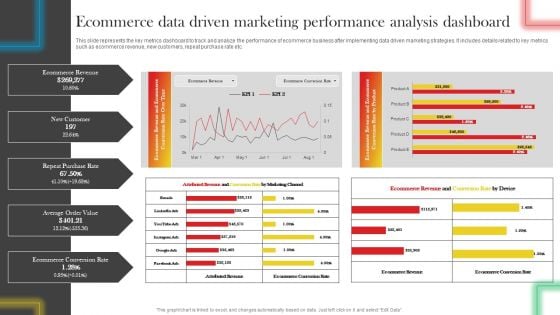
Ecommerce Data Driven Marketing Performance Analysis Dashboard Professional PDF
This slide represents the key metrics dashboard to track and analyze the performance of ecommerce business after implementing data driven marketing strategies. It includes details related to key metrics such as ecommerce revenue, new customers, repeat purchase rate etc. Get a simple yet stunning designed Ecommerce Data Driven Marketing Performance Analysis Dashboard Professional PDF. It is the best one to establish the tone in your meetings. It is an excellent way to make your presentations highly effective. So, download this PPT today from Slidegeeks and see the positive impacts. Our easy-to-edit Ecommerce Data Driven Marketing Performance Analysis Dashboard Professional PDF can be your go-to option for all upcoming conferences and meetings. So, what are you waiting for Grab this template today.
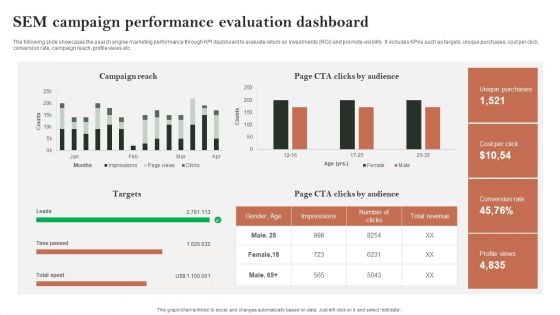
Search Engine Marketing Sem Campaign Performance Evaluation Dashboard Mockup PDF
The following slide showcases the search engine marketing performance through KPI dashboard to evaluate return on investments ROI and promote visibility. It includes KPAs such as targets, unique purchases, cost per click, conversion rate, campaign reach, profile views etc. Crafting an eye-catching presentation has never been more straightforward. Let your presentation shine with this tasteful yet straightforward Search Engine Marketing Sem Campaign Performance Evaluation Dashboard Mockup PDF template. It offers a minimalistic and classy look that is great for making a statement. The colors have been employed intelligently to add a bit of playfulness while still remaining professional. Construct the ideal Search Engine Marketing Sem Campaign Performance Evaluation Dashboard Mockup PDF that effortlessly grabs the attention of your audience Begin now and be certain to wow your customers.
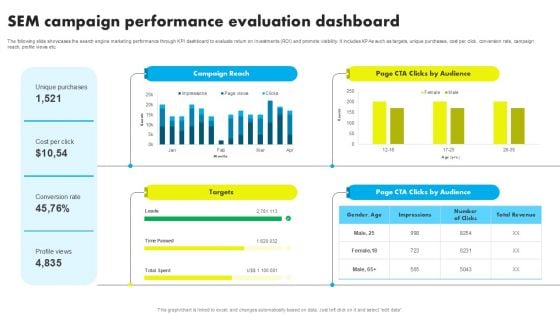
SEM Campaign Performance Evaluation Dashboard Ppt Icon Graphics Tutorials PDF
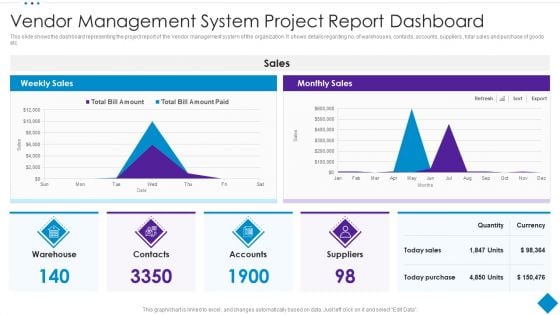
Vendor Management System Project Report Dashboard Template PDF
This slide shows the dashboard representing the project report of the Vendor management system of the organization. It shows details regarding no. of warehouses, contacts, accounts, suppliers , total sales and purchase of goods etc. Showcasing this set of slides titled Vendor Management System Project Report Dashboard Template PDF. The topics addressed in these templates are Purchase, Sales, Suppliers. All the content presented in this PPT design is completely editable. Download it and make adjustments in color, background, font etc. as per your unique business setting.
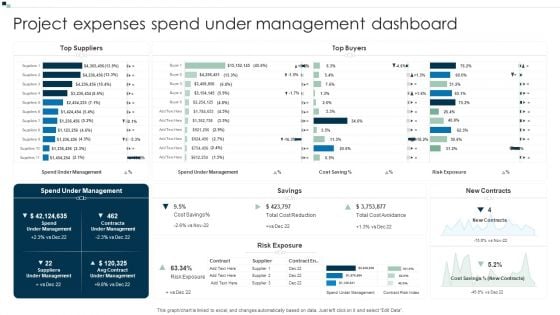
Project Expenses Spend Under Management Dashboard Summary PDF
Showcasing this set of slides titled Project Expenses Spend Under Management Dashboard Summary PDF. The topics addressed in these templates are Top Suppliers, Top Buyers, Spend Under Management . All the content presented in this PPT design is completely editable. Download it and make adjustments in color, background, font etc. as per your unique business setting.
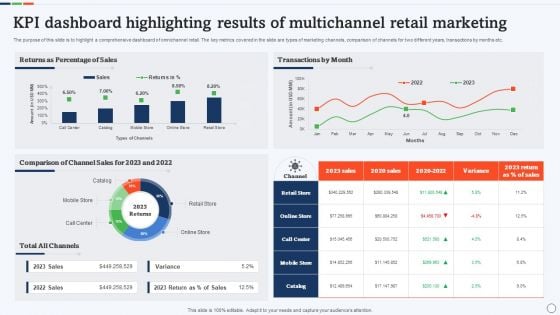
KPI Dashboard Highlighting Results Of Multichannel Retail Marketing Rules PDF
The purpose of this slide is to highlight a comprehensive dashboard of omnichannel retail. The key metrics covered in the slide are types of marketing channels, comparison of channels for two different years, transactions by months etc. Pitch your topic with ease and precision using this KPI Dashboard Highlighting Results Of Multichannel Retail Marketing Rules PDF. This layout presents information on Comparison Of Channel Sales, Percentage Of Sales, Transactions By Month. It is also available for immediate download and adjustment. So, changes can be made in the color, design, graphics or any other component to create a unique layout.
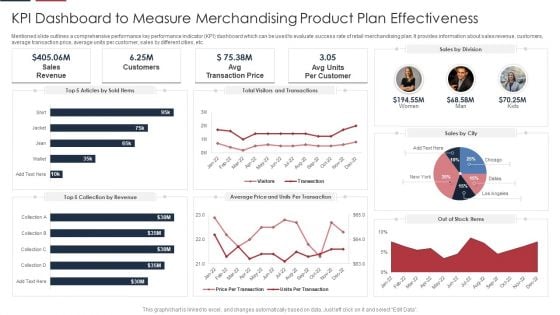
KPI Dashboard To Measure Merchandising Product Plan Effectiveness Guidelines PDF
Mentioned slide outlines a comprehensive performance key performance indicator KPI dashboard which can be used to evaluate success rate of retail merchandising plan. It provides information about sales revenue, customers, average transaction price, average units per customer, sales by different cities, etc. Showcasing this set of slides titled KPI Dashboard To Measure Merchandising Product Plan Effectiveness Guidelines PDF. The topics addressed in these templates are Sales, Customers, Price. All the content presented in this PPT design is completely editable. Download it and make adjustments in color, background, font etc. as per your unique business setting.
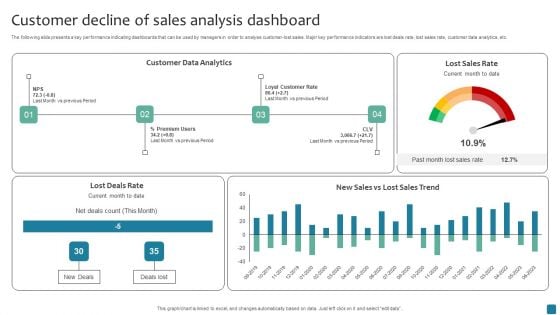
Customer Decline Of Sales Analysis Dashboard Rules PDF
The following slide presents a key performance indicating dashboards that can be used by managers in order to analyse customer-lost sales. Major key performance indicators are lost deals rate, lost sales rate, customer data analytics, etc. Pitch your topic with ease and precision using this Customer Decline Of Sales Analysis Dashboard Rules PDF. This layout presents information on Customer Data Analytics. It is also available for immediate download and adjustment. So, changes can be made in the color, design, graphics or any other component to create a unique layout.
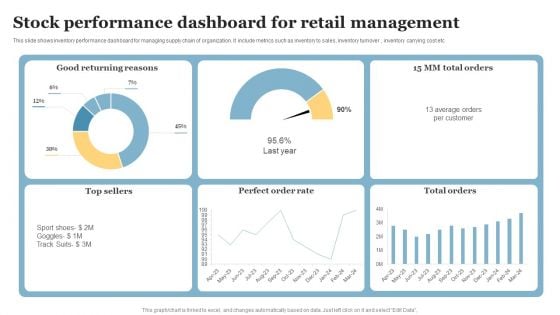
Stock Performance Dashboard For Retail Management Pictures PDF
This slide shows inventory performance dashboard for managing supply chain of organization. It include metrics such as inventory to sales, inventory turnover , inventory carrying cost etc. Pitch your topic with ease and precision using this Stock Performance Dashboard For Retail Management Pictures PDF. This layout presents information on Good Returning Reasons, Perfect Order Rate, Top Sellers. It is also available for immediate download and adjustment. So, changes can be made in the color, design, graphics or any other component to create a unique layout.
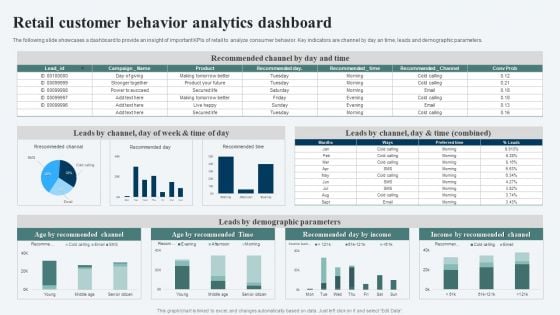
Retail Customer Behavior Analytics Dashboard Ppt Ideas Templates PDF
The following slide showcases a dashboard to provide an insight of important KPIs of retail to analyze consumer behavior. Key indicators are channel by day an time, leads and demographic parameters. Showcasing this set of slides titled Retail Customer Behavior Analytics Dashboard Ppt Ideas Templates PDF. The topics addressed in these templates are Recommended Channel, Leads Demographic Parameters, Income Recommended Channel. All the content presented in this PPT design is completely editable. Download it and make adjustments in color, background, font etc. as per your unique business setting.
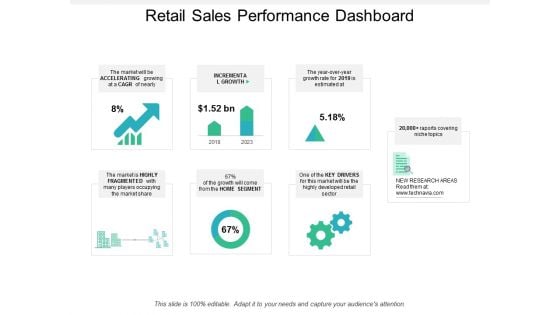
Retail Sales Performance Dashboard Ppt PowerPoint Presentation Summary Portfolio
Presenting this set of slides with name retail sales performance dashboard ppt powerpoint presentation summary portfolio. The topics discussed in these slides are retail, business strategies, sales strategy. This is a completely editable PowerPoint presentation and is available for immediate download. Download now and impress your audience.
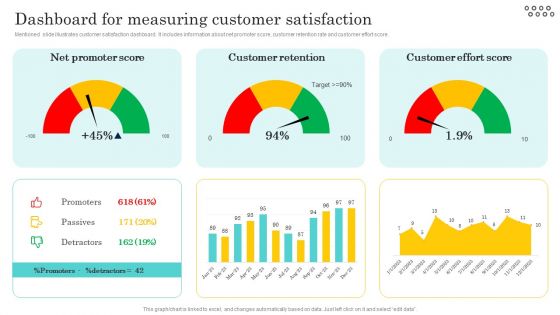
Optimizing And Managing Retail Dashboard For Measuring Customer Formats PDF
Mentioned slide illustrates customer satisfaction dashboard. It includes information about net promoter score, customer retention rate and customer effort score.. From laying roadmaps to briefing everything in detail, our templates are perfect for you. You can set the stage with your presentation slides. All you have to do is download these easy-to-edit and customizable templates. Optimizing And Managing Retail Dashboard For Measuring Customer Formats PDF will help you deliver an outstanding performance that everyone would remember and praise you for. Do download this presentation today.
Different Brands Performance Tracking Dashboard Ppt Gallery Infographics PDF
This slide provides information regarding different brands performance tracking dashboard in terms of brand metric, brand commitment, advertising metrics, and purchase metrics. Take your projects to the next level with our ultimate collection of Different Brands Performance Tracking Dashboard Ppt Gallery Infographics PDF. Slidegeeks has designed a range of layouts that are perfect for representing task or activity duration, keeping track of all your deadlines at a glance. Tailor these designs to your exact needs and give them a truly corporate look with your own brand colors they will make your projects stand out from the rest.
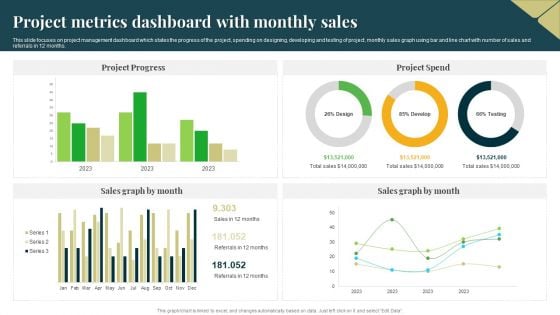
Project Metrics Dashboard With Monthly Sales Professional PDF
This slide focuses on project management dashboard which states the progress of the project, spending on designing, developing and testing of project, monthly sales graph using bar and line chart with number of sales and referrals in 12 months. Pitch your topic with ease and precision using this Project Metrics Dashboard With Monthly Sales Professional PDF. This layout presents information on Project Progress, Project Spend, Sales Graph. It is also available for immediate download and adjustment. So, changes can be made in the color, design, graphics or any other component to create a unique layout.
Brand Recognition Overview Different Brands Performance Tracking Dashboard Brochure PDF
This slide provides information regarding different brands performance tracking dashboard in terms of brand metric, brand commitment, advertising metrics, and purchase metrics. Do you have to make sure that everyone on your team knows about any specific topic I yes, then you should give Brand Recognition Overview Different Brands Performance Tracking Dashboard Brochure PDF a try. Our experts have put a lot of knowledge and effort into creating this impeccable Brand Recognition Overview Different Brands Performance Tracking Dashboard Brochure PDF. You can use this template for your upcoming presentations, as the slides are perfect to represent even the tiniest detail. You can download these templates from the Slidegeeks website and these are easy to edit. So grab these today
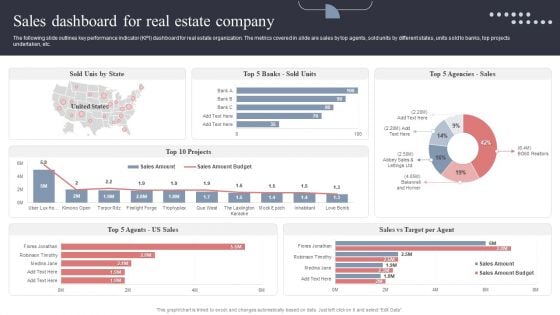
Sales Dashboard For Real Estate Company Topics PDF
The following slide outlines key performance indicator KPI dashboard for real estate organization. The metrics covered in slide are sales by top agents, sold units by different states, units sold to banks, top projects undertaken, etc. This Sales Dashboard For Real Estate Company Topics PDF is perfect for any presentation, be it in front of clients or colleagues. It is a versatile and stylish solution for organizing your meetings. The Sales Dashboard For Real Estate Company Topics PDF features a modern design for your presentation meetings. The adjustable and customizable slides provide unlimited possibilities for acing up your presentation. Slidegeeks has done all the homework before launching the product for you. So, do not wait, grab the presentation templates today
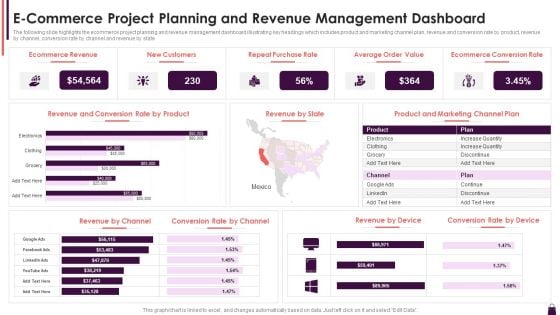
E Commerce Project Planning And Revenue Management Dashboard Introduction PDF
The following slide highlights the ecommerce project planning and revenue management dashboard illustrating key headings which includes product and marketing channel plan, revenue and conversion rate by product, revenue by channel, conversion rate by channel and revenue by state. Showcasing this set of slides titled E Commerce Project Planning And Revenue Management Dashboard Introduction PDF. The topics addressed in these templates are New Customers, Ecommerce Revenue, Repeat Purchase Rate. All the content presented in this PPT design is completely editable. Download it and make adjustments in color, background, font etc. as per your unique business setting.
Project Metrics Dashboard With Revenues And Expenses Icons PDF
This slide shows the project management dashboard which covers the name, priorities, indicators and status which includes strategic priorities, research and development, administration, performance management, etc. With purchases in last 30 days and tasks. Showcasing this set of slides titled Project Metrics Dashboard With Revenues And Expenses Icons PDF. The topics addressed in these templates are Performance Management, Research And Development, Strategic Priorities. All the content presented in this PPT design is completely editable. Download it and make adjustments in color, background, font etc. as per your unique business setting.
Property Flipping Expenses And Profit Tracking Dashboard Ppt Good PDF
This slide covers dashboard to estimate multiple expenses incurred and profits earned by property flipping. It includes elements such repair costs, after repair value, rehab profits, purchase price, total amount of investment Made, etc. Showcasing this set of slides titled Property Flipping Expenses And Profit Tracking Dashboard Ppt Good PDF. The topics addressed in these templates are Repair Costs, Loan Amount, Down Payment. All the content presented in this PPT design is completely editable. Download it and make adjustments in color, background, font etc. as per your unique business setting.
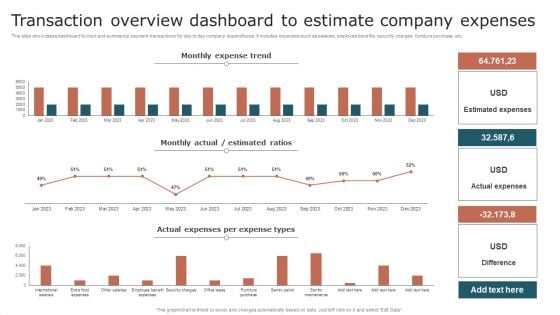
Transaction Overview Dashboard To Estimate Company Expenses Mockup PDF
This slide showcases dashboard to track and summarize payment transactions for day to day company expenditures. It includes expenses such as salaries, employee benefits, security charges, furniture purchase, etc. Showcasing this set of slides titled Transaction Overview Dashboard To Estimate Company Expenses Mockup PDF. The topics addressed in these templates are Monthly Expense Trend, Estimated Ratios, Actual Expenses. All the content presented in this PPT design is completely editable. Download it and make adjustments in color, background, font etc. as per your unique business setting.


 Continue with Email

 Home
Home


