Procurement Planning Dashboards
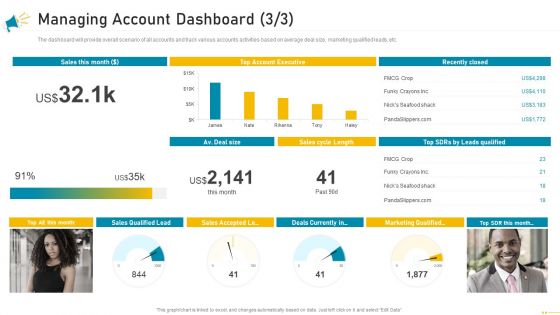
Key Account Marketing Approach Managing Account Dashboard Sales Designs PDF
The dashboard will provide overall scenario of all accounts and track various accounts activities based on average deal size, marketing qualified leads, etc. Deliver and pitch your topic in the best possible manner with this key account marketing approach managing account dashboard sales designs pdf. Use them to share invaluable insights on sales, account executive, marketing and impress your audience. This template can be altered and modified as per your expectations. So, grab it now.
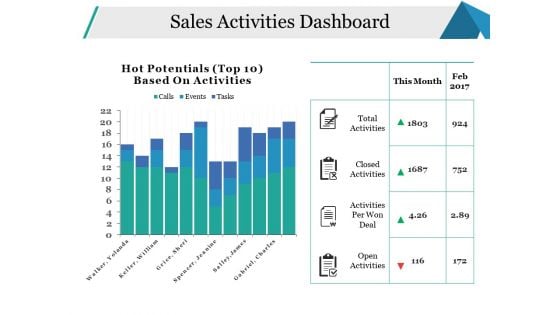
Sales Activities Dashboard Ppt PowerPoint Presentation Pictures Model
This is a sales activities dashboard ppt powerpoint presentation pictures model. This is a two stage process. The stages in this process are open activities, activities per won deal, closed activities, total activities, business.

Sales Activities Dashboard Ppt PowerPoint Presentation Ideas Themes
This is a sales activities dashboard ppt powerpoint presentation ideas themes. This is a two stage process. The stages in this process are total activities, closed activities, activities per won deal, open activities.
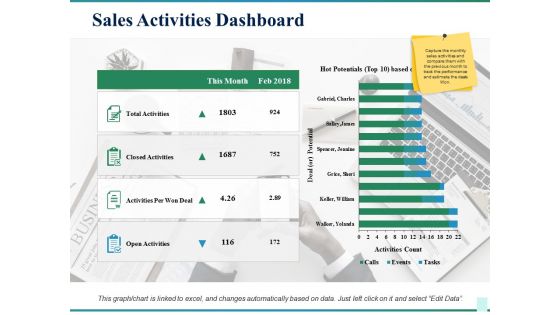
Sales Activities Dashboard Ppt PowerPoint Presentation Show Skills
This is a sales activities dashboard ppt powerpoint presentation show skills. This is a four stage process. The stages in this process are total activities, closed activities, activities per won deal, open activities, this month.
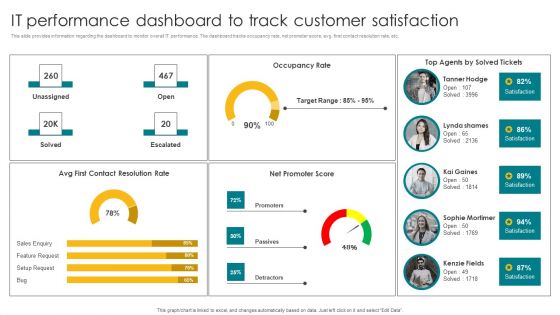
IT Performance Dashboard To Track Customer Satisfaction Elements PDF
This slide provides information regarding the dashboard to monitor overall IT performance. The dashboard tracks occupancy rate, net promoter score, avg. first contact resolution rate, etc. Boost your pitch with our creative IT Performance Dashboard To Track Customer Satisfaction Elements PDF. Deliver an awe inspiring pitch that will mesmerize everyone. Using these presentation templates you will surely catch everyones attention. You can browse the ppts collection on our website. We have researchers who are experts at creating the right content for the templates. So you do not have to invest time in any additional work. Just grab the template now and use them.
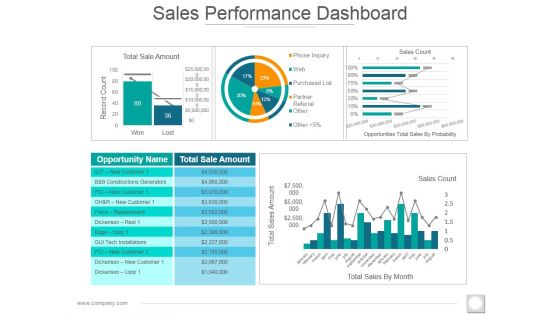
Sales Performance Dashboard Ppt PowerPoint Presentation Styles Images
This is a sales performance dashboard ppt powerpoint presentation styles images. This is a five stage process. The stages in this process are total sale amount, record count, sales count, total sales amount, total sales by month.

Commodity Management Dashboard Ppt PowerPoint Presentation Outline Clipart Cpb Pdf
Presenting this set of slides with name commodity management dashboard ppt powerpoint presentation outline clipart cpb pdf. This is an editable Powerpoint eight stages graphic that deals with topics like commodity management dashboard to help convey your message better graphically. This product is a premium product available for immediate download and is 100 percent editable in Powerpoint. Download this now and use it in your presentations to impress your audience.
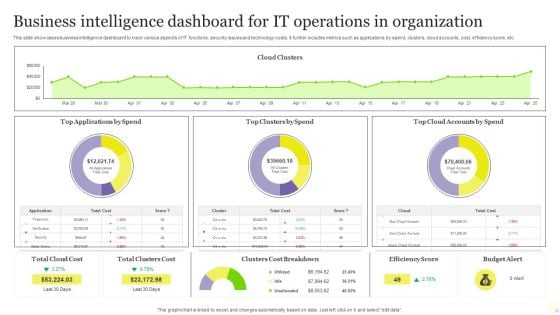
Business Intelligence Dashboard For It Operations In Organization Themes PDF
This slide showcases business intelligence dashboard to track various aspects of IT functions, security issues and technology costs. It further includes metrics such as applications by spend, clusters, cloud accounts, cost, efficiency score, etc. Showcasing this set of slides titled Business Intelligence Dashboard For It Operations In Organization Themes PDF. The topics addressed in these templates are Business Intelligence Dashboard, IT Operations, Organization. All the content presented in this PPT design is completely editable. Download it and make adjustments in color, background, font etc. as per your unique business setting.
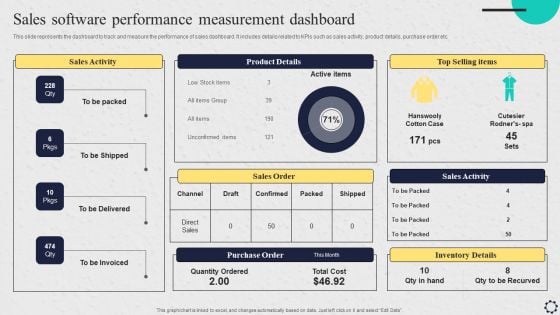
Software Implementation Strategy Sales Software Performance Measurement Dashboard Template PDF
This slide represents the dashboard to track and measure the performance of sales dashboard. It includes details related to KPIs such as sales activity, product details, purchase order etc. Coming up with a presentation necessitates that the majority of the effort goes into the content and the message you intend to convey. The visuals of a PowerPoint presentation can only be effective if it supplements and supports the story that is being told. Keeping this in mind our experts created Software Implementation Strategy Sales Software Performance Measurement Dashboard Template PDF to reduce the time that goes into designing the presentation. This way, you can concentrate on the message while our designers take care of providing you with the right template for the situation.
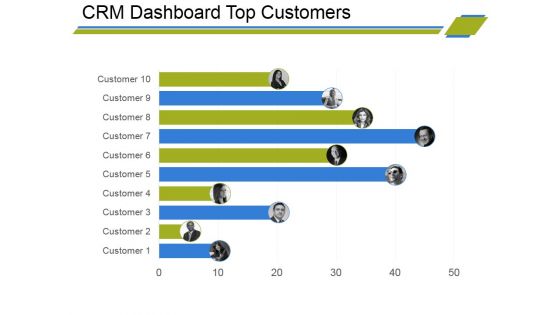
Crm Dashboard Top Customers Ppt PowerPoint Presentation Styles Designs
This is a crm dashboard top customers ppt powerpoint presentation styles designs. This is a ten stage process. The stages in this process are business, customer, finance, bar graph, marketing, strategy, analysis.
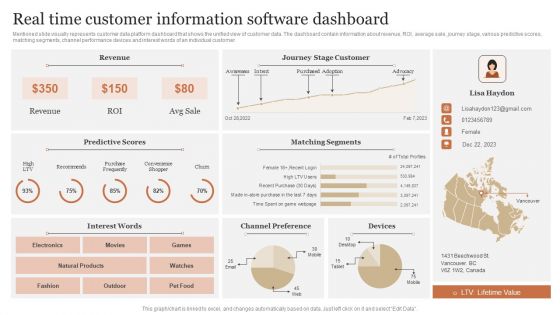
Real Time Customer Information Software Dashboard Portrait PDF
Mentioned slide visually represents customer data platform dashboard that shows the unified view of customer data. The dashboard contain information about revenue, ROI, average sale, journey stage, various predictive scores, matching segments, channel performance devices and interest words of an individual customer. Showcasing this set of slides titled Real Time Customer Information Software Dashboard Portrait PDF. The topics addressed in these templates are Predictive Scores, Matching Segments, Channel Preference. All the content presented in this PPT design is completely editable. Download it and make adjustments in color, background, font etc. as per your unique business setting.
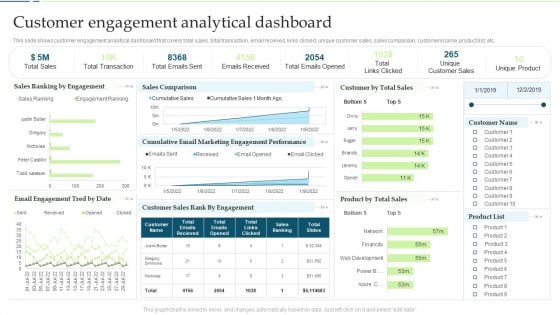
Customer Engagement And Experience Customer Engagement Analytical Dashboard Slides PDF
This slide shows customer engagement analytical dashboard that covers total sales, total transaction, email received, links clicked, unique customer sales, sales comparison, customers name, product list, etc.Deliver an awe inspiring pitch with this creative Customer Engagement And Experience Customer Engagement Analytical Dashboard Slides PDF bundle. Topics like Total Transaction, Emails Received, Unique Customer can be discussed with this completely editable template. It is available for immediate download depending on the needs and requirements of the user.
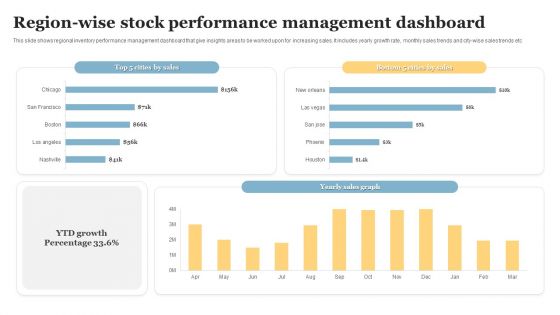
Region Wise Stock Performance Management Dashboard Introduction PDF
This slide shows regional inventory performance management dashboard that give insights areas to be worked upon for increasing sales. It includes yearly growth rate, monthly sales trends and city wise sales trends etc. Pitch your topic with ease and precision using this Region Wise Stock Performance Management Dashboard Introduction PDF. This layout presents information on Stock Performance, Management Dashboard. It is also available for immediate download and adjustment. So, changes can be made in the color, design, graphics or any other component to create a unique layout.
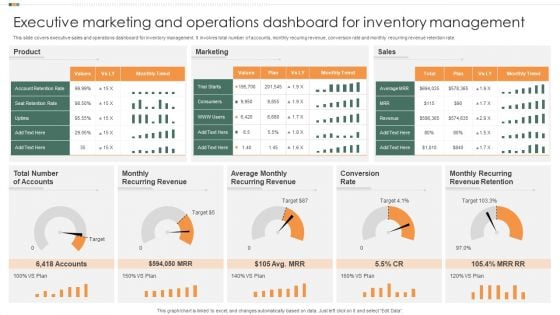
Executive Marketing And Operations Dashboard For Inventory Management Template PDF
This slide covers executive sales and operations dashboard for inventory management. It involves total number of accounts, monthly recuring revenue, conversion rate and monthly recurring revenue retention rate. Showcasing this set of slides titled Executive Marketing And Operations Dashboard For Inventory Management Template PDF. The topics addressed in these templates are Product, Marketing, Sales. All the content presented in this PPT design is completely editable. Download it and make adjustments in color, background, font etc. as per your unique business setting.

Project Metrics Dashboard Depicting Weekly Schedule Graphics PDF
This slide focuses on project management dashboard which shows the activities scheduled for one month such as demo task for resource management, meeting regarding onboarding process, long term support for personnel, weekly meetups, to do list for next month, etc. Showcasing this set of slides titled Project Metrics Dashboard Depicting Weekly Schedule Graphics PDF. The topics addressed in these templates are Equipment, Sales Activity, Resource. All the content presented in this PPT design is completely editable. Download it and make adjustments in color, background, font etc. as per your unique business setting.
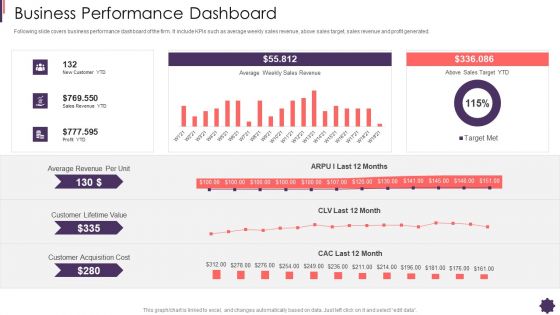
Business Performance Dashboard Brand Techniques Structure Introduction PDF
Following slide covers business performance dashboard of the firm. It include KPIs such as average weekly sales revenue, above sales target, sales revenue and profit generated. Deliver an awe inspiring pitch with this creative business performance dashboard brand techniques structure introduction pdf bundle. Topics like average, revenue, sales, profit, cost can be discussed with this completely editable template. It is available for immediate download depending on the needs and requirements of the user.

KPI Dashboard Highlighting Marketing Campaign Results Mockup PDF
The purpose of this slide is to highlight a comprehensive dashboard which can assist the organization to evaluate the marketing campaign results. The dashboard covers information about sales performance, product performance, ecommerce conversion rate, etc. Showcasing this set of slides titled KPI Dashboard Highlighting Marketing Campaign Results Mockup PDF. The topics addressed in these templates are Sales Performance, Product Performance Analysis. All the content presented in this PPT design is completely editable. Download it and make adjustments in color, background, font etc. as per your unique business setting.
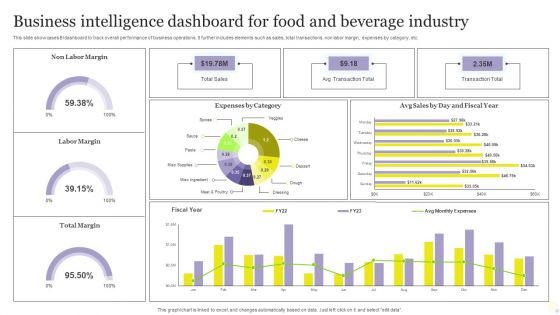
Business Intelligence Dashboard For Food And Beverage Industry Diagrams PDF
This slide showcases BI dashboard to track overall performance of business operations. It further includes elements such as sales, total transactions, non labor margin, expenses by category, etc. Pitch your topic with ease and precision using this Business Intelligence Dashboard For Food And Beverage Industry Diagrams PDF. This layout presents information on Expenses, Sales, Business Intelligence Dashboard. It is also available for immediate download and adjustment. So, changes can be made in the color, design, graphics or any other component to create a unique layout.
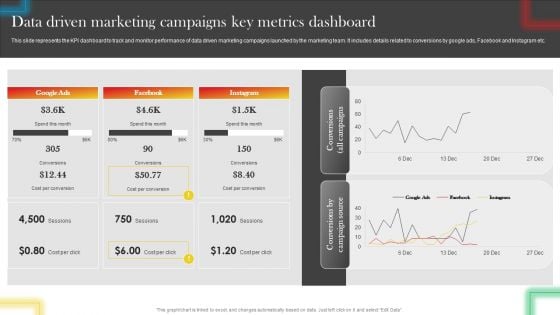
Data Driven Marketing Campaigns Key Metrics Dashboard Microsoft PDF
This slide represents the KPI dashboard to track and monitor performance of data driven marketing campaigns launched by the marketing team. It includes details related to conversions by google ads, Facebook and Instagram etc. There are so many reasons you need a Data Driven Marketing Campaigns Key Metrics Dashboard Microsoft PDF. The first reason is you can not spend time making everything from scratch, Thus, Slidegeeks has made presentation templates for you too. You can easily download these templates from our website easily.
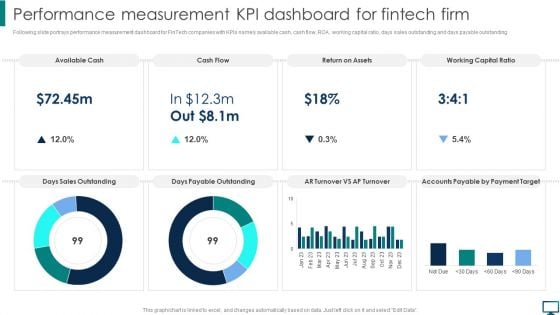
Performance Measurement KPI Dashboard For Fintech Firm Topics PDF
Following slide portrays performance measurement dashboard for FinTech companies with KPIs namely available cash, cash flow, ROA, working capital ratio, days sales outstanding and days payable outstanding. Create an editable Performance Measurement KPI Dashboard For Fintech Firm Topics PDF that communicates your idea and engages your audience. Whether you are presenting a business or an educational presentation, pre designed presentation templates help save time. Performance Measurement KPI Dashboard For Fintech Firm Topics PDF is highly customizable and very easy to edit, covering many different styles from creative to business presentations. Slidegeeks has creative team members who have crafted amazing templates. So, go and get them without any delay.
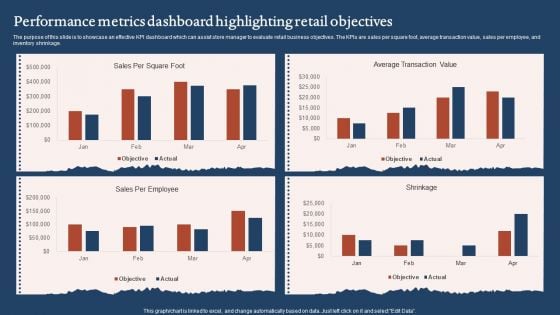
Performance Metrics Dashboard Highlighting Retail Objectives Sample PDF
The purpose of this slide is to showcase an effective KPI dashboard which can assist store manager to evaluate retail business objectives. The KPIs are sales per square foot, average transaction value, sales per employee, and inventory shrinkage. Pitch your topic with ease and precision using this Performance Metrics Dashboard Highlighting Retail Objectives Sample PDF. This layout presents information on Average Transaction Value, Sales Per Employee. It is also available for immediate download and adjustment. So, changes can be made in the color, design, graphics or any other component to create a unique layout.

KPI Dashboard To Measurement Brand Equity Microsoft PDF
Mentioned slide highlights multiple metrics which can be used by marketer to measure the brand value. The metrics mentioned in the dashboard are total sales, customer lifetime value, customer adoption rate, customer acquisition cost etc. Pitch your topic with ease and precision using this kpi dashboard to measurement brand equity microsoft pdf. This layout presents information on kpi dashboard to measurement brand equity. It is also available for immediate download and adjustment. So, changes can be made in the color, design, graphics or any other component to create a unique layout.
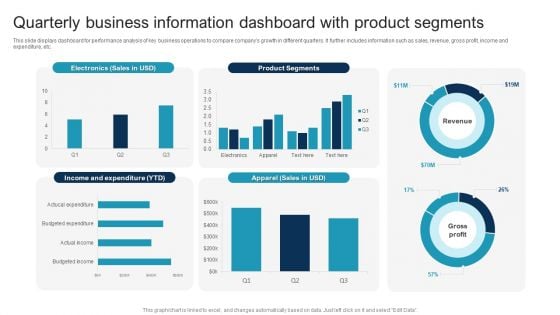
Quarterly Business Information Dashboard With Product Segments Slides PDF
This slide displays dashboard for performance analysis of key business operations to compare companys growth in different quarters. It further includes information such as sales, revenue, gross profit, income and expenditure, etc. Showcasing this set of slides titled Quarterly Business Information Dashboard With Product Segments Slides PDF. The topics addressed in these templates are Quarterly Business Information, Dashboard With Product Segments. All the content presented in this PPT design is completely editable. Download it and make adjustments in color, background, font etc. as per your unique business setting.
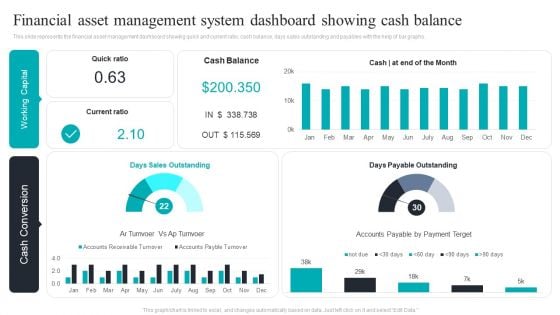
Financial Asset Management System Dashboard Showing Cash Balance Download PDF
This slide represents the financial asset management dashboard showing quick and current ratio, cash balance, days sales outstanding and payables with the help of bar graphs. Pitch your topic with ease and precision using this Financial Asset Management System Dashboard Showing Cash Balance Download PDF. This layout presents information on Financial Asset, Management System, Dashboard Showing, Cash Balance. It is also available for immediate download and adjustment. So, changes can be made in the color, design, graphics or any other component to create a unique layout.
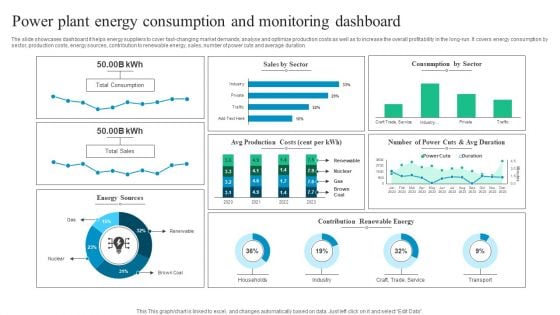
Power Plant Energy Consumption And Monitoring Dashboard Diagrams PDF
The slide showcases dashboard it helps energy suppliers to cover fast-changing market demands, analyse and optimize production costs as well as to increase the overall profitability in the long-run. It covers energy consumption by sector, production costs, energy sources, contribution to renewable energy, sales, number of power cuts and average duration. Pitch your topic with ease and precision using this Power Plant Energy Consumption And Monitoring Dashboard Diagrams PDF. This layout presents information on Power Plant Energy Consumption, Monitoring Dashboard. It is also available for immediate download and adjustment. So, changes can be made in the color, design, graphics or any other component to create a unique layout.
Sales Product Performance Dashboard Ppt PowerPoint Presentation Summary Icon
This is a sales product performance dashboard ppt powerpoint presentation infographics samples. This is a four stage process. The stages in this process are top products in revenue, incremental sales campaign, sales product performance, cost of goods sold.
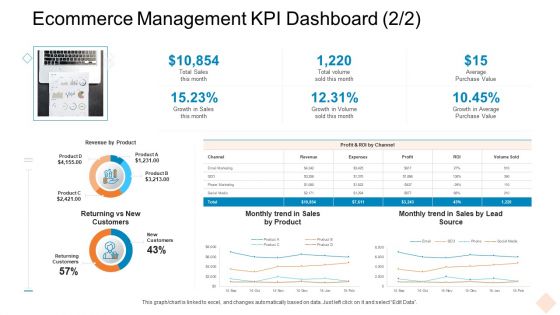
Ecommerce Management KPI Dashboard Ppt Infographics Graphics Example PDF
Deliver and pitch your topic in the best possible manner with this ecommerce management kpi dashboard ppt infographics graphics example pdf. Use them to share invaluable insights on revenue by product, sales by product, growth in average purchase value and impress your audience. This template can be altered and modified as per your expectations. So, grab it now.
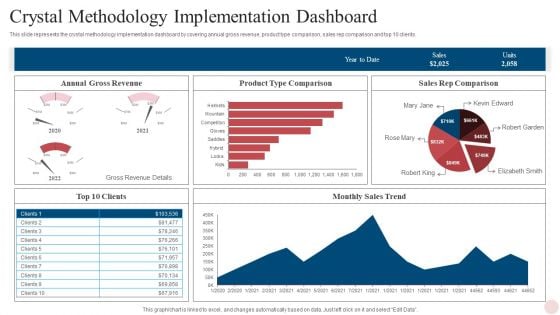
Agile Crystal Techniques Crystal Methodology Implementation Dashboard Themes PDF
This slide represents the crystal methodology implementation dashboard by covering annual gross revenue, product type comparison, sales rep comparison and top 10 clients. Deliver an awe inspiring pitch with this creative Agile Crystal Techniques Crystal Methodology Implementation Dashboard Themes PDF bundle. Topics like Monthly Sales Trend, Sales Rep Comparison, Product Type Comparison can be discussed with this completely editable template. It is available for immediate download depending on the needs and requirements of the user.

KPI Dashboard To Track Amazon Performance Ppt Styles Guidelines PDF
This slide provides information regarding dashboard to monitor Amazon performance. The KPIs include tracking of product sales, conversion rate, advertising spends, session, organic sales, etc. There are so many reasons you need a KPI Dashboard To Track Amazon Performance Ppt Styles Guidelines PDF. The first reason is you can not spend time making everything from scratch, Thus, Slidegeeks has made presentation templates for you too. You can easily download these templates from our website easily.
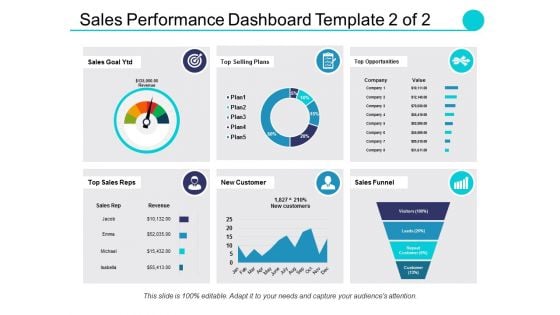
Sales Performance Dashboard Template Ppt PowerPoint Presentation Professional Elements
This is a sales performance dashboard template ppt powerpoint presentation professional elements. This is a eight stage process. The stages in this process are sales comparison, sales by product category, sales by month, brand profitability, revenue.
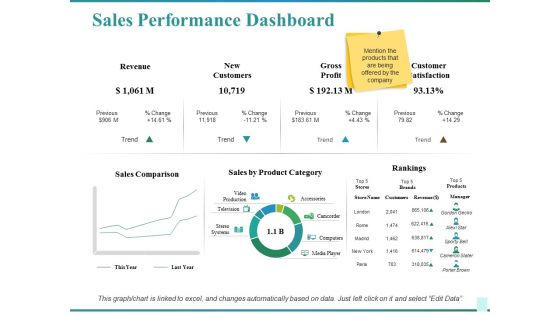
Sales Performance Dashboard Ppt PowerPoint Presentation Show Graphics Design
This is a sales performance dashboard ppt powerpoint presentation show graphics design. This is a two stage process. The stages in this process are sales comparison, sales by product category, rankings, customer satisfaction, revenue.

Sales Product Performance Dashboard Ppt PowerPoint Presentation Model Graphics Design
This is a sales product performance dashboard ppt powerpoint presentation model graphics design. This is a four stage process. The stages in this process are top products in revenue, incremental sales, cost of goods.
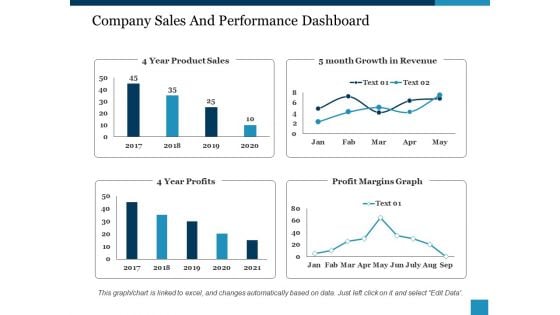
Company Sales And Performance Dashboard Ppt PowerPoint Presentation Show Structure
This is a company sales and performance dashboard ppt powerpoint presentation show structure. This is a four stage process. The stages in this process are year product sales, month growth in revenue, profit margins graph, year profits.
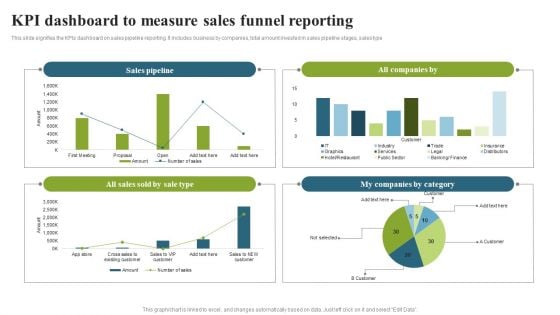
KPI Dashboard To Measure Sales Funnel Reporting Template PDF
This slide signifies the KPIs dashboard on sales pipeline reporting. It includes business by companies, total amount invested in sales pipeline stages, sales type. Showcasing this set of slides titled KPI Dashboard To Measure Sales Funnel Reporting Template PDF. The topics addressed in these templates are Sales Pipeline, Companies Category, Sales Sold. All the content presented in this PPT design is completely editable. Download it and make adjustments in color, background, font etc. as per your unique business setting.
Sales Activities Dashboard Ppt PowerPoint Presentation Icon Graphics
This is a sales activities dashboard ppt powerpoint presentation icon graphics. This is a two stage process. The stages in this process are business, finance, management, analysis, budget, actual.
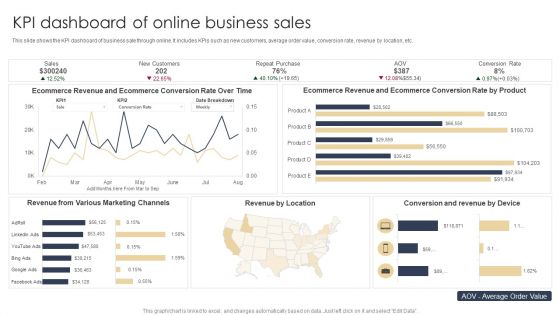
KPI Dashboard Of Online Business Sales Microsoft PDF
This slide shows the KPI dashboard of business sale through online. It includes KPIs such as new customers, average order value, conversion rate, revenue by location, etc. Showcasing this set of slides titled KPI Dashboard Of Online Business Sales Microsoft PDF. The topics addressed in these templates are Marketing Channels, Revenue, Location. All the content presented in this PPT design is completely editable. Download it and make adjustments in color, background, font etc. as per your unique business setting.
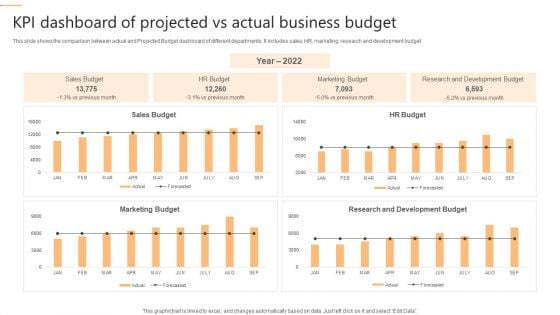
KPI Dashboard Of Projected Vs Actual Business Budget Pictures PDF
This slide shows the comparison between actual and Projected Budget dashboard of different departments. It includes sales, HR, marketing, research and development budget. Showcasing this set of slides titled KPI Dashboard Of Projected Vs Actual Business Budget Pictures PDF. The topics addressed in these templates are Marketing Budget, Development Budget, Sales Budget. All the content presented in this PPT design is completely editable. Download it and make adjustments in color, background, font etc. as per your unique business setting.

Market Area Analysis Regional Sales Performance Metrics Dashboard Designs PDF
This slide provides the glimpse about the sales performance metrics which focuses on regional sales based on customer demands and sales team performance. Deliver and pitch your topic in the best possible manner with this market area analysis regional sales performance metrics dashboard designs pdf. Use them to share invaluable insights on regional sales performance metrics dashboard and impress your audience. This template can be altered and modified as per your expectations. So, grab it now.
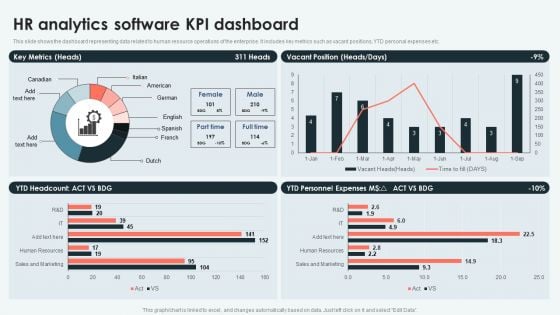
Analyzing And Deploying HR Analytics Software Kpi Dashboard Information PDF
This slide shows the dashboard representing data related to human resource operations of the enterprise. It includes key metrics such as vacant positions, YTD personal expenses etc. There are so many reasons you need a Analyzing And Deploying HR Analytics Software Kpi Dashboard Information PDF. The first reason is you cant spend time making everything from scratch, Thus, Slidegeeks has made presentation templates for you too. You can easily download these templates from our website easily.
B2B Sales Representative Insights Dashboard Ppt Icon PDF
This slide covers the sales reps dashboard wherein teams contribution to leads, managing SQLs and revenue targets are evaluated.Deliver an awe-inspiring pitch with this creative B2B sales representative insights dashboard ppt icon pdf. bundle. Topics like sales representatives leads actual, sales representatives revenue actual, revenue pace can be discussed with this completely editable template. It is available for immediate download depending on the needs and requirements of the user.
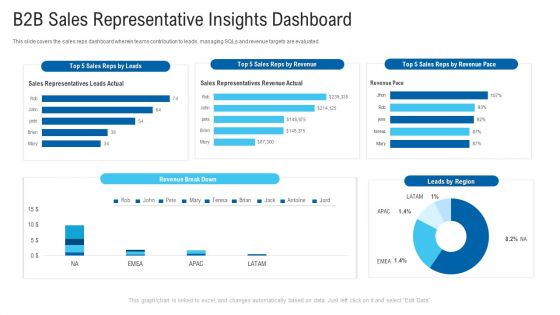
B2B Sales Representative Insights Dashboard Ppt Summary PDF
This slide covers the sales reps dashboard wherein teams contribution to leads, managing SQLs and revenue targets are evaluated.Deliver an awe-inspiring pitch with this creative B2B sales representative insights dashboard ppt summary pdf. bundle. Topics like sales representatives leads actual, sales representatives revenue actual, revenue pace can be discussed with this completely editable template. It is available for immediate download depending on the needs and requirements of the user.
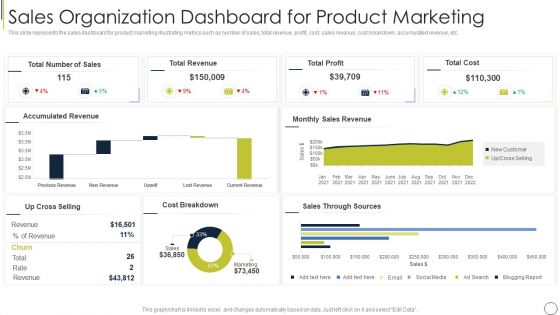
Sales Organization Dashboard For Product Marketing Themes PDF
This slide represents the sales dashboard for product marketing illustrating metrics such as number of sales, total revenue, profit, cost, sales revenue, cost breakdown, accumulated revenue, etc. Pitch your topic with ease and precision using this sales organization dashboard for product marketing themes pdf. This layout presents information on total cost, total profit, total revenue. It is also available for immediate download and adjustment. So, changes can be made in the color, design, graphics or any other component to create a unique layout.
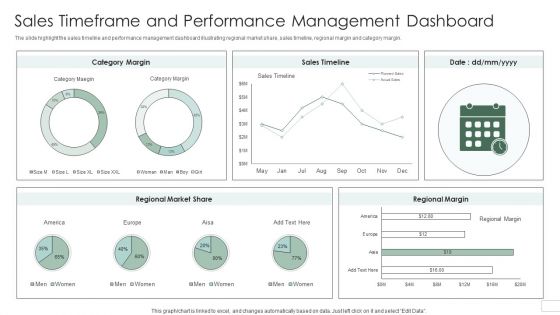
Sales Timeframe And Performance Management Dashboard Introduction PDF
The slide highlight the sales timeline and performance management dashboard illustrating regional market share, sales timeline, regional margin and category margin. Pitch your topic with ease and precision using this Sales Timeframe And Performance Management Dashboard Introduction PDF. This layout presents information on Regional Market Share, Category Margin, Sales Timeline. It is also available for immediate download and adjustment. So, changes can be made in the color, design, graphics or any other component to create a unique layout.
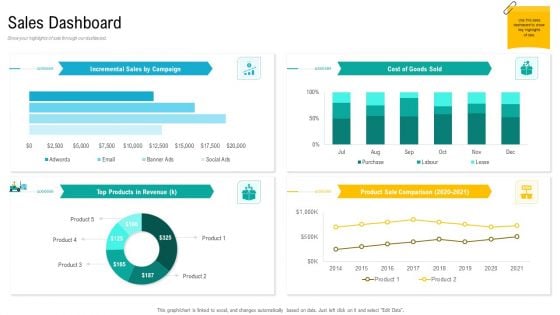
Product USP Sales Dashboard Ppt Inspiration Background Designs PDF
Show your highlights of sale through our dashboard. Deliver and pitch your topic in the best possible manner with this product usp sales dashboard ppt inspiration background designs pdf. Use them to share invaluable insights on product sale comparison, products in revenue, cost of goods sold and impress your audience. This template can be altered and modified as per your expectations. So, grab it now.
Five Years Sales Projection And Analysis Dashboard Icons PDF
This slide defines the dashboard for five years sales forecast and analysis . It includes information related to the estimated and actual sales. Pitch your topic with ease and precision using this Five Years Sales Projection And Analysis Dashboard Icons PDF. This layout presents information on Forecast Value, Forecast Accuracy, Won Opportunities. It is also available for immediate download and adjustment. So, changes can be made in the color, design, graphics or any other component to create a unique layout.
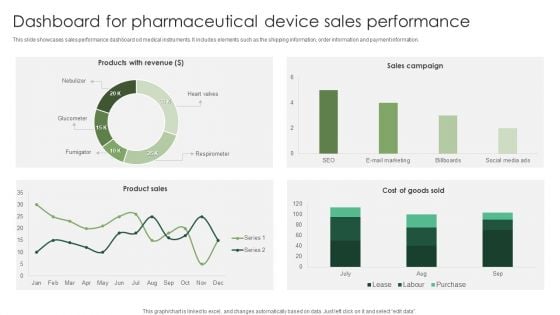
Dashboard For Pharmaceutical Device Sales Performance Graphics PDF
This slide showcases sales performance dashboard od medical instruments. It includes elements such as the shipping information, order information and payment information. Showcasing this set of slides titled Dashboard For Pharmaceutical Device Sales Performance Graphics PDF. The topics addressed in these templates are Pharmaceutical Device, Sales Performance. All the content presented in this PPT design is completely editable. Download it and make adjustments in color, background, font etc. as per your unique business setting.
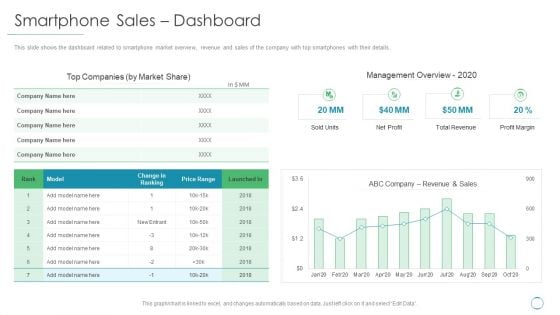
Smartphone Sales Dashboard Ppt Infographics Graphic Tips PDF
This slide shows the dashboard related to smartphone market overview, revenue and sales of the company with top smartphones with their details. Deliver an awe inspiring pitch with this creative smartphone sales dashboard ppt infographics graphic tips pdf bundle. Topics like management overview, profit margin, total revenue, net profit can be discussed with this completely editable template. It is available for immediate download depending on the needs and requirements of the user.
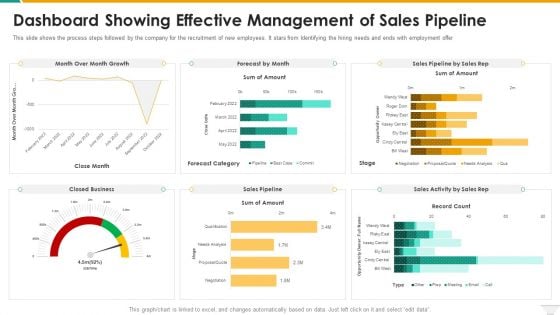
Dashboard Showing Effective Management Of Sales Pipeline Rules PDF
This slide shows the process steps followed by the company for the recruitment of new employees. It stars from Identifying the hiring needs and ends with employment offer. Deliver an awe inspiring pitch with this creative Dashboard Showing Effective Management Of Sales Pipeline Rules PDF bundle. Topics like Dashboard Showing Effective Management Of Sales Pipeline can be discussed with this completely editable template. It is available for immediate download depending on the needs and requirements of the user.
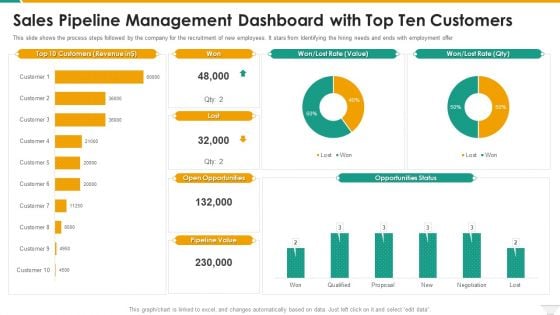
Sales Pipeline Management Dashboard With Top Ten Customers Microsoft PDF
This slide shows the process steps followed by the company for the recruitment of new employees. It stars from Identifying the hiring needs and ends with employment offer. Deliver an awe inspiring pitch with this creative Sales Pipeline Management Dashboard With Top Ten Customers Microsoft PDF bundle. Topics like Sales Pipeline Management Dashboard With Top Ten Customers can be discussed with this completely editable template. It is available for immediate download depending on the needs and requirements of the user.
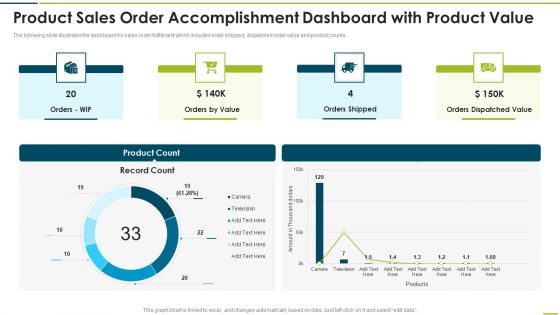
Product Sales Order Accomplishment Dashboard With Product Value Themes PDF
The following slide illustrates the dashboard for sales order fulfillment which includes order shipped, dispatched order value and product counts.Pitch your topic with ease and precision using this Product Sales Order Accomplishment Dashboard With Product Value Themes PDF This layout presents information on Orders Shipped, Dispatched Value, Orders Value It is also available for immediate download and adjustment. So, changes can be made in the color, design, graphics or any other component to create a unique layout.
B2B Sales Representatives Performance Tracking Dashboard Background PDF
This slide provides information regarding B2B sales representatives performance tracking dashboard to measure leads by region, revenue breakdown, top performers by leads, revenues, etc. Deliver and pitch your topic in the best possible manner with this B2B Sales Representatives Performance Tracking Dashboard Background PDF. Use them to share invaluable insights on Individual Performance, Achieved Highest, Revenue Relative and impress your audience. This template can be altered and modified as per your expectations. So, grab it now.

Weekly Sales Performance KPI Dashboard For Revenue Generation Brochure PDF
The following slide exhibits dashboard to maintain revenue and management under control. It presents information related to profits, cross selling, costs, etc. Pitch your topic with ease and precision using this Weekly Sales Performance KPI Dashboard For Revenue Generation Brochure PDF. This layout presents information on Total Sales, Revenue, Profit, Cost. It is also available for immediate download and adjustment. So, changes can be made in the color, design, graphics or any other component to create a unique layout.
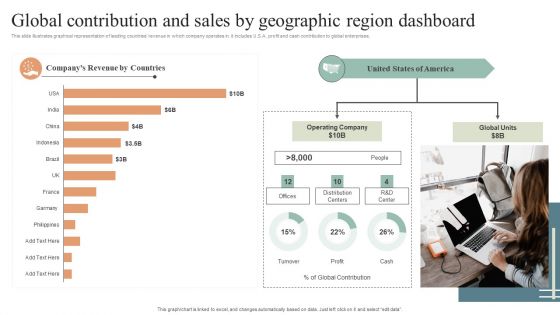
Global Contribution And Sales By Geographic Region Dashboard Diagrams PDF
This slide illustrates graphical representation of leading countries revenue in which company operates in. it includes U.S.A. profit and cash contribution to global enterprises. Pitch your topic with ease and precision using this Global Contribution And Sales By Geographic Region Dashboard Diagrams PDF. This layout presents information on Global Contribution, Sales By Geographic, Region Dashboard. It is also available for immediate download and adjustment. So, changes can be made in the color, design, graphics or any other component to create a unique layout.
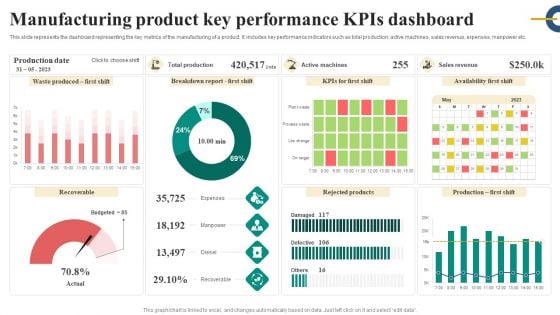
Manufacturing Product Key Performance Kpis Dashboard Inspiration PDF
This slide represents the dashboard representing the key metrics of the manufacturing of a product. It includes key performance indicators such as total production, active machines, sales revenue, expenses, manpower etc. Showcasing this set of slides titled Manufacturing Product Key Performance Kpis Dashboard Inspiration PDF. The topics addressed in these templates are Expenses, Manpower, Diesel, Recoverable. All the content presented in this PPT design is completely editable. Download it and make adjustments in color, background, font etc. as per your unique business setting.
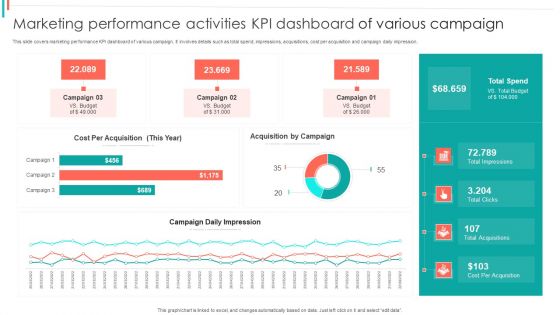
Marketing Performance Activities KPI Dashboard Of Various Campaign Microsoft PDF
This slide covers marketing performance KPI dashboard of various campaign. It involves details such as total spend, impressions, acquisitions, cost per acquisition and campaign daily impression.Showcasing this set of slides titled Marketing Performance Activities KPI Dashboard Of Various Campaign Microsoft PDF. The topics addressed in these templates are Acquisition Campaign, Campaign Impression, Total Impressions. All the content presented in this PPT design is completely editable. Download it and make adjustments in color, background, font etc. as per your unique business setting.
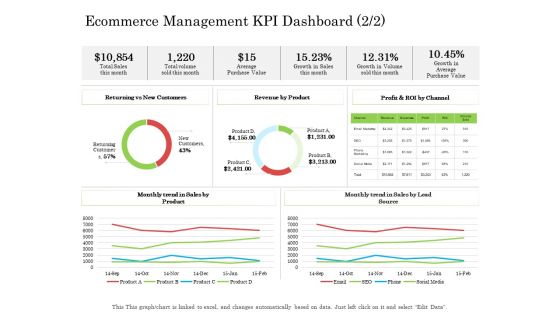
Ecommerce Management KPI Dashboard Ppt Styles Design Ideas PDF
Deliver and pitch your topic in the best possible manner with this ecommerce management kpi dashboard ppt styles design ideas pdf. Use them to share invaluable insights on average purchase value, revenue by product, sales by product and impress your audience. This template can be altered and modified as per your expectations. So, grab it now.
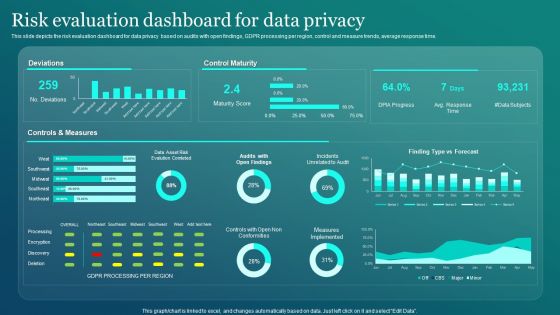
Information Security Risk Evaluation Dashboard For Data Privacy Introduction PDF
This slide depicts the risk evaluation dashboard for data privacy based on audits with open findings, GDPR processing per region, control and measure trends, average response time. There are so many reasons you need a Information Security Risk Evaluation Dashboard For Data Privacy Introduction PDF. The first reason is you can not spend time making everything from scratch, Thus, Slidegeeks has made presentation templates for you too. You can easily download these templates from our website easily.
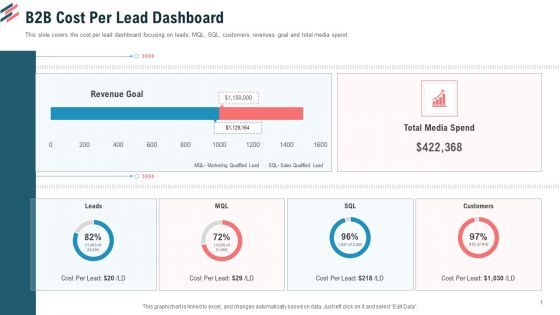
B2B Cost Per Lead Dashboard Ppt Gallery Themes PDF
This slide covers the cost per lead dashboard focusing on leads, MQL, SQL, customers, revenues goal and total media spend.Deliver and pitch your topic in the best possible manner with this B2B cost per lead dashboard ppt gallery themes pdf. Use them to share invaluable insights on revenue goal, total media spend and impress your audience. This template can be altered and modified as per your expectations. So, grab it now.
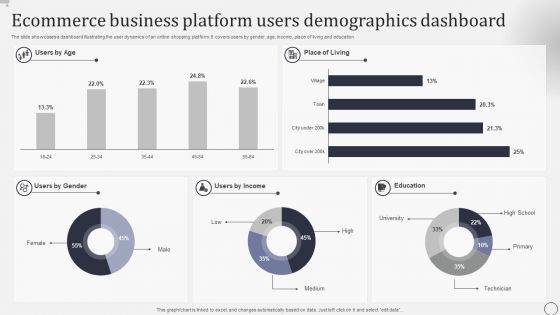
Ecommerce Business Platform Users Demographics Dashboard Rules PDF
The slide showcases a dashboard illustrating the user dynamics of an online shopping platform. It covers users by gender, age, income, place of living and education. Showcasing this set of slides titled Ecommerce Business Platform Users Demographics Dashboard Rules PDF.. The topics addressed in these templates are Users Gender, Users Income, Education. All the content presented in this PPT design is completely editable. Download it and make adjustments in color, background, font etc. as per your unique business setting.
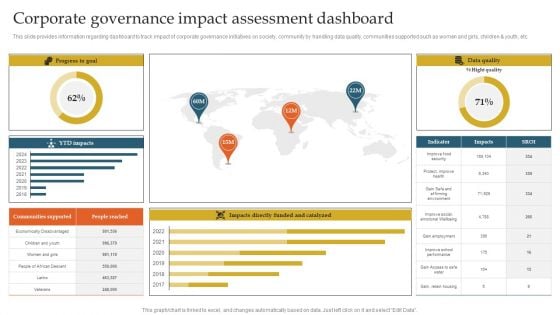
Corporate Governance Impact Assessment Dashboard Ppt Summary Guidelines PDF
This slide provides information regarding dashboard to track impact of corporate governance initiatives on society, community by handling data quality, communities supported such as women and girls, children and youth, etc. There are so many reasons you need a Corporate Governance Impact Assessment Dashboard Ppt Summary Guidelines PDF. The first reason is you can not spend time making everything from scratch, Thus, Slidegeeks has made presentation templates for you too. You can easily download these templates from our website easily.


 Continue with Email

 Home
Home


