Product Dashboard

Email Marketing Campaign Outcomes And Social Media Marketing Result Analysis Dashboard Mockup PDF
This slide depicts the dashboard for analyzing the results of email campaign and social media marketing. It includes information related to the comparison, statistics, usage, etc. Pitch your topic with ease and precision using this Email Marketing Campaign Outcomes And Social Media Marketing Result Analysis Dashboard Mockup PDF. This layout presents information on Email Marketing Campaign, Outcomes And Social Media, Marketing Result, Analysis Dashboard. It is also available for immediate download and adjustment. So, changes can be made in the color, design, graphics or any other component to create a unique layout.
Dashboard Matrix Showing Internet Of Things Advantages Ppt PowerPoint Presentation Icon Portfolio PDF
Showcasing this set of slides titled dashboard matrix showing internet of things advantages ppt powerpoint presentation icon portfolio pdf. The topics addressed in these templates are operational efficiency, team productivity, manufacturing capability. All the content presented in this PPT design is completely editable. Download it and make adjustments in color, background, font etc. as per your unique business setting.
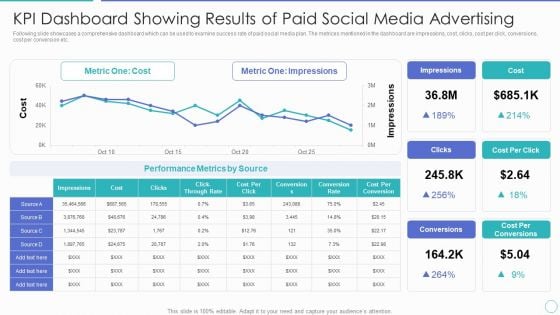
KPI Dashboard Showing Results Of Paid Social Media Advertising Ppt PowerPoint Presentation File Summary PDF
Following slide showcases a comprehensive dashboard which can be used to examine success rate of paid social media plan. The metrices mentioned in the dashboard are impressions, cost, clicks, cost per click, conversions, cost per conversion etc. Showcasing this set of slides titled kpi dashboard showing results of paid social media advertising ppt powerpoint presentation file summary pdf. The topics addressed in these templates are metric one cost, metric one impressions, performance metrics by source. All the content presented in this PPT design is completely editable. Download it and make adjustments in color, background, font etc. as per your unique business setting.
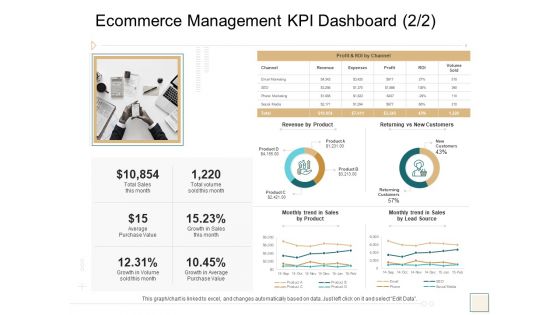
B2B Trade Management Ecommerce Management KPI Dashboard Returning Vs New Customers Brochure PDF
Deliver and pitch your topic in the best possible manner with this b2b trade management ecommerce management kpi dashboard returning vs new customers brochure pdf. Use them to share invaluable insights on profit and roi by channel, revenue product, returning vs new customers, revenue, expenses and impress your audience. This template can be altered and modified as per your expectations. So, grab it now.
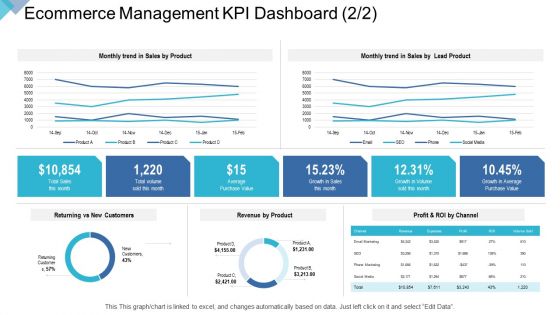
Digital Enterprise Management Ecommerce Management KPI Dashboard Average Ppt PowerPoint Presentation Summary Graphics PDF
Deliver an awe-inspiring pitch with this creative digital enterprise management ecommerce management kpi dashboard average ppt powerpoint presentation summary graphics pdf bundle. Topics like returning vs new customers, revenue by product, profit and roi by channel, returning customers can be discussed with this completely editable template. It is available for immediate download depending on the needs and requirements of the user.
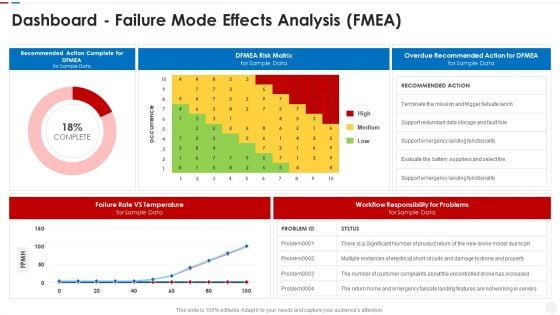
Failure Methods And Effects Assessments FMEA Dashboard Failure Mode Effects Analysis FMEA Microsoft PDF
Deliver and pitch your topic in the best possible manner with this failure methods and effects assessments fmea dashboard failure mode effects analysis fmea microsoft pdf. Use them to share invaluable insights on customer, product, risk matrix and impress your audience. This template can be altered and modified as per your expectations. So, grab it now.
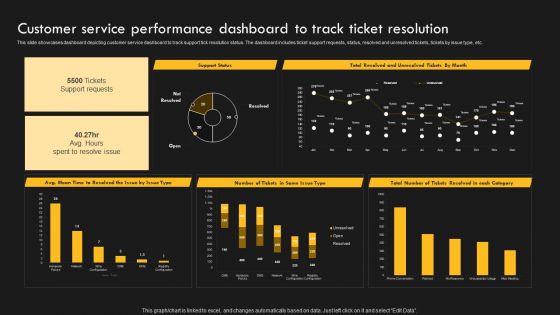
Service Improvement Techniques For Client Retention Customer Service Performance Dashboard Diagrams PDF
This slide showcases dashboard depicting customer service dashboard to track support tick resolution status. The dashboard includes ticket support requests, status, resolved and unresolved tickets, tickets by issue type, etc. Find highly impressive Service Improvement Techniques For Client Retention Customer Service Performance Dashboard Diagrams PDF on Slidegeeks to deliver a meaningful presentation. You can save an ample amount of time using these presentation templates. No need to worry to prepare everything from scratch because Slidegeeks experts have already done a huge research and work for you. You need to download Service Improvement Techniques For Client Retention Customer Service Performance Dashboard Diagrams PDF for your upcoming presentation. All the presentation templates are 100 percent editable and you can change the color and personalize the content accordingly. Download now.
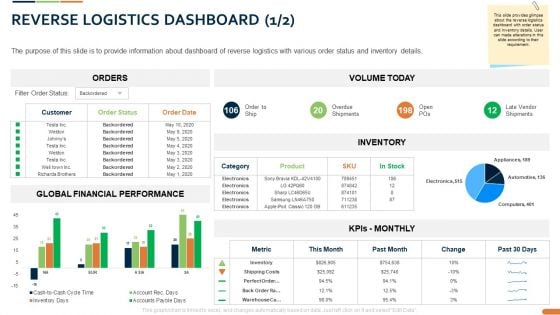
Closed Loop Supply Chain Management Reverse Logistics Dashboard Inventory Ppt Tips PDF
Presenting this set of slides with name closed loop supply chain management reverse logistics dashboard inventory ppt tips pdf. The topics discussed in these slides are customer, order status, order date, product, financial performance. This is a completely editable PowerPoint presentation and is available for immediate download. Download now and impress your audience.

Closed Loop Supply Chain Management Reverse Logistics Dashboard Ppt File Demonstration PDF
Presenting this set of slides with name closed loop supply chain management reverse logistics dashboard ppt file demonstration pdf. The topics discussed in these slides are sales, sales, order, need attention, product. This is a completely editable PowerPoint presentation and is available for immediate download. Download now and impress your audience.
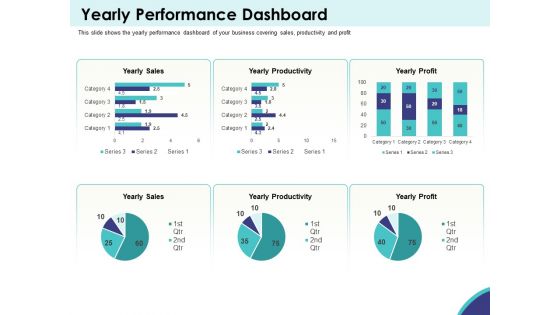
Expansion Oriented Strategic Plan Yearly Performance Dashboard Ppt PowerPoint Presentation Model Maker PDF
Presenting this set of slides with name expansion oriented strategic plan yearly performance dashboard ppt powerpoint presentation model maker pdf. The topics discussed in these slides are yearly sales, yearly productivity, yearly profit. This is a completely editable PowerPoint presentation and is available for immediate download. Download now and impress your audience.
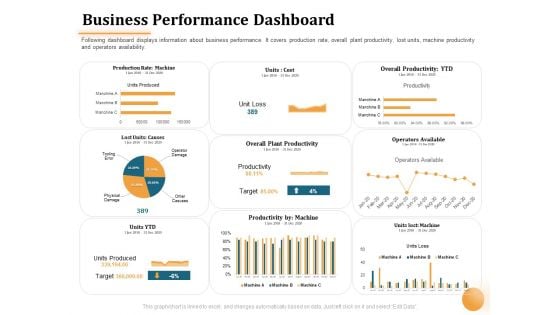
Project Portfolio Management PPM Business Performance Dashboard Ppt Layouts Design Inspiration PDF
Presenting this set of slides with name project portfolio management ppm business performance dashboard ppt layouts design inspiration pdf. The topics discussed in these slides are production, cost, target. This is a completely editable PowerPoint presentation and is available for immediate download. Download now and impress your audience.

Online Promotion Plan Dashboard With Total Traffic Visit Ppt Infographic Template Display PDF
Pitch your topic with ease and precision using this online promotion plan dashboard with total traffic visit ppt infographic template display pdf. This layout presents information on engagement, promotion, product. It is also available for immediate download and adjustment. So, changes can be made in the color, design, graphics or any other component to create a unique layout.
Driving Results Designing A Team Training And Development Program Tracking Dashboard
This slide depicts team development program tracking dashboard to analyze the impact of implementing training plan for the members. It includes training satisfaction rate, engagement score, drop-out rate and top 5 trainees. Take your projects to the next level with our ultimate collection of Driving Results Designing A Team Training And Development Program Tracking Dashboard. Slidegeeks has designed a range of layouts that are perfect for representing task or activity duration, keeping track of all your deadlines at a glance. Tailor these designs to your exact needs and give them a truly corporate look with your own brand colors they will make your projects stand out from the rest This slide depicts team development program tracking dashboard to analyze the impact of implementing training plan for the members. It includes training satisfaction rate, engagement score, drop-out rate and top 5 trainees.
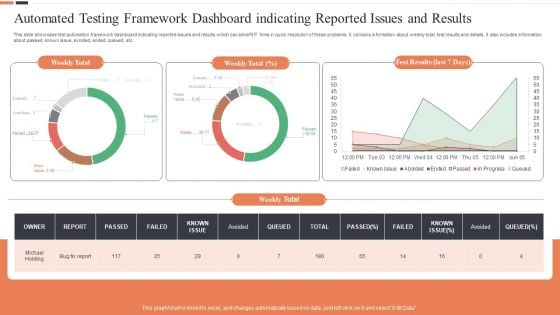
Automated Testing Framework Dashboard Indicating Reported Issues And Results Ideas PDF
This slide showcase test automation framework dashboard indicating reported issues and results which can benefit IT firms in quick resolution of these problems. It contains information about weekly total, test results and details. It also includes information about passed, known issue, avoided, ended, queued, etc. Showcasing this set of slides titled Automated Testing Framework Dashboard Indicating Reported Issues And Results Ideas PDF. The topics addressed in these templates are Weekly Total, Test Results, Last 7 Days. All the content presented in this PPT design is completely editable. Download it and make adjustments in color, background, font etc. as per your unique business setting.
Business Performance Monitoring And Business Goals Update Dashboard Icon Template PDF
Persuade your audience using this business performance monitoring and business goals update dashboard icon template pdf. This PPT design covers three stages, thus making it a great tool to use. It also caters to a variety of topics including business performance monitoring and business goals update dashboard icon. Download this PPT design now to present a convincing pitch that not only emphasizes the topic but also showcases your presentation skills.
Tracking Customer Sales Funnel Dashboard Strategies To Manage Sales Funnel Summary Pdf
This slide covers information regarding the customer sales funnel tracking with sales volume and total market. Boost your pitch with our creative Tracking Customer Sales Funnel Dashboard Strategies To Manage Sales Funnel Summary Pdf. Deliver an awe-inspiring pitch that will mesmerize everyone. Using these presentation templates you will surely catch everyones attention. You can browse the ppts collection on our website. We have researchers who are experts at creating the right content for the templates. So you do not have to invest time in any additional work. Just grab the template now and use them. This slide covers information regarding the customer sales funnel tracking with sales volume and total market.
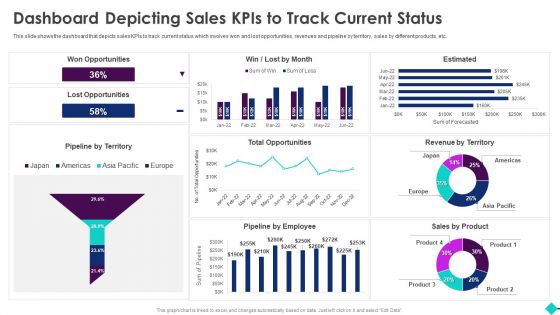
Sales Process Automation For Revenue Growth Dashboard Depicting Sales Kpis To Track Current Status Introduction PDF
This slide shows the dashboard that depicts sales KPIs to track current status which involves won and lost opportunities, revenues and pipeline by territory, sales by different products, etc.Deliver and pitch your topic in the best possible manner with this Sales Process Automation For Revenue Growth Dashboard Depicting Sales Kpis To Track Current Status Introduction PDF. Use them to share invaluable insights on Marketing Effectiveness, Forecast Accuracy, Pipeline Thickness and impress your audience. This template can be altered and modified as per your expectations. So, grab it now.
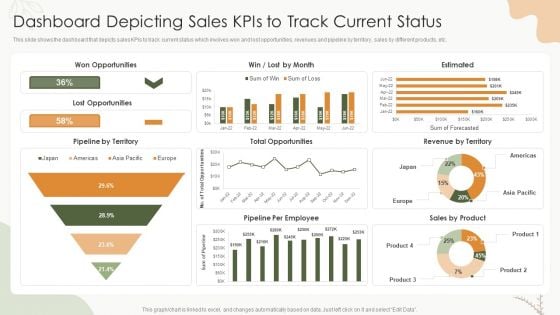
Sales Procedure Automation To Enhance Sales Dashboard Depicting Sales Kpis To Track Current Status Introduction PDF
This slide shows the dashboard that depicts sales KPIs to track current status which involves won and lost opportunities, revenues and pipeline by territory, sales by different products, etc.Deliver an awe inspiring pitch with this creative Sales Procedure Automation To Enhance Sales Dashboard Depicting Sales Kpis To Track Current Status Introduction PDF bundle. Topics like Won Opportunities, Total Opportunities, Pipeline Employee can be discussed with this completely editable template. It is available for immediate download depending on the needs and requirements of the user.
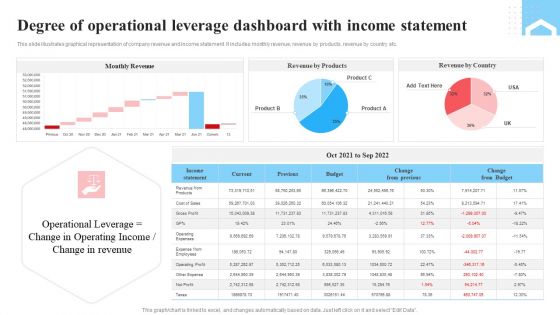
Degree Of Operational Leverage Dashboard With Income Statement Ppt Infographics Layout PDF
This slide illustrates graphical representation of company revenue and income statement. It includes monthly revenue, revenue by products, revenue by country etc. Pitch your topic with ease and precision using this Degree Of Operational Leverage Dashboard With Income Statement Ppt Infographics Layout PDF. This layout presents information on Monthly Revenue, Income Statement, Product. It is also available for immediate download and adjustment. So, changes can be made in the color, design, graphics or any other component to create a unique layout.
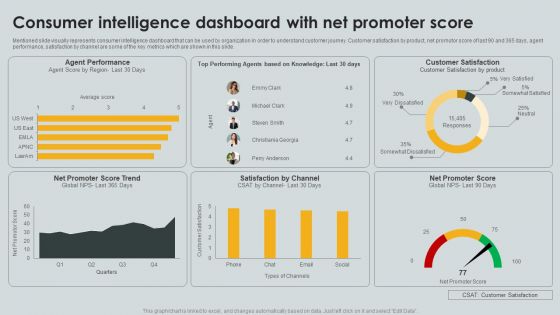
Consumer Intelligence Dashboard With Net Promoter Score Ppt PowerPoint Presentation File Templates PDF
Mentioned slide visually represents consumer intelligence dashboard that can be used by organization in order to understand customer journey. Customer satisfaction by product, net promotor score of last 90 and 365 days, agent performance, satisfaction by channel are some of the key metrics which are shown in this slide. Showcasing this set of slides titled Consumer Intelligence Dashboard With Net Promoter Score Ppt PowerPoint Presentation File Templates PDF. The topics addressed in these templates are Agent Performance, Satisfaction Channel, Net Promoter. All the content presented in this PPT design is completely editable. Download it and make adjustments in color, background, font etc. as per your unique business setting.
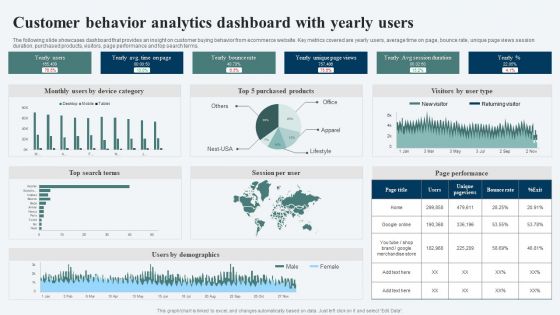
Customer Behavior Analytics Dashboard With Yearly Users Ppt Portfolio Ideas PDF
The following slide showcases dashboard that provides an insight on customer buying behavior from ecommerce website. Key metrics covered are yearly users, average time on page, bounce rate, unique page views session duration, purchased products, visitors, page performance and top search terms. Showcasing this set of slides titled Customer Behavior Analytics Dashboard With Yearly Users Ppt Portfolio Ideas PDF. The topics addressed in these templates are Yearly Users, Yearly Bounce Rate, Top Search Terms. All the content presented in this PPT design is completely editable. Download it and make adjustments in color, background, font etc. as per your unique business setting.
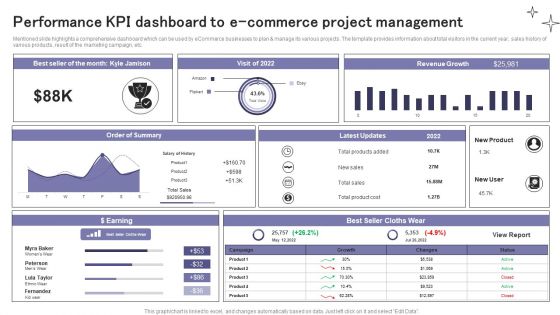
Performance KPI Dashboard To E Commerce Project Management Ppt Summary Inspiration PDF
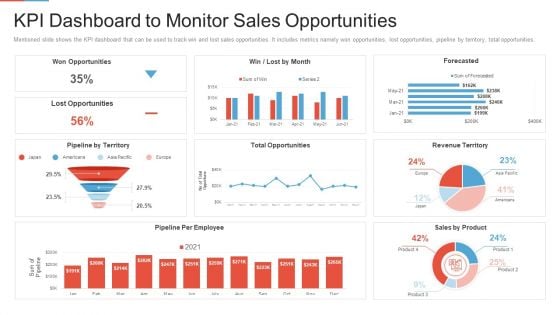
Marketing Outlining Segmentation Initiatives Kpi Dashboard To Monitor Sales Opportunities Information PDF
Mentioned slide shows the KPI dashboard that can be used to track win and lost sales opportunities. It includes metrics namely won opportunities, lost opportunities, pipeline by territory, total opportunities. Deliver an awe inspiring pitch with this creative marketing outlining segmentation initiatives kpi dashboard to monitor sales opportunities information pdf bundle. Topics like opportunities, pipeline by territory, revenue territory, sales by product, pipeline per employee can be discussed with this completely editable template. It is available for immediate download depending on the needs and requirements of the user.
Guide For Software Developers KPI Dashboard For Tracking Project Team Performance Guidelines PDF
Following slide illustrates performance monitoring dashboard that can be used by managers to track their developers team efficiency. It also includes details about billable and non-billable hours along with task summary. Deliver an awe inspiring pitch with this creative guide for software developers kpi dashboard for tracking project team performance guidelines pdf bundle. Topics like task milestone, employee productivity, estimated time, actual time can be discussed with this completely editable template. It is available for immediate download depending on the needs and requirements of the user.
Software Developer Playbook Kpi Dashboard For Tracking Project Team Performance Guidelines PDF
Following slide illustrates performance monitoring dashboard that can be used by managers to track their developers team efficiency. It also includes details about billable and non-billable hours along with task summary. Deliver an awe inspiring pitch with this creative software developer playbook kpi dashboard for tracking project team performance guidelines pdf bundle. Topics like task milestone, employee productivity, estimated time, actual time can be discussed with this completely editable template. It is available for immediate download depending on the needs and requirements of the user.
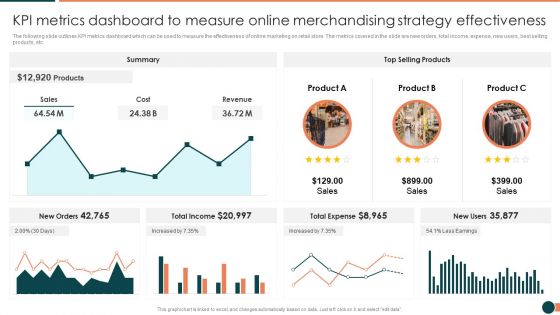
Developing Retail Marketing Strategies To Increase Revenue KPI Metrics Dashboard To Measure Online Portrait PDF
The following slide outlines KPI metrics dashboard which can be used to measure the effectiveness of online marketing on retail store. The metrics covered in the slide are new orders, total income, expense, new users, best selling products, etc.Deliver and pitch your topic in the best possible manner with this Developing Retail Marketing Strategies To Increase Revenue KPI Metrics Dashboard To Measure Online Portrait PDF Use them to share invaluable insights on Total Income, Total Expense, Summary and impress your audience. This template can be altered and modified as per your expectations. So, grab it now.
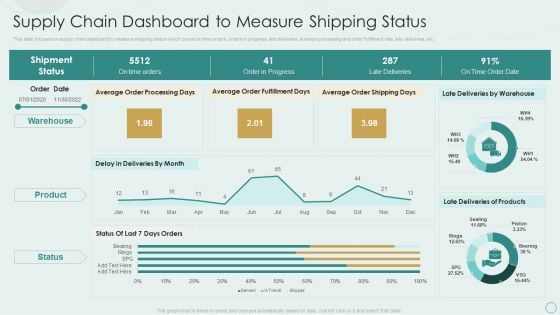
Learning Various Supply Chain Models Supply Chain Dashboard To Measure Shipping Status Graphics PDF
This slide focuses on supply chain dashboard to measure shipping status which covers on time orders, orders in progress, late deliveries, average processing and order fulfillment rate, late deliveries, etc. Deliver and pitch your topic in the best possible manner with this Learning Various Supply Chain Models Supply Chain Dashboard To Measure Shipping Status Graphics PDF. Use them to share invaluable insights on Warehouse, Product, Late Deliveries, On Time Orders and impress your audience. This template can be altered and modified as per your expectations. So, grab it now.
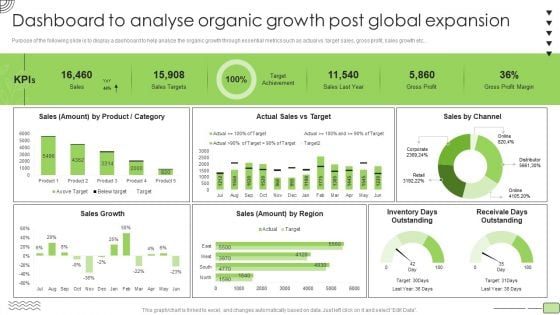
Organic Business Growth Strategies Dashboard To Analyse Organic Growth Post Global Expansion Background PDF
Purpose of the following slide is to display a dashboard to help analyze the organic growth through essential metrics such as actual vs. target sales, gross profit, sales growth etc. Deliver and pitch your topic in the best possible manner with this Organic Business Growth Strategies Dashboard To Analyse Organic Growth Post Global Expansion Background PDF. Use them to share invaluable insights on Sales, Product, Target and impress your audience. This template can be altered and modified as per your expectations. So, grab it now.
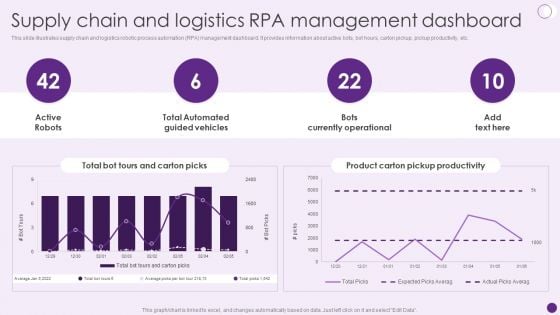
Supply Chain And Logistics Rpa Management Dashboard Deploying Automation To Enhance Diagrams PDF
This slide illustrates supply chain and logistics robotic process automation RPA management dashboard. It provides information about active bots, bot hours, carton pickup, pickup productivity, etc. Boost your pitch with our creative Supply Chain And Logistics Rpa Management Dashboard Deploying Automation To Enhance Diagrams PDF. Deliver an awe-inspiring pitch that will mesmerize everyone. Using these presentation templates you will surely catch everyones attention. You can browse the ppts collection on our website. We have researchers who are experts at creating the right content for the templates. So you do not have to invest time in any additional work. Just grab the template now and use them.
B2B Marketing Content Administration Playbook Sales Management Activities Tracking Dashboard Brochure PDF
This slide provides information regarding sales meeting plan playing vital role in sales operation effectiveness, motivating sales team and improve overall productivity.Presenting b2b marketing content administration playbook sales management activities tracking dashboard brochure pdf to provide visual cues and insights. Share and navigate important information on three stages that need your due attention. This template can be used to pitch topics like sales management activities tracking dashboard In addtion, this PPT design contains high resolution images, graphics, etc, that are easily editable and available for immediate download.
Workforce Engagement And Communication Dashboard With Net Promoter Score Icons PDF
The following slide displays KPI dashboard to keep track of workforce engagement and communication at workplace to help company increase employee productivity. It includes elements such as monthly score, passive, promoters, detractors, etc. Showcasing this set of slides titled Workforce Engagement And Communication Dashboard With Net Promoter Score Icons PDF. The topics addressed in these templates are Participation Rate, Engagement Score, Overall Score. All the content presented in this PPT design is completely editable. Download it and make adjustments in color, background, font etc. as per your unique business setting.
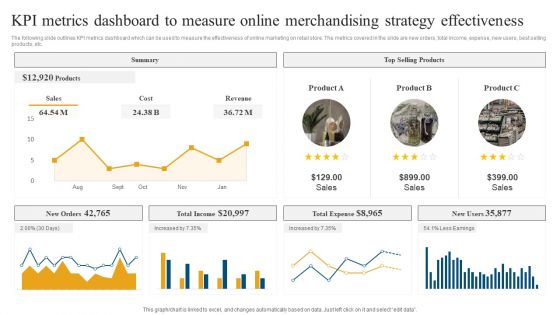
Retail Ecommerce Merchandising Tactics For Boosting Revenue KPI Metrics Dashboard To Measure Online Background PDF
The following slide outlines KPI metrics dashboard which can be used to measure the effectiveness of online marketing on retail store. The metrics covered in the slide are new orders, total income, expense, new users, best selling products, etc. Make sure to capture your audiences attention in your business displays with our gratis customizable Retail Ecommerce Merchandising Tactics For Boosting Revenue KPI Metrics Dashboard To Measure Online Background PDF. These are great for business strategies, office conferences, capital raising or task suggestions. If you desire to acquire more customers for your tech business and ensure they stay satisfied, create your own sales presentation with these plain slides.
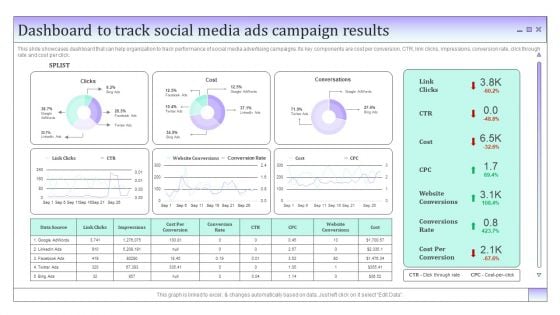
Business To Business Social Dashboard To Track Social Media Ads Campaign Results Demonstration PDF
This slide showcases dashboard that can help organization to track performance of social media advertising campaigns. Its key components are cost per conversion, CTR, link clicks, impressions, conversion rate, click through rate and cost per click. Presenting this PowerPoint presentation, titled Business To Business Social Dashboard To Track Social Media Ads Campaign Results Demonstration PDF, with topics curated by our researchers after extensive research. This editable presentation is available for immediate download and provides attractive features when used. Download now and captivate your audience. Presenting this Business To Business Social Dashboard To Track Social Media Ads Campaign Results Demonstration PDF. Our researchers have carefully researched and created these slides with all aspects taken into consideration. This is a completely customizable Business To Business Social Dashboard To Track Social Media Ads Campaign Results Demonstration PDF that is available for immediate downloading. Download now and make an impact on your audience. Highlight the attractive features available with our PPTs.
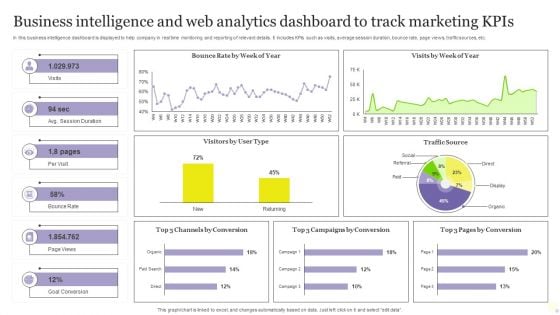
Business Intelligence And Web Analytics Dashboard To Track Marketing Kpis Inspiration PDF
In this business intelligence dashboard is displayed to help company in real time monitoring and reporting of relevant details. It includes KPIs such as visits, average session duration, bounce rate, page views, traffic sources, etc. Showcasing this set of slides titled Business Intelligence And Web Analytics Dashboard To Track Marketing Kpis Inspiration PDF. The topics addressed in these templates are Goal Conversion, Track Marketing Kpis, Web Analytics Dashboard. All the content presented in this PPT design is completely editable. Download it and make adjustments in color, background, font etc. as per your unique business setting.
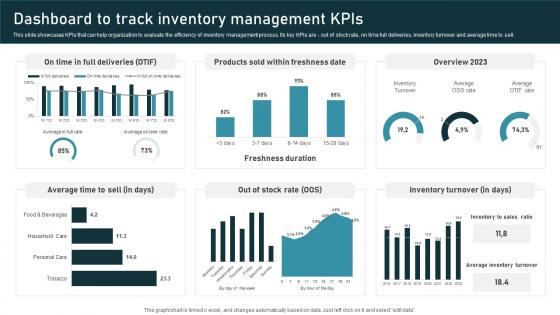
Dashboard To Track Inventory Administration Techniques For Enhanced Stock Accuracy Structure Pdf
This slide showcases KPIs that can help organization to evaluate the efficiency of inventory management process. Its key KPIs are out of stock rate, on time full deliveries, inventory turnover and average time to sell. Whether you have daily or monthly meetings, a brilliant presentation is necessary. Dashboard To Track Inventory Administration Techniques For Enhanced Stock Accuracy Structure Pdf can be your best option for delivering a presentation. Represent everything in detail using Dashboard To Track Inventory Administration Techniques For Enhanced Stock Accuracy Structure Pdf and make yourself stand out in meetings. The template is versatile and follows a structure that will cater to your requirements. All the templates prepared by Slidegeeks are easy to download and edit. Our research experts have taken care of the corporate themes as well. So, give it a try and see the results. This slide showcases KPIs that can help organization to evaluate the efficiency of inventory management process. Its key KPIs are out of stock rate, on time full deliveries, inventory turnover and average time to sell.
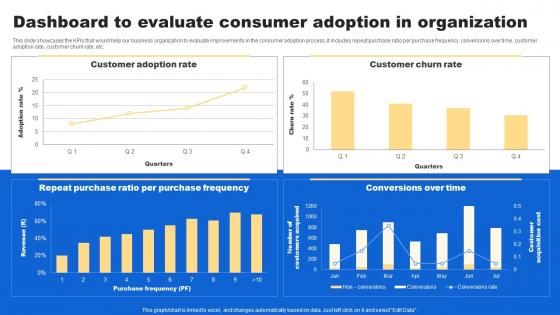
Dashboard To Evaluate Consumer Analyzing Customer Buying Behavior Enhance Conversion Inspiration Pdf
This slide showcases the KPIs that would help our business organization to evaluate improvements in the consumer adoption process. It includes repeat purchase ratio per purchase frequency, conversions over time, customer adoption rate, customer churn rate, etc. Whether you have daily or monthly meetings, a brilliant presentation is necessary. Dashboard To Evaluate Consumer Analyzing Customer Buying Behavior Enhance Conversion Inspiration Pdf can be your best option for delivering a presentation. Represent everything in detail using Dashboard To Evaluate Consumer Analyzing Customer Buying Behavior Enhance Conversion Inspiration Pdf and make yourself stand out in meetings. The template is versatile and follows a structure that will cater to your requirements. All the templates prepared by Slidegeeks are easy to download and edit. Our research experts have taken care of the corporate themes as well. So, give it a try and see the results. This slide showcases the KPIs that would help our business organization to evaluate improvements in the consumer adoption process. It includes repeat purchase ratio per purchase frequency, conversions over time, customer adoption rate, customer churn rate, etc.
Dashboard For Tracking Viral Implementing Social Media Tactics For Boosting WOM Professional Pdf
This slide showcases the parameters for business organizations to evaluate viral marketing performance. It includes KPIs such as user metrics, campaign metrics, social metrics, engagement rate, viral sign ups, etc. Whether you have daily or monthly meetings, a brilliant presentation is necessary. Dashboard For Tracking Viral Implementing Social Media Tactics For Boosting WOM Professional Pdf can be your best option for delivering a presentation. Represent everything in detail using Dashboard For Tracking Viral Implementing Social Media Tactics For Boosting WOM Professional Pdf and make yourself stand out in meetings. The template is versatile and follows a structure that will cater to your requirements. All the templates prepared by Slidegeeks are easy to download and edit. Our research experts have taken care of the corporate themes as well. So, give it a try and see the results. This slide showcases the parameters for business organizations to evaluate viral marketing performance. It includes KPIs such as user metrics, campaign metrics, social metrics, engagement rate, viral sign ups, etc.
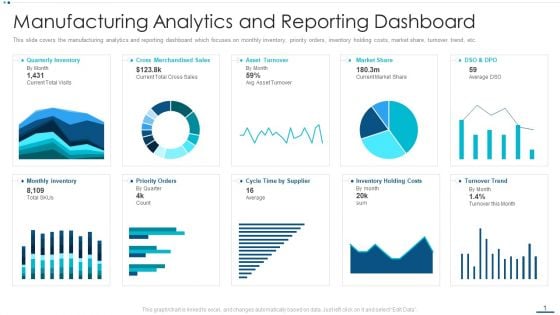
Strategic B2B Marketing Plan Manufacturing Analytics And Reporting Dashboard Rules PDF
This slide covers the manufacturing analytics and reporting dashboard which focuses on monthly inventory, priority orders, inventory holding costs, market share, turnover trend, etc.Deliver and pitch your topic in the best possible manner with this strategic b2b marketing plan manufacturing analytics and reporting dashboard rules pdf Use them to share invaluable insights on quarterly inventory, monthly inventory, cross merchandised sales and impress your audience. This template can be altered and modified as per your expectations. So, grab it now.
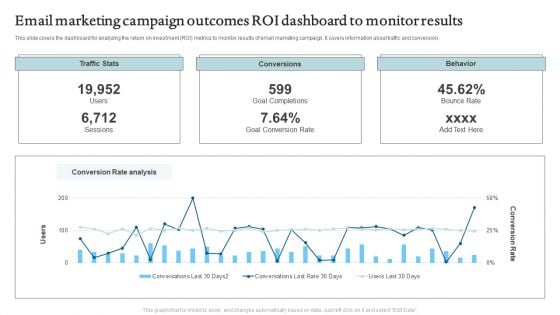
Email Marketing Campaign Outcomes ROI Dashboard To Monitor Results Formats PDF
This slide depicts the dashboard for analyzing the marketing results and campaign performance. It includes information related email sent, delivered, conversions, etc. Pitch your topic with ease and precision using this Email Marketing Campaign Outcomes ROI Dashboard To Monitor Results Formats PDF. This layout presents information on Traffic Stats, Conversions, Behavior. It is also available for immediate download and adjustment. So, changes can be made in the color, design, graphics or any other component to create a unique layout.
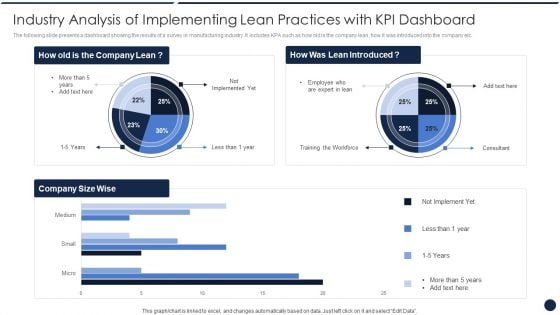
Industry Analysis Of Implementing Lean Practices With KPI Dashboard Sample PDF
The following slide presents a dashboard showing the results of a survey in manufacturing industry. It includes KPA such as how old is the company lean, how it was introduced into the company etc. Showcasing this set of slides titled Industry Analysis Of Implementing Lean Practices With KPI Dashboard Sample PDF The topics addressed in these templates are Industry Analysis, Implementing Lean, Practices With KPI Dashboard All the content presented in this PPT design is completely editable. Download it and make adjustments in color, background, font etc. as per your unique business setting.
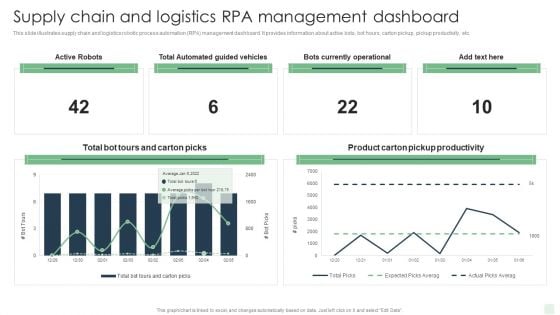
Supply Chain And Logistics Rpa Management Dashboard Automated Manufacturing Process Deployment Ideas PDF
This slide illustrates supply chain and logistics robotic process automation RPA management dashboard. It provides information about active bots, bot hours, carton pickup, pickup productivity, etc.Explore a selection of the finest Supply Chain And Logistics Rpa Management Dashboard Automated Manufacturing Process Deployment Ideas PDF here. With a plethora of professionally designed and pre-made slide templates, you can quickly and easily find the right one for your upcoming presentation. You can use our Supply Chain And Logistics Rpa Management Dashboard Automated Manufacturing Process Deployment Ideas PDF to effectively convey your message to a wider audience. Slidegeeks has done a lot of research before preparing these presentation templates. The content can be personalized and the slides are highly editable. Grab templates today from Slidegeeks.
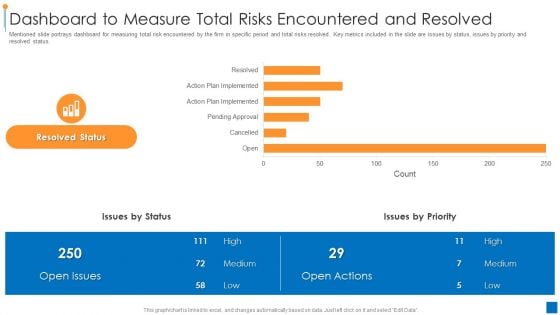
International Organization Standardization 270001 Dashboard To Measure Total Risks Encountered And Resolved Demonstration PDF
Mentioned slide portrays dashboard for measuring total risk encountered by the firm in specific period and total risks resolved. Key metrics included in the slide are issues by status, issues by priority and resolved status. Deliver and pitch your topic in the best possible manner with this international organization standardization 270001 dashboard to measure total risks encountered and resolved demonstration pdf. Use them to share invaluable insights on dashboard to measure total risks encountered and resolved and impress your audience. This template can be altered and modified as per your expectations. So, grab it now.
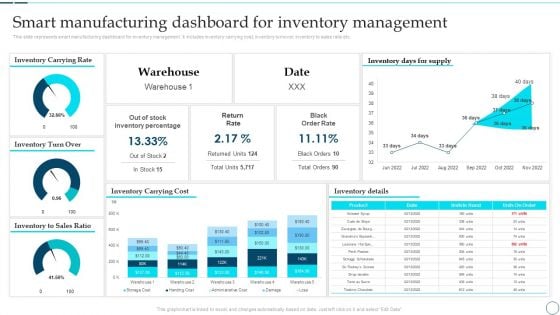
Deployment Of Smart Factory Solutions Smart Manufacturing Dashboard For Inventory Management Designs PDF
This slide represents smart manufacturing dashboard for inventory management. It includes inventory carrying cost, inventory turnover, inventory to sales ratio etc. Deliver an awe inspiring pitch with this creative Deployment Of Smart Factory Solutions Smart Manufacturing Dashboard For Inventory Management Designs PDF bundle. Topics like Inventory Carrying Cost, Warehouse, Inventory Turn Over can be discussed with this completely editable template. It is available for immediate download depending on the needs and requirements of the user.
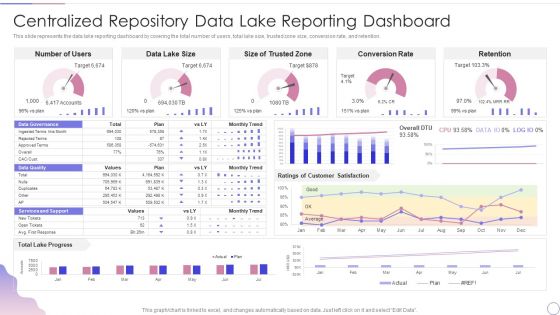
Data Lake Architecture Future Of Data Analysis Centralized Repository Data Lake Reporting Dashboard Elements PDF
This slide represents the data lake reporting dashboard by covering the total number of users, total lake size, trusted zone size, conversion rate, and retention.Deliver an awe inspiring pitch with this creative Data Lake Architecture Future Of Data Analysis Centralized Repository Data Lake Reporting Dashboard Elements PDF bundle. Topics like Data Governance, Conversion Rate, Retention can be discussed with this completely editable template. It is available for immediate download depending on the needs and requirements of the user.
Professional Scrum Master Training IT Risk Monitoring Dashboard For Software Development Projects Icons PDF
Following slide displays risk monitoring KPI dashboard that can be used by a firm to track multiple risk events. Metrics covered in the dashboard are residual risk by period and category by total risk rating. Deliver an awe inspiring pitch with this creative professional scrum master training it risk monitoring dashboard for software development projects icons pdf bundle. Topics like financial risk, people risk, governance risk, competitive risk, system or technology can be discussed with this completely editable template. It is available for immediate download depending on the needs and requirements of the user.
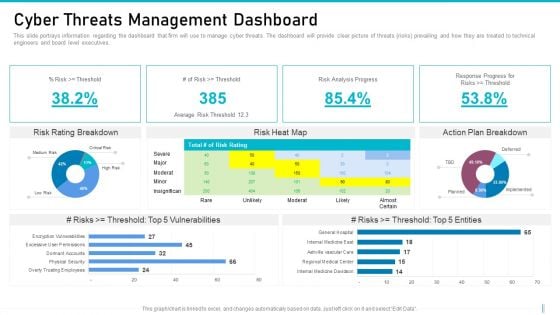
Risk Management For Organization Essential Assets Cyber Threats Management Dashboard Graphics PDF
This slide portrays information regarding the dashboard that firm will use to manage cyber threats. The dashboard will provide clear picture of threats risks prevailing and how they are treated to technical engineers and board level executives. Deliver and pitch your topic in the best possible manner with this risk management for organization essential assets cyber threats management dashboard graphics pdf. Use them to share invaluable insights on risk analysis, vulnerabilities, entities and impress your audience. This template can be altered and modified as per your expectations. So, grab it now.
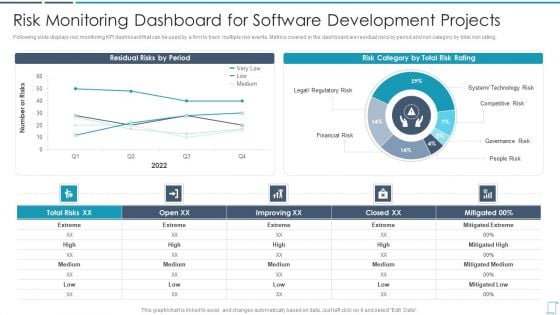
Professional Scrum Master Certification Training Program IT Risk Monitoring Dashboard Background PDF
Following slide displays risk monitoring KPI dashboard that can be used by a firm to track multiple risk events. Metrics covered in the dashboard are residual risks by period and risk category by total risk rating.Deliver an awe inspiring pitch with this creative professional scrum master certification training program it risk monitoring dashboard background pdf bundle. Topics like competitive risk, governance risk, people risk can be discussed with this completely editable template. It is available for immediate download depending on the needs and requirements of the user.
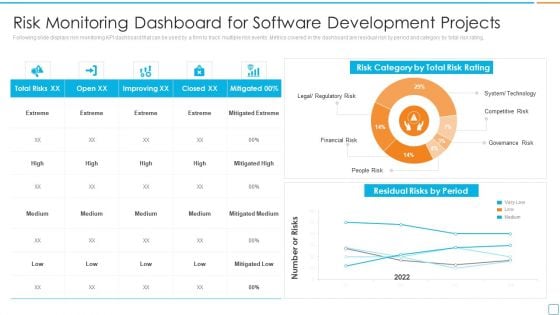
Professional Scrum Master Certification Risk Monitoring Dashboard For Software Development Portrait PDF
Following slide displays risk monitoring KPI dashboard that can be used by a firm to track multiple risk events. Metrics covered in the dashboard are residual risk by period and category by total risk rating. Deliver an awe inspiring pitch with this creative professional scrum master certification risk monitoring dashboard for software development portrait pdf bundle. Topics like residual risks by period, risk category, total risk rating can be discussed with this completely editable template. It is available for immediate download depending on the needs and requirements of the user.
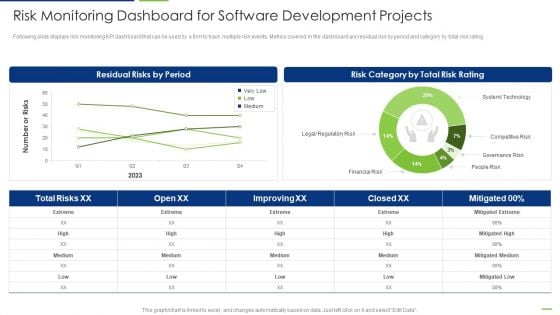
Professional Scrum Master Risk Monitoring Dashboard For Software Development Projects Designs PDF
Following slide displays risk monitoring KPI dashboard that can be used by a firm to track multiple risk events. Metrics covered in the dashboard are residual risk by period and category by total risk rating. Deliver an awe inspiring pitch with this creative Professional Scrum Master Risk Monitoring Dashboard For Software Development Projects Designs PDF bundle. Topics like Residual Risks By Period, Risk Category By Total Risk Rating, Total Risks can be discussed with this completely editable template. It is available for immediate download depending on the needs and requirements of the user.
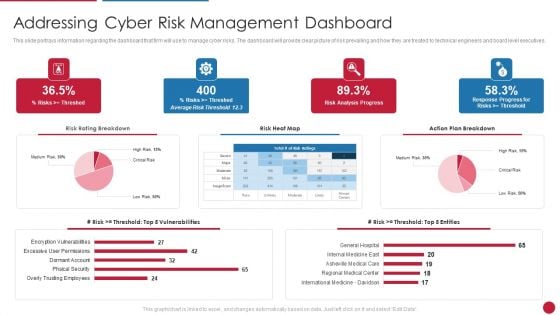
Facilitating IT Intelligence Architecture Addressing Cyber Risk Management Dashboard Professional PDF
This slide portrays information regarding the dashboard that firm will use to manage cyber risks. The dashboard will provide clear picture of risk prevailing and how they are treated to technical engineers and board level executives.Deliver and pitch your topic in the best possible manner with this Facilitating IT Intelligence Architecture Addressing Cyber Risk Management Dashboard Professional PDF Use them to share invaluable insights on International Medicine Davidson, Regional Medical Center, Asheville Medical Care and impress your audience. This template can be altered and modified as per your expectations. So, grab it now.
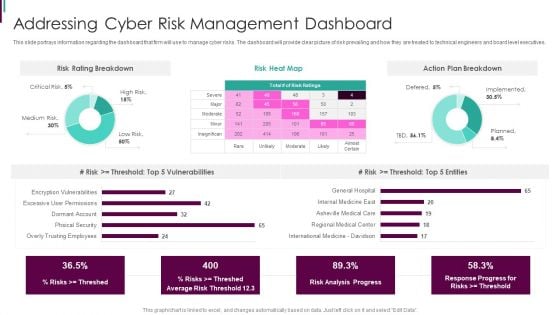
Developing Business Analytics Framework Addressing Cyber Risk Management Dashboard Graphics PDF
This slide portrays information regarding the dashboard that firm will use to manage cyber risks. The dashboard will provide clear picture of risk prevailing and how they are treated to technical engineers and board level executives.Deliver and pitch your topic in the best possible manner with this Developing Business Analytics Framework Addressing Cyber Risk Management Dashboard Graphics PDF Use them to share invaluable insights on Risk Breakdown, Action Breakdown, Vulnerabilities and impress your audience. This template can be altered and modified as per your expectations. So, grab it now.
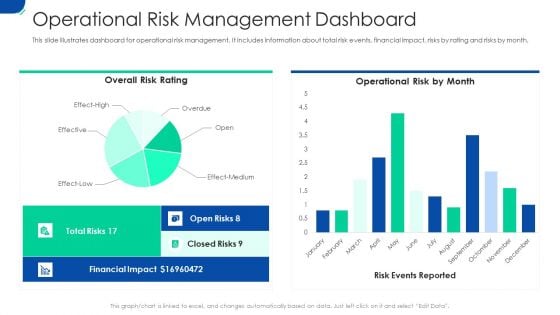
Initiating Hazard Managing Structure Firm Operational Risk Management Dashboard Brochure PDF
This slide illustrates dashboard for operational risk management. It includes information about total risk events, financial impact, risks by rating and risks by month. Deliver an awe-inspiring pitch with this creative initiating hazard managing structure firm operational risk management dashboard brochure pdf bundle. Topics like financial impact, operational risk, risk events, risk rating can be discussed with this completely editable template. It is available for immediate download depending on the needs and requirements of the user.
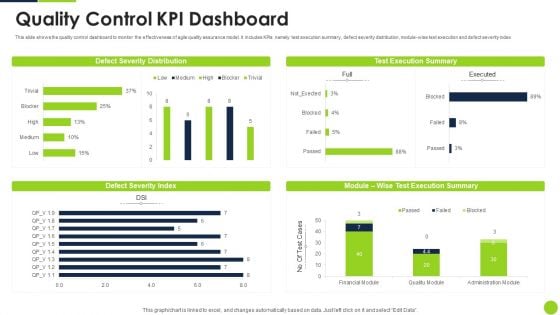
Agile Methodology Quality Control Quality Control KPI Dashboard Ppt Infographic Template Layout Ideas PDF
This slide shows the quality control dashboard to monitor the effectiveness of agile quality assurance model. It includes KPIs namely test execution summary, defect severity distribution, module-wise text execution and defect severity index Deliver an awe inspiring pitch with this creative agile methodology quality control quality control kpi dashboard ppt infographic template layout ideas pdf bundle. Topics like quality control kpi dashboard can be discussed with this completely editable template. It is available for immediate download depending on the needs and requirements of the user.
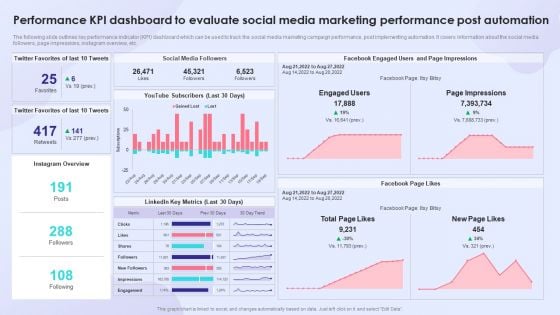
Performance KPI Dashboard To Evaluate Social Media Marketing Performance Post Automation Themes PDF
The following slide outlines key performance indicator KPI dashboard which can be used to track the social media marketing campaign performance, post implementing automation. It covers information about the social media followers, page impressions, instagram overview, etc. Deliver and pitch your topic in the best possible manner with this Performance KPI Dashboard To Evaluate Social Media Marketing Performance Post Automation Themes PDF. Use them to share invaluable insights on Social Media Followers, Linkedin Key Metrics, Performance KPI Dashboard and impress your audience. This template can be altered and modified as per your expectations. So, grab it now.
Procurement Kpi Dashboard For Tracking Supplier Action Plan Impact Graphics PDF
This slide covers procurement spend analysis dashboard for tracking new supplier strategy results. It include KPIs such as invoice count, invoices information, due dates, spend by payment terms, supplier payment terms, spend by entity, spend by category, spend by country. Showcasing this set of slides titled procurement kpi dashboard for tracking supplier action plan impact graphics pdf. The topics addressed in these templates are procurement kpi dashboard for tracking supplier action plan impact. All the content presented in this PPT design is completely editable. Download it and make adjustments in color, background, font etc. as per your unique business setting.
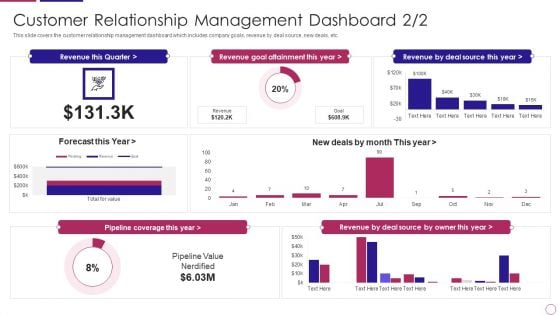
PRM To Streamline Business Processes Customer Relationship Management Dashboard Goal Pictures PDF
This slide covers the customer relationship management dashboard which includes company goals, revenue by deal source, new deals, etc. Deliver an awe inspiring pitch with this creative prm to streamline business processes customer relationship management dashboard goal pictures pdf bundle. Topics like revenue goal attainment, revenue by deal source, revenue by deal source by owner, pipeline coverage can be discussed with this completely editable template. It is available for immediate download depending on the needs and requirements of the user.
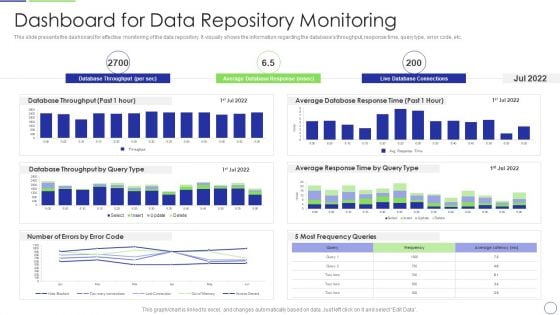
Developing Organization Primary Data Storage Action Plan Dashboard For Data Repository Monitoring Information PDF
This slide presents the dashboard for effective monitoring of the data repository. It visually shows the information regarding the databases throughput, response time, query type, error code, etc. Deliver and pitch your topic in the best possible manner with this developing organization primary data storage action plan dashboard for data repository monitoring information pdf. Use them to share invaluable insights on dashboard for data repository monitoring and impress your audience. This template can be altered and modified as per your expectations. So, grab it now.
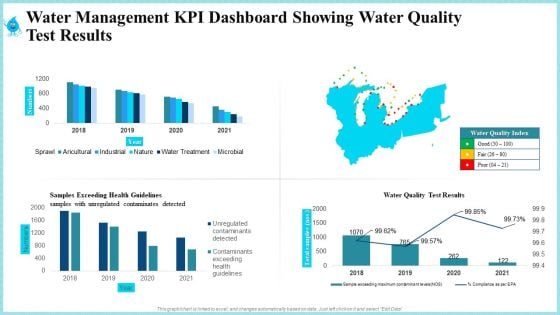
Water Management KPI Dashboard Showing Water Quality Test Results Topics PDF
Deliver and pitch your topic in the best possible manner with this water management KPI dashboard showing water quality test results topics pdf. Use them to share invaluable insights on samples exceeding health guidelines, water quality test results, 2018 to 2021 and impress your audience. This template can be altered and modified as per your expectations. So, grab it now.
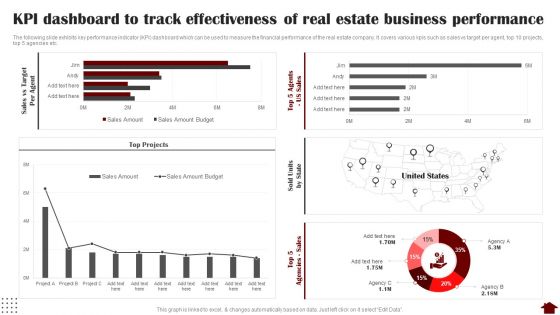
KPI Dashboard To Track Effectiveness Of Real Estate Business Performance Slides PDF
The following slide exhibits key performance indicator KPI dashboard which can be used to measure the financial performance of the real estate company. It covers various kpis such as sales vs target per agent, top 10 projects, top 5 agencies etc. Deliver an awe inspiring pitch with this creative KPI Dashboard To Track Effectiveness Of Real Estate Business Performance Slides PDF bundle. Topics like KPI Dashboard, Track Effectiveness, Real Estate Business Performance can be discussed with this completely editable template. It is available for immediate download depending on the needs and requirements of the user.
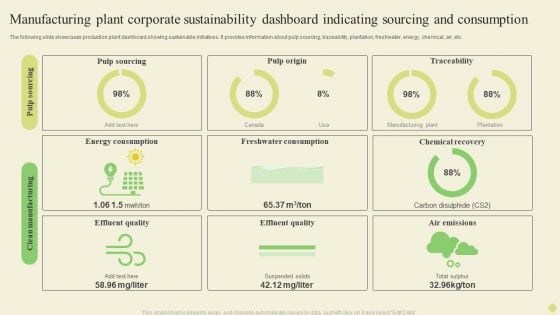
Manufacturing Plant Corporate Sustainability Dashboard Indicating Sourcing And Consumption Infographics PDF
The following slide showcases business sustainability dashboard highlighting multiple sources of technology. It provides information about renewable energy, plant age, solar, wind, biomass, regionality, etc.Pitch your topic with ease and precision using this Manufacturing Plant Corporate Sustainability Dashboard Indicating Sourcing And Consumption Infographics PDF. This layout presents information on Energy Consumption, Freshwater Consumption, Chemical Recovery. It is also available for immediate download and adjustment. So, changes can be made in the color, design, graphics or any other component to create a unique layout.


 Continue with Email

 Home
Home


