Product Dashboard
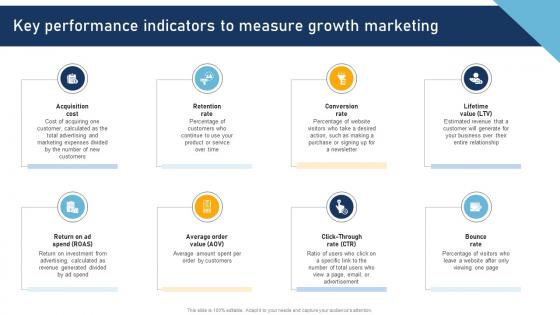
A Comprehensive Approach To Key Performance Indicators To Measure Growth MKT SS V
Whether you have daily or monthly meetings, a brilliant presentation is necessary. A Comprehensive Approach To Key Performance Indicators To Measure Growth MKT SS V can be your best option for delivering a presentation. Represent everything in detail using A Comprehensive Approach To Key Performance Indicators To Measure Growth MKT SS V and make yourself stand out in meetings. The template is versatile and follows a structure that will cater to your requirements. All the templates prepared by Slidegeeks are easy to download and edit. Our research experts have taken care of the corporate themes as well. So, give it a try and see the results. Our A Comprehensive Approach To Key Performance Indicators To Measure Growth MKT SS V are topically designed to provide an attractive backdrop to any subject. Use them to look like a presentation pro.
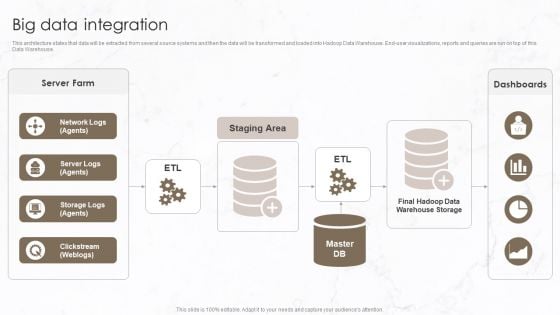
Implementation Of Data Governance Framework Big Data Integration Ideas PDF
This architecture states that data will be extracted from several source systems and then the data will be transformed and loaded into Hadoop Data Warehouse. End-user visualizations, reports and queries are run on top of this Data Warehouse.Deliver and pitch your topic in the best possible manner with this Implementation Of Data Governance Framework Big Data Integration Ideas PDF. Use them to share invaluable insights on Dashboards, Warehouse Storage, Clickstream Weblogs and impress your audience. This template can be altered and modified as per your expectations. So, grab it now.

Statistical Analytics In Food Processing Data Analytics For Informed Decision Ppt PowerPoint
This slide represents the concise overview of the problem, the proposed solution, and the achieved result for using data analytics in food processing outlet. The outcomes are precise food quantity forecasts, optimized resource allocation, etc. Find a pre-designed and impeccable Statistical Analytics In Food Processing Data Analytics For Informed Decision Ppt PowerPoint. The templates can ace your presentation without additional effort. You can download these easy-to-edit presentation templates to make your presentation stand out from others. So, what are you waiting for Download the template from Slidegeeks today and give a unique touch to your presentation. This slide represents the concise overview of the problem, the proposed solution, and the achieved result for using data analytics in food processing outlet. The outcomes are precise food quantity forecasts, optimized resource allocation, etc.
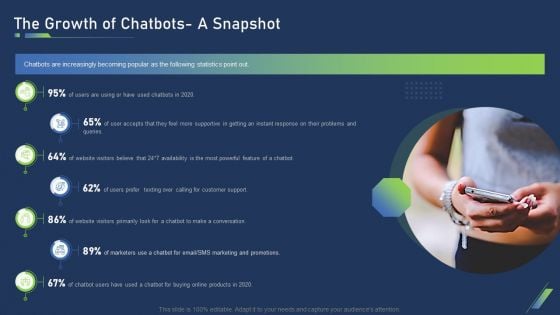
Using Bots Marketing Strategy The Growth Of Chatbots A Snapshot Inspiration PDF
Chatbots are increasingly becoming popular as the following statistics point out. Presenting using bots marketing strategy the growth of chatbots a snapshot inspiration pdf to provide visual cues and insights. Share and navigate important information on seven stages that need your due attention. This template can be used to pitch topics like customer support, marketing and promotions, buying online products. In addition, this PPT design contains high-resolution images, graphics, etc, that are easily editable and available for immediate download.
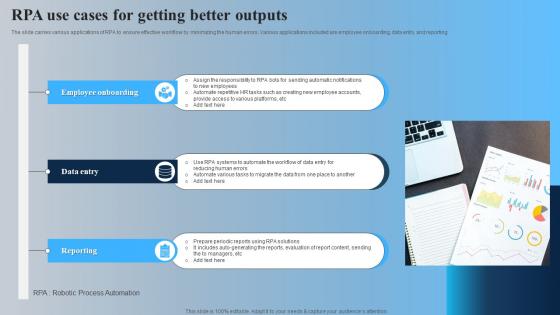
RPA Use Cases For Getting Better Outputs Rules Pdf
The slide carries various applications of RPA to ensure effective workflow by minimizing the human errors. Various applications included are employee onboarding, data entry and reporting Pitch your topic with ease and precision using this RPA Use Cases For Getting Better Outputs Rules Pdf This layout presents information on Employee Onboarding, Data Entry, Reporting It is also available for immediate download and adjustment. So, changes can be made in the color, design, graphics or any other component to create a unique layout. The slide carries various applications of RPA to ensure effective workflow by minimizing the human errors. Various applications included are employee onboarding, data entry and reporting
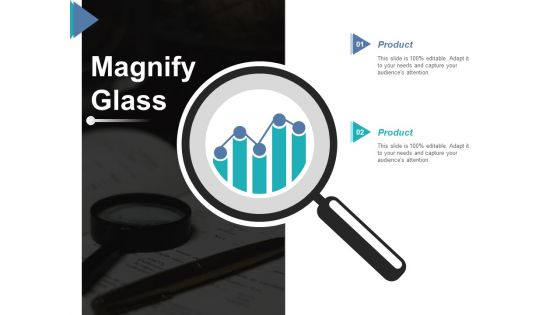
Magnify Glass Ppt PowerPoint Presentation Summary Example Topics
This is a magnify glass ppt powerpoint presentation summary example topics. This is a two stage process. The stages in this process are magnify glass, product, technology, business, marketing.
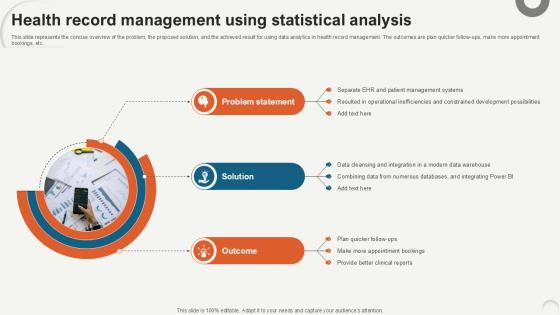
Health Record Management Using Data Analytics For Informed Decision Ppt Sample
This slide represents the concise overview of the problem, the proposed solution, and the achieved result for using data analytics in health record management. The outcomes are plan quicker follow-ups, make more appointment bookings, etc. Crafting an eye-catching presentation has never been more straightforward. Let your presentation shine with this tasteful yet straightforward Health Record Management Using Data Analytics For Informed Decision Ppt Sample template. It offers a minimalistic and classy look that is great for making a statement. The colors have been employed intelligently to add a bit of playfulness while still remaining professional. Construct the ideal Health Record Management Using Data Analytics For Informed Decision Ppt Sample that effortlessly grabs the attention of your audience Begin now and be certain to wow your customers This slide represents the concise overview of the problem, the proposed solution, and the achieved result for using data analytics in health record management. The outcomes are plan quicker follow-ups, make more appointment bookings, etc.
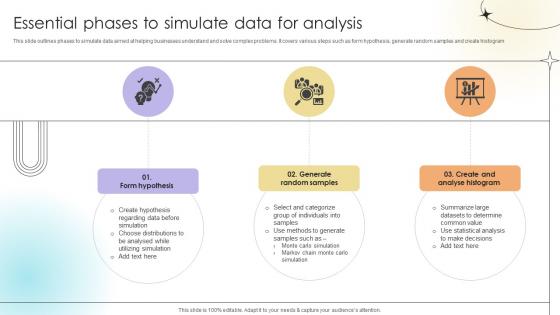
Essential Phases To Simulate Data For Analysis Data Analytics SS V
This slide outlines phases to simulate data aimed at helping businesses understand and solve complex problems. It covers various steps such as form hypothesis, generate random samples and create histogram.Here you can discover an assortment of the finest PowerPoint and Google Slides templates. With these templates, you can create presentations for a variety of purposes while simultaneously providing your audience with an eye-catching visual experience. Download Essential Phases To Simulate Data For Analysis Data Analytics SS V to deliver an impeccable presentation. These templates will make your job of preparing presentations much quicker, yet still, maintain a high level of quality. Slidegeeks has experienced researchers who prepare these templates and write high-quality content for you. Later on, you can personalize the content by editing the Essential Phases To Simulate Data For Analysis Data Analytics SS V. This slide outlines phases to simulate data aimed at helping businesses understand and solve complex problems. It covers various steps such as form hypothesis, generate random samples and create histogram.
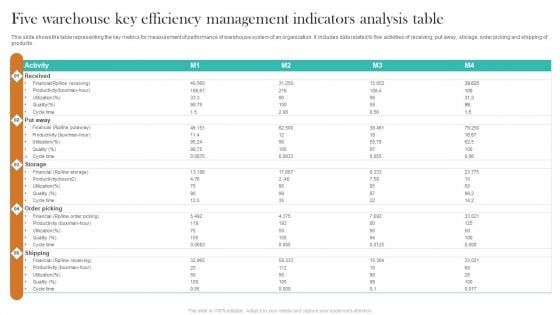
Five Warehouse Key Efficiency Management Indicators Analysis Table Demonstration PDF
This slide shows the table representing the key metrics for measurement of performance of warehouse system of an organization. It includes data related to five activities of receiving, put away, storage, order picking and shipping of products. Showcasing this set of slides titled Five Warehouse Key Efficiency Management Indicators Analysis Table Demonstration PDF. The topics addressed in these templates are Activity, Received, Storage. All the content presented in this PPT design is completely editable. Download it and make adjustments in color, background, font etc. as per your unique business setting.

Market Trends Ppt PowerPoint Presentation Themes
This is a market trends ppt powerpoint presentation themes. This is a two stage process. The stages in this process are montana, texas, sales in texas, product.
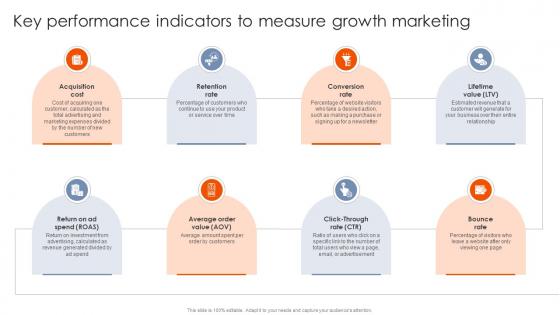
Best Practices For Using Growth Key Performance Indicators To Measure Growth MKT SS V
From laying roadmaps to briefing everything in detail, our templates are perfect for you. You can set the stage with your presentation slides. All you have to do is download these easy-to-edit and customizable templates. Best Practices For Using Growth Key Performance Indicators To Measure Growth MKT SS V will help you deliver an outstanding performance that everyone would remember and praise you for. Do download this presentation today. Our Best Practices For Using Growth Key Performance Indicators To Measure Growth MKT SS V are topically designed to provide an attractive backdrop to any subject. Use them to look like a presentation pro.
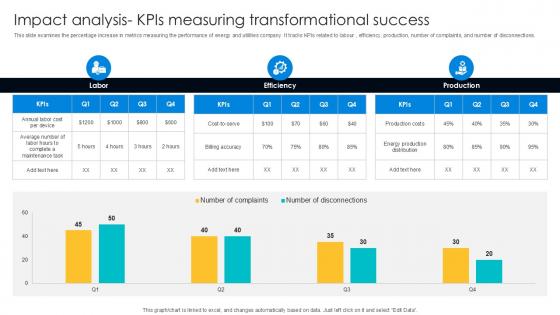
Impact Analysis KPIs Measuring Digital Transformation Journey PPT Presentation DT SS V
This slide examines the percentage increase in metrics measuring the performance of energy and utilities company. It tracks KPIs related to labour , efficiency, production, number of complaints, and number of disconnections. The Impact Analysis KPIs Measuring Digital Transformation Journey PPT Presentation DT SS V is a compilation of the most recent design trends as a series of slides. It is suitable for any subject or industry presentation, containing attractive visuals and photo spots for businesses to clearly express their messages. This template contains a variety of slides for the user to input data, such as structures to contrast two elements, bullet points, and slides for written information. Slidegeeks is prepared to create an impression. This slide examines the percentage increase in metrics measuring the performance of energy and utilities company. It tracks KPIs related to labour , efficiency, production, number of complaints, and number of disconnections.
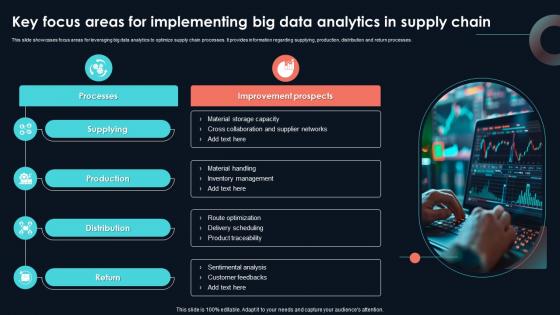
Key Focus Areas For Implementing Big Data Developing Strategic Insights Using Big Data Analytics SS V
This slide showcases focus areas for leveraging big data analytics to optimize supply chain processes. It provides information regarding supplying, production, distribution and return processes. Present like a pro with Key Focus Areas For Implementing Big Data Developing Strategic Insights Using Big Data Analytics SS V. Create beautiful presentations together with your team, using our easy-to-use presentation slides. Share your ideas in real-time and make changes on the fly by downloading our templates. So whether you are in the office, on the go, or in a remote location, you can stay in sync with your team and present your ideas with confidence. With Slidegeeks presentation got a whole lot easier. Grab these presentations today. This slide showcases focus areas for leveraging big data analytics to optimize supply chain processes. It provides information regarding supplying, production, distribution and return processes.
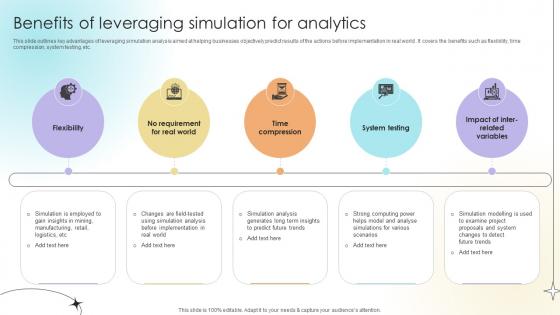
Benefits Of Leveraging Simulation For Analytics Data Analytics SS V
This slide outlines key advantages of leveraging simulation analysis aimed at helping businesses objectively predict results of the actions before implementation in real world . It covers the benefits such as flexibility, time compression, system testing, etc. This modern and well-arranged Benefits Of Leveraging Simulation For Analytics Data Analytics SS V provides lots of creative possibilities. It is very simple to customize and edit with the Powerpoint Software. Just drag and drop your pictures into the shapes. All facets of this template can be edited with Powerpoint, no extra software is necessary. Add your own material, put your images in the places assigned for them, adjust the colors, and then you can show your slides to the world, with an animated slide included. This slide outlines key advantages of leveraging simulation analysis aimed at helping businesses objectively predict results of the actions before implementation in real world . It covers the benefits such as flexibility, time compression, system testing, etc.
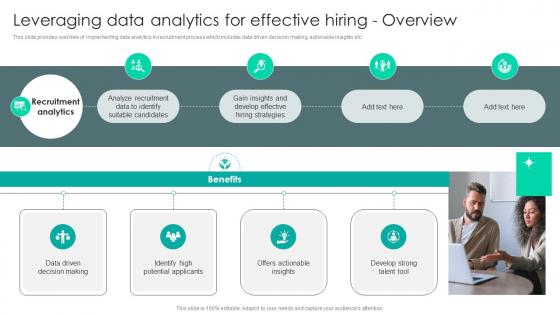
Strategic Staffing Using Data Leveraging Data Analytics For Effective Hiring Overview CRP DK SS V
This slide provides overview of implementing data analytics in recruitment process which includes data driven decision making, actionable insights etc. Here you can discover an assortment of the finest PowerPoint and Google Slides templates. With these templates, you can create presentations for a variety of purposes while simultaneously providing your audience with an eye-catching visual experience. Download Strategic Staffing Using Data Leveraging Data Analytics For Effective Hiring Overview CRP DK SS V to deliver an impeccable presentation. These templates will make your job of preparing presentations much quicker, yet still, maintain a high level of quality. Slidegeeks has experienced researchers who prepare these templates and write high-quality content for you. Later on, you can personalize the content by editing the Strategic Staffing Using Data Leveraging Data Analytics For Effective Hiring Overview CRP DK SS V. This slide provides overview of implementing data analytics in recruitment process which includes data driven decision making, actionable insights etc.
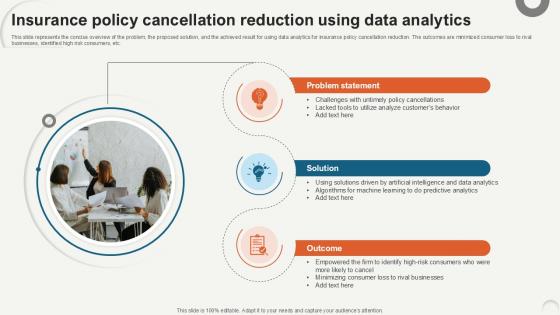
Insurance Policy Cancellation Reduction Data Analytics For Informed Decision Ppt PowerPoint
This slide represents the concise overview of the problem, the proposed solution, and the achieved result for using data analytics for insurance policy cancellation reduction. The outcomes are minimized consumer loss to rival businesses, identified high risk consumers, etc. This modern and well-arranged Insurance Policy Cancellation Reduction Data Analytics For Informed Decision Ppt PowerPoint provides lots of creative possibilities. It is very simple to customize and edit with the Powerpoint Software. Just drag and drop your pictures into the shapes. All facets of this template can be edited with Powerpoint, no extra software is necessary. Add your own material, put your images in the places assigned for them, adjust the colors, and then you can show your slides to the world, with an animated slide included. This slide represents the concise overview of the problem, the proposed solution, and the achieved result for using data analytics for insurance policy cancellation reduction. The outcomes are minimized consumer loss to rival businesses, identified high risk consumers, etc.
Icon Slides For Big Data Analytics Investor Funding Elevator Pitch Deck
Whether you have daily or monthly meetings, a brilliant presentation is necessary. Icon Slides For Big Data Analytics Investor Funding Elevator Pitch Deck can be your best option for delivering a presentation. Represent everything in detail using Icon Slides For Big Data Analytics Investor Funding Elevator Pitch Deck and make yourself stand out in meetings. The template is versatile and follows a structure that will cater to your requirements. All the templates prepared by Slidegeeks are easy to download and edit. Our research experts have taken care of the corporate themes as well. So, give it a try and see the results. Our Icon Slides For Big Data Analytics Investor Funding Elevator Pitch Deck are topically designed to provide an attractive backdrop to any subject. Use them to look like a presentation pro.
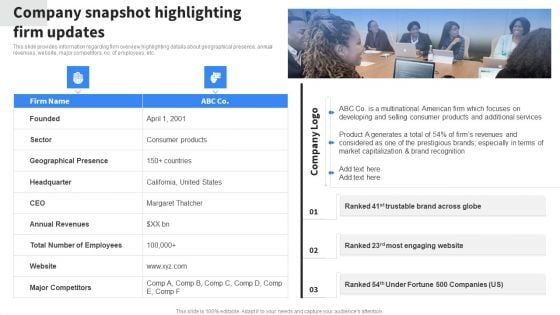
Company Snapshot Highlighting Firm Updates Demonstration PDF
This slide provides information regarding firm overview highlighting details about geographical presence, annual revenues, website, major competitors, no. of employees, etc. From laying roadmaps to briefing everything in detail, our templates are perfect for you. You can set the stage with your presentation slides. All you have to do is download these easy to edit and customizable templates. Company Snapshot Highlighting Firm Updates Demonstration PDF will help you deliver an outstanding performance that everyone would remember and praise you for. Do download this presentation today.
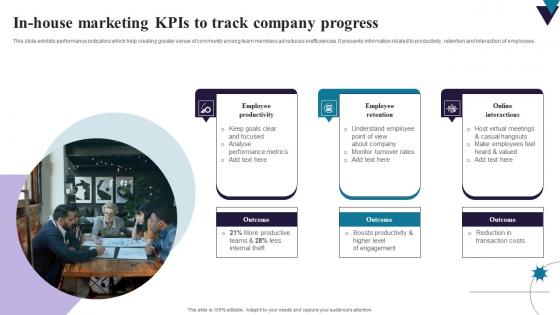
In House Marketing Kpis To Track Company Progress Inspiration Pdf
This slide exhibits performance indicators which help creating greater sense of community among team members ad reduces inefficiencies. It presents information related to productivity, retention and interaction of employees. Showcasing this set of slides titled In House Marketing Kpis To Track Company Progress Inspiration Pdf. The topics addressed in these templates are Employee Productivity, Employee Retention, Online Interactions. All the content presented in this PPT design is completely editable. Download it and make adjustments in color, background, font etc. as per your unique business setting. This slide exhibits performance indicators which help creating greater sense of community among team members ad reduces inefficiencies. It presents information related to productivity, retention and interaction of employees.
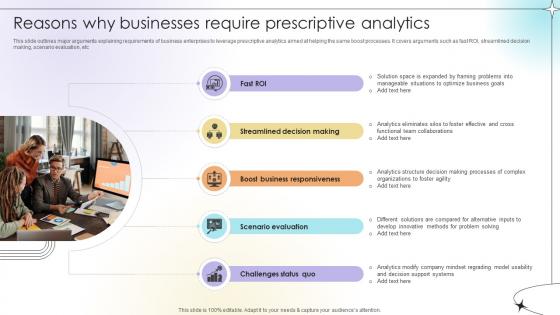
Reasons Why Businesses Require Prescriptive Analytics Data Analytics SS V
This slide outlines major arguments explaining requirements of business enterprises to leverage prescriptive analytics aimed at helping the same boost processes. It covers arguments such as fast ROI, streamlined decision making, scenario evaluation, etc.Here you can discover an assortment of the finest PowerPoint and Google Slides templates. With these templates, you can create presentations for a variety of purposes while simultaneously providing your audience with an eye-catching visual experience. Download Reasons Why Businesses Require Prescriptive Analytics Data Analytics SS V to deliver an impeccable presentation. These templates will make your job of preparing presentations much quicker, yet still, maintain a high level of quality. Slidegeeks has experienced researchers who prepare these templates and write high-quality content for you. Later on, you can personalize the content by editing the Reasons Why Businesses Require Prescriptive Analytics Data Analytics SS V. This slide outlines major arguments explaining requirements of business enterprises to leverage prescriptive analytics aimed at helping the same boost processes. It covers arguments such as fast ROI, streamlined decision making, scenario evaluation, etc.
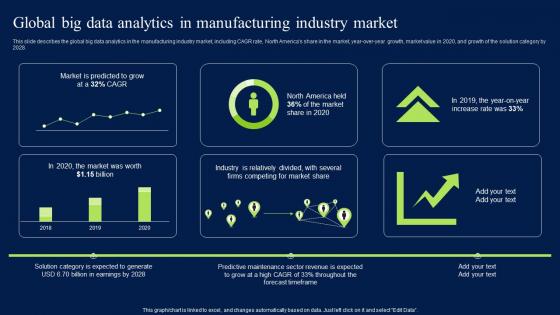
Global Big Data Analytics In Manufacturing Industry Market Graphics PDF
This slide describes the global big data analytics in the manufacturing industry market, including CAGR rate, North Americas share in the market, year-over-year growth, market value in 2020, and growth of the solution category by 2028. Find a pre-designed and impeccable Global Big Data Analytics In Manufacturing Industry Market Graphics PDF. The templates can ace your presentation without additional effort. You can download these easy-to-edit presentation templates to make your presentation stand out from others. So, what are you waiting for Download the template from Slidegeeks today and give a unique touch to your presentation. This slide describes the global big data analytics in the manufacturing industry market, including CAGR rate, North Americas share in the market, year-over-year growth, market value in 2020, and growth of the solution category by 2028.
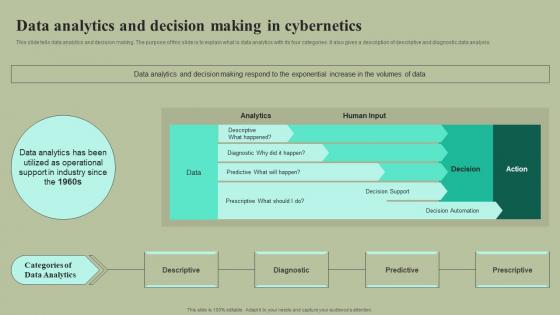
Data Analytics And Decision Making In Cybernetics Cybernetic Integration Inspiration Pdf
This slide tells data analytics and decision making. The purpose of this slide is to explain what is data analytics with its four categories. It also gives a description of descriptive and diagnostic data analysis. Here you can discover an assortment of the finest PowerPoint and Google Slides templates. With these templates, you can create presentations for a variety of purposes while simultaneously providing your audience with an eye-catching visual experience. Download Data Analytics And Decision Making In Cybernetics Cybernetic Integration Inspiration Pdf to deliver an impeccable presentation. These templates will make your job of preparing presentations much quicker, yet still, maintain a high level of quality. Slidegeeks has experienced researchers who prepare these templates and write high-quality content for you. Later on, you can personalize the content by editing the Data Analytics And Decision Making In Cybernetics Cybernetic Integration Inspiration Pdf This slide tells data analytics and decision making. The purpose of this slide is to explain what is data analytics with its four categories. It also gives a description of descriptive and diagnostic data analysis.
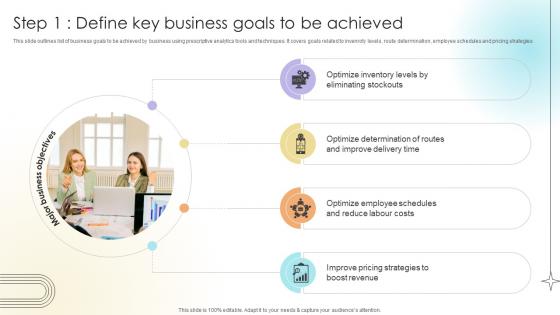
Step 1 Define Key Business Goals To Be Achieved Data Analytics SS V
This slide outlines list of business goals to be achieved by business using prescriptive analytics tools and techniques. It covers goals related to invenroty levels, route determination, employee schedules and pricing strategies.Crafting an eye-catching presentation has never been more straightforward. Let your presentation shine with this tasteful yet straightforward Step 1 Define Key Business Goals To Be Achieved Data Analytics SS V template. It offers a minimalistic and classy look that is great for making a statement. The colors have been employed intelligently to add a bit of playfulness while still remaining professional. Construct the ideal Step 1 Define Key Business Goals To Be Achieved Data Analytics SS V that effortlessly grabs the attention of your audience Begin now and be certain to wow your customers This slide outlines list of business goals to be achieved by business using prescriptive analytics tools and techniques. It covers goals related to invenroty levels, route determination, employee schedules and pricing strategies.
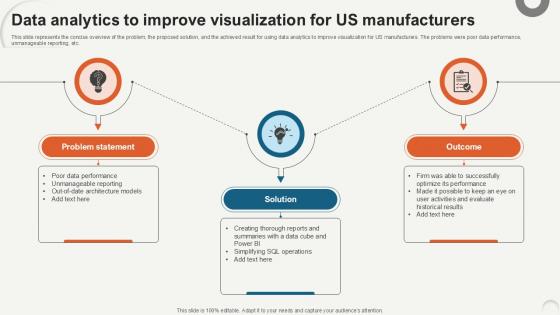
Data Analytics To Improve Visualization Data Analytics For Informed Decision Ppt PowerPoint
This slide represents the concise overview of the problem, the proposed solution, and the achieved result for using data analytics to improve visualization for US manufacturers. The problems were poor data performance, unmanageable reporting, etc. Whether you have daily or monthly meetings, a brilliant presentation is necessary. Data Analytics To Improve Visualization Data Analytics For Informed Decision Ppt PowerPoint can be your best option for delivering a presentation. Represent everything in detail using Data Analytics To Improve Visualization Data Analytics For Informed Decision Ppt PowerPoint and make yourself stand out in meetings. The template is versatile and follows a structure that will cater to your requirements. All the templates prepared by Slidegeeks are easy to download and edit. Our research experts have taken care of the corporate themes as well. So, give it a try and see the results. This slide represents the concise overview of the problem, the proposed solution, and the achieved result for using data analytics to improve visualization for US manufacturers. The problems were poor data performance, unmanageable reporting, etc.

Descriptive And Inferential Methods Data Analytics For Informed Decision Ppt Slide
This slide represents the different techniques of descriptive and inferential statistical analysis. These are univariate, bivariate, multivariate, central limit theorem, binomial theorem, hypothesis testing, normal distribution, applied to means, etc. Find highly impressive Descriptive And Inferential Methods Data Analytics For Informed Decision Ppt Slide on Slidegeeks to deliver a meaningful presentation. You can save an ample amount of time using these presentation templates. No need to worry to prepare everything from scratch because Slidegeeks experts have already done a huge research and work for you. You need to download Descriptive And Inferential Methods Data Analytics For Informed Decision Ppt Slide for your upcoming presentation. All the presentation templates are 100 percent editable and you can change the color and personalize the content accordingly. Download now This slide represents the different techniques of descriptive and inferential statistical analysis. These are univariate, bivariate, multivariate, central limit theorem, binomial theorem, hypothesis testing, normal distribution, applied to means, etc.
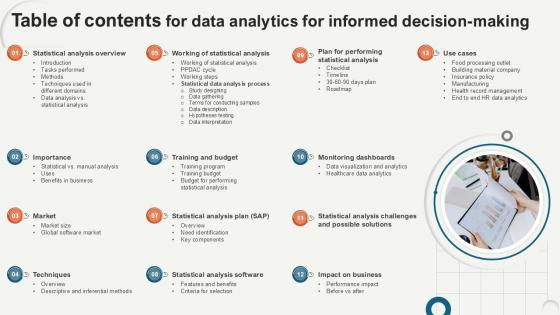
Table Of Contents For Data Analytics For Informed Decision Making Ppt Slide
From laying roadmaps to briefing everything in detail, our templates are perfect for you. You can set the stage with your presentation slides. All you have to do is download these easy-to-edit and customizable templates. Table Of Contents For Data Analytics For Informed Decision Making Ppt Slide will help you deliver an outstanding performance that everyone would remember and praise you for. Do download this presentation today. Our Table Of Contents For Data Analytics For Informed Decision Making Ppt Slide are topically designed to provide an attractive backdrop to any subject. Use them to look like a presentation pro.
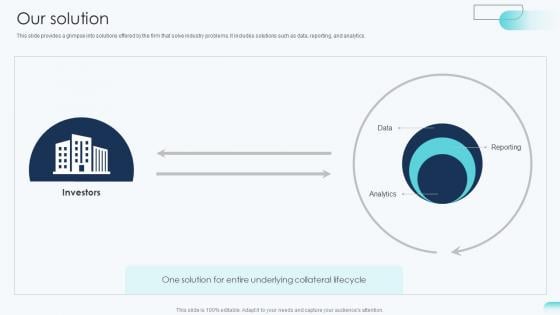
Our Solution Big Data Analytics Investor Funding Elevator Pitch Deck
This slide provides a glimpse into solutions offered by the firm that solve industry problems. It includes solutions such as data, reporting, and analytics. Make sure to capture your audiences attention in your business displays with our gratis customizable Our Solution Big Data Analytics Investor Funding Elevator Pitch Deck. These are great for business strategies, office conferences, capital raising or task suggestions. If you desire to acquire more customers for your tech business and ensure they stay satisfied, create your own sales presentation with these plain slides. This slide provides a glimpse into solutions offered by the firm that solve industry problems. It includes solutions such as data, reporting, and analytics.
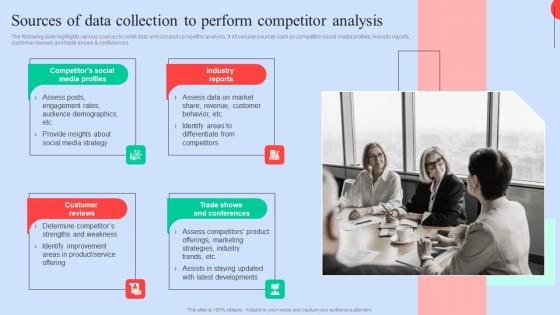
Sources Data Collection Executing Competitors Strategies To Assess Organizational Performance Mockup Pdf
The following slide highlights various sources to collet data and conduct competitor analysis. It showcase sources such as competitor social media profiles, industry reports,customer reviews and trade shows and conferences. Here you can discover an assortment of the finest PowerPoint and Google Slides templates. With these templates, you can create presentations for a variety of purposes while simultaneously providing your audience with an eye catching visual experience. Download Sources Data Collection Executing Competitors Strategies To Assess Organizational Performance Mockup Pdf to deliver an impeccable presentation. These templates will make your job of preparing presentations much quicker, yet still, maintain a high level of quality. Slidegeeks has experienced researchers who prepare these templates and write high quality content for you. Later on, you can personalize the content by editing the Sources Data Collection Executing Competitors Strategies To Assess Organizational Performance Mockup Pdf. The following slide highlights various sources to collet data and conduct competitor analysis. It showcase sources such as competitor social media profiles, industry reports,customer reviews and trade shows and conferences.
Big Data Real Time Analytics Lifecycle Ppt Icon Clipart Pdf
The following slide depicts big data real time analytics life cycle. It includes various phases such as data definition, acquisition, munging, analysis, visualization and utilization of analysis results. Pitch your topic with ease and precision using this Big Data Real Time Analytics Lifecycle Ppt Icon Clipart Pdf. This layout presents information on Acquisition, Munging, Analysis. It is also available for immediate download and adjustment. So, changes can be made in the color, design, graphics or any other component to create a unique layout. The following slide depicts big data real time analytics life cycle. It includes various phases such as data definition, acquisition, munging, analysis, visualization and utilization of analysis results.
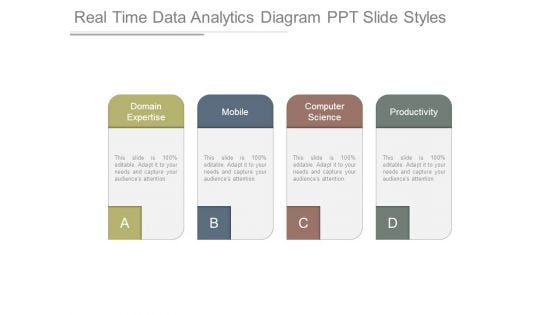
Real Time Data Analytics Diagram Ppt Slide Styles
This is a real time data analytics diagram ppt slide styles. This is a four stage process. The stages in this process are domain expertise, mobile, computer science, productivity.
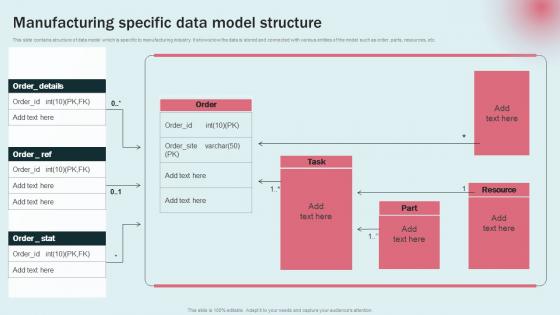
Manufacturing Specific Data Model Data Modeling Approaches For Modern Analytics Template Pdf
This slide contains structure of data model which is specific to manufacturing industry. It shows how the data is stored and connected with various entities of the model such as order, parts, resources, etc. Coming up with a presentation necessitates that the majority of the effort goes into the content and the message you intend to convey. The visuals of a PowerPoint presentation can only be effective if it supplements and supports the story that is being told. Keeping this in mind our experts created Manufacturing Specific Data Model Data Modeling Approaches For Modern Analytics Template Pdf to reduce the time that goes into designing the presentation. This way, you can concentrate on the message while our designers take care of providing you with the right template for the situation. This slide contains structure of data model which is specific to manufacturing industry. It shows how the data is stored and connected with various entities of the model such as order, parts, resources, etc.
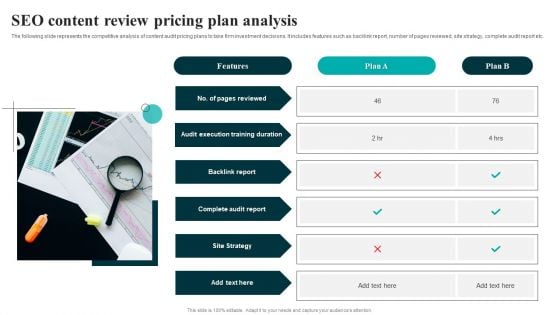
SEO Content Review Pricing Plan Analysis Slides PDF
The following slide represents the competitive analysis of content audit pricing plans to take firm investment decisions. It includes features such as backlink report, number of pages reviewed, site strategy, complete audit report etc. Presenting SEO Content Review Pricing Plan Analysis Slides PDF to dispense important information. This template comprises One stage. It also presents valuable insights into the topics including Backlink Report, Complete Audit Report, Site Strategy. This is a completely customizable PowerPoint theme that can be put to use immediately. So, download it and address the topic impactfully.
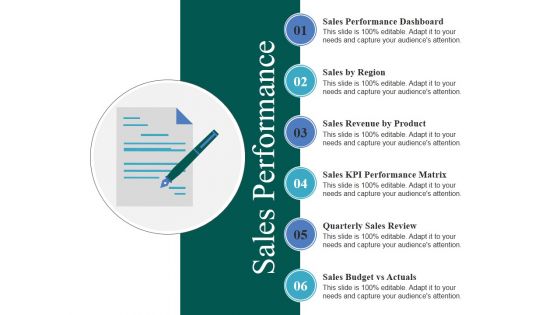
Sales Performance Ppt PowerPoint Presentation Infographics Visuals
This is a sales performance ppt powerpoint presentation infographics visuals. This is a six stage process. The stages in this process are sales by region, sales revenue by product, sales kpi performance matrix, quarterly sales review, sales budget vs actuals.
Strategic Business Plan Effective Tools Ogsm Framework For Strategic Planning Icons PDF
This slide covers the objectives, goals, strategies and measures model for a strategic planning of a company. Presenting strategic business plan effective tools ogsm framework for strategic planning icons pdf to provide visual cues and insights. Share and navigate important information on four stages that need your due attention. This template can be used to pitch topics like objective, goals, strategies, dashboard, action plan, measures. In addtion, this PPT design contains high resolution images, graphics, etc, that are easily editable and available for immediate download.
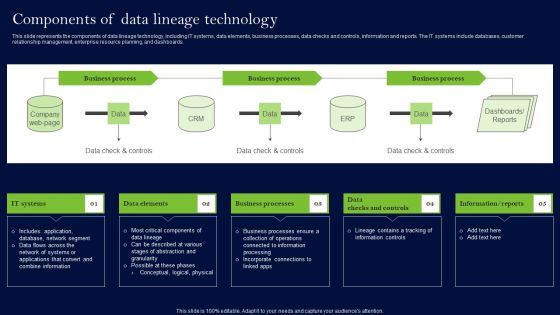
Data Lineage Methods Components Of Data Lineage Technology Diagrams PDF
This slide represents the components of data lineage technology, including IT systems, data elements, business processes, data checks and controls, information and reports. The IT systems include databases, customer relationship management, enterprise resource planning, and dashboards. The best PPT templates are a great way to save time, energy, and resources. Slidegeeks have 100 percent editable powerpoint slides making them incredibly versatile. With these quality presentation templates, you can create a captivating and memorable presentation by combining visually appealing slides and effectively communicating your message. Download Data Lineage Methods Components Of Data Lineage Technology Diagrams PDF from Slidegeeks and deliver a wonderful presentation.
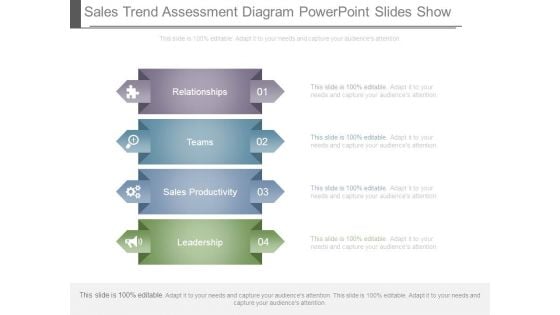
Sales Trend Assessment Diagram Powerpoint Slides Show
This is a sales trend assessment diagram powerpoint slides show. This is a four stage process. The stages in this process are relationships, teams, sales productivity, leadership.
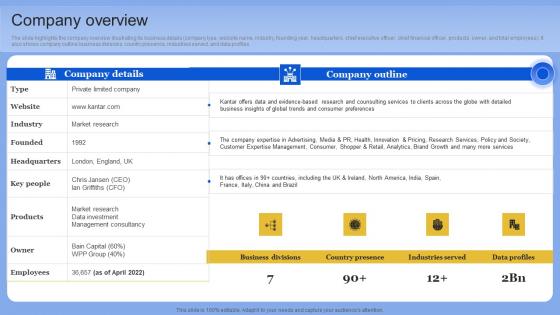
Company Overview Data Analytics Company Outline Demonstration PDF
The slide highlights the company overview illustrating its business details company type, website name, industry, founding year, headquarters, chief executive officer, chief financial officer, products, owner, and total employees. It also shows company outline business divisions, country presence, industries served, and data profiles. Want to ace your presentation in front of a live audience Our Company Overview Data Analytics Company Outline Demonstration PDF can help you do that by engaging all the users towards you. Slidegeeks experts have put their efforts and expertise into creating these impeccable powerpoint presentations so that you can communicate your ideas clearly. Moreover, all the templates are customizable, and easy-to-edit and downloadable. Use these for both personal and commercial use. The slide highlights the company overview illustrating its business details company type, website name, industry, founding year, headquarters, chief executive officer, chief financial officer, products, owner, and total employees. It also shows company outline business divisions, country presence, industries served, and data profiles
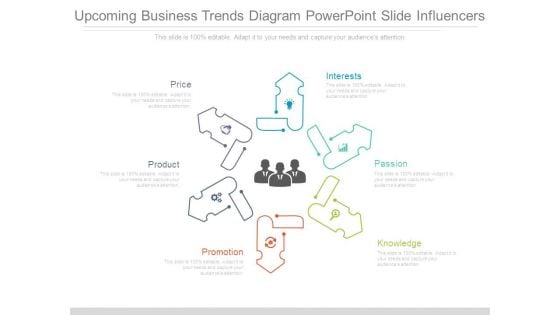
Upcoming Business Trends Diagram Powerpoint Slide Influencers
This is a upcoming business trends diagram powerpoint slide influencers. This is a six stage process. The stages in this process are interests, passion, knowledge, promotion, product, price.
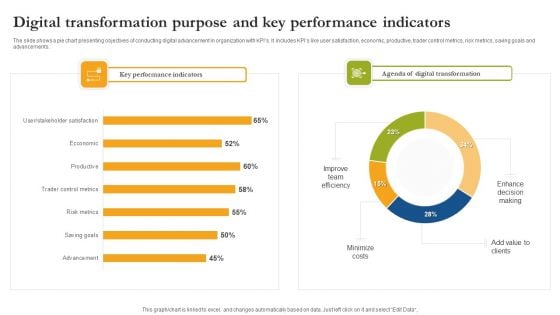
Digital Transformation Purpose And Key Performance Indicators Formats PDF
The slide shows a pie chart presenting objectives of conducting digital advancement in organization with KPIs. It includes KPIs like user satisfaction, economic, productive, trader control metrics, risk metrics, saving goals and advancements. Pitch your topic with ease and precision using this Digital Transformation Purpose And Key Performance Indicators Formats PDF. This layout presents information on Key Performance Indicators, Digital Transformation, Minimize Costs. It is also available for immediate download and adjustment. So, changes can be made in the color, design, graphics or any other component to create a unique layout.
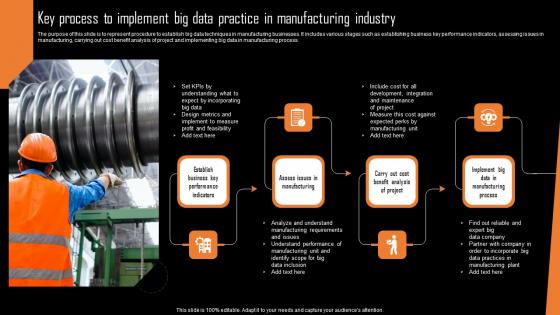
Key Process To Implement Big Data Practice In Manufacturing Industry Diagrams Pdf
The purpose of this slide is to represent procedure to establish big data techniques in manufacturing businesses. It includes various stages such as establishing business key performance indicators, assessing issues in manufacturing, carrying out cost benefit analysis of project and implementing big data in manufacturing process.Showcasing this set of slides titled Key Process To Implement Big Data Practice In Manufacturing Industry Diagrams Pdf The topics addressed in these templates are Expect Incorporating, Understand Performance, Manufacturing Plant All the content presented in this PPT design is completely editable. Download it and make adjustments in color, background, font etc. as per your unique business setting. The purpose of this slide is to represent procedure to establish big data techniques in manufacturing businesses. It includes various stages such as establishing business key performance indicators, assessing issues in manufacturing, carrying out cost benefit analysis of project and implementing big data in manufacturing process.

Quarterly Report Powerpoint Presentation Slides PPT Example
This Quarterly Report Powerpoint Presentation Slides PPT Example is a primer on how to capitalize on business opportunities through planning, innovation, and market intelligence. The content-ready format of the complete deck will make your job as a decision-maker a lot easier. Use this ready-made PowerPoint Template to help you outline an extensive and legible plan to capture markets and grow your company on the right path, at an exponential pace. What is even more amazing is that this presentation is completely editable and 100 percent customizable. This twenty six slide complete deck helps you impress a roomful of people with your expertise in business and even presentation. Craft such a professional and appealing presentation for that amazing recall value. Download now. Our comprehensive Quarterly Report Template is a professionally created presentation that can help organizations in representing key data, performance metrics and progress updates. This ppt streamlines the reporting process by providing structured sections for financial results, project updates, strategic insights, etc. It is ideal for internal reviews, stakeholder presentations, and executive summaries, ensuring your quarterly updates are communicated effectively and positively.
Advertising On Youtube Platform Step 2 Choosing A Youtube Advertising Campaign Objective Icons PDF
This slide provides the glimpse of second step for choosing up YouTube Ads campaign objective which focuses on creating a campaign based on differed goals such as leads and traffic, etc. Presenting advertising on youtube platform step 2 choosing a youtube advertising campaign objective icons pdf to provide visual cues and insights. Share and navigate important information on five stages that need your due attention. This template can be used to pitch topics like plan, awareness, dashboard, campaign. In addtion, this PPT design contains high resolution images, graphics, etc, that are easily editable and available for immediate download.
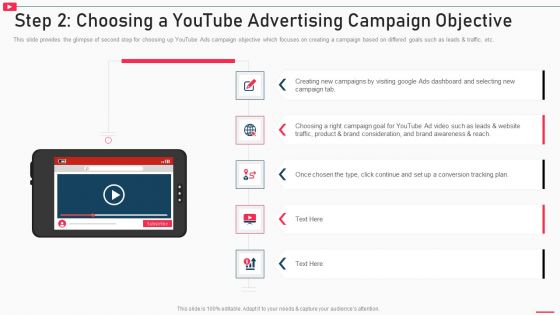
How To Promote Business Using Youtube Marketing Step 2 Choosing A Youtube Advertising Campaign Introduction PDF
This slide provides the glimpse of second step for choosing up YouTube Ads campaign objective which focuses on creating a campaign based on differed goals such as leads and traffic, etc. Presenting how to promote business using youtube marketing step 2 choosing a youtube advertising campaign introduction pdf to provide visual cues and insights. Share and navigate important information on five stages that need your due attention. This template can be used to pitch topics like plan, awareness, dashboard, campaign. In addtion, this PPT design contains high resolution images, graphics, etc, that are easily editable and available for immediate download.
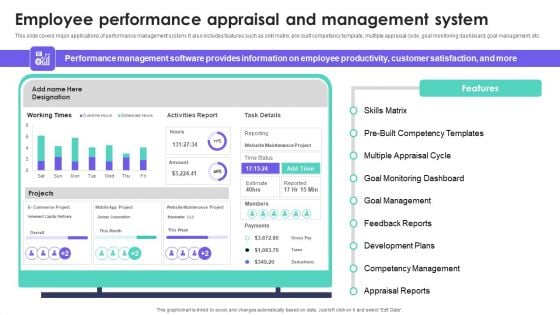
HRMS Execution Plan Employee Performance Appraisal And Management System Infographics PDF
This slide covers major applications of performance management system. It also includes features such as skill matrix, pre-built competency template, multiple appraisal cycle, goal monitoring dashboard, goal management, etc. Take your projects to the next level with our ultimate collection of HRMS Execution Plan Employee Performance Appraisal And Management System Infographics PDF. Slidegeeks has designed a range of layouts that are perfect for representing task or activity duration, keeping track of all your deadlines at a glance. Tailor these designs to your exact needs and give them a truly corporate look with your own brand colors they will make your projects stand out from the rest.
Education Metrics Tracker For Students Performance Evaluation Professional PDF
This slide covers student performance analysis dashboard. It include metrics student count, student attendance, average subject score, branch examination results, student count by grade, etc. Showcasing this set of slides titled Education Metrics Tracker For Students Performance Evaluation Professional PDF. The topics addressed in these templates are Students Count, Grade And Gender, Students Details, Examination Results Branch. All the content presented in this PPT design is completely editable. Download it and make adjustments in color, background, font etc. as per your unique business setting.
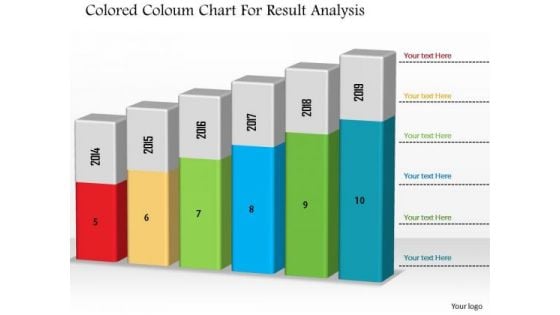
Business Diagram Colored Column Chart For Result Analysis PowerPoint Slide
This Power Point diagram has been designed with graphic of column chart. It contains diagram of bar char depicting annual business progress report. Use this diagram to build professional presentations for your viewers.
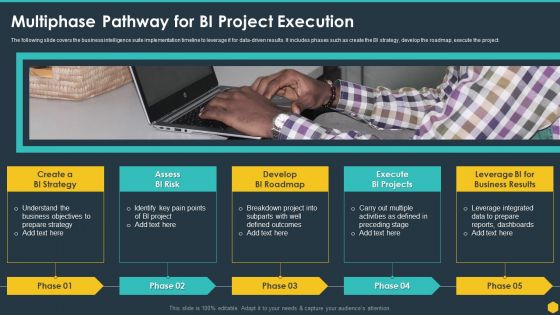
Multiphase Pathway For BI Project Execution BI Transformation Toolset Template PDF
The following slide covers the business intelligence suite implementation timeline to leverage it for data-driven results. It includes phases such as create the BI strategy, develop the roadmap, execute the project. This is a Multiphase Pathway For BI Project Execution BI Transformation Toolset Template PDF template with various stages. Focus and dispense information on five stages using this creative set, that comes with editable features. It contains large content boxes to add your information on topics like Strategy, Project, Dashboards, Execute, Develop. You can also showcase facts, figures, and other relevant content using this PPT layout. Grab it now.
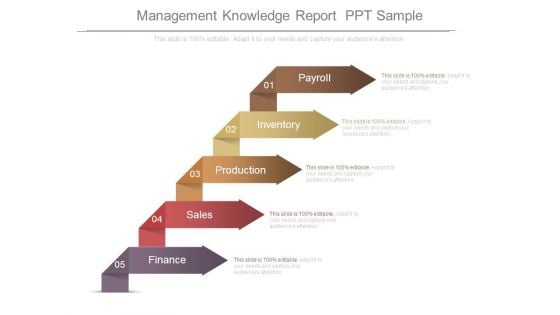
Management Knowledge Report Ppt Sample
This is a management knowledge report ppt sample. This is a five stage process. The stages in this process are finance, sales, production, inventory, payroll.
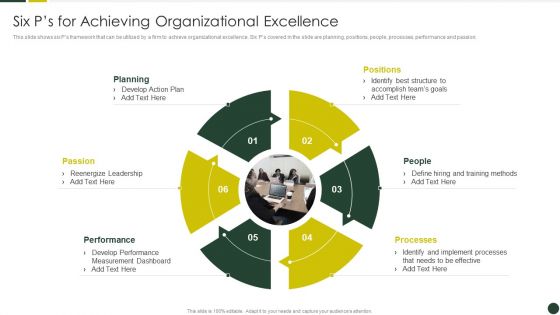
Quality Management Plan Templates Set 2 Six Ps For Achieving Organizational Excellence Themes PDF
This slide shows six Ps framework that can be utilized by a firm to achieve organizational excellence. Six Ps covered in the slide are planning, positions, people, processes, performance and passion.Presenting Quality Management Plan Templates Set 2 Six Ps For Achieving Organizational Excellence Themes PDF to provide visual cues and insights. Share and navigate important information on six stages that need your due attention. This template can be used to pitch topics like Reenergize Leadership, Develop Performance, Measurement Dashboard. In addtion, this PPT design contains high resolution images, graphics, etc, that are easily editable and available for immediate download.
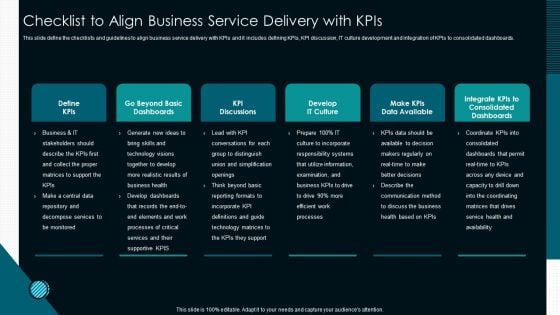
Optimize Service Delivery With Enhanced Checklist To Align Business Service Delivery With Kpis Structure PDF
This slide define the checklists and guidelines to align business service delivery with KPIs and it includes defining KPIs, KPI discussion, IT culture development and integration of KPIs to consolidated dashboards.Deliver and pitch your topic in the best possible manner with this Optimize Service Delivery With Enhanced Checklist To Align Business Service Delivery With Kpis Structure PDF. Use them to share invaluable insights on Matrices Support, Processes Critical, Communication Method and impress your audience. This template can be altered and modified as per your expectations. So, grab it now.
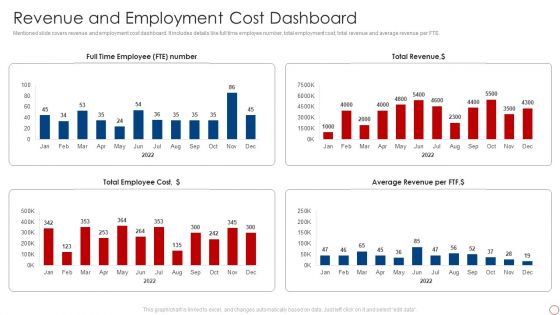
Kpis For Evaluating Business Sustainability Revenue And Employment Cost Themes PDF
Mentioned slide covers revenue and employment cost dashboard. It includes details like full time employee number, total employment cost, total revenue and average revenue per FTE. Deliver and pitch your topic in the best possible manner with this Kpis For Evaluating Business Sustainability Revenue And Employment Cost Themes PDF. Use them to share invaluable insights on Total Revenue, Average Revenue, Per FTF, Total Employee Cost and impress your audience. This template can be altered and modified as per your expectations. So, grab it now.

Advanced Predictive Analytics And Machine Learning Concept
This is a advanced predictive analytics and machine learning concept. This is a nine stage process. The stages in this process are demographics, orders, products, visits channels, social media sentiment, customer data, orzota predictive analytics, customer knowledge, improve conversion, targeted marketing, better customer satisfaction, increased sales.

Insurance Firm Start Up Financial Report Ppt Powerpoint Presentation Complete Deck With Slides
With well-researched insights and carefully-constructed design, this Insurance Firm Start Up Financial Report Ppt Powerpoint Presentation Complete Deck With Slides is all that you need for your next business meeting with clients and win them over. Add your data to graphs, charts, and tables that are already ready to display it with stunning visuals and help your audience recall your work. With this PPT Complete Deck, you will be able to display your knowledge of the subject as well as your skills as a communicator. Share your ideas and make an impact on the audience with this PowerPoint Layout and ensure that you are known as a presentation professional. Download this PPT Template Bundle to create the most interesting presentation anyone has ever seen. Our Insurance Firm Start Up Financial Report Ppt Powerpoint Presentation Complete Deck With Slides are topically designed to provide an attractive backdrop to any subject. Use them to look like a presentation pro.
CRM System Deployment Plan Implementation Steps Determine Metrics Supporting Icons PDF
This slide covers various KPIs that need to be measured to achieve organizational goals. It includes metrics such as salespersons performance report, number of leads converted, leads generated through campaigns, monthly sales report, number of unresolved cases, etc. This is a CRM System Deployment Plan Implementation Steps Determine Metrics Supporting Icons PDF template with various stages. Focus and dispense information on one stages using this creative set, that comes with editable features. It contains large content boxes to add your information on topics like Report And Dashboard, Metrics, Resource. You can also showcase facts, figures, and other relevant content using this PPT layout. Grab it now.
What Is Our Business Ppt PowerPoint Presentation Design Ideas
This is a what is our business ppt powerpoint presentation design ideas. This is a one stage process. The stages in this process are product, management, magnifying glass, business.
Magnify Glass Ppt PowerPoint Presentation Professional Example Topics
This is a magnify glass ppt powerpoint presentation professional example topics. This is a three stage process. The stages in this process are magnifier glass, research, business, focus, product.
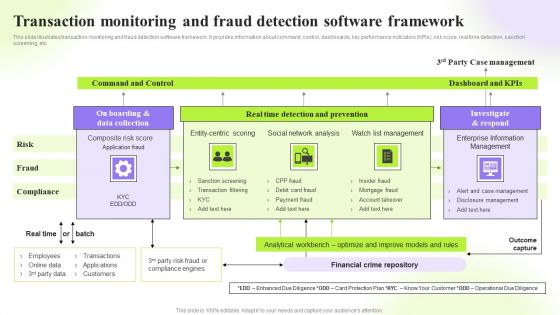
Techniques To Monitor Transactions Transaction Monitoring And Fraud Detection Sample PDF
This slide illustrates transaction monitoring and fraud detection software framework. It provides information about command, control, dashboards, key performance indicators KPIs, risk score, real time detection, sanction screening, etc. From laying roadmaps to briefing everything in detail, our templates are perfect for you. You can set the stage with your presentation slides. All you have to do is download these easy-to-edit and customizable templates. Techniques To Monitor Transactions Transaction Monitoring And Fraud Detection Sample PDF will help you deliver an outstanding performance that everyone would remember and praise you for. Do download this presentation today.
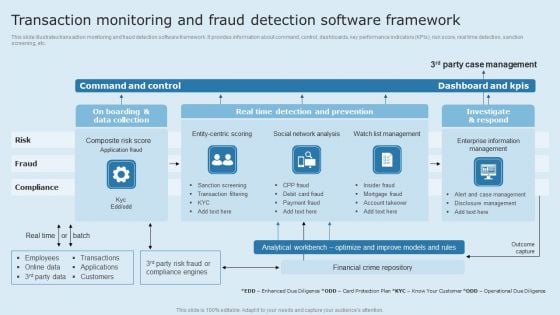
Actual Time Transaction Monitoring Software And Strategies Transaction Monitoring And Fraud Detection Professional PDF
This slide illustrates transaction monitoring and fraud detection software framework. It provides information about command, control, dashboards, key performance indicators KPIs, risk score, real time detection, sanction screening, etc. From laying roadmaps to briefing everything in detail, our templates are perfect for you. You can set the stage with your presentation slides. All you have to do is download these easy to edit and customizable templates. Actual Time Transaction Monitoring Software And Strategies Transaction Monitoring And Fraud Detection Professional PDF will help you deliver an outstanding performance that everyone would remember and praise you for. Do download this presentation today.
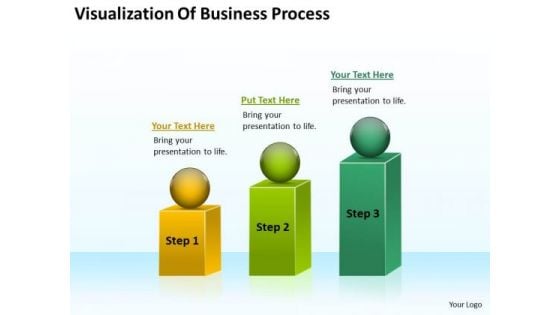
Visualization Of Business Process Ppt Plan PowerPoint Templates
We present our visualization of business process ppt plan PowerPoint templates.Present our Process and Flows PowerPoint Templates because Our PowerPoint Templates and Slides will Embellish your thoughts. They will help you illustrate the brilliance of your ideas. Download and present our Spheres PowerPoint Templates because It will Raise the bar of your Thoughts. They are programmed to take you to the next level. Use our Flow Charts PowerPoint Templates because Our PowerPoint Templates and Slides are conceived by a dedicated team. Use them and give form to your wondrous ideas. Use our Shapes PowerPoint Templates because Our PowerPoint Templates and Slides has conjured up a web of all you need with the help of our great team. Use them to string together your glistening ideas. Download and present our Marketing PowerPoint Templates because Our PowerPoint Templates and Slides will let you Leave a lasting impression to your audiences. They possess an inherent longstanding recall factor.Use these PowerPoint slides for presentations relating to Diagram, chart, market, statistics, square, grow, infograph, bar, corporate, business, vector, success, presentation, growing, circle, finance,analyst, goal, report, marketing, different, accounting, management, graph, illustration, geometric, sphere, design, growth, infographic, progress, profit,information, increase, aim, analyze, financial, rising, measure, block. The prominent colors used in the PowerPoint template are Green, Green lime, Yellow. Make an exhibition characteristic of you. Display your effectiveness on our Visualization Of Business Process Ppt Plan PowerPoint Templates.
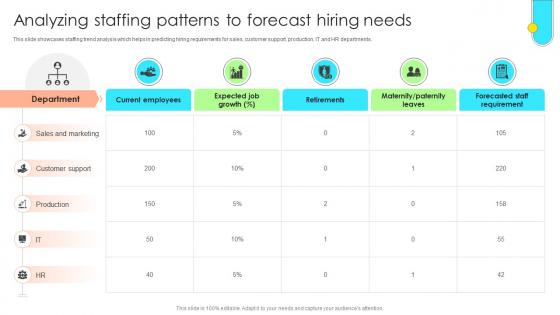
Data Driven Approach To Optimise Analyzing Staffing Patterns To Forecast CRP SS V
This slide showcases staffing trend analysis which helps in predicting hiring requirements for sales, customer support, production, IT and HR departments. Get a simple yet stunning designed Data Driven Approach To Optimise Analyzing Staffing Patterns To Forecast CRP SS V. It is the best one to establish the tone in your meetings. It is an excellent way to make your presentations highly effective. So, download this PPT today from Slidegeeks and see the positive impacts. Our easy-to-edit Data Driven Approach To Optimise Analyzing Staffing Patterns To Forecast CRP SS V can be your go-to option for all upcoming conferences and meetings. So, what are you waiting for Grab this template today. This slide showcases staffing trend analysis which helps in predicting hiring requirements for sales, customer support, production, IT and HR departments.


 Continue with Email

 Home
Home


