Product Dashboard
Successful Product Inauguration Management Product Management Activities Tracking Icons PDF
This slide provides information regarding essential product management activities tracking dashboard in terms of project budget, workload, overdue tasks, etc. Deliver an awe inspiring pitch with this creative successful product inauguration management product management activities tracking icons pdf bundle. Topics like planning, design, development can be discussed with this completely editable template. It is available for immediate download depending on the needs and requirements of the user.
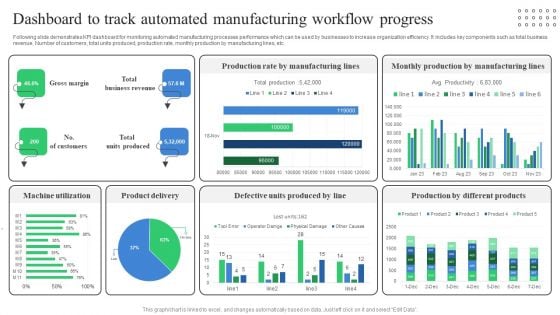
Dashboard To Track Automated Manufacturing Workflow Progress Professional PDF
Following slide demonstrates KPI dashboard for monitoring automated manufacturing processes performance which can be used by businesses to increase organization efficiency. It includes key components such as total business revenue, Number of customers, total units produced, production rate, monthly production by manufacturing lines, etc. Showcasing this set of slides titled Dashboard To Track Automated Manufacturing Workflow Progress Professional PDF. The topics addressed in these templates are Machine Utilization, Product Delivery, Defective Units Produced. All the content presented in this PPT design is completely editable. Download it and make adjustments in color, background, font etc. as per your unique business setting.
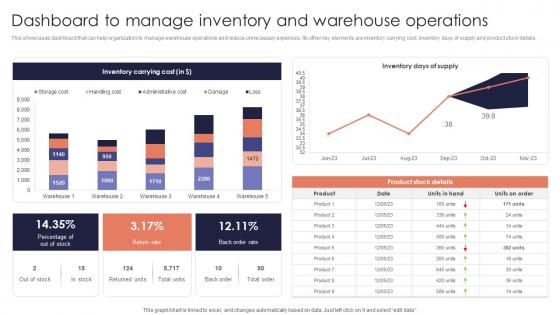
Dashboard Manage Inventory Minimizing Inventory Wastage Through Warehouse Microsoft Pdf
This showcases dashboard that can help organization to manage warehouse operations and reduce unnecessary expenses. Its other key elements are inventory carrying cost, inventory days of supply and product stock details. There are so many reasons you need a Dashboard Manage Inventory Minimizing Inventory Wastage Through Warehouse Microsoft Pdf. The first reason is you can not spend time making everything from scratch, Thus, Slidegeeks has made presentation templates for you too. You can easily download these templates from our website easily. This showcases dashboard that can help organization to manage warehouse operations and reduce unnecessary expenses. Its other key elements are inventory carrying cost, inventory days of supply and product stock details.
Cloud Platform Dashboard For Tracking Project Team Activities Microsoft PDF
The following slide depicts project team task tracking cloud dashboard. It provides information about hours worked, projects worked, time spent, daily limit, product design, weekly activity, etc. Create an editable Cloud Platform Dashboard For Tracking Project Team Activities Microsoft PDF that communicates your idea and engages your audience. Whether you are presenting a business or an educational presentation, pre-designed presentation templates help save time. Cloud Platform Dashboard For Tracking Project Team Activities Microsoft PDF is highly customizable and very easy to edit, covering many different styles from creative to business presentations. Slidegeeks has creative team members who have crafted amazing templates. So, go and get them without any delay.
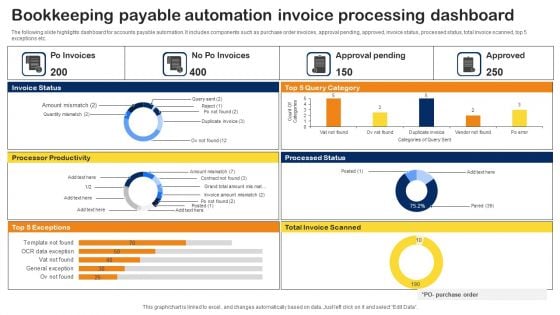
Bookkeeping Payable Automation Invoice Processing Dashboard Summary PDF
The following slide highlights dashboard for accounts payable automation. It includes components such as purchase order invoices, approval pending, approved, invoice status, processed status, total invoice scanned, top 5 exceptions etc. Showcasing this set of slides titled Bookkeeping Payable Automation Invoice Processing Dashboard Summary PDF. The topics addressed in these templates are Processor Productivity, Bookkeeping Payable Automation, Invoice Processing Dashboard. All the content presented in this PPT design is completely editable. Download it and make adjustments in color, background, font etc. as per your unique business setting.
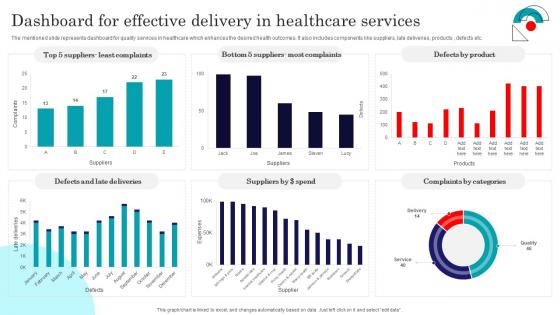
Dashboard For Effective Delivery In Healthcare Services Introduction Pdf
The mentioned slide represents dashboard for quality services in healthcare which enhances the desired health outcomes. It also includes components like suppliers, late deliveries, products , defects etc. Showcasing this set of slides titled Dashboard For Effective Delivery In Healthcare Services Introduction Pdf. The topics addressed in these templates are Late Deliveries, Complaints By Categories. All the content presented in this PPT design is completely editable. Download it and make adjustments in color, background, font etc. as per your unique business setting. The mentioned slide represents dashboard for quality services in healthcare which enhances the desired health outcomes. It also includes components like suppliers, late deliveries, products , defects etc.
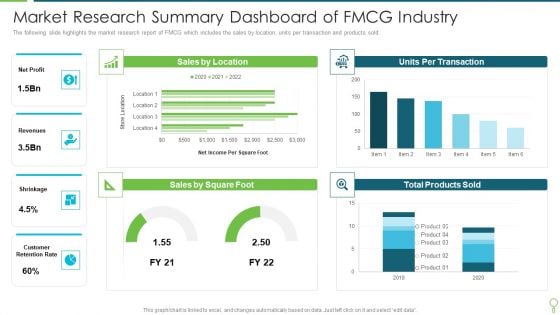
Market Research Summary Dashboard Of Fmcg Industry Pictures PDF
The following slide highlights the market research report of FMCG which includes the sales by location, units per transaction and products sold. Showcasing this set of slides titled Market Research Summary Dashboard Of Fmcg Industry Pictures PDF. The topics addressed in these templates are Revenues, Net Profit, Sales. All the content presented in this PPT design is completely editable. Download it and make adjustments in color, background, font etc. as per your unique business setting.
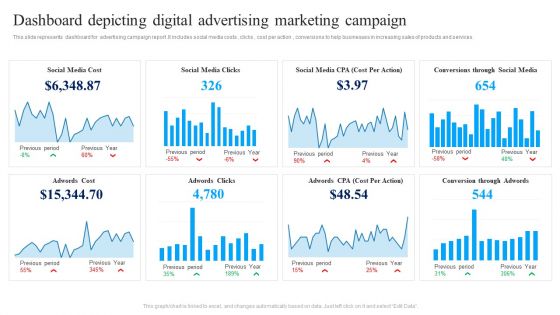
Dashboard Depicting Digital Advertising Marketing Campaign Ppt Summary Elements PDF
This slide represents dashboard for advertising campaign report .It includes social media costs , clicks , cost per action , conversions to help businesses in increasing sales of products and services. Showcasing this set of slides titled Dashboard Depicting Digital Advertising Marketing Campaign Ppt Summary Elements PDF. The topics addressed in these templates are Social Media Cost, Social Media Clicks, Adwords Clicks, Adwords Cost . All the content presented in this PPT design is completely editable. Download it and make adjustments in color, background, font etc. as per your unique business setting.
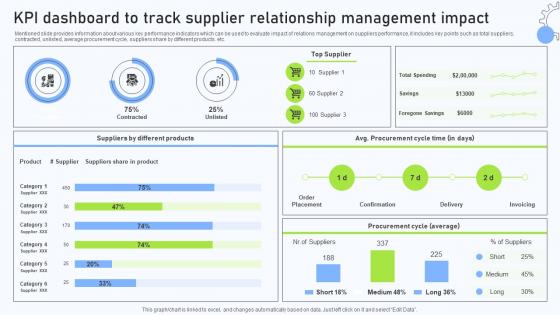
Relationship Management Automation KPI Dashboard To Track Supplier Relationship
Mentioned slide provides information about various key performance indicators which can be used to evaluate impact of relations management on suppliers performance, it includes key points such as total suppliers, contracted, unlisted, average procurement cycle, suppliers share by different products. etc. This Relationship Management Automation KPI Dashboard To Track Supplier Relationship is perfect for any presentation, be it in front of clients or colleagues. It is a versatile and stylish solution for organizing your meetings. The Relationship Management Automation KPI Dashboard To Track Supplier Relationship features a modern design for your presentation meetings. The adjustable and customizable slides provide unlimited possibilities for acing up your presentation. Slidegeeks has done all the homework before launching the product for you. So, do not wait, grab the presentation templates today Mentioned slide provides information about various key performance indicators which can be used to evaluate impact of relations management on suppliers performance, it includes key points such as total suppliers, contracted, unlisted, average procurement cycle, suppliers share by different products. etc.
Logistics Management Time Tracking Dashboard With Warehousing Costs Template PDF
This slide showcases shipping dashboard that can help company to deliver the products in stipulated time and keep warehousing operating expenses within pre decided budget. Its also displays perfect order rate and total shipments by country. Pitch your topic with ease and precision using this Logistics Management Time Tracking Dashboard With Warehousing Costs Template PDF. This layout presents information on Warehouse Operating Costs, Perfect Order Rate, On Time Shipments. It is also available for immediate download and adjustment. So, changes can be made in the color, design, graphics or any other component to create a unique layout.
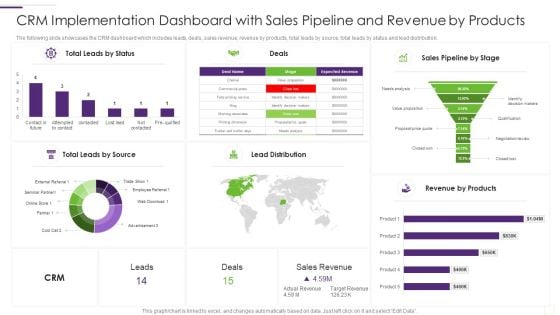
CRM Implementation Strategy CRM Implementation Dashboard With Sales Pictures PDF
The following slide showcases the CRM dashboard which includes leads, deals, sales revenue, revenue by products, total leads by source, total leads by status and lead distribution.Deliver and pitch your topic in the best possible manner with this CRM Implementation Strategy CRM Implementation Dashboard With Sales Pictures PDF Use them to share invaluable insights on Leads By Status, Leads By Source, Lead Distribution and impress your audience. This template can be altered and modified as per your expectations. So, grab it now.
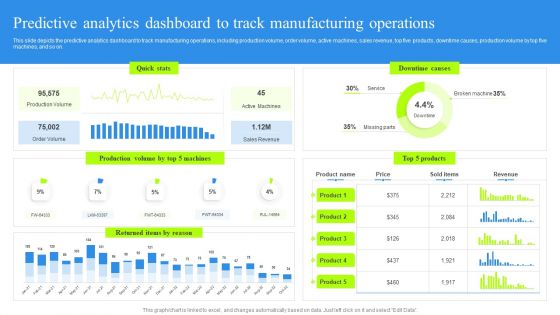
Predictive Analytics Dashboard To Track Manufacturing Operations Rules PDF
This slide depicts the predictive analytics dashboard to track manufacturing operations, including production volume, order volume, active machines, sales revenue, top five products, downtime causes, production volume by top five machines, and so on. Present like a pro with Predictive Analytics Dashboard To Track Manufacturing Operations Rules PDF Create beautiful presentations together with your team, using our easy-to-use presentation slides. Share your ideas in real-time and make changes on the fly by downloading our templates. So whether you are in the office, on the go, or in a remote location, you can stay in sync with your team and present your ideas with confidence. With Slidegeeks presentation got a whole lot easier. Grab these presentations today.
HR Dashboard To Tackle Low Output Icons PDF
This slide depicts the dashboard used by human resource management to track employee productivity rate and identify bottlenecks in performance. It includes status of tickets, occupancy and resolution rate, net promoter score and track of agents solving tickets. Showcasing this set of slides titled HR Dashboard To Tackle Low Output Icons PDF. The topics addressed in these templates are Resolution Rate, Occupancy Rate, Net Promoter Score. All the content presented in this PPT design is completely editable. Download it and make adjustments in color, background, font etc. as per your unique business setting.
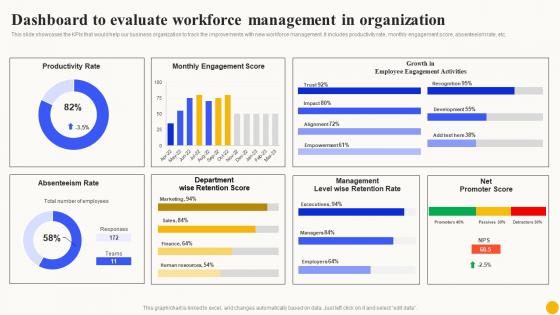
Dashboard To Evaluate Workforce Planned Workforce Enhancement Mockup Pdf
This slide showcases the KPIs that would help our business organization to track the improvements with new workforce management. It includes productivity rate, monthly engagement score, absenteeism rate, etc.Find highly impressive Dashboard To Evaluate Workforce Planned Workforce Enhancement Mockup Pdf on Slidegeeks to deliver a meaningful presentation. You can save an ample amount of time using these presentation templates. No need to worry to prepare everything from scratch because Slidegeeks experts have already done a huge research and work for you. You need to download Dashboard To Evaluate Workforce Planned Workforce Enhancement Mockup Pdf for your upcoming presentation. All the presentation templates are 100Precent editable and you can change the color and personalize the content accordingly. Download now. This slide showcases the KPIs that would help our business organization to track the improvements with new workforce management. It includes productivity rate, monthly engagement score, absenteeism rate, etc.
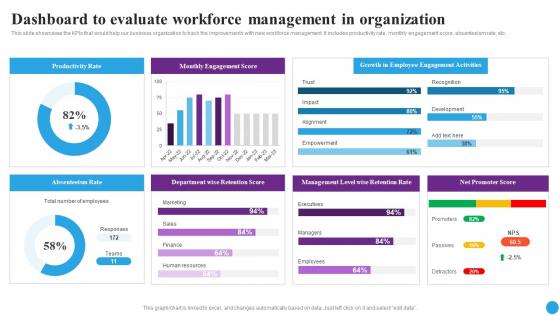
Dashboard To Evaluate Workforce Strategic Approaches To Streamline Demonstration Pdf
This slide showcases the KPIs that would help our business organization to track the improvements with new workforce management. It includes productivity rate, monthly engagement score, absenteeism rate, etc.Find highly impressive Dashboard To Evaluate Workforce Strategic Approaches To Streamline Demonstration Pdf on Slidegeeks to deliver a meaningful presentation. You can save an ample amount of time using these presentation templates. No need to worry to prepare everything from scratch because Slidegeeks experts have already done a huge research and work for you. You need to download Dashboard To Evaluate Workforce Strategic Approaches To Streamline Demonstration Pdf for your upcoming presentation. All the presentation templates are 100Precent editable and you can change the color and personalize the content accordingly. Download now. This slide showcases the KPIs that would help our business organization to track the improvements with new workforce management. It includes productivity rate, monthly engagement score, absenteeism rate, etc.
Kpi Dashboard To Analyze Customer Satisfaction Ppt Icon Graphics PDF
The following slide outlines a comprehensive visual representation of customer satisfaction CSAT that can assist companies to measure how happy are customers wit the brand. The KPIs covered are net promoter score NPS, customer effort score CES, product quality, pricing, etc. Get a simple yet stunning designed Kpi Dashboard To Analyze Customer Satisfaction Ppt Icon Graphics PDF. It is the best one to establish the tone in your meetings. It is an excellent way to make your presentations highly effective. So, download this PPT today from Slidegeeks and see the positive impacts. Our easy to edit Kpi Dashboard To Analyze Customer Satisfaction Ppt Icon Graphics PDF can be your go to option for all upcoming conferences and meetings. So, what are you waiting for Grab this template today.
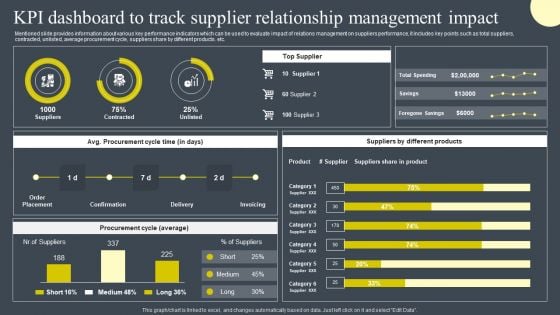
KPI Dashboard To Track Supplier Relationship Management Impact Inspiration PDF
Mentioned slide provides information about various key performance indicators which can be used to evaluate impact of relations management on suppliers performance, it includes key points such as total suppliers, contracted, unlisted, average procurement cycle, suppliers share by different products. etc. Slidegeeks has constructed KPI Dashboard To Track Supplier Relationship Management Impact Inspiration PDF after conducting extensive research and examination. These presentation templates are constantly being generated and modified based on user preferences and critiques from editors. Here, you will find the most attractive templates for a range of purposes while taking into account ratings and remarks from users regarding the content. This is an excellent jumping-off point to explore our content and will give new users an insight into our top-notch PowerPoint Templates.
Pharma Medical Dashboard To Analyze Sales Strategy Performance Icons PDF
The following slide delineates a comprehensive medical dashboard which can be used by the pharma company to measure its sales strategy performance. The KPIs covered in the slide are top sales producers, sales channels, volume by product, etc. Showcasing this set of slides titled Pharma Medical Dashboard To Analyze Sales Strategy Performance Icons PDF. The topics addressed in these templates are Market Leaders, Sales Channels, Volume Product. All the content presented in this PPT design is completely editable. Download it and make adjustments in color, background, font etc. as per your unique business setting.
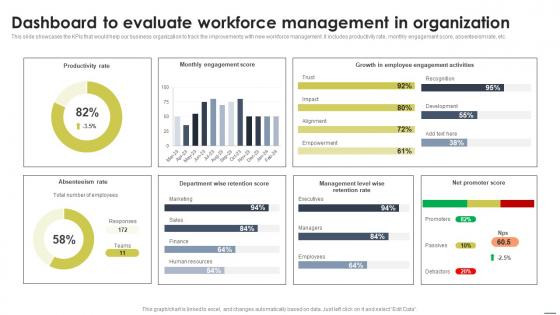
Dashboard To Evaluate Workforce Management Staff Management Approache Background Pdf
This slide showcases the KPIs that would help our business organization to track the improvements with new workforce management. It includes productivity rate, monthly engagement score, absenteeism rate, etc. Find highly impressive Dashboard To Evaluate Workforce Management Staff Management Approache Background Pdf on Slidegeeks to deliver a meaningful presentation. You can save an ample amount of time using these presentation templates. No need to worry to prepare everything from scratch because Slidegeeks experts have already done a huge research and work for you. You need to download Dashboard To Evaluate Workforce Management Staff Management Approache Background Pdf for your upcoming presentation. All the presentation templates are 100 percent editable and you can change the color and personalize the content accordingly. Download now This slide showcases the KPIs that would help our business organization to track the improvements with new workforce management. It includes productivity rate, monthly engagement score, absenteeism rate, etc.
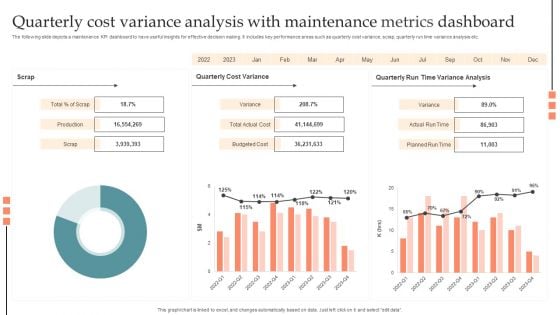
Quarterly Cost Variance Analysis With Maintenance Metrics Dashboard Information PDF
The following slide depicts a maintenance KPI dashboard to have useful insights for effective decision making. It includes key performance areas such as quarterly cost variance, scrap, quarterly run time variance analysis etc. Pitch your topic with ease and precision using this Quarterly Cost Variance Analysis With Maintenance Metrics Dashboard Information PDF. This layout presents information on Production, Budgeted Cost, Planned Run Time, Actual Run Time. It is also available for immediate download and adjustment. So, changes can be made in the color, design, graphics or any other component to create a unique layout.
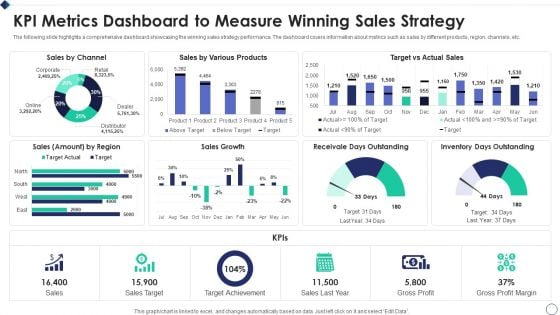
KPI Metrics Dashboard To Measure Winning Sales Strategy Ideas PDF
The following slide highlights a comprehensive dashboard showcasing the winning sales strategy performance. The dashboard covers information about metrics such as sales by different products, region, channels, etc.Showcasing this set of slides titled KPI Metrics Dashboard To Measure Winning Sales Strategy Ideas PDF The topics addressed in these templates are Sales By Channel, Various Products, Inventory Outstanding All the content presented in this PPT design is completely editable. Download it and make adjustments in color, background, font etc. as per your unique business setting.
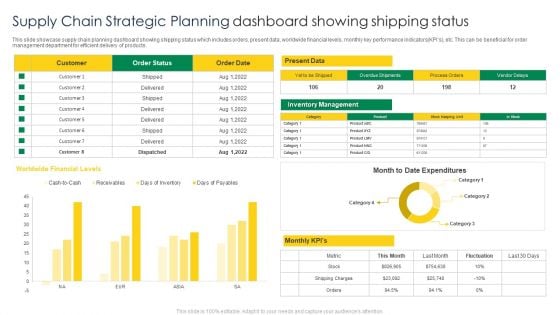
Supply Chain Strategic Planning Dashboard Showing Shipping Status Structure PDF
This slide showcase supply chain planning dashboard showing shipping status which includes orders, present data, worldwide financial levels, monthly key performance indicators KPIs, etc. This can be beneficial for order management department for efficient delivery of products. Showcasing this set of slides titled Supply Chain Strategic Planning Dashboard Showing Shipping Status Structure PDF. The topics addressed in these templates are Worldwide Financial Levels, Present Data, Customer. All the content presented in this PPT design is completely editable. Download it and make adjustments in color, background, font etc. as per your unique business setting.
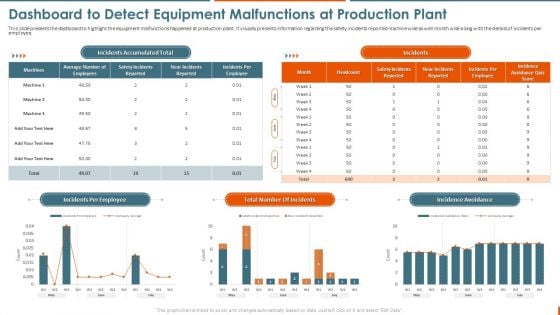
Maintenance Administration Dashboard To Detect Equipment Malfunctions At Guidelines PDF
This slide presents the dashboard to highlight the equipment malfunctions happened at production plant. It visually presents information regarding the safety incidents reported machine wise as well month wise along with the details of incidents per employee. Slidegeeks is one of the best resources for PowerPoint templates. You can download easily and regulate Maintenance Administration Dashboard To Detect Equipment Malfunctions At Guidelines PDF for your personal presentations from our wonderful collection. A few clicks is all it takes to discover and get the most relevant and appropriate templates. Use our Templates to add a unique zing and appeal to your presentation and meetings. All the slides are easy to edit and you can use them even for advertisement purposes.
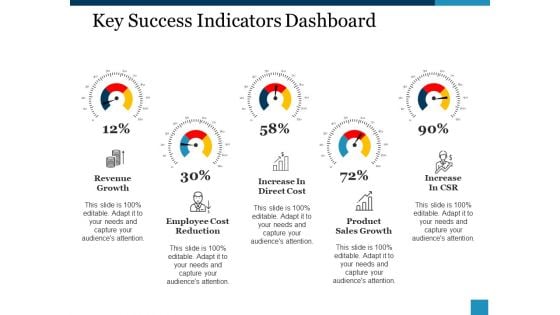
Key Success Indicators Dashboard Ppt PowerPoint Presentation Inspiration Guide
This is a key success indicators dashboard ppt powerpoint presentation inspiration guide. This is a five stage process. The stages in this process are revenue growth, increase in direct cost, increase in csr, employee cost reduction, product, sales growth.
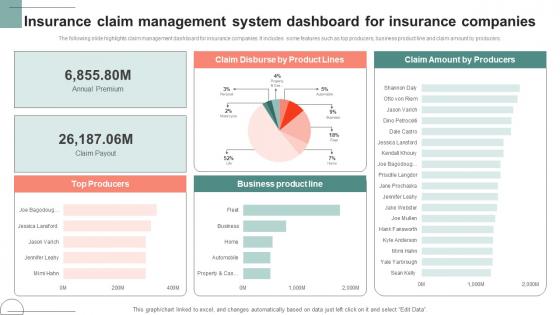
Insurance Claim Management System Dashboard For Insurance Companies Demonstration Pdf
The following slide highlights claim management dashboard for insurance companies. It includes some features such as top producers, business product line and claim amount by producers. Showcasing this set of slides titled Insurance Claim Management System Dashboard For Insurance Companies Demonstration Pdf The topics addressed in these templates are Claim Disburse, Product Lines, Business Product All the content presented in this PPT design is completely editable. Download it and make adjustments in color, background, font etc. as per your unique business setting. The following slide highlights claim management dashboard for insurance companies. It includes some features such as top producers, business product line and claim amount by producers.
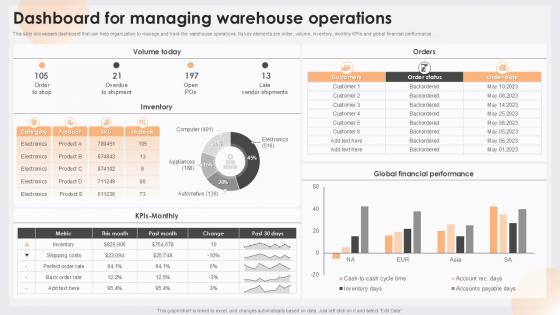
Dashboard For Managing Warehouse Determining Ideal Quantity To Procure Inventor
The best PPT templates are a great way to save time, energy, and resources. Slidegeeks have 100 percent editable powerpoint slides making them incredibly versatile. With these quality presentation templates, you can create a captivating and memorable presentation by combining visually appealing slides and effectively communicating your message. Download Dashboard For Managing Warehouse Determining Ideal Quantity To Procure Inventor from Slidegeeks and deliver a wonderful presentation. This slide depicts a dashboard for managing and tracking warehouse operations. It includes key elements such as order, volume, inventory, monthly KPIs, and global financial performance
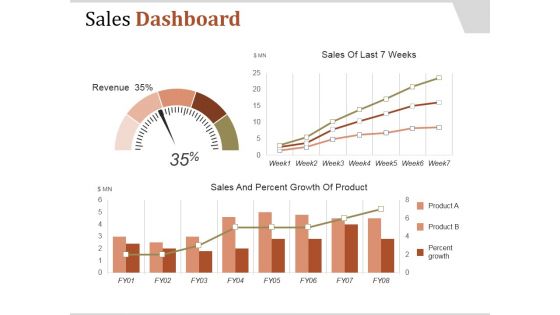
Sales Dashboard Template 1 Ppt PowerPoint Presentation Samples
This is a sales dashboard template 1 ppt powerpoint presentation samples. This is a one stage process. The stages in this process are sales and percent growth of product, revenue, product, percent growth.
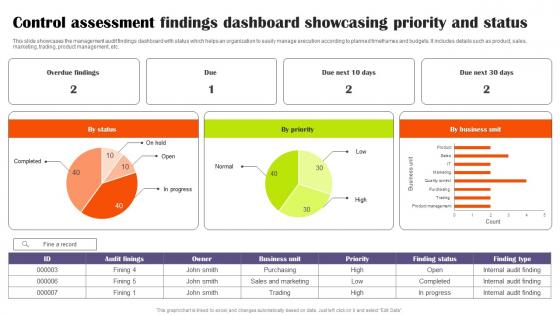
Control Assessment Findings Dashboard Showcasing Priority And Status Sample Pdf
This slide showcases the management audit findings dashboard with status which helps an organization to easily manage execution according to planned timeframes and budgets. It includes details such as product, sales, marketing, trading, product management, etc. Pitch your topic with ease and precision using this Control Assessment Findings Dashboard Showcasing Priority And Status Sample Pdf This layout presents information on Control Assessment, Findings Dashboard, Showcasing Priority It is also available for immediate download and adjustment. So, changes can be made in the color, design, graphics or any other component to create a unique layout. This slide showcases the management audit findings dashboard with status which helps an organization to easily manage execution according to planned timeframes and budgets. It includes details such as product, sales, marketing, trading, product management, etc.
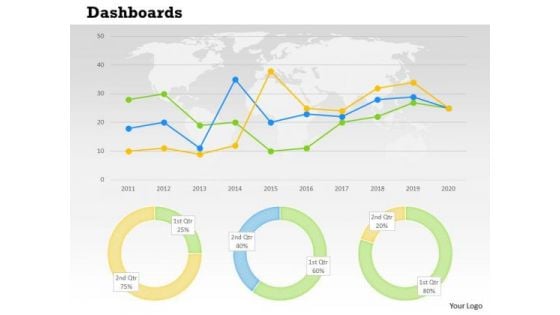
Sales Diagram Dashboard For Quantitative Business Data Consulting Diagram
Deliver The Right Dose With Our Sales Diagram Dashboard For Quantitative Business Data Consulting Diagram Powerpoint Templates. Your Ideas Will Get The Correct Illumination.
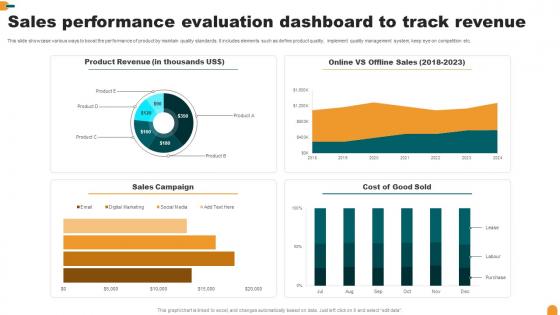
Sales Performance Evaluation Dashboard To Track Revenue Summary Pdf
This slide showcase various ways to boost the performance of product by maintain quality standards. It includes elements such as define product quality, implement quality management system, keep eye on competition etc.Pitch your topic with ease and precision using this Sales Performance Evaluation Dashboard To Track Revenue Summary Pdf This layout presents information on Sales Campaign, Product Revenue, Cost Good Sold It is also available for immediate download and adjustment. So, changes can be made in the color, design, graphics or any other component to create a unique layout. This slide showcase various ways to boost the performance of product by maintain quality standards. It includes elements such as define product quality, implement quality management system, keep eye on competition etc.
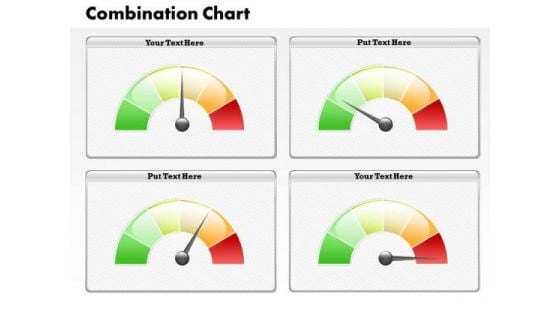
Sales Diagram Dashboard Meter For Business Information Business Diagram
Our Sales Diagram Dashboard Meter For Business Information Business Diagram Powerpoint Templates Deliver At Your Doorstep. Let Them In For A Wonderful Experience.
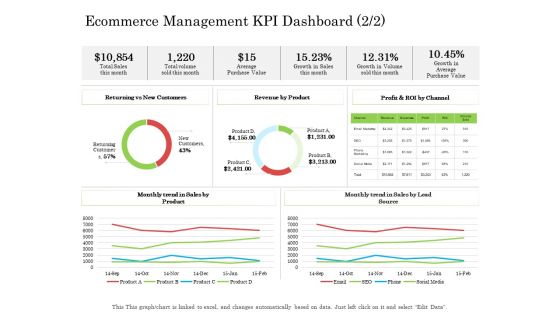
Ecommerce Management KPI Dashboard Ppt Styles Design Ideas PDF
Deliver and pitch your topic in the best possible manner with this ecommerce management kpi dashboard ppt styles design ideas pdf. Use them to share invaluable insights on average purchase value, revenue by product, sales by product and impress your audience. This template can be altered and modified as per your expectations. So, grab it now.
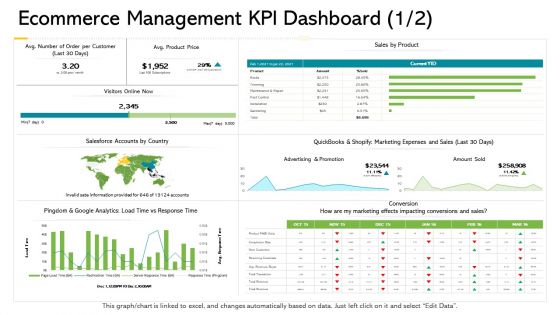
Ecommerce Management KPI Dashboard Last Ppt Professional Graphics Example PDF
Deliver and pitch your topic in the best possible manner with this ecommerce management kpi dashboard last ppt professional graphics example pdf. Use them to share invaluable insights on amount sold, sales by product, product price and impress your audience. This template can be altered and modified as per your expectations. So, grab it now.
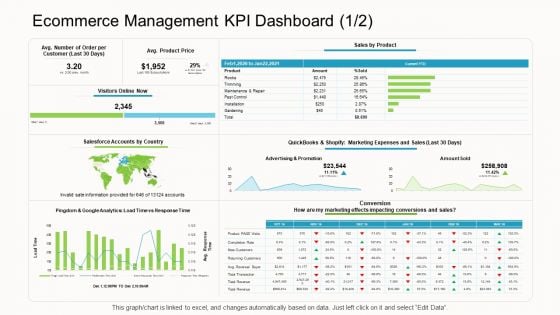
Online Corporate Approach Ecommerce Management KPI Dashboard Avg Topics PDF
Deliver and pitch your topic in the best possible manner with this online corporate approach ecommerce management kpi dashboard avg topics pdf. Use them to share invaluable insights on conversions and sales, product price, sales by product and impress your audience. This template can be altered and modified as per your expectations. So, grab it now.
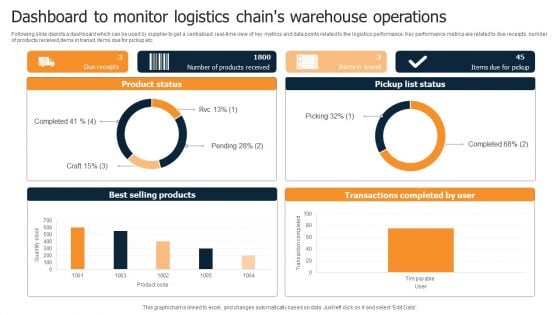
Dashboard To Monitor Logistics Chains Warehouse Operations Diagrams PDF
Following slide depicts a dashboard which can be used by supplier to get a centralized, real-time view of key metrics and data points related to the logistics performance. Key performance metrics are related to due receipts, number of products received,items in transit, items due for pickup etc. Pitch your topic with ease and precision using this Dashboard To Monitor Logistics Chains Warehouse Operations Diagrams PDF. This layout presents information on Product Status, Pickup List Status, Best Selling Products. It is also available for immediate download and adjustment. So, changes can be made in the color, design, graphics or any other component to create a unique layout.

Shopping Cart Conversion Rate Dashboard Ppt Model Graphics PDF
This slide shows shopping cart conversion rate dashboard. It includes details of online revenue share, shipping error rate, shopping cart conversion rate, coupon conversion, product views per session and revenue per visitors. Deliver an awe-inspiring pitch with this creative shopping cart conversion rate dashboard ppt model graphics pdf. bundle. Topics like shopping cart conversion rate, coupon cart conversion, product views per session, revenue per visitors, avg product views can be discussed with this completely editable template. It is available for immediate download depending on the needs and requirements of the user.
Datafy Performance Tracking Dashboard For E-Commerce Website Information PDF
This slide represents the performance tracking dashboard for an e-commerce website by covering the details of visitors and return visitors, total customers and products, the top three products and product categories, and average visit duration and purchase per visit. The best PPT templates are a great way to save time, energy, and resources. Slidegeeks have percent editable powerpoint slides making them incredibly versatile. With these quality presentation templates, you can create a captivating and memorable presentation by combining visually appealing slides and effectively communicating your message. Download Datafy Performance Tracking Dashboard For E-Commerce Website Information PDF from Slidegeeks and deliver a wonderful presentation.
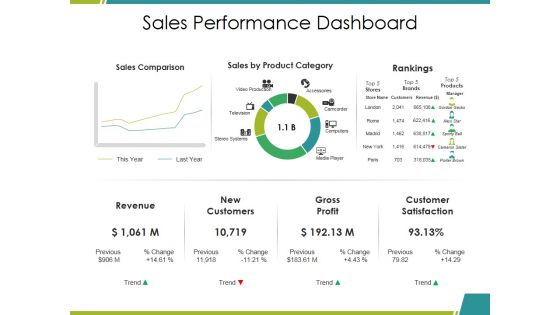
Sales Performance Dashboard Ppt PowerPoint Presentation Infographics Mockup
This is a sales performance dashboard ppt powerpoint presentation infographics mockup. This is a three stage process. The stages in this process are sales comparison, sales by product category, rankings, revenue, gross profit.
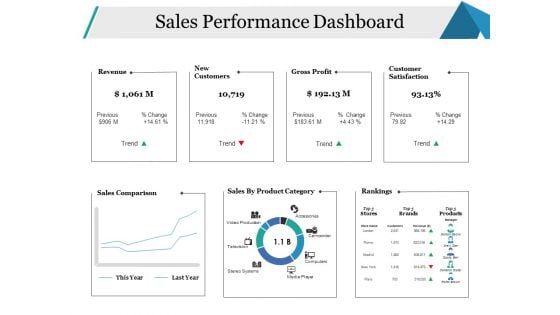
Sales Performance Dashboard Ppt PowerPoint Presentation Gallery Background
This is a sales performance dashboard ppt powerpoint presentation gallery backgroun. This is a six stage process. The stages in this process are sales comparison, sales by product category, rankings, revenue, new customers.
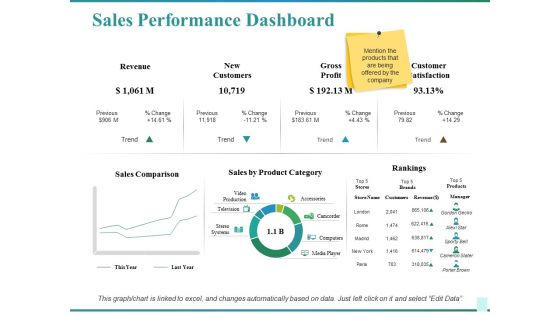
Sales Performance Dashboard Ppt PowerPoint Presentation Show Graphics Design
This is a sales performance dashboard ppt powerpoint presentation show graphics design. This is a two stage process. The stages in this process are sales comparison, sales by product category, rankings, customer satisfaction, revenue.
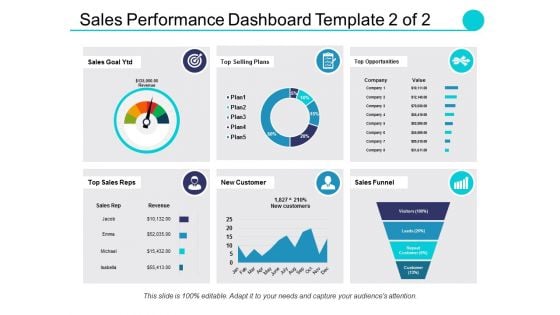
Sales Performance Dashboard Template Ppt PowerPoint Presentation Professional Elements
This is a sales performance dashboard template ppt powerpoint presentation professional elements. This is a eight stage process. The stages in this process are sales comparison, sales by product category, sales by month, brand profitability, revenue.
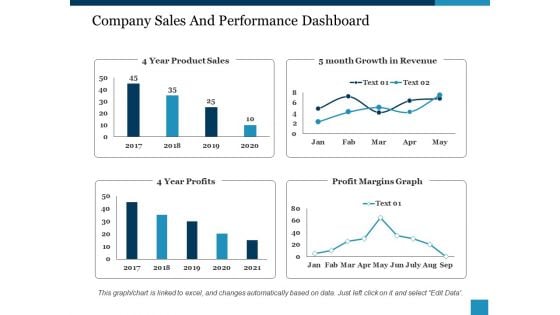
Company Sales And Performance Dashboard Ppt PowerPoint Presentation Show Structure
This is a company sales and performance dashboard ppt powerpoint presentation show structure. This is a four stage process. The stages in this process are year product sales, month growth in revenue, profit margins graph, year profits.
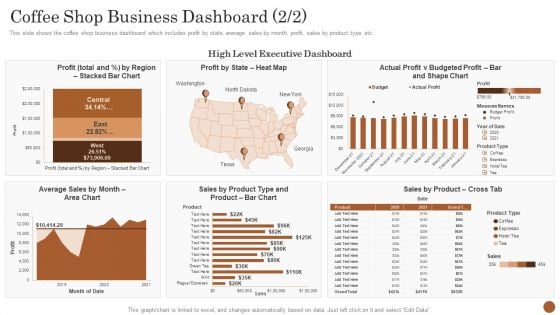
Business Model Opening Restaurant Coffee Shop Business Dashboard Inspiration PDF
This slide shows the coffee shop business dashboard which includes profit by state, average sales by month, profit, sales by product type, etc. Deliver and pitch your topic in the best possible manner with this business model opening restaurant coffee shop business dashboard inspiration pdf. Use them to share invaluable insights on profit v budgeted, average sales, sales by product and impress your audience. This template can be altered and modified as per your expectations. So, grab it now.
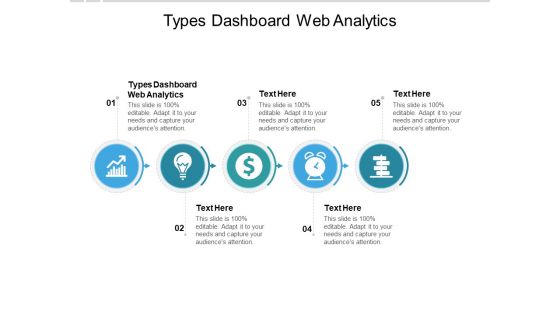
Types Dashboard Web Analytics Ppt PowerPoint Presentation Summary Layout Cpb
Presenting this set of slides with name types dashboard web analytics ppt powerpoint presentation summary layout cpb. This is an editable Powerpoint five stages graphic that deals with topics like types dashboard web analytics to help convey your message better graphically. This product is a premium product available for immediate download and is 100 percent editable in Powerpoint. Download this now and use it in your presentations to impress your audience.
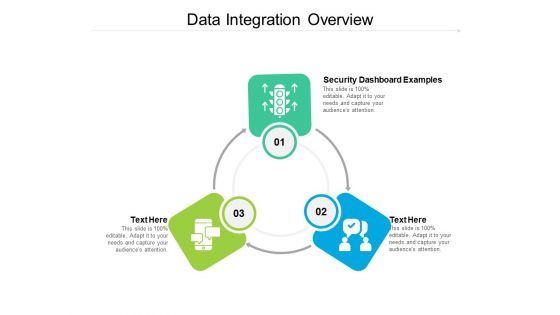
Security Dashboard Examples Ppt PowerPoint Presentation Infographics Background Cpb Pdf
Presenting this set of slides with name security dashboard examples ppt powerpoint presentation infographics background cpb pdf. This is an editable Powerpoint three stages graphic that deals with topics like security dashboard examples to help convey your message better graphically. This product is a premium product available for immediate download and is 100 percent editable in Powerpoint. Download this now and use it in your presentations to impress your audience.
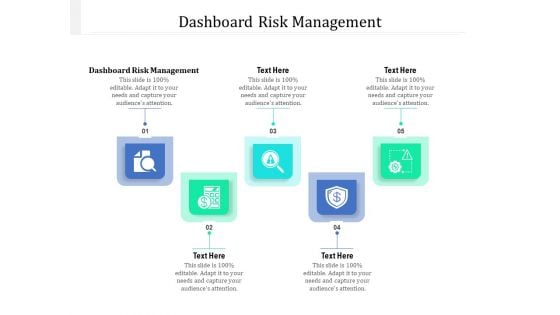
Dashboard Risk Management Ppt PowerPoint Presentation Infographics Guide Cpb Pdf
Presenting this set of slides with name dashboard risk management ppt powerpoint presentation infographics guide cpb pdf. This is an editable Powerpoint five stages graphic that deals with topics like dashboard risk management to help convey your message better graphically. This product is a premium product available for immediate download and is 100 percent editable in Powerpoint. Download this now and use it in your presentations to impress your audience.
Online Business Simulation Dashboard For Practicing Marketing Strategies Icons PDF
This slide shows business simulation dashboard for strengthening marketing strategy practice. It provides information about marketing mix, budget, product allocation, time allocation, etc. Showcasing this set of slides titled Online Business Simulation Dashboard For Practicing Marketing Strategies Icons PDF. The topics addressed in these templates are Marketing Budget, Product Allocation, Marketing Team Size. All the content presented in this PPT design is completely editable. Download it and make adjustments in color, background, font etc. as per your unique business setting.
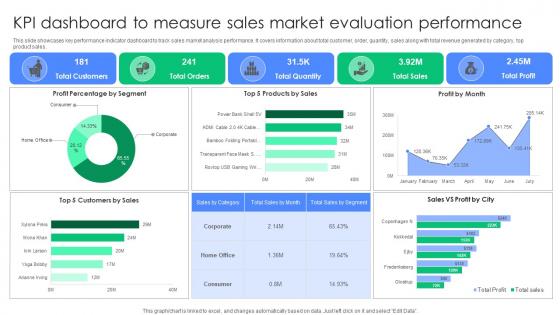
KPI Dashboard To Measure Sales Market Evaluation Performance Summary Pdf
This slide showcases key performance indicator dashboard to track sales market analysis performance. It covers information about total customer, order, quantity, sales along with total revenue generated by category, top product sales. Pitch your topic with ease and precision using this KPI Dashboard To Measure Sales Market Evaluation Performance Summary Pdf. This layout presents information on Profit Percentage Segment, Products Sales, Profit Month. It is also available for immediate download and adjustment. So, changes can be made in the color, design, graphics or any other component to create a unique layout. This slide showcases key performance indicator dashboard to track sales market analysis performance. It covers information about total customer, order, quantity, sales along with total revenue generated by category, top product sales.
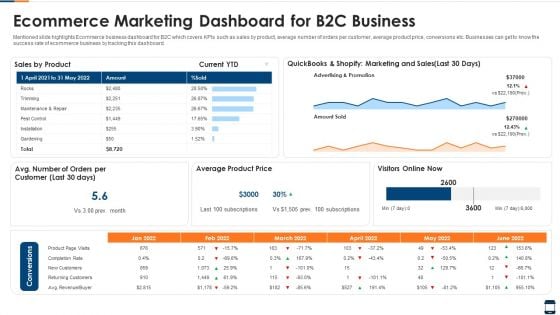
Ecommerce Marketing Dashboard For B2C Business Information PDF
Mentioned slide highlights Ecommerce business dashboard for B2C which covers KPIs such as sales by product, average number of orders per customer, average product price, conversions etc. Businesses can get to know the success rate of ecommerce business by tracking this dashboard. Showcasing this set of slides titled ecommerce marketing dashboard for b2c business information pdf. The topics addressed in these templates are ecommerce marketing dashboard for b2c business. All the content presented in this PPT design is completely editable. Download it and make adjustments in color, background, font etc. as per your unique business setting.
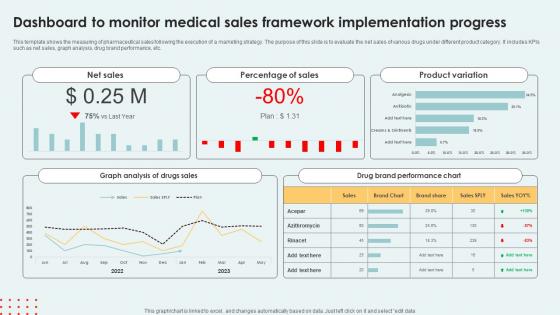
Dashboard To Monitor Medical Sales Framework Implementation Progress Formats Pdf
This template shows the measuring of pharmaceutical sales following the execution of a marketing strategy. The purpose of this slide is to evaluate the net sales of various drugs under different product category. It includes KPIs such as net sales, graph analysis, drug brand performance, etc. Showcasing this set of slides titled Dashboard To Monitor Medical Sales Framework Implementation Progress Formats Pdf The topics addressed in these templates are Percentage Sales, Product Variation, Brand Performance Chart All the content presented in this PPT design is completely editable. Download it and make adjustments in color, background, font etc. as per your unique business setting. This template shows the measuring of pharmaceutical sales following the execution of a marketing strategy. The purpose of this slide is to evaluate the net sales of various drugs under different product category. It includes KPIs such as net sales, graph analysis, drug brand performance, etc.
Business Performance Dashboard Icon Ppt PowerPoint Presentation File Images
This is a business performance dashboard icon ppt powerpoint presentation file images. This is a five stage process. The stages in this process are production management, production performance, production improvement.
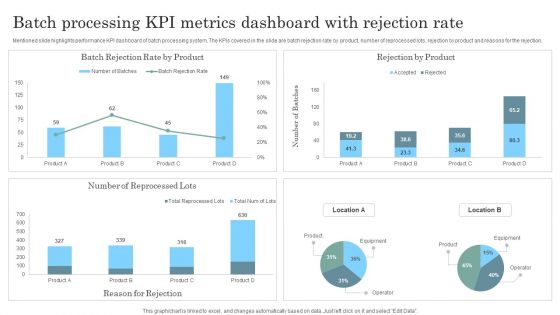
Batch Processing KPI Metrics Dashboard With Rejection Rate Topics PDF
Mentioned slide highlights performance KPI dashboard of batch processing system. The KPIs covered in the slide are batch rejection rate by product, number of reprocessed lots, rejection by product and reasons for the rejection. Pitch your topic with ease and precision using this Batch Processing KPI Metrics Dashboard With Rejection Rate Topics PDF. This layout presents information on Batch Processing KPI Metrics, Dashboard Rejection Rate. It is also available for immediate download and adjustment. So, changes can be made in the color, design, graphics or any other component to create a unique layout.
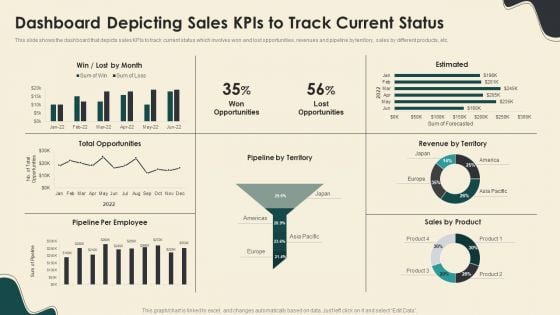
Dashboard Depicting Sales Kpis To Track Current Status Structure PDF
This slide shows the dashboard that depicts sales KPIs to track current status which involves won and lost opportunities, revenues and pipeline by territory, sales by different products, etc. Deliver and pitch your topic in the best possible manner with this Dashboard Depicting Sales Kpis To Track Current Status Structure PDF. Use them to share invaluable insights on Total Opportunities, Revenue By Territory, Sales By Product and impress your audience. This template can be altered and modified as per your expectations. So, grab it now.
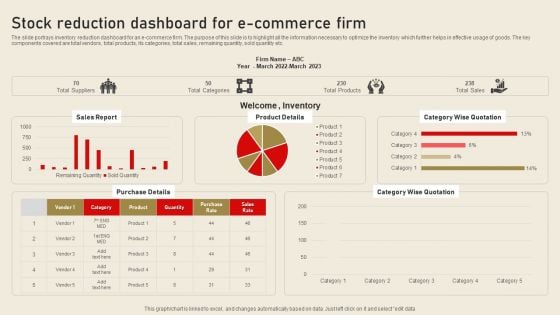
Stock Reduction Dashboard For E Commerce Firm Ideas PDF
The slide portrays inventory reduction dashboard for an e commerce firm. The purpose of this slide is to highlight all the information necessary to optimize the inventory which further helps in effective usage of goods. The key components covered are total vendors, total products, its categories, total sales, remaining quantity, sold quantity etc. Showcasing this set of slides titled Stock Reduction Dashboard For E Commerce Firm Ideas PDF. The topics addressed in these templates are Sales Report, Product Details, Category Wise Quotation. All the content presented in this PPT design is completely editable. Download it and make adjustments in color, background, font etc. as per your unique business setting.
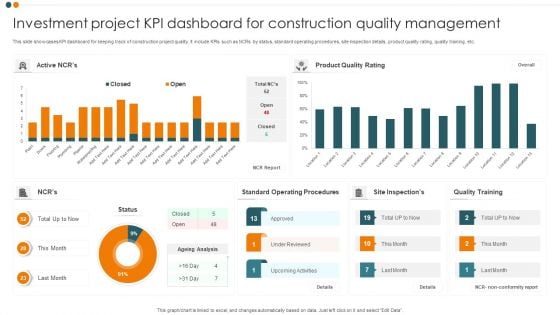
Investment Project KPI Dashboard For Construction Quality Management Pictures PDF
This slide showcases KPI dashboard for keeping track of construction project quality. It include KPIs such as NCRs by status, standard operating procedures, site inspection details, product quality rating, quality training, etc. Showcasing this set of slides titled Investment Project KPI Dashboard For Construction Quality Management Pictures PDF. The topics addressed in these templates are Product Quality Rating, Standard Operating Procedures, Quality Training. All the content presented in this PPT design is completely editable. Download it and make adjustments in color, background, font etc. as per your unique business setting.

Business Operations Dashboard Ppt PowerPoint Presentation Styles Pictures PDF
This slide shows dashboard for measuring business operations. It includes details of total production, weekly average production, scrap and scrap average in each production line. It also covers daily production statistics, production trend, project summary, events and distribution.Deliver an awe-inspiring pitch with this creative business operations dashboard ppt powerpoint presentation styles pictures pdf. bundle. Topics like production trend, daily production, production summary, distribution can be discussed with this completely editable template. It is available for immediate download depending on the needs and requirements of the user.
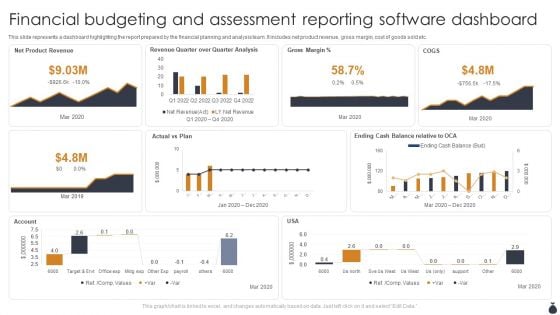
Financial Budgeting And Assessment Reporting Software Dashboard Template PDF
This slide represents a dashboard highlighting the report prepared by the financial planning and analysis team. It includes net product revenue, gross margin, cost of goods sold etc. Showcasing this set of slides titled Financial Budgeting And Assessment Reporting Software Dashboard Template PDF. The topics addressed in these templates are Net Product Revenue, Actual Vs Plan, Account. All the content presented in this PPT design is completely editable. Download it and make adjustments in color, background, font etc. as per your unique business setting.
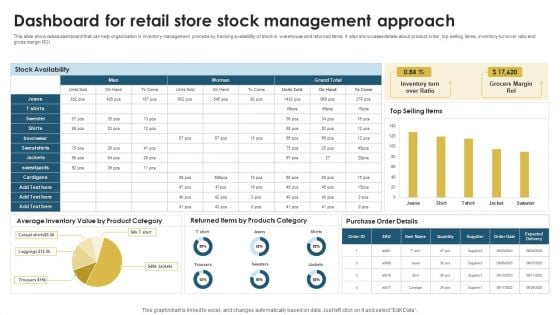
Dashboard For Retail Store Stock Management Approach Portrait PDF
This slide showcases dashboard that can help organization in inventory management process by tracking availability of stock in warehouse and returned items. It also showcases details about product order, top selling items, inventory turnover ratio and gross margin ROI. Showcasing this set of slides titled Dashboard For Retail Store Stock Management Approach Portrait PDF. The topics addressed in these templates are Average Inventory, Product Category, Inventory Turn. All the content presented in this PPT design is completely editable. Download it and make adjustments in color, background, font etc. as per your unique business setting.
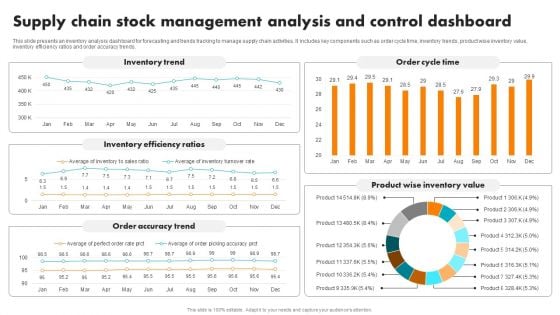
Supply Chain Stock Management Analysis And Control Dashboard Brochure PDF
This slide presents an inventory analysis dashboard for forecasting and trends tracking to manage supply chain activities. It includes key components such as order cycle time, inventory trends, product wise inventory value, inventory efficiency ratios and order accuracy trends. Pitch your topic with ease and precision using this Supply Chain Stock Management Analysis And Control Dashboard Brochure PDF. This layout presents information on Inventory Trend, Inventory Efficiency Ratios, Order Accuracy Trend, Order Cycle Time, Product Wise Inventory Value. It is also available for immediate download and adjustment. So, changes can be made in the color, design, graphics or any other component to create a unique layout.
IT Project Management Progress Tracking KPI Dashboard Template PDF
This slide provides IT project development dashboard which helps managers performance status. It provides information regarding team velocity, work in story points, product estimation status, closed story point vs epic story point and pending story points. Showcasing this set of slides titled IT Project Management Progress Tracking KPI Dashboard Template PDF. The topics addressed in these templates are Team Velocity, Product Estimation Status, Pending Story Points. All the content presented in this PPT design is completely editable. Download it and make adjustments in color, background, font etc. as per your unique business setting.


 Continue with Email

 Home
Home


