Product Data
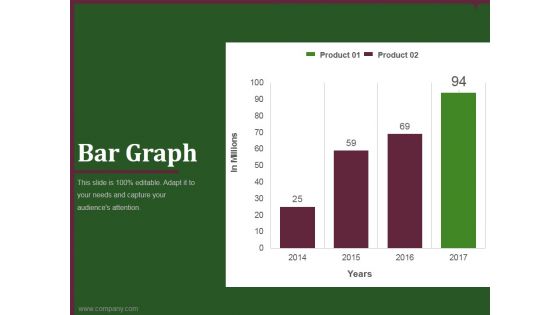
bar graph template 2 ppt powerpoint presentation gallery
This is a bar graph template 2 ppt powerpoint presentation gallery. This is a four stage process. The stages in this process are business, marketing, product, analysis, growth.
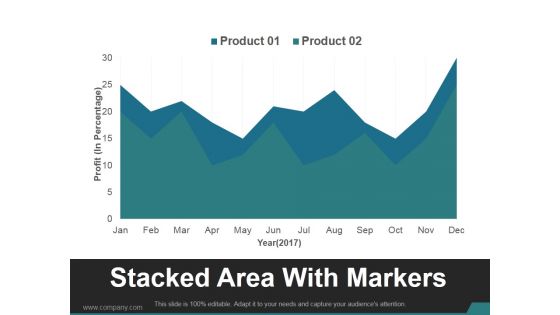
Stacked Area With Markers Ppt PowerPoint Presentation Summary
This is a stacked area with markers ppt powerpoint presentation summary. This is a two stage process. The stages in this process are business, marketing, product, finance, analysis.
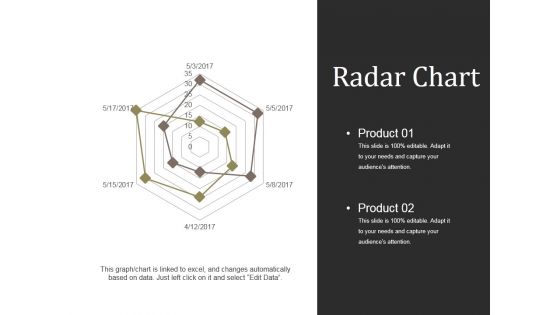
Radar Chart Ppt PowerPoint Presentation Model Picture
This is a radar chart ppt powerpoint presentation model picture. This is a six stage process. The stages in this process are product, finance marketing, business, management, analysis.

Effective Steps Of Text Mining Structure Background Pdf
This slide showcases the effective steps of text mining system which helps an organization to boost research process to test the queries and provide better and faster results. It include details such as information retrieval, natural language processing, etc. Showcasing this set of slides titled Effective Steps Of Text Mining Structure Background Pdf. The topics addressed in these templates are Natural Language Processing, Information Retrieval, Information Extraction. All the content presented in this PPT design is completely editable. Download it and make adjustments in color, background, font etc. as per your unique business setting. This slide showcases the effective steps of text mining system which helps an organization to boost research process to test the queries and provide better and faster results. It include details such as information retrieval, natural language processing, etc.
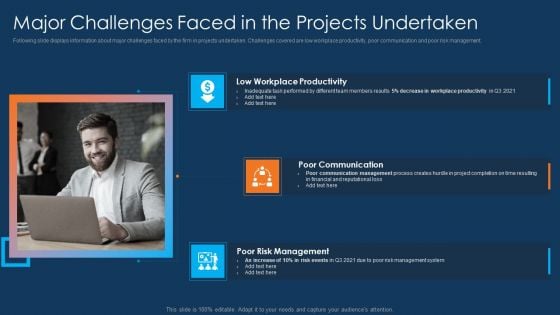
Information Technology Project Initiation Major Challenges Faced In The Projects Undertaken Infographics PDF
Following slide displays information about major challenges faced by the firm in projects undertaken. Challenges covered are low workplace productivity, poor communication and poor risk management. This is a information technology project initiation major challenges faced in the projects undertaken infographics pdf template with various stages. Focus and dispense information on three stages using this creative set, that comes with editable features. It contains large content boxes to add your information on topics like poor communication, low workplace productivity, poor risk management . You can also showcase facts, figures, and other relevant content using this PPT layout. Grab it now.
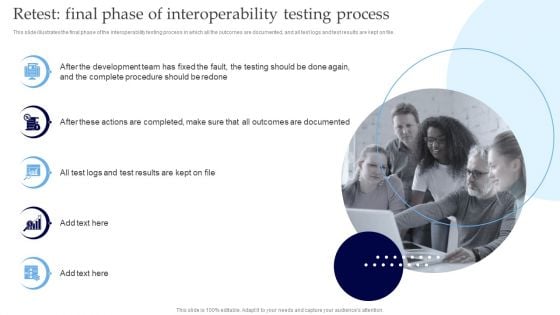
Interoperability Software Testing Retest Final Phase Of Interoperability Testing Process Structure PDF
This slide illustrates the final phase of the interoperability testing process in which all the outcomes are documented, and all test logs and test results are kept on file. The Interoperability Software Testing Retest Final Phase Of Interoperability Testing Process Structure PDF is a compilation of the most recent design trends as a series of slides. It is suitable for any subject or industry presentation, containing attractive visuals and photo spots for businesses to clearly express their messages. This template contains a variety of slides for the user to input data, such as structures to contrast two elements, bullet points, and slides for written information. Slidegeeks is prepared to create an impression.
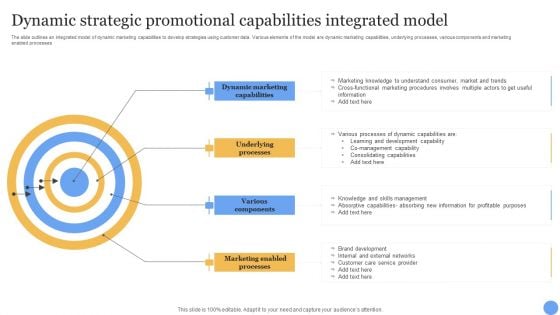
Dynamic Strategic Promotional Capabilities Integrated Model Diagrams PDF
The slide outlines an integrated model of dynamic marketing capabilities to develop strategies using customer data. Various elements of the model are dynamic marketing capabilities, underlying processes, various components and marketing enabled processes. Persuade your audience using this Dynamic Strategic Promotional Capabilities Integrated Model Diagrams PDF. This PPT design covers four stages, thus making it a great tool to use. It also caters to a variety of topics including Dynamic Marketing Capabilities, Underlying Processes, Various Components. Download this PPT design now to present a convincing pitch that not only emphasizes the topic but also showcases your presentation skills.
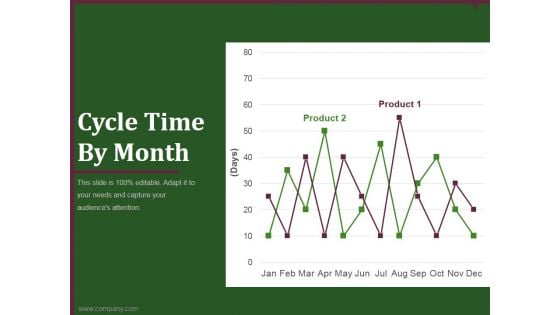
cycle time by month ppt powerpoint presentation introduction
This is a cycle time by month ppt powerpoint presentation introduction. This is a two stage process. The stages in this process are business, marketing, product, analysis, timeline.
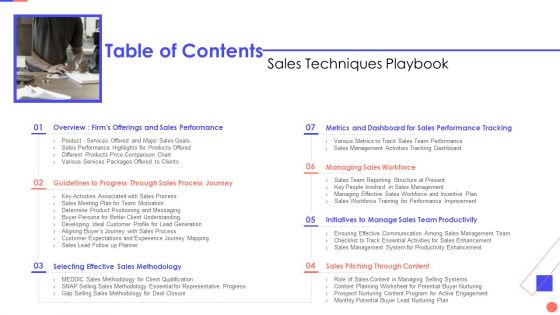
Sales Techniques Playbook Table Of Contents Information PDF
This is a sales techniques playbook table of contents information pdf template with various stages. Focus and dispense information on seven stages using this creative set, that comes with editable features. It contains large content boxes to add your information on topics like sales, methodology, productivity, team. You can also showcase facts, figures, and other relevant content using this PPT layout. Grab it now.
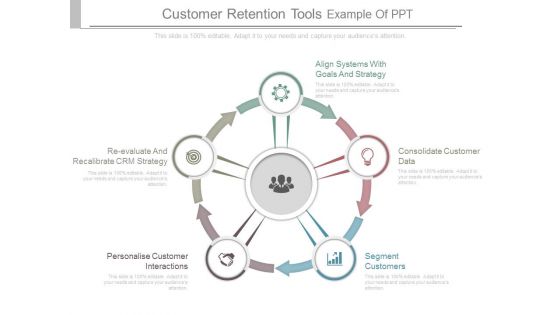
Customer Retention Tools Example Of Ppt
This is a customer retention tools example of ppt. This is a five stage process. The stages in this process are align systems with goals and strategy, consolidate customer data, segment customers, personalise customer interactions, re evaluate and recalibrate crm strategy.
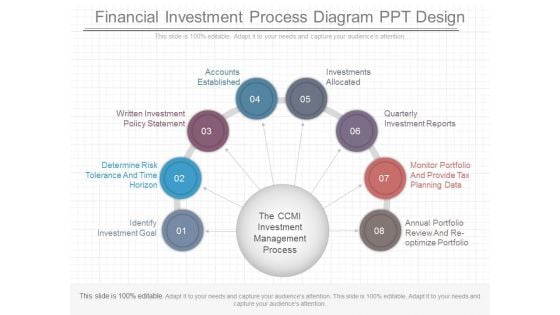
Financial Investment Process Diagram Ppt Design
This is a financial investment process diagram ppt design. This is a eight stage process. The stages in this process are identify investment goal, determine risk tolerance and time horizon, written investment policy statement, accounts established, investments allocated, quarterly investment reports, monitor portfolio and provide tax planning data, annual portfolio review and re optimize portfolio.
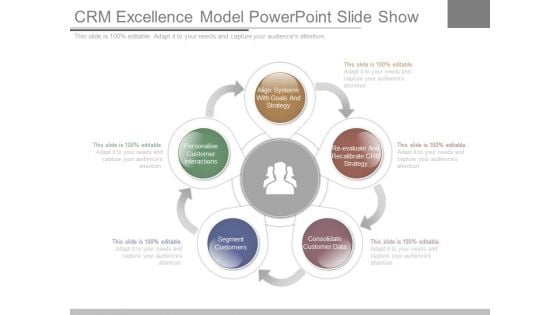
Crm Excellence Model Powerpoint Slide Show
This is a crm excellence model powerpoint slide show. This is a five stage process. The stages in this process are align systems with goals and strategy, re evaluate and recalibrate crm strategy, consolidate customer data, personalise customer interactions, segment customers.
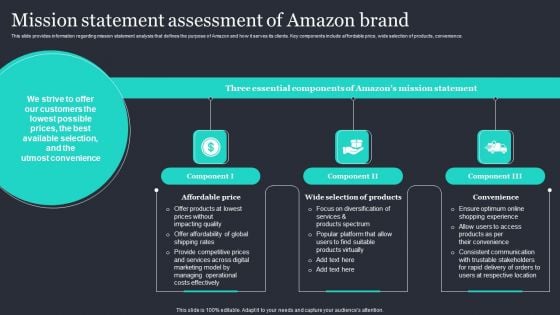
Amazon Strategic Growth Initiative On Global Scale Mission Statement Assessment Of Amazon Brand Download PDF
This slide provides information regarding mission statement analysis that defines the purpose of Amazon and how it serves its clients. Key components include affordable price, wide selection of products, convenience. The Amazon Strategic Growth Initiative On Global Scale Mission Statement Assessment Of Amazon Brand Download PDF is a compilation of the most recent design trends as a series of slides. It is suitable for any subject or industry presentation, containing attractive visuals and photo spots for businesses to clearly express their messages. This template contains a variety of slides for the user to input data, such as structures to contrast two elements, bullet points, and slides for written information. Slidegeeks is prepared to create an impression.

Client Testimonials Manufacturing Control Software Company Investor PPT Presentation
This slide caters to the details related to the clients feedback based on their experiences. It consists of information about a company that provides solutions to manufacturers unique problems, creating secure, well-designed solutions, and generating data-driven insights. Create an editable Client Testimonials Manufacturing Control Software Company Investor PPT Presentation that communicates your idea and engages your audience. Whether you are presenting a business or an educational presentation, pre-designed presentation templates help save time. Client Testimonials Manufacturing Control Software Company Investor PPT Presentation is highly customizable and very easy to edit, covering many different styles from creative to business presentations. Slidegeeks has creative team members who have crafted amazing templates. So, go and get them without any delay. This slide caters to the details related to the clients feedback based on their experiences. It consists of information about a company that provides solutions to manufacturers unique problems, creating secure, well-designed solutions, and generating data-driven insights.

Monthly Goals Ppt Powerpoint Presentation Complete Deck With Slides
If designing a presentation takes a lot of your time and resources and you are looking for a better alternative, then this Monthly Goals Ppt Powerpoint Presentation Complete Deck With Slides is the right fit for you. This is a prefabricated set that can help you deliver a great presentation on the topic. All the eighteen slides included in this sample template can be used to present a birds-eye view of the topic. These slides are also fully editable, giving you enough freedom to add specific details to make this layout more suited to your business setting. Apart from the content, all other elements like color, design, theme are also replaceable and editable. This helps in designing a variety of presentations with a single layout. Not only this, you can use this PPT design in formats like PDF, PNG, and JPG once downloaded. Therefore, without any further ado, download and utilize this sample presentation as per your liking. Our Monthly Goals Ppt Powerpoint Presentation Complete Deck With Slides are topically designed to provide an attractive backdrop to any subject. Use them to look like a presentation pro.
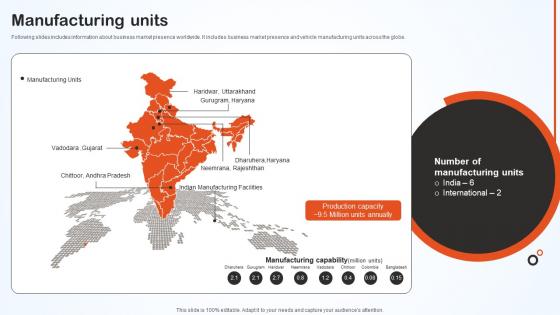
Manufacturing Units Hero Bike Company Profile CP SS V
Following slides includes information about business market presence worldwide. It includes business market presence and vehicle manufacturing units across the globe. The Manufacturing Units Hero Bike Company Profile CP SS V is a compilation of the most recent design trends as a series of slides. It is suitable for any subject or industry presentation, containing attractive visuals and photo spots for businesses to clearly express their messages. This template contains a variety of slides for the user to input data, such as structures to contrast two elements, bullet points, and slides for written information. Slidegeeks is prepared to create an impression. Following slides includes information about business market presence worldwide. It includes business market presence and vehicle manufacturing units across the globe.
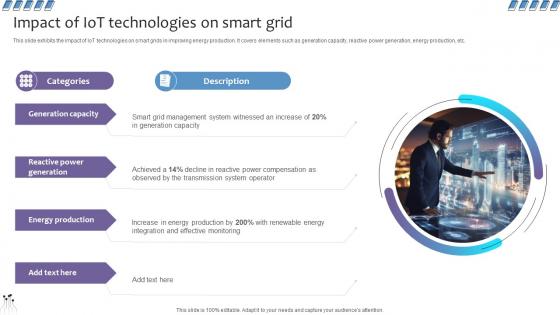
Empowering The Future Impact Of IoT Technologies On Smart Grid IoT SS V
This slide exhibits the impact of IoT technologies on smart grids in improving energy production. It covers elements such as generation capacity, reactive power generation, energy production, etc. Coming up with a presentation necessitates that the majority of the effort goes into the content and the message you intend to convey. The visuals of a PowerPoint presentation can only be effective if it supplements and supports the story that is being told. Keeping this in mind our experts created Empowering The Future Impact Of IoT Technologies On Smart Grid IoT SS V to reduce the time that goes into designing the presentation. This way, you can concentrate on the message while our designers take care of providing you with the right template for the situation. This slide exhibits the impact of IoT technologies on smart grids in improving energy production. It covers elements such as generation capacity, reactive power generation, energy production, etc.
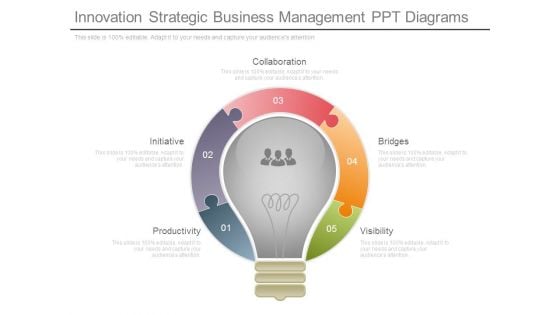
Innovation Strategic Business Management Ppt Diagrams
This is a innovation strategic business management ppt diagrams. This is a five stage process. The stages in this process are productivity, initiative, collaboration, bridges, visibility.
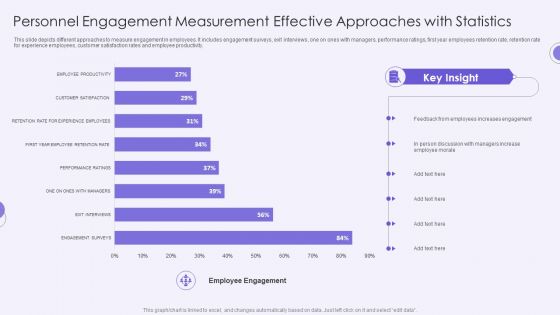
Personnel Engagement Measurement Effective Approaches With Statistics Structure PDF
This slide depicts different approaches to measure engagement in employees. It includes engagement surveys, exit interviews, one on ones with managers, performance ratings, first year employees retention rate, retention rate for experience employees, customer satisfaction rates and employee productivity. Pitch your topic with ease and precision using this Personnel Engagement Measurement Effective Approaches With Statistics Structure PDF. This layout presents information on Employees Increases, Person Discussion, Employee Morale. It is also available for immediate download and adjustment. So, changes can be made in the color, design, graphics or any other component to create a unique layout.
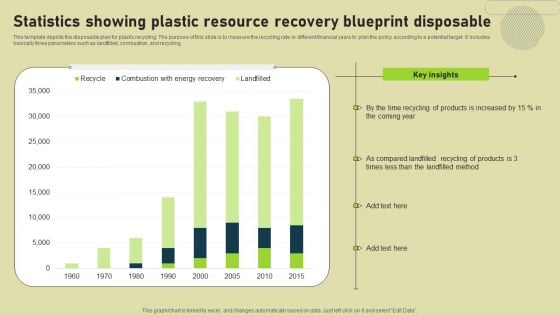
Statistics Showing Plastic Resource Recovery Blueprint Disposable Elements PDF
This template depicts the disposable plan for plastic recycling. The purpose of this slide is to measure the recycling rate in different financial years to plan the policy according to a potential target. It includes basically three parameters such as landfilled, combustion, and recycling. Pitch your topic with ease and precision using this Statistics Showing Plastic Resource Recovery Blueprint Disposable Elements PDF. This layout presents information on Products, Key Insights, Resource Recovery Blueprint Disposable. It is also available for immediate download and adjustment. So, changes can be made in the color, design, graphics or any other component to create a unique layout.
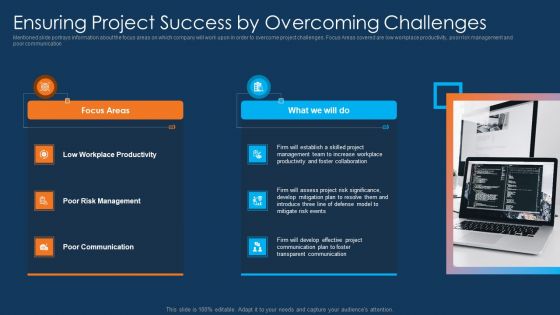
Information Technology Project Initiation Ensuring Project Success By Overcoming Challenges Structure PDF
Mentioned slide portrays information about the focus areas on which company will work upon in order to overcome project challenges. Focus Areas covered are low workplace productivity, poor risk management and poor communication This is a information technology project initiation ensuring project success by overcoming challenges structure pdf template with various stages. Focus and dispense information on two stages using this creative set, that comes with editable features. It contains large content boxes to add your information on topics like low workplace productivity, poor risk management, poor communication, focus areas. You can also showcase facts, figures, and other relevant content using this PPT layout. Grab it now.
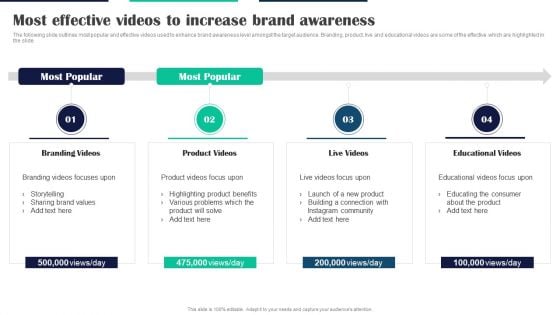
Executing Video Promotional Most Effective Videos To Increase Brand Awareness Graphics PDF
The following slide outlines most popular and effective videos used to enhance brand awareness level amongst the target audience. Branding, product, live and educational videos are some of the effective which are highlighted in the slide. The Executing Video Promotional Most Effective Videos To Increase Brand Awareness Graphics PDF is a compilation of the most recent design trends as a series of slides. It is suitable for any subject or industry presentation, containing attractive visuals and photo spots for businesses to clearly express their messages. This template contains a variety of slides for the user to input data, such as structures to contrast two elements, bullet points, and slides for written information. Slidegeeks is prepared to create an impression.
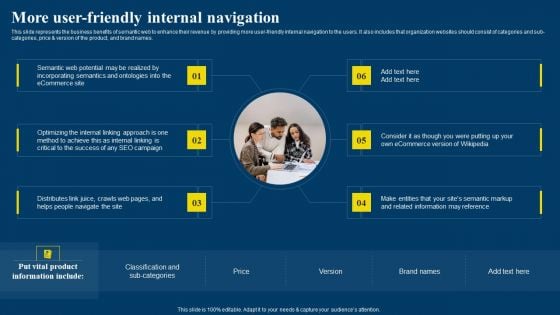
Semantic Web Business Framework Advantages IT More User Friendly Internal Navigation Elements PDF
This slide represents the business benefits of semantic web to enhance their revenue by providing more user-friendly internal navigation to the users. It also includes that organization websites should consist of categories and sub-categories, price and version of the product, and brand names. The Semantic Web Business Framework Advantages IT More User Friendly Internal Navigation Elements PDF is a compilation of the most recent design trends as a series of slides. It is suitable for any subject or industry presentation, containing attractive visuals and photo spots for businesses to clearly express their messages. This template contains a variety of slides for the user to input data, such as structures to contrast two elements, bullet points, and slides for written information. Slidegeeks is prepared to create an impression.
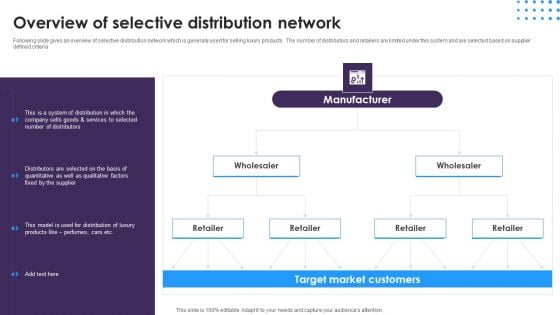
Omnichannel Distribution System To Satisfy Customer Needs Overview Of Selective Distribution Network Introduction PDF
Following slide gives an overview of selective distribution network which is generally used for selling luxury products. The number of distributors and retailers are limited under this system and are selected based on supplier defined criteria. The Omnichannel Distribution System To Satisfy Customer Needs Overview Of Selective Distribution Network Introduction PDF is a compilation of the most recent design trends as a series of slides. It is suitable for any subject or industry presentation, containing attractive visuals and photo spots for businesses to clearly express their messages. This template contains a variety of slides for the user to input data, such as structures to contrast two elements, bullet points, and slides for written information. Slidegeeks is prepared to create an impression.
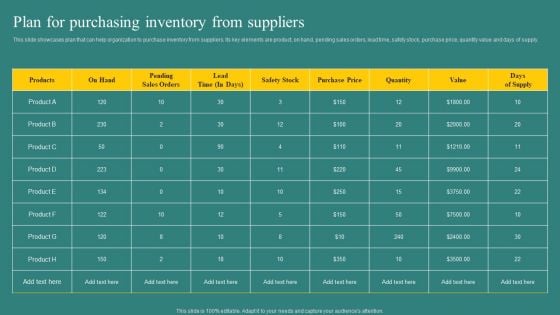
Plan For Purchasing Inventory From Suppliers Mockup PDF
This slide showcases plan that can help organization to purchase inventory from suppliers. Its key elements are product, on hand, pending sales orders, lead time, safety stock, purchase price, quantity value and days of supply. The Plan For Purchasing Inventory From Suppliers Mockup PDF is a compilation of the most recent design trends as a series of slides. It is suitable for any subject or industry presentation, containing attractive visuals and photo spots for businesses to clearly express their messages. This template contains a variety of slides for the user to input data, such as structures to contrast two elements, bullet points, and slides for written information. Slidegeeks is prepared to create an impression.
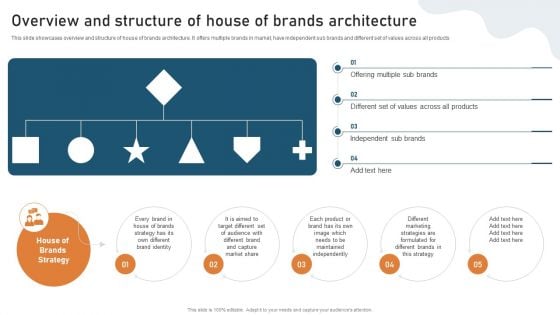
Targeted Market Entry Strategy Overview And Structure Of House Of Brands Architecture Diagrams PDF
This slide showcases overview and structure of house of brands architecture. It offers multiple brands in market, have independent sub brands and different set of values across all products. The Targeted Market Entry Strategy Overview And Structure Of House Of Brands Architecture Diagrams PDF is a compilation of the most recent design trends as a series of slides. It is suitable for any subject or industry presentation, containing attractive visuals and photo spots for businesses to clearly express their messages. This template contains a variety of slides for the user to input data, such as structures to contrast two elements, bullet points, and slides for written information. Slidegeeks is prepared to create an impression.
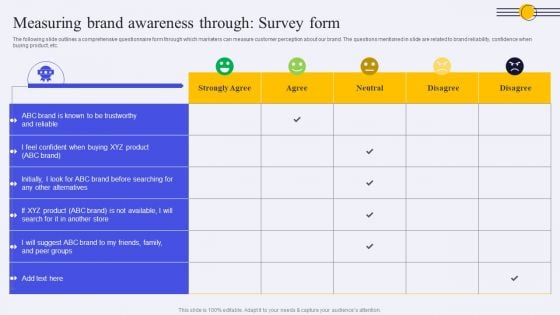
Measuring Brand Awareness Through Survey Form Ppt PowerPoint Presentation Diagram Lists PDF
The following slide outlines a comprehensive questionnaire form through which marketers can measure customer perception about our brand. The questions mentioned in slide are related to brand reliability, confidence when buying product, etc. The Measuring Brand Awareness Through Survey Form Ppt PowerPoint Presentation Diagram Lists PDF is a compilation of the most recent design trends as a series of slides. It is suitable for any subject or industry presentation, containing attractive visuals and photo spots for businesses to clearly express their messages. This template contains a variety of slides for the user to input data, such as structures to contrast two elements, bullet points, and slides for written information. Slidegeeks is prepared to create an impression.
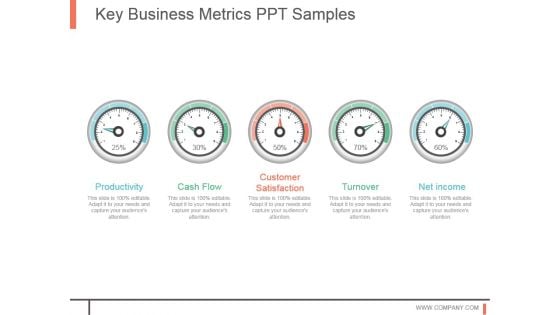
Key Business Metrics Ppt Samples
This is a key business metrics ppt samples. This is a five stage process. The stages in this process are productivity, cash flow, customer satisfaction, turnover, net income.

Our Performance Indicators Powerpoint Themes
This is a our performance indicators powerpoint themes. This is a five stage process. The stages in this process are cash flow, turnover, productivity, customer satisfaction, net income.

Profit Generated By Business Line Powerpoint Slide Ideas
This is a profit generated by business line powerpoint slide ideas. This is a four stage process. The stages in this process are product.
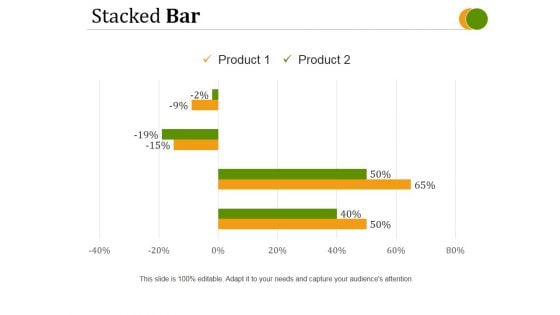
Stacked Bar Template 2 Ppt PowerPoint Presentation Inspiration
This is a stacked bar template 2 ppt powerpoint presentation inspiration. This is a four stage process. The stages in this process are product, business, management, marketing, strategy.
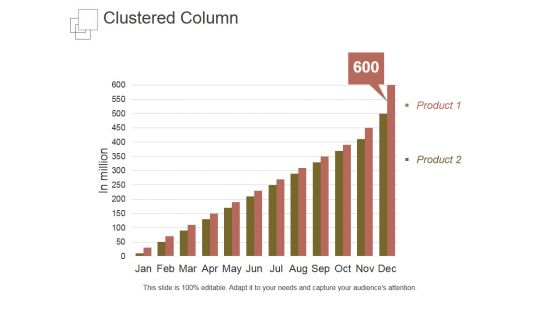
Clustered Column Template 1 Ppt PowerPoint Presentation Pictures
This is a clustered column template 1 ppt powerpoint presentation pictures. This is a one stage process. The stages in this process are product, business, marketing, management, strategy.
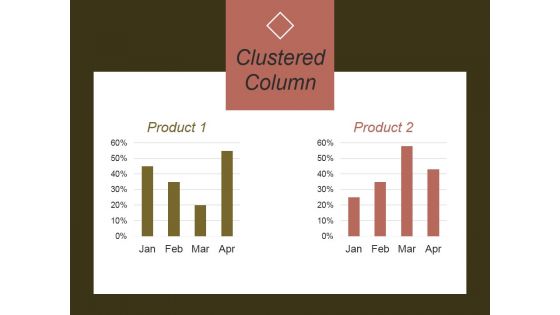
Clustered Column Template 2 Ppt PowerPoint Presentation Example
This is a clustered column template 2 ppt powerpoint presentation example. This is a two stage process. The stages in this process are product, business, marketing, management, strategy.
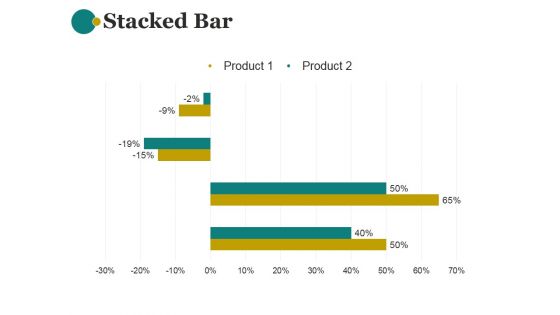
Stacked Bar Template 1 Ppt PowerPoint Presentation Show
This is a stacked bar template 1 ppt powerpoint presentation show. This is a two stage process. The stages in this process are product, planning ,business, management, strategy.
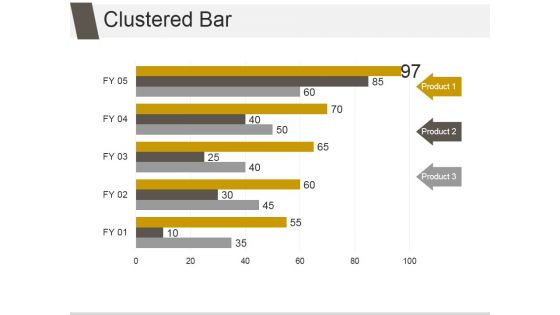
Clustered Bar Ppt PowerPoint Presentation Background Image
This is a clustered bar ppt powerpoint presentation background image. This is a three stage process. The stages in this process are business, marketing, finance, product, management.
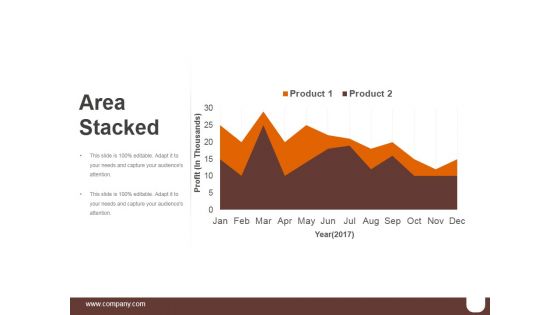
Area Stacked Ppt PowerPoint Presentation Slide
This is a area stacked ppt powerpoint presentation slide. This is a two stage process. The stages in this process are business, marketing, product, finance, area stacked.
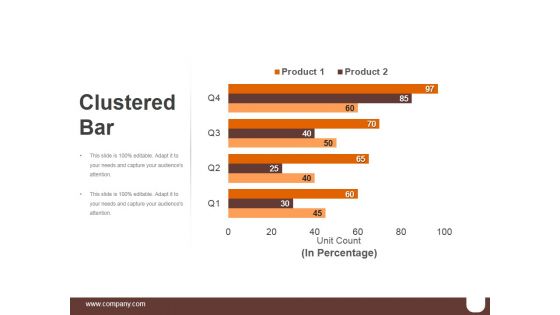
Clustered Bar Ppt PowerPoint Presentation Design Templates
This is a clustered bar ppt powerpoint presentation design templates. This is a four stage process. The stages in this process are business, marketing, finance, product, management.
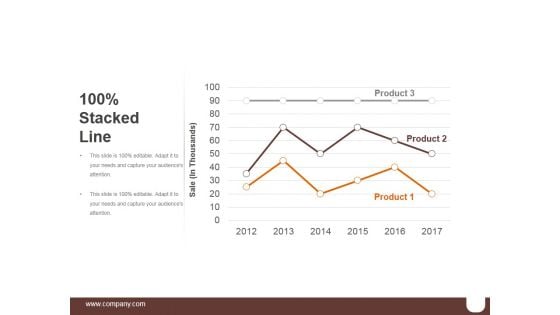
Stacked Line Template Ppt PowerPoint Presentation Examples
This is a stacked line template ppt powerpoint presentation examples. This is a three stage process. The stages in this process are sale, product, business, marketing, success.
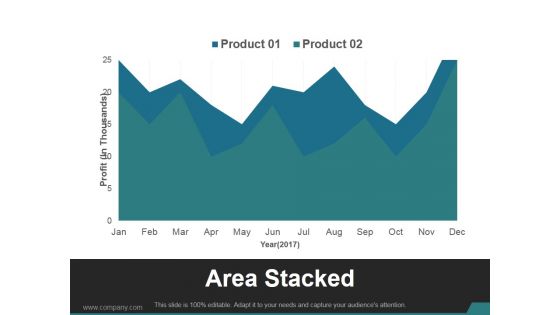
Area Stacked Ppt PowerPoint Presentation Shapes
This is a area stacked ppt powerpoint presentation shapes. This is a two stage process. The stages in this process are business, marketing, product, finance, profit.
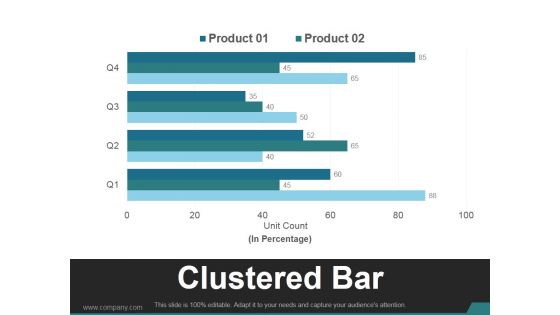
Clustered Bar Ppt PowerPoint Presentation Gallery
This is a clustered bar ppt powerpoint presentation gallery. This is a four stage process. The stages in this process are business, marketing, clustered bar, product, finance.
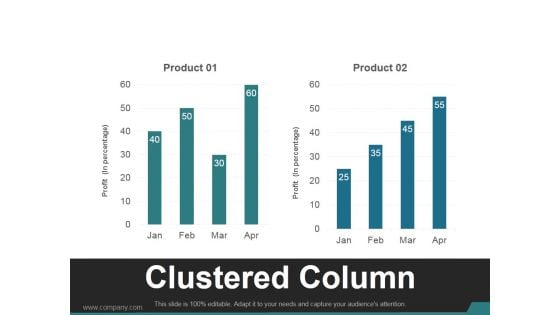
Clustered Column Ppt PowerPoint Presentation Deck
This is a clustered column ppt powerpoint presentation deck. This is a two stage process. The stages in this process are business, marketing, clustered column, product, finance.

Combo Chart Template 1 Ppt PowerPoint Presentation Inspiration
This is a combo chart template 1 ppt powerpoint presentation inspiration. This is a four stage process. The stages in this process are business, marketing, growth, product, finance.
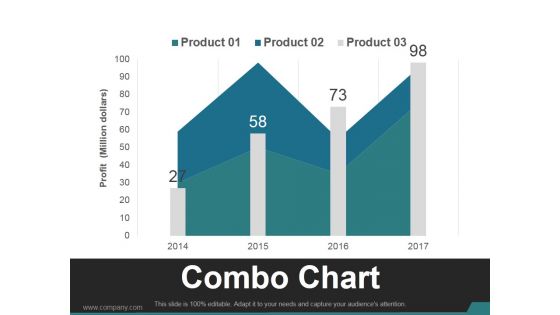
Combo Chart Template 2 Ppt PowerPoint Presentation Guidelines
This is a combo chart template 2 ppt powerpoint presentation guidelines. This is a four stage process. The stages in this process are business, marketing, growth, product, timeline.
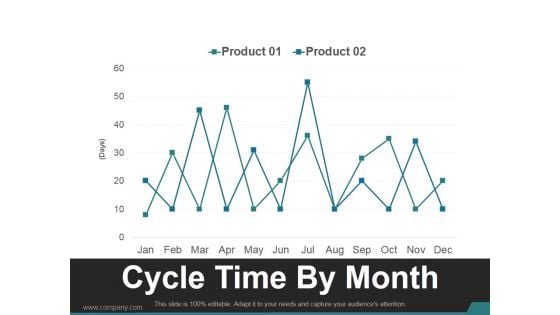
Cycle Time By Month Ppt PowerPoint Presentation Slides
This is a cycle time by month ppt powerpoint presentation slides. This is a two stage process. The stages in this process are business, marketing, finance, product, management.
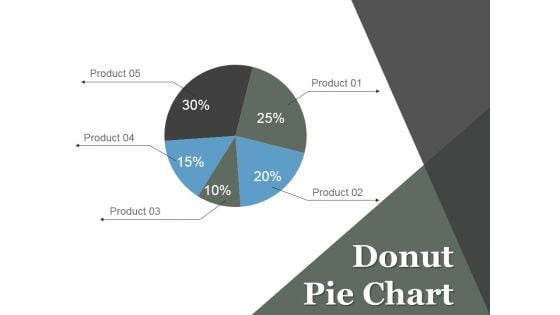
Donut Pie Chart Ppt PowerPoint Presentation Model
This is a donut pie chart ppt powerpoint presentation model. This is a five stage process. The stages in this process are finance, donut, marketing, product, chart, management.
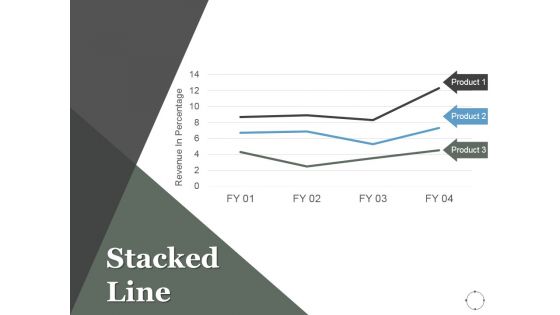
Stacked Line Ppt PowerPoint Presentation Outline
This is a stacked line ppt powerpoint presentation outline. This is a three stage process. The stages in this process are projects, marketing, stacked line, finance, product.
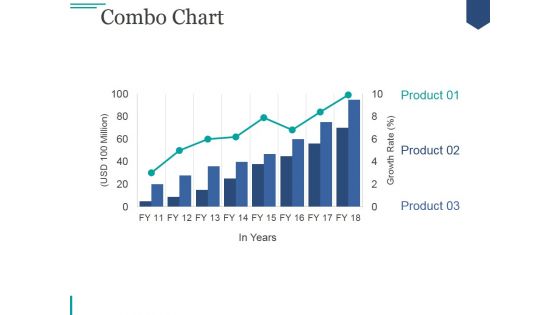
Combo Chart Ppt PowerPoint Presentation Microsoft
This is a combo chart ppt powerpoint presentation microsoft. This is a three stage process. The stages in this process are business, marketing, growth, product, chart.
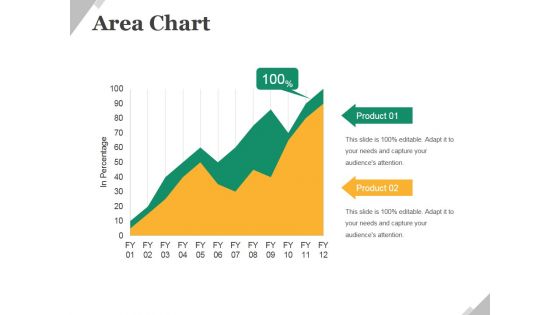
Area Chart Ppt PowerPoint Presentation Show Portfolio
This is a area chart ppt powerpoint presentation show portfolio. This is a two stage process. The stages in this process are business, product, finance, growth, management.
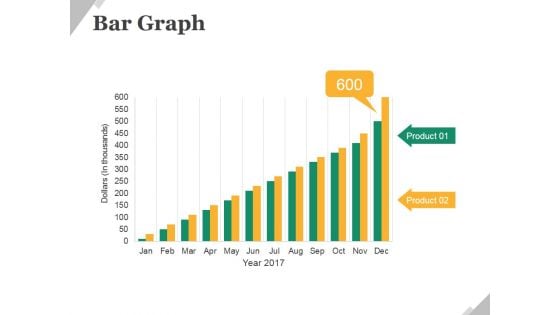
Bar Graph Ppt PowerPoint Presentation Model Layouts
This is a bar graph ppt powerpoint presentation model layouts. This is a two stage process. The stages in this process are business, product, bar graph, growth, management.
Line Chart Ppt PowerPoint Presentation Icon Deck
This is a line chart ppt powerpoint presentation icon deck. This is a two stage process. The stages in this process are business, management, growth, product, finance.
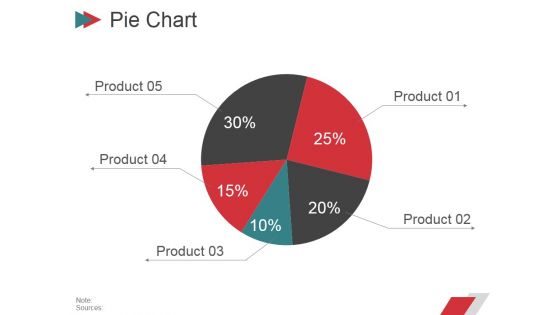
Pie Chart Ppt PowerPoint Presentation Deck
This is a pie chart ppt powerpoint presentation deck. This is a five stage process. The stages in this process are business, pie, finance, percentage, product.
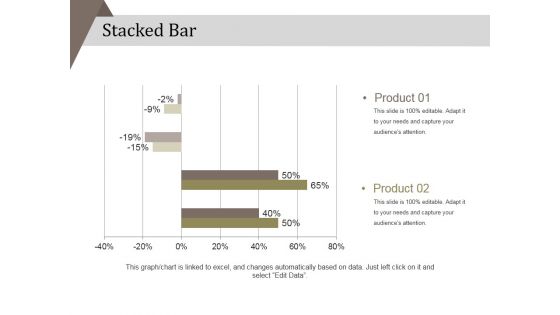
Stacked Bar Ppt PowerPoint Presentation Infographics Inspiration
This is a stacked bar ppt powerpoint presentation infographics inspiration. This is a two stage process. The stages in this process are product, percentage, finance, business, marketing.
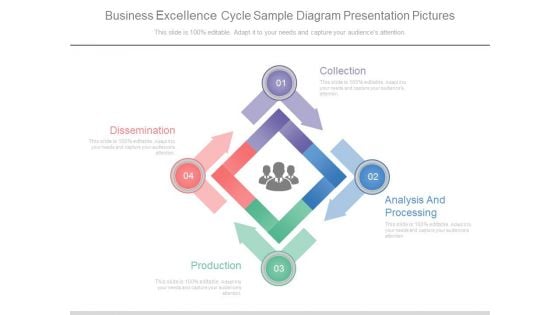
Business Excellence Cycle Sample Diagram Presentation Pictures
This is a business excellence cycle sample diagram presentation pictures. This is a four stage process. The stages in this process are collection, analysis and processing, production, dissemination.
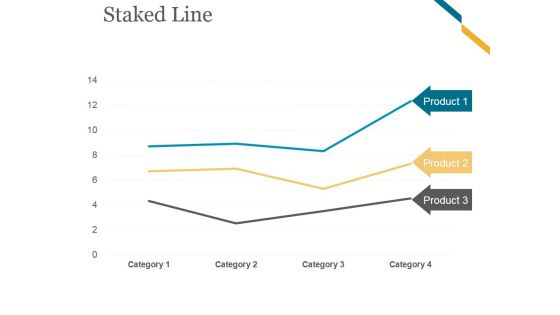
Staked Line Ppt PowerPoint Presentation Designs Download
This is a staked line ppt powerpoint presentation designs download. This is a three stage process. The stages in this process are business, marketing, line chart, analysis, product.
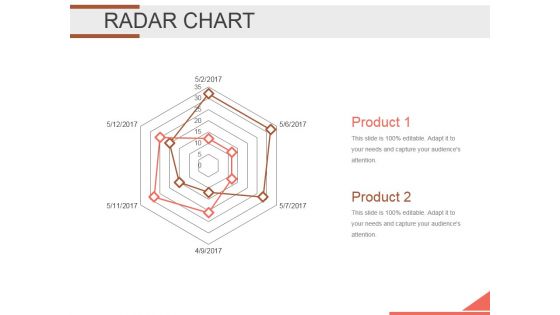
Radar Chart Ppt PowerPoint Presentation Designs Download
This is a radar chart ppt powerpoint presentation designs download. This is a two stage process. The stages in this process are radar chart, management, product, business, analysis.
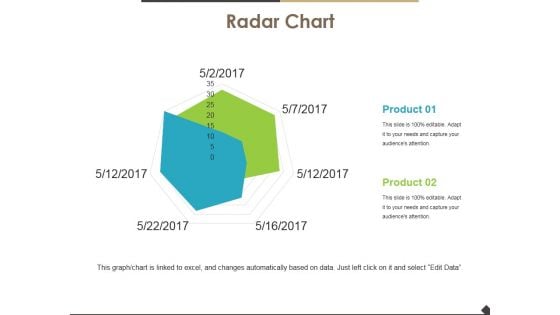
Radar Chart Ppt PowerPoint Presentation Inspiration Layouts
This is a radar chart ppt powerpoint presentation inspiration layouts. This is a two stage process. The stages in this process are radar chart, product, marketing, strategy, analysis.
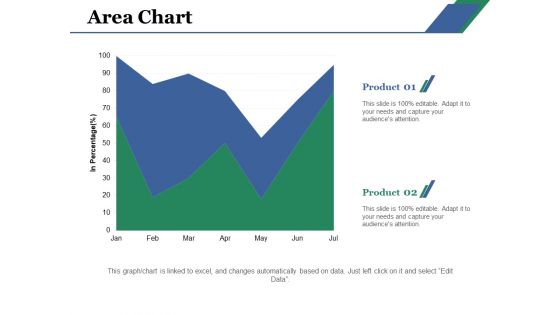
Area Chart Ppt PowerPoint Presentation Layouts Gridlines
This is a area chart ppt powerpoint presentation layouts gridlines. This is a two stage process. The stages in this process are area chart, product, percentage, analysis, capture.
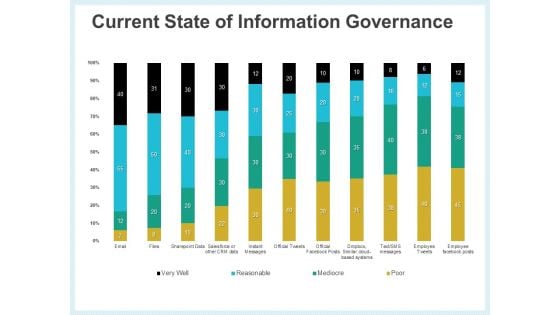
Action Plan Management Infrastructure Current State Of Information Governance Pictures PDF
Deliver an awe-inspiring pitch with this creative action plan management infrastructure current state of information governance pictures pdf bundle. Topics like sharepoint data, employee tweets, current state information governance can be discussed with this completely editable template. It is available for immediate download depending on the needs and requirements of the user.
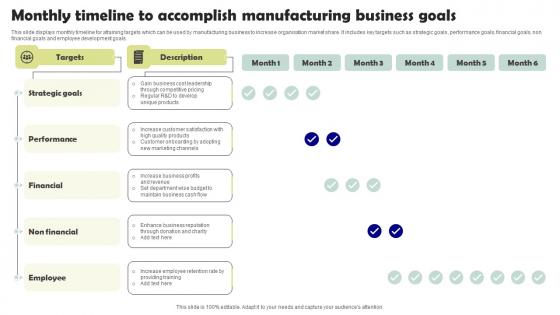
Monthly Timeline To Accomplish Manufacturing Business Goals Formats Pdf
This slide displays monthly timeline for attaining targets which can be used by manufacturing business to increase organisation market share. It includes key targets such as strategic goals, performance goals, financial goals, non financial goals and employee development goals. Showcasing this set of slides titled Monthly Timeline To Accomplish Manufacturing Business Goals Formats Pdf. The topics addressed in these templates are Strategic Goals, Performance, Financial. All the content presented in this PPT design is completely editable. Download it and make adjustments in color, background, font etc. as per your unique business setting. This slide displays monthly timeline for attaining targets which can be used by manufacturing business to increase organisation market share. It includes key targets such as strategic goals, performance goals, financial goals, non financial goals and employee development goals.
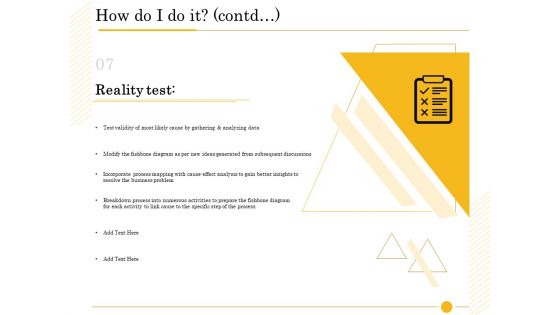
The Fishbone Analysis Tool How Do I Do It Contd Activities Infographics PDF
Deliver an awe-inspiring pitch with this creative the fishbone analysis tool how do i do it contd activities infographics pdf bundle. Topics like gathering analyzing data, modify fishbone diagram, incorporate process mapping, activities prepare, subsequent discussions, specific process can be discussed with this completely editable template. It is available for immediate download depending on the needs and requirements of the user.


 Continue with Email

 Home
Home


