Product Diagram
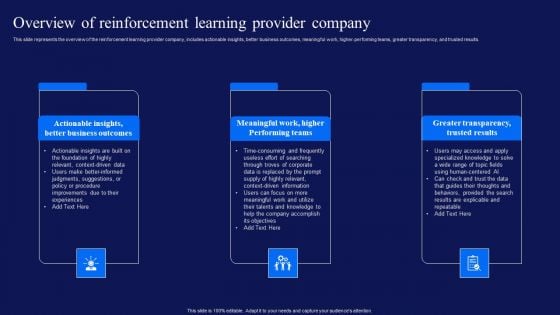
Reinforcement Learning Techniques And Applications Overview Reinforcement Learning Provider Company Diagrams PDF
This slide represents the overview of the reinforcement learning provider company, includes actionable insights, better business outcomes, meaningful work, higher-performing teams, greater transparency, and trusted results. Make sure to capture your audiences attention in your business displays with our gratis customizable Reinforcement Learning Techniques And Applications Overview Reinforcement Learning Provider Company Diagrams PDF. These are great for business strategies, office conferences, capital raising or task suggestions. If you desire to acquire more customers for your tech business and ensure they stay satisfied, create your own sales presentation with these plain slides.
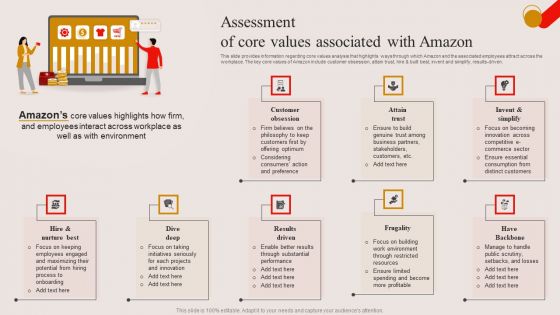
Assessment Of Core Values Associated With Amazon Ppt PowerPoint Presentation File Diagrams PDF
This slide provides information regarding core values analysis that highlights ways through which Amazon and the associated employees attract across the workplace. The key core values of Amazon include customer obsession, attain trust, hire and built best, invent and simplify, results-driven. There are so many reasons you need a Assessment Of Core Values Associated With Amazon Ppt PowerPoint Presentation File Diagrams PDF. The first reason is you cannot spend time making everything from scratch, Thus, Slidegeeks has made presentation templates for you too. You can easily download these templates from our website easily.
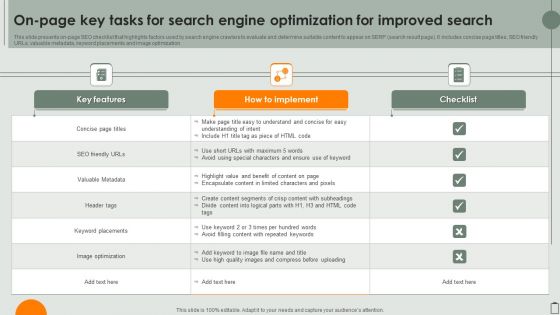
On Page Key Tasks For Search Engine Optimization For Improved Search Diagrams PDF
This slide presents on-page SEO checklist that highlights factors used by search engine crawlers to evaluate and determine suitable content to appear on SERP search result page. It includes concise page titles, SEO friendly URLs, valuable metadata, keyword placements and image optimization. Showcasing this set of slides titled On Page Key Tasks For Search Engine Optimization For Improved Search Diagrams PDF. The topics addressed in these templates are Concise Page Titles, Valuable Metadata, Keyword Placements. All the content presented in this PPT design is completely editable. Download it and make adjustments in color, background, font etc. as per your unique business setting.
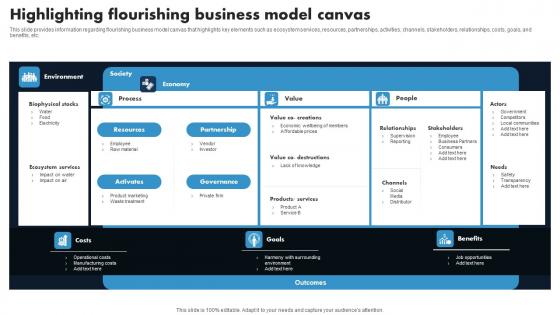
Highlighting Flourishing Business Model Canvas Responsible Tech Guide To Manage Diagrams Pdf
This slide provides information regarding flourishing business model canvas that highlights key elements such as ecosystem services, resources, partnerships, activities, channels, stakeholders, relationships, costs, goals, and benefits, etc. Formulating a presentation can take up a lot of effort and time, so the content and message should always be the primary focus. The visuals of the PowerPoint can enhance the presenters message, so our Highlighting Flourishing Business Model Canvas Responsible Tech Guide To Manage Diagrams Pdf was created to help save time. Instead of worrying about the design, the presenter can concentrate on the message while our designers work on creating the ideal templates for whatever situation is needed. Slidegeeks has experts for everything from amazing designs to valuable content, we have put everything into Highlighting Flourishing Business Model Canvas Responsible Tech Guide To Manage Diagrams Pdf This slide provides information regarding flourishing business model canvas that highlights key elements such as ecosystem services, resources, partnerships, activities, channels, stakeholders, relationships, costs, goals, and benefits, etc.
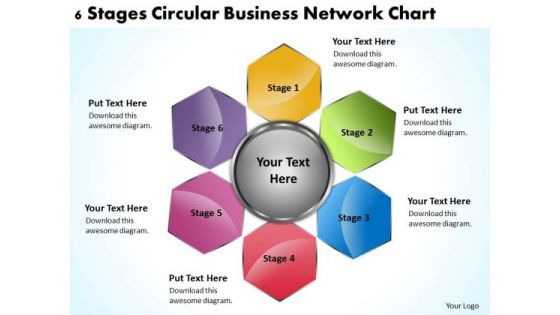
Business Process Flow Diagrams Network Chart PowerPoint Templates Ppt Backgrounds For Slides
We present our business process flow diagrams network chart PowerPoint templates PPT backgrounds for slides.Download and present our Hexagon PowerPoint Templates because you should once Tap the ingenuity of our PowerPoint Templates and Slides. They are programmed to succeed. Use our Business PowerPoint Templates because It can be used to Set your controls for the heart of the sun. Our PowerPoint Templates and Slides will be the propellant to get you there. Download and present our Shapes PowerPoint Templates because Our PowerPoint Templates and Slides will steer your racing mind. Hit the right buttons and spur on your audience. Present our Process and Flows PowerPoint Templates because Your success is our commitment. Our PowerPoint Templates and Slides will ensure you reach your goal. Present our Marketing PowerPoint Templates because Our PowerPoint Templates and Slides will provide the perfect balance. Your weighty ideas will get the ideal impetus.Use these PowerPoint slides for presentations relating to 3d, Abstract, Around, Arrow, Arrow Circles, Chart, Circle, Circular, Circular Arrows, Circular Flow, Circulation, Color, Cycle, Cyclic, Direction, Element, Flow, Glossy, Hexagon, Icon, Illustration, Isolated, Loop, Motion, Movement, Pentagon, Refresh, Ring, Rotation, Round, Section, Set, Shape, Sign, Square, Symbol, Triangle, Vector, Vibrant. The prominent colors used in the PowerPoint template are Red, Blue, Green. The adaptability of our Business Process Flow Diagrams Network Chart PowerPoint Templates Ppt Backgrounds For Slides is a fact. They will align with your bidding.
Incident Management Chart Change Execution Plan Ppt PowerPoint Presentation Icon Diagrams PDF
This slide illustrates the incidents of the transition project. It covers the details such as explanation, status, priority, and resolution of the incident to ensure that technological change is successfully completed in the organization. Deliver and pitch your topic in the best possible manner with this Incident Management Chart Change Execution Plan Ppt PowerPoint Presentation Icon Diagrams PDF. Use them to share invaluable insights on Incident Status Priority, Cyber Attack Sensitive, Added Data Security and impress your audience. This template can be altered and modified as per your expectations. So, grab it now.
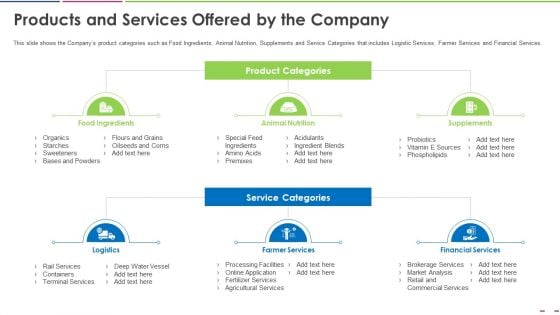
Investor Deck To Increase Grant Funds From Public Corporation Products And Services Offered By The Company Sample PDF
This slide shows the Companys product categories such as Food Ingredients, Animal Nutrition, Supplements and Service Categories that includes Logistic Services, Farmer Services and Financial Services. This is a investor deck to increase grant funds from public corporation products and services offered by the company sample pdf. template with various stages. Focus and dispense information on two stages using this creative set, that comes with editable features. It contains large content boxes to add your information on topics like food ingredients, animal nutrition, product categories, supplements, service categories, financial services. You can also showcase facts, figures, and other relevant content using this PPT layout. Grab it now.
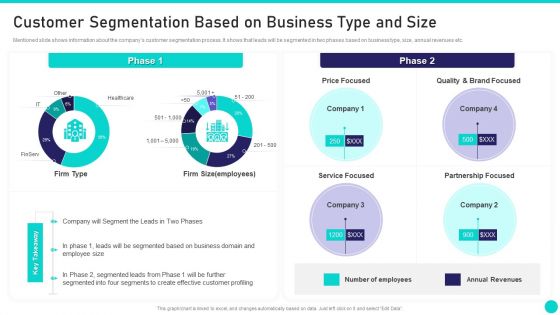
Client Achievements Playbook Customer Segmentation Based On Business Type And Size Diagrams PDF
Mentioned slide shows information about the companys customer segmentation process. It shows that leads will be segmented in two phases based on business type, size, annual revenues etc. Deliver and pitch your topic in the best possible manner with this client achievements playbook customer segmentation based on business type and size diagrams pdf. Use them to share invaluable insights on number employees, annual revenues, partnership focused, service focused and impress your audience. This template can be altered and modified as per your expectations. So, grab it now.
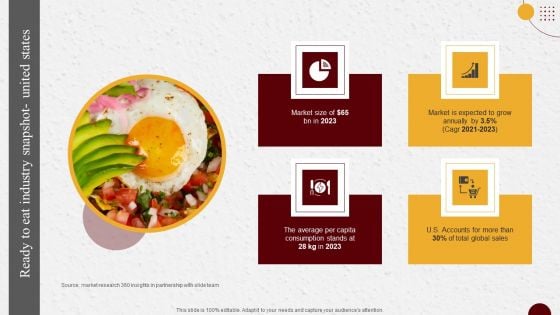
Industry Report Of Packaged Food Products Part 1 Ready To Eat Industry Snapshot United States Elements PDF
Are you searching for a Industry Report Of Packaged Food Products Part 1 Ready To Eat Industry Snapshot United States Elements PDF that is uncluttered, straightforward, and original Its easy to edit, and you can change the colors to suit your personal or business branding. For a presentation that expresses how much effort you have put in, this template is ideal. With all of its features, including tables, diagrams, statistics, and lists, its perfect for a business plan presentation. Make your ideas more appealing with these professional slides. Download Industry Report Of Packaged Food Products Part 1 Ready To Eat Industry Snapshot United States Elements PDF from Slidegeeks today.
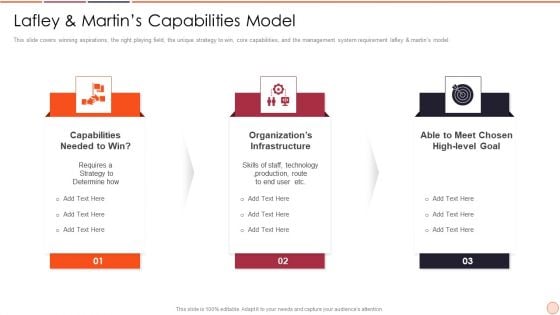
Strategic Business Plan Effective Tools And Templates Set 2 Lafley And Martins Capabilities Model Diagrams PDF
This slide covers winning aspirations, the right playing field, the unique strategy to win, core capabilities, and the management system requirement lafley and martins model. This is a strategic business plan effective tools and templates set 2 lafley and martins capabilities model diagrams pdf template with various stages. Focus and dispense information on three stages using this creative set, that comes with editable features. It contains large content boxes to add your information on topics like capabilities needed to win, organizations infrastructure, able to meet chosen high level goal. You can also showcase facts, figures, and other relevant content using this PPT layout. Grab it now.
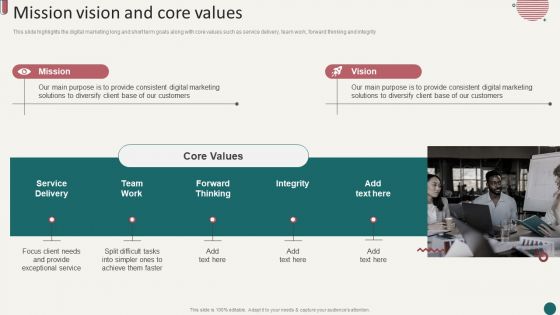
Social Media Marketing Company Profile Mission Vision And Core Values Diagrams PDF
This slide highlights the digital marketing long and short term goals along with core values such as service delivery, team work, forward thinking and integrity. This is a Social Media Marketing Company Profile Mission Vision And Core Values Diagrams PDF template with various stages. Focus and dispense information on one stages using this creative set, that comes with editable features. It contains large content boxes to add your information on topics like Mission, Vision, Core Values. You can also showcase facts, figures, and other relevant content using this PPT layout. Grab it now.
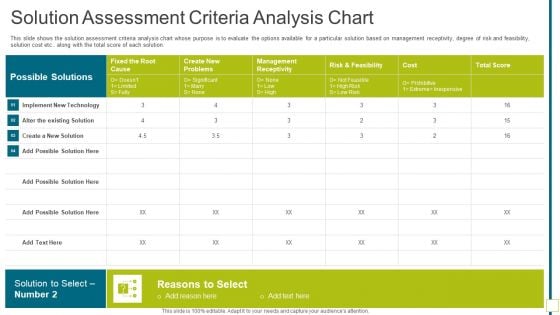
Solution Assessment Criteria Analysis Chart Solution Evaluation Validation Meet Organizational Needs Diagrams PDF
This slide shows the solution assessment criteria analysis chart whose purpose is to evaluate the options available for a particular solution based on management receptivity, degree of risk and feasibility, solution cost etc.. along with the total score of each solution. Deliver and pitch your topic in the best possible manner with this solution assessment criteria analysis chart solution evaluation validation meet organizational needs diagrams pdf. Use them to share invaluable insights on solution assessment criteria analysis chart and impress your audience. This template can be altered and modified as per your expectations. So, grab it now.
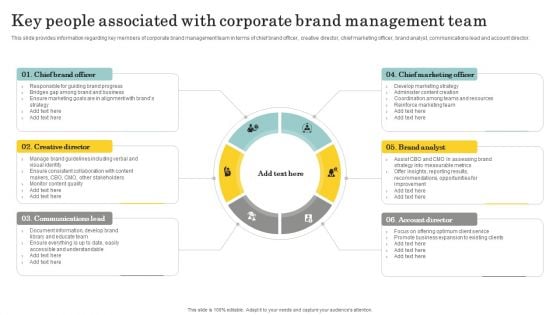
Optimize Brand Valuation Key People Associated With Corporate Brand Management Diagrams PDF
This slide provides information regarding key members of corporate brand management team in terms of chief brand officer, creative director, chief marketing officer, brand analyst, communications lead and account director. The best PPT templates are a great way to save time, energy, and resources. Slidegeeks have 100 percent editable powerpoint slides making them incredibly versatile. With these quality presentation templates, you can create a captivating and memorable presentation by combining visually appealing slides and effectively communicating your message. Download Optimize Brand Valuation Key People Associated With Corporate Brand Management Diagrams PDF from Slidegeeks and deliver a wonderful presentation.
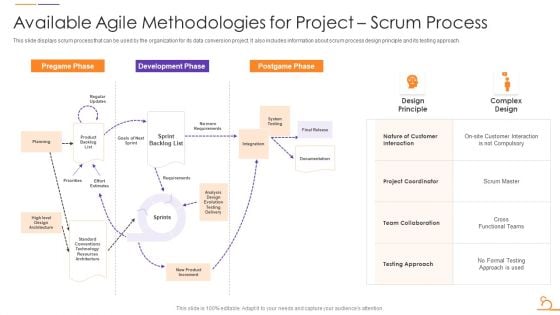
Agile Techniques For Data Migration Available Agile Methodologies For Project Scrum Process Diagrams PDF
This slide displays scrum process that can be used by the organization for its data conversion project. It also includes information about scrum process design principle and its testing approach. Deliver and pitch your topic in the best possible manner with this Agile Techniques For Data Migration Available Agile Methodologies For Project Scrum Process Diagrams PDF. Use them to share invaluable insights on Development Phase, Postgame Phase, Pregame Phase, Planning and impress your audience. This template can be altered and modified as per your expectations. So, grab it now.
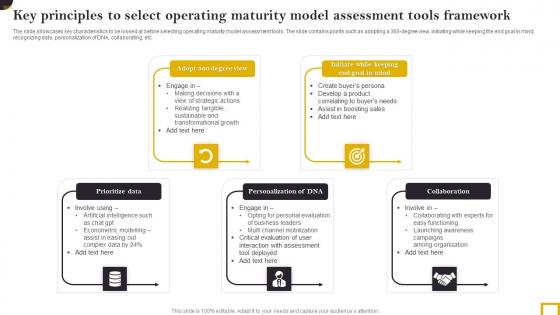
Key Principles To Select Operating Maturity Model Assessment Tools Framework Diagrams Pdf
The slide showcases key characteristics to be looked at before selecting operating maturity model assessment tools. The slide contains points such as adopting a 360-degree view, initiating while keeping the end goal in mind, recognizing data, personalization of DNA, collaborating, etc. Pitch your topic with ease and precision using this Key Principles To Select Operating Maturity Model Assessment Tools Framework Diagrams Pdf. This layout presents information on Goal Mind, Recognizing Data, Personalization DNA, Collaborating. It is also available for immediate download and adjustment. So, changes can be made in the color, design, graphics or any other component to create a unique layout. The slide showcases key characteristics to be looked at before selecting operating maturity model assessment tools. The slide contains points such as adopting a 360-degree view, initiating while keeping the end goal in mind, recognizing data, personalization of DNA, collaborating, etc.

Virtual Currency Investment Guide For Companies Dashboard To Effectively Track Bitcoin Diagrams PDF
The following dashboard highlights key parameters that can be used by the organization to track the performance of their bitcoin investment, it enlists major KPIs such as price of bitcoin, transaction chart and its historical performance. Deliver an awe inspiring pitch with this creative Virtual Currency Investment Guide For Companies Dashboard To Effectively Track Bitcoin Diagrams PDF bundle. Topics like Prediction Meter, Todays Market Activity, Transaction Chart can be discussed with this completely editable template. It is available for immediate download depending on the needs and requirements of the user.
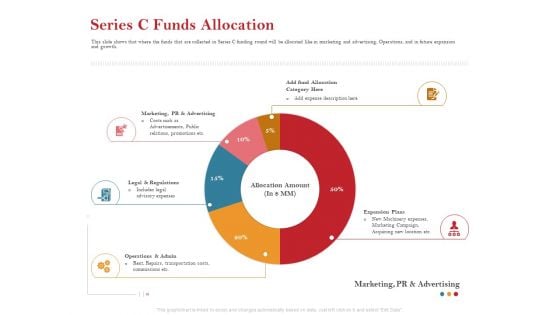
Pitch Deck For Raising Capital For Inorganic Growth Series C Funds Allocation Diagrams PDF
This slide shows that where the funds that are collected in Series C funding round will be allocated like in marketing and advertising, Operations, and in future expansion and growth. Deliver and pitch your topic in the best possible manner with this pitch deck for raising capital for inorganic growth series c funds allocation diagrams pdf. Use them to share invaluable insights on marketing, allocation, expansion plans, legal and regulations, operations and admin and impress your audience. This template can be altered and modified as per your expectations. So, grab it now.
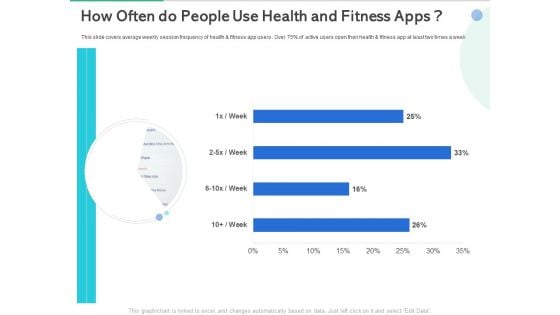
Market Overview Fitness Industry How Often Do People Use Health And Fitness Apps Diagrams PDF
This slide covers average weekly session frequency of health and fitness app users . Over 75 percent of active users open their health and fitness app at least two times a week. Deliver an awe-inspiring pitch with this creative market overview fitness industry how often do people use health and fitness apps diagrams pdf bundle. Topics like people use health and fitness apps can be discussed with this completely editable template. It is available for immediate download depending on the needs and requirements of the user.
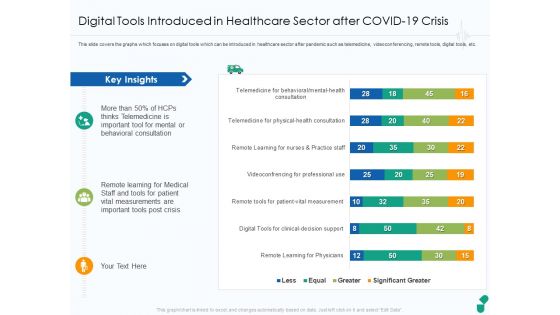
Digital Tools Introduced In Healthcare Sector After COVID 19 Crisis Ppt Outline Diagrams PDF
This slide covers the graphs which focuses on digital tools which can be introduced in healthcare sector after pandemic such as telemedicine, videoconferencing, remote tools, digital tools, etc. Deliver an awe-inspiring pitch with this creative digital tools introduced in healthcare sector after covid 19 crisis ppt outline diagrams pdf bundle. Topics like key insights, patient vital measurements, important tools post crisis, behavioral consultation can be discussed with this completely editable template. It is available for immediate download depending on the needs and requirements of the user.
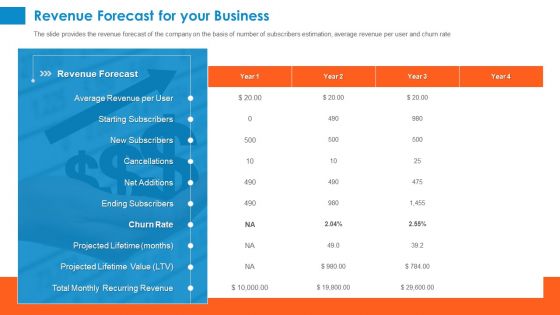
Raising Company Capital From Public Funding Sources Revenue Forecast For Your Business Diagrams PDF
The slide provides the revenue forecast of the company on the basis of number of subscribers estimation, average revenue per user and churn rate. Deliver an awe-inspiring pitch with this creative raising company capital from public funding sources revenue forecast for your business diagrams pdf bundle. Topics like revenue forecast, ending subscribers, starting subscribers, average revenue per user, projected lifetime, total monthly recurring revenue can be discussed with this completely editable template. It is available for immediate download depending on the needs and requirements of the user.
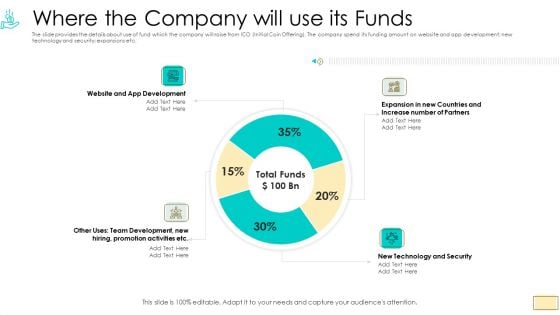
Investor Pitch Ppt For Crypto Funding Where The Company Will Use Its Funds Diagrams PDF
The slide provides the details about use of fund which the company will raise from ICO Initial Coin Offering. The company spend its funding amount on website and app development new technology and security expansions etc.Deliver an awe-inspiring pitch with this creative investor pitch ppt for crypto funding where the company will use its funds diagrams pdf. bundle. Topics like website and app development, new technology and security, expansion in new countries and increase number of partners can be discussed with this completely editable template. It is available for immediate download depending on the needs and requirements of the user.
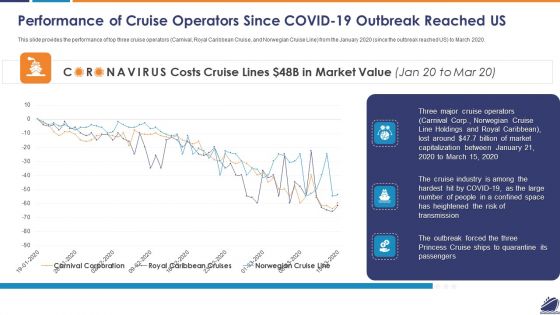
Performance Of Cruise Operators Since COVID 19 Outbreak Reached US Diagrams PDF
This slide provides the performance of top three cruise operators Carnival, Royal Caribbean Cruise, and Norwegian Cruise Line from the January 2020 since the outbreak reached US to March 2020. Deliver an awe inspiring pitch with this creative performance of cruise operators since covid 19 outbreak reached us diagrams pdf bundle. Topics like performance of cruise operators since covid 19 outbreak reached us can be discussed with this completely editable template. It is available for immediate download depending on the needs and requirements of the user.
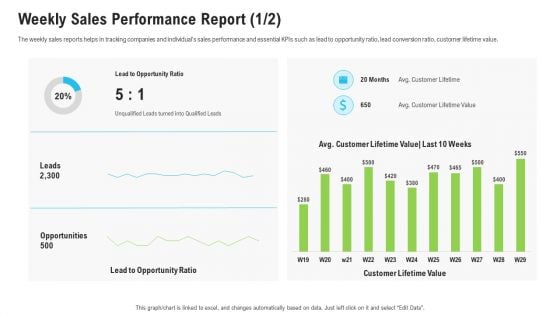
Sales Department Strategies Increase Revenues Weekly Sales Performance Report Leads Diagrams PDF
The weekly sales reports helps in tracking companies and individuals sales performance and essential KPIs such as lead to opportunity ratio, lead conversion ratio, customer lifetime value. Deliver and pitch your topic in the best possible manner with this sales department strategies increase revenues weekly sales performance report leads diagrams pdf. Use them to share invaluable insights on lead to opportunity ratio, customer lifetime value and impress your audience. This template can be altered and modified as per your expectations. So, grab it now.
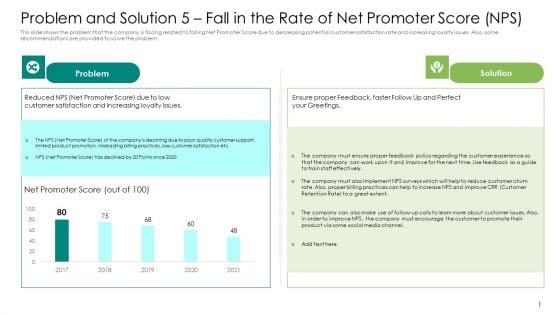
Problem And Solution 5 Fall In The Rate Of Net Promoter Score NPS Diagrams PDF
This slide shows the problem that the company is facing related to falling Net Promoter Score due to decreasing potential customer satisfaction rate and increasing loyalty issues. Also, some recommendations are provided to solve the problem. Deliver an awe-inspiring pitch with this creative problem and solution 5 fall in the rate of net promoter score nps diagrams pdf. bundle. Topics like net promoter score, 2017 to 2021 can be discussed with this completely editable template. It is available for immediate download depending on the needs and requirements of the user.
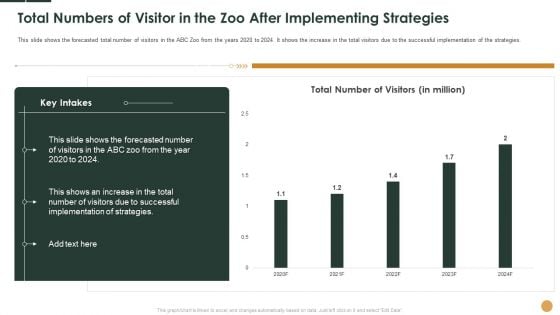
Total Numbers Of Visitor In The Zoo After Implementing Strategies Ppt Summary Diagrams PDF
This slide shows the forecasted total number of visitors in the ABC Zoo from the years 2020 to 2024. It shows the increase in the total visitors due to the successful implementation of the strategies.Deliver an awe-inspiring pitch with this creative total numbers of visitor in the zoo after implementing strategies ppt summary diagrams pdf. bundle. Topics like total number of visitors, 2020 to 2024 can be discussed with this completely editable template. It is available for immediate download depending on the needs and requirements of the user.
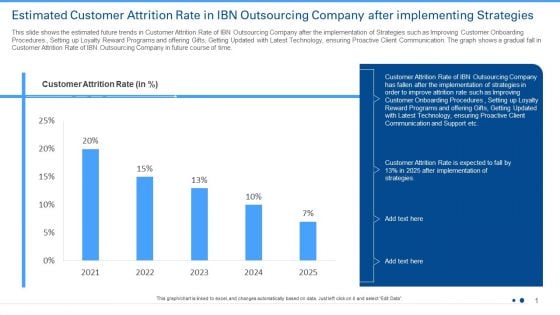
Estimated Customer Attrition Rate In IBN Outsourcing Company After Implementing Strategies Ppt Visual Aids Diagrams PDF
This slide shows a graph of decrease in level of Customer Satisfaction in IBN Outsourcing Company for past 5 years. Additionally, this slide provides information on some reasons High Response Time, Insufficient Knowledge with the Agent, Inability in Prioritizing Customer Requests etc. of fall in customer satisfaction level from 2017 to 2021.Deliver and pitch your topic in the best possible manner with this estimated customer attrition rate in ibn outsourcing company after implementing strategies ppt visual aids diagrams pdf. Use them to share invaluable insights on customer attrition rate, 2021 to 2025 and impress your audience. This template can be altered and modified as per your expectations. So, grab it now.
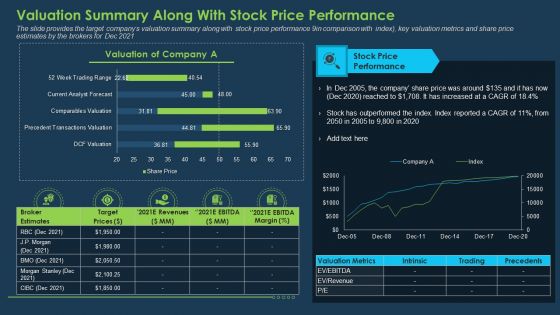
Commercial Banking Template Collection Valuation Summary Along With Stock Price Performance Diagrams PDF
The slide provides the target companys valuation summary along with stock price performance 9in comparison with index, key valuation metrics and share price estimates by the brokers for Dec 2021. Deliver and pitch your topic in the best possible manner with this commercial banking template collection valuation summary along with stock price performance diagrams pdf. Use them to share invaluable insights on stock price performance, revenues, target prices and impress your audience. This template can be altered and modified as per your expectations. So, grab it now.
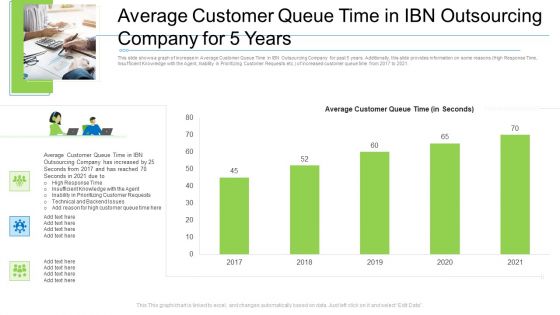
Average Customer Queue Time In Ibn Outsourcing Company For 5 Years Diagrams PDF
This slide shows a graph of increase in Average Customer Queue Time in IBN Outsourcing Company for past 5 years. Additionally, this slide provides information on some reasons High Response Time, Insufficient Knowledge with the Agent, Inability in Prioritizing Customer Requests etc. of increased customer queue time from 2017 to 2021. Deliver an awe-inspiring pitch with this creative average customer queue time in ibn outsourcing company for 5 years diagrams pdf. bundle. Topics like average customer queue time in ibn outsourcing company for 5 years can be discussed with this completely editable template. It is available for immediate download depending on the needs and requirements of the user.
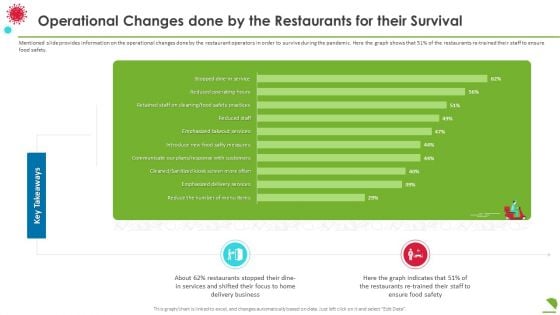
Operational Changes Done By The Restaurants For Their Survival Diagrams PDF
Mentioned slide provides information on the operational changes done by the restaurant operators in order to survive during the pandemic. Here the graph shows that 51 percentage of the restaurants re trained their staff to ensure food safety. Deliver an awe inspiring pitch with this creative operational changes done by the restaurants for their survival diagrams pdf bundle. Topics like business, services, key takeaways can be discussed with this completely editable template. It is available for immediate download depending on the needs and requirements of the user.
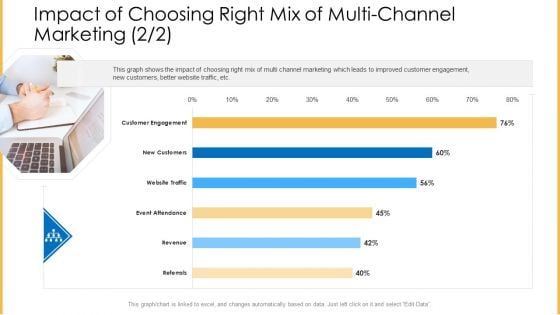
Amalgamation Marketing Pitch Deck Impact Of Choosing Right Mix Of Multi Channel Marketing Customer Diagrams PDF
This graph shows the impact of choosing right mix of multi channel marketing which leads to improved customer engagement, new customers, better website traffic, etc. Deliver and pitch your topic in the best possible manner with this amalgamation marketing pitch deck impact of choosing right mix of multi channel marketing customer diagrams pdf. Use them to share invaluable insights on engagement, website, traffic, revenue, referrals and impress your audience. This template can be altered and modified as per your expectations. So, grab it now.
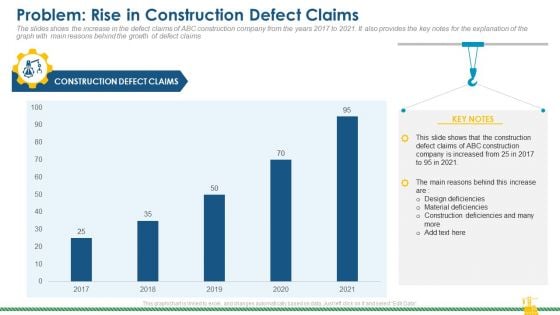
Rising Construction Defect Claims Against The Corporation Problem Rise In Construction Defect Claims Diagrams PDF
The slides shows the increase in the defect claims of ABC construction company from the years 2017 to 2021. It also provides the key notes for the explanation of the graph with main reasons behind the growth of defect claims. Deliver and pitch your topic in the best possible manner with this rising construction defect claims against the corporation problem rise in construction defect claims diagrams pdf. Use them to share invaluable insights on defect, claims, material deficiencies, design deficiencies and impress your audience. This template can be altered and modified as per your expectations. So, grab it now.
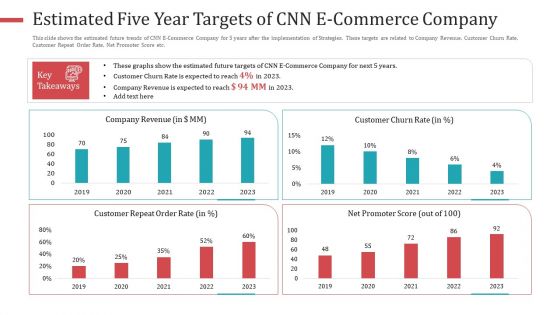
Estimated Five Year Targets Of CNN E Commerce Company Diagrams PDF
This slide shows the estimated future trends of CNN E Commerce Company for 5 years after the implementation of Strategies. These targets are related to Company Revenue, Customer Churn Rate, Customer Repeat Order Rate, Net Promoter Score etc. Deliver and pitch your topic in the best possible manner with this estimated five year targets of CNN e commerce company diagrams pdf. Use them to share invaluable insights on company revenue, customer repeat order rate, net promoter score, 2019 to 2023 and impress your audience. This template can be altered and modified as per your expectations. So, grab it now.
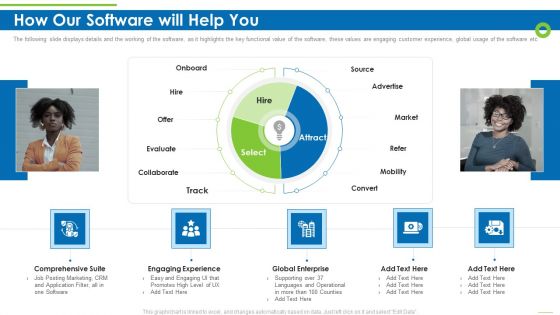
Enterprise Recruitment Industries Investor Fund Raising How Our Software Will Help You Diagrams PDF
The following slide displays details and the working of the software, as it highlights the key functional value of the software, these values are engaging customer experience, global usage of the software etc Deliver an awe inspiring pitch with this creative enterprise recruitment industries investor fund raising how our software will help you diagrams pdf bundle. Topics like comprehensive suite, engaging experience, global enterprise can be discussed with this completely editable template. It is available for immediate download depending on the needs and requirements of the user.
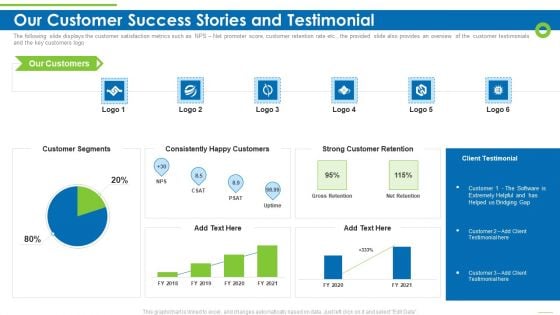
Enterprise Recruitment Industries Investor Fund Raising Our Customer Success Stories And Testimonial Diagrams PDF
The following slide displays the customer satisfaction metrics such as NPS Net promoter score, customer retention rate etc., the provided slide also provides an overview of the customer testimonials and the key customers logo Deliver an awe inspiring pitch with this creative enterprise recruitment industries investor fund raising our customer success stories and testimonial diagrams pdf bundle. Topics like customer segments, consistently happy customers, strong customer retention can be discussed with this completely editable template. It is available for immediate download depending on the needs and requirements of the user.
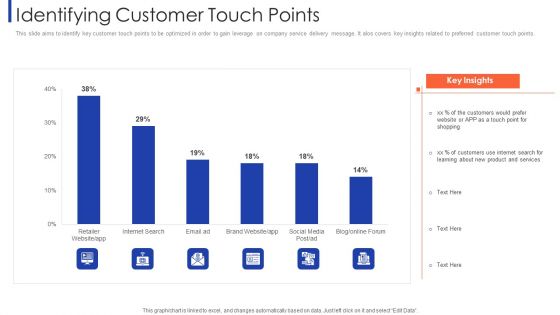
Customer Relationship Strategy For Building Loyalty Identifying Customer Touch Points Diagrams PDF
This slide aims to identify key customer touch points to be optimized in order to gain leverage on company service delivery message. It alos covers key insights related to preferred customer touch points. Deliver an awe inspiring pitch with this creative customer relationship strategy for building loyalty identifying customer touch points diagrams pdf bundle. Topics like retailer website, internet search, brand website, social media can be discussed with this completely editable template. It is available for immediate download depending on the needs and requirements of the user.
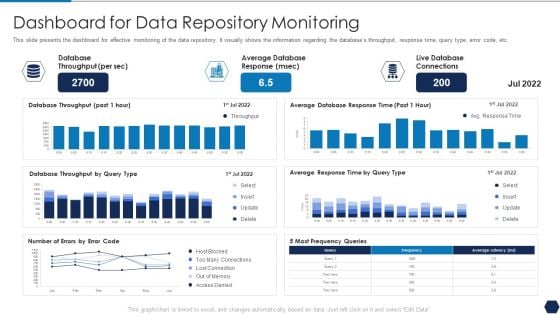
Tactical Plan For Upgrading DBMS Dashboard For Data Repository Monitoring Diagrams PDF
This slide presents the dashboard for effective monitoring of the data repository. It visually shows the information regarding the databases throughput, response time, query type, error code, etc. Deliver and pitch your topic in the best possible manner with this tactical plan for upgrading dbms dashboard for data repository monitoring diagrams pdf. Use them to share invaluable insights on database throughput, average database response, live database connections and impress your audience. This template can be altered and modified as per your expectations. So, grab it now.
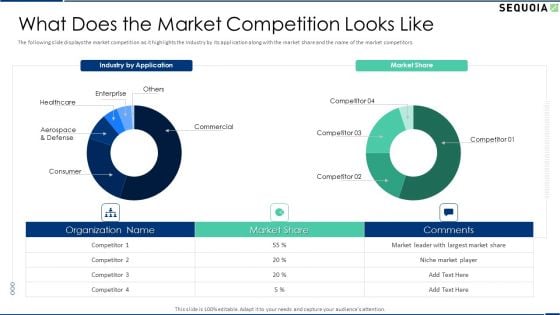
Sequoia Company Capital Raising Elevator What Does The Market Competition Looks Like Diagrams PDF
The following slide displays the market competition as it highlights the Industry by its application along with the market share and the name of the market competitors. Deliver and pitch your topic in the best possible manner with this sequoia company capital raising elevator what does the market competition looks like diagrams pdf. Use them to share invaluable insights on enterprise, commercial, consumer, market share and impress your audience. This template can be altered and modified as per your expectations. So, grab it now.
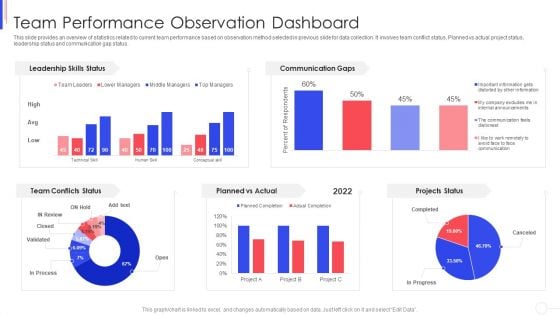
Strategy To Improve Team Proficiency Team Performance Observation Dashboard Diagrams PDF
This slide provides an overview of statistics related to current team performance based on observation method selected in previous slide for data collection. It involves team conflict status, Planned vs actual project status, leadership status and communication gap status. Deliver an awe inspiring pitch with this creative proficiency team performance observation dashboard diagrams pdf bundle. Topics like team performance observation dashboard can be discussed with this completely editable template. It is available for immediate download depending on the needs and requirements of the user.
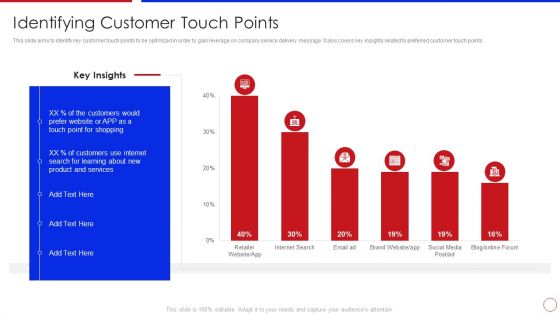
Strategy To Enhance Buyer Intimacy Identifying Customer Touch Points Ppt Infographics Diagrams PDF
This slide aims to identify key customer touch points to be optimized in order to gain leverage on company service delivery message. It alos covers key insights related to preferred customer touch points. Deliver and pitch your topic in the best possible manner with this strategy to enhance buyer intimacy identifying customer touch points ppt infographics diagrams pdf. Use them to share invaluable insights on identifying customer touch points and impress your audience. This template can be altered and modified as per your expectations. So, grab it now.
Guidelines For Exhibiting Business Value Of Information And Technology Financial Fundamental Metrics Diagrams PDF
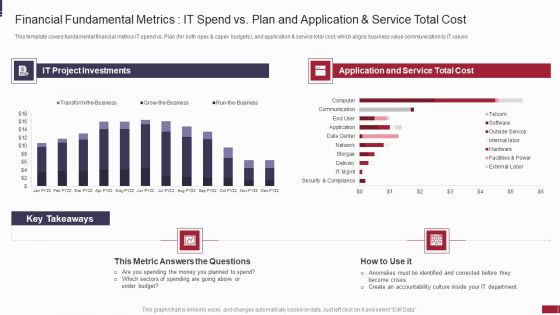
This template covers fundamental financial metrics IT spend vs Plan for both opex and capex budgets, and application and service total cost, which aligns business value communication to IT values. Deliver and pitch your topic in the best possible manner with this guidelines for exhibiting business value of information and technology financial fundamental metrics diagrams pdf. Use them to share invaluable insights on metric, budget, accountability, planned and impress your audience. This template can be altered and modified as per your expectations. So, grab it now.
Guidelines For Exhibiting Business Value Of Information And Technology Innovation And Agility Metrics Diagrams PDF
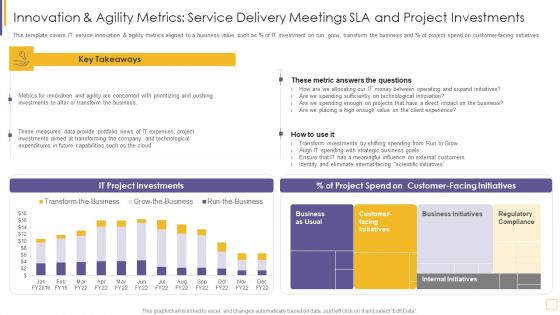
This template covers IT service innovation and agility metrics aligned to a business value such as percentage of IT investment on run, grow, transform the business and percentage of project spend on customer facing initiatives. Deliver an awe inspiring pitch with this creative guidelines for exhibiting business value of information and technology innovation and agility metrics diagrams pdf bundle. Topics like measures, investments, expenses, technological, capabilities can be discussed with this completely editable template. It is available for immediate download depending on the needs and requirements of the user.
IT Value Story Significant To Corporate Leadership Financial Fundamental Metrics Diagrams PDF
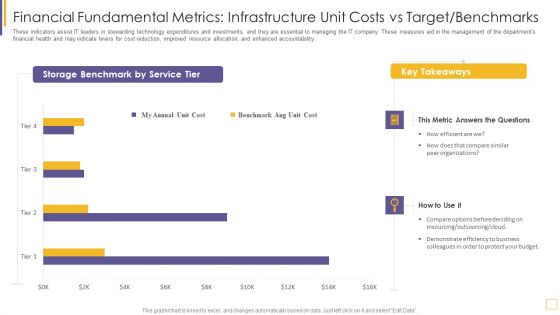
These indicators assist IT leaders in stewarding technology expenditures and investments, and they are essential to managing the IT company. These measures aid in the management of the departments financial health and may indicate levers for cost reduction, improved resource allocation, and enhanced accountability. Deliver and pitch your topic in the best possible manner with this it value story significant to corporate leadership financial fundamental metrics diagrams pdf. Use them to share invaluable insights on organizations, budget, metric, cost and impress your audience. This template can be altered and modified as per your expectations. So, grab it now.
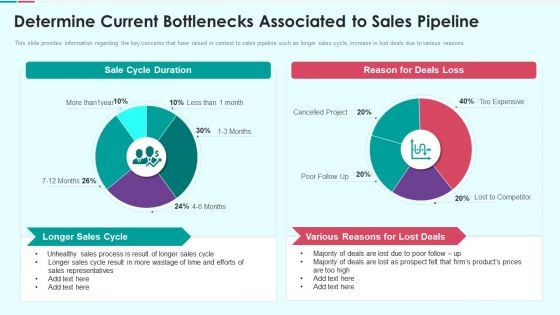
Sales Funnel Management For Revenue Generation Determine Current Bottlenecks Diagrams PDF
This slide provides information regarding the key concerns that have raised in context to sales pipeline such as longer sales cycle, increase in lost deals due to various reasons. Deliver and pitch your topic in the best possible manner with this sales funnel management for revenue generation determine current bottlenecks diagrams pdf Use them to share invaluable insights on longer sales cycle, various reasons for lost deals, sales representatives and impress your audience. This template can be altered and modified as per your expectations. So, grab it now.
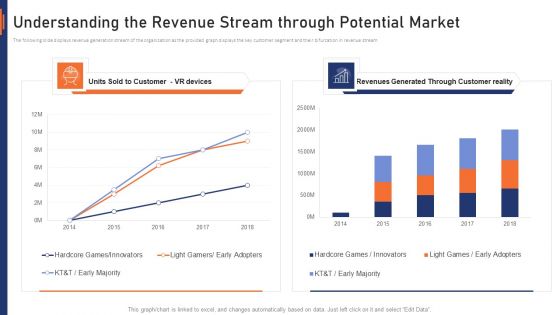
VR Market Capital Raising Elevator Pitch Deck Understanding The Revenue Stream Through Potential Market Diagrams PDF
The following slide displays revenue generation stream of the organization as the provided graph displays the key customer segment and their bifurcation in revenue stream. Deliver and pitch your topic in the best possible manner with this vr market capital raising elevator pitch deck understanding the revenue stream through potential market diagrams pdf. Use them to share invaluable insights on understanding the revenue stream through potential market and impress your audience. This template can be altered and modified as per your expectations. So, grab it now.
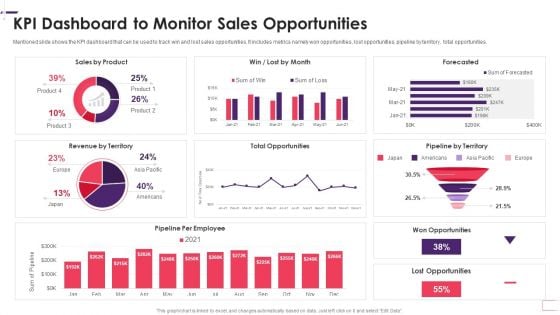
Enhancing Stp Strategies For A Successful Market Promotion Kpi Dashboard To Monitor Diagrams PDF
Mentioned slide shows the KPI dashboard that can be used to track win and lost sales opportunities. It includes metrics namely won opportunities, lost opportunities, pipeline by territory, total opportunities. Deliver and pitch your topic in the best possible manner with this enhancing stp strategies for a successful market promotion kpi dashboard to monitor diagrams pdf. Use them to share invaluable insights on kpi dashboard to monitor sales opportunities and impress your audience. This template can be altered and modified as per your expectations. So, grab it now.
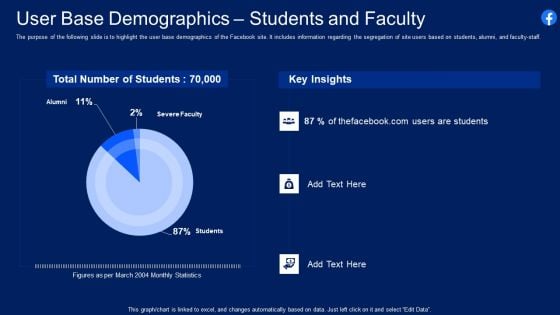
Facebook Original Capital Funding User Base Demographics Students And Faculty Diagrams PDF
The purpose of the following slide is to highlight the user base demographics of the Facebook site. It includes information regarding the segregation of site users based on students, alumni, and faculty staff. Deliver an awe inspiring pitch with this creative facebook original capital funding user base demographics students and faculty diagrams pdf bundle. Topics like user base demographics students and faculty can be discussed with this completely editable template. It is available for immediate download depending on the needs and requirements of the user.
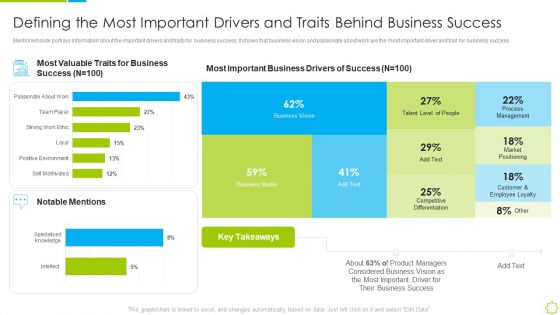
Launch New Sales Enablement Program Lead Generation Defining The Most Important Drivers Diagrams PDF
Mentioned slide portrays information about the important drivers and traits for business success. It shows that business vision and passionate about work are the most important driver and trait for business success. Deliver an awe inspiring pitch with this creative launch new sales enablement program lead generation defining the most important drivers diagrams pdf bundle. Topics like defining the most important drivers and traits behind business success can be discussed with this completely editable template. It is available for immediate download depending on the needs and requirements of the user.
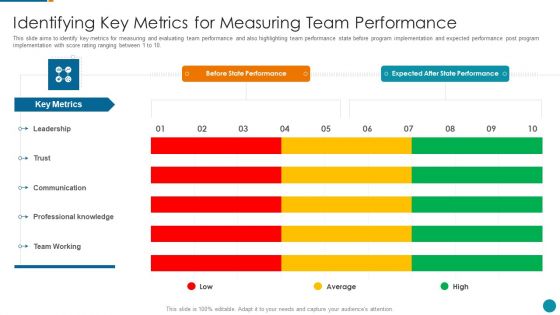
Strategic Procedure To Improve Employee Efficiency Identifying Key Metrics For Measuring Diagrams PDF
This slide aims to identify key metrics for measuring and evaluating team performance and also highlighting team performance state before program implementation and expected performance post program implementation with score rating ranging between 1 to 10.Deliver and pitch your topic in the best possible manner with this strategic procedure to improve employee efficiency identifying key metrics for measuring diagrams pdf Use them to share invaluable insights on expected after state performance, professional knowledge, communication and impress your audience. This template can be altered and modified as per your expectations. So, grab it now.
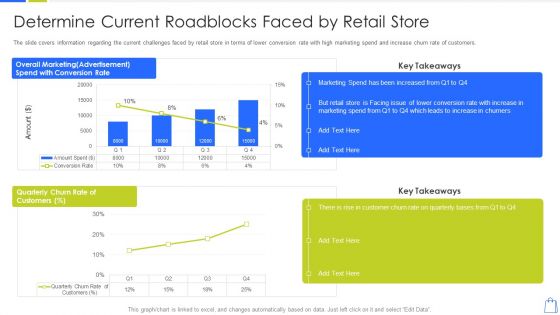
Redefining Experiential Retail Marketing Determine Current Roadblocks Faced By Retail Store Diagrams PDF
The slide covers information regarding the current challenges faced by retail store in terms of lower conversion rate with high marketing spend and increase churn rate of customers. Deliver and pitch your topic in the best possible manner with this redefining experiential retail marketing determine current roadblocks faced by retail store diagrams pdf. Use them to share invaluable insights on determine current roadblocks faced by retail store and impress your audience. This template can be altered and modified as per your expectations. So, grab it now.
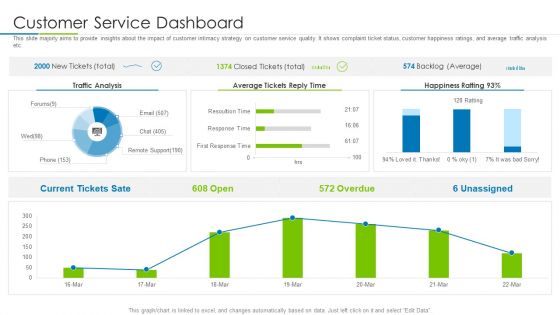
Customer Rapport Strategy To Build Loyal Client Base Customer Service Dashboard Diagrams PDF
This slide majorly aims to provide insights about the impact of customer intimacy strategy on customer service quality. It shows complaint ticket status, customer happiness ratings, and average traffic analysis etc. Deliver and pitch your topic in the best possible manner with this customer rapport strategy to build loyal client base customer service dashboard diagrams pdf. Use them to share invaluable insights on customer service dashboard and impress your audience. This template can be altered and modified as per your expectations. So, grab it now.
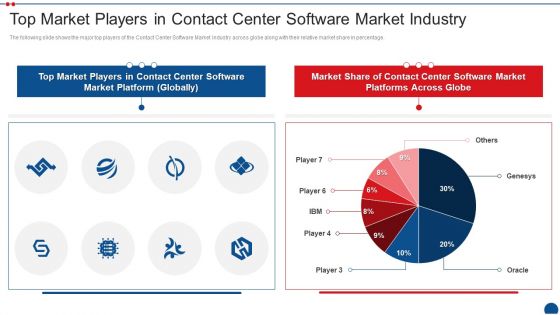
Call Center Application Market Industry Top Market Players In Contact Center Software Market Industry Diagrams PDF
The following slide shows the major top players of the Contact Center Software Market Industry across globe along with their relative market share in percentage. Deliver an awe inspiring pitch with this creative call center application market industry top market players in contact center software market industry diagrams pdf bundle. Topics like top market players in contact center software market industry can be discussed with this completely editable template. It is available for immediate download depending on the needs and requirements of the user.
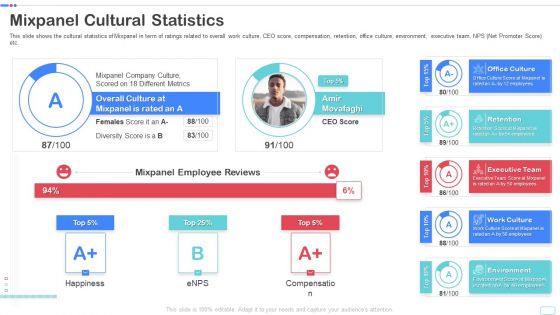
Mixpanel Capital Raising Pitch Deck Mixpanel Cultural Statistics Topics PDF Diagrams PDF
This slide shows the cultural statistics of Mixpanel in term of ratings related to overall work culture, CEO score, compensation, retention, office culture, environment, executive team, NPS Net Promoter Score etc. Deliver an awe inspiring pitch with this creative mixpanel capital raising pitch deck mixpanel cultural statistics topics pdf diagrams pdf bundle. Topics like office culture, retention, executive team, work culture, environment can be discussed with this completely editable template. It is available for immediate download depending on the needs and requirements of the user.
Retail Trading Platform Dashboard Tracking Essential Kpis For Ecommerce Performance Diagrams PDF
This slide provides information regarding essential KPIs for ecommerce performance dashboard tracking average bounce rate, new vs. old customers, channel revenue vs. channel acquisitions costs, channel revenue vs. sales, average conversion rate, etc. Deliver an awe inspiring pitch with this creative retail trading platform dashboard tracking essential kpis for ecommerce performance diagrams pdf bundle. Topics like average bounce rate, average conversion rate, bounce rate, channel revenue sales can be discussed with this completely editable template. It is available for immediate download depending on the needs and requirements of the user.
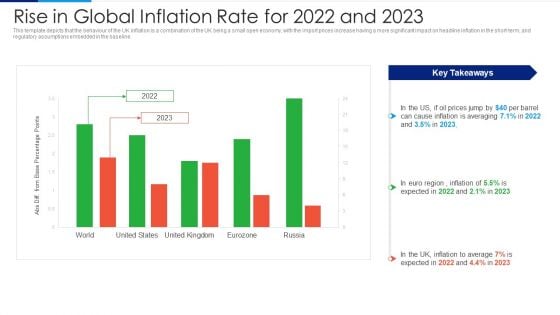
Russia Ukraine Conflict Effect Rise In Global Inflation Rate For 2022 And 2023 Diagrams PDF
This template depicts that the behaviour of the UK inflation is a combination of the UK being a small open economy, with the import prices increase having a more significant impact on headline inflation in the short-term, and regulatory assumptions embedded in the baseline. Deliver and pitch your topic in the best possible manner with this Russia Ukraine Conflict Effect Rise In Global Inflation Rate For 2022 And 2023 Diagrams PDF. Use them to share invaluable insights on Inflation To Average, 2022 To 2023, Abs Diff From Base Percentage Points and impress your audience. This template can be altered and modified as per your expectations. So, grab it now.
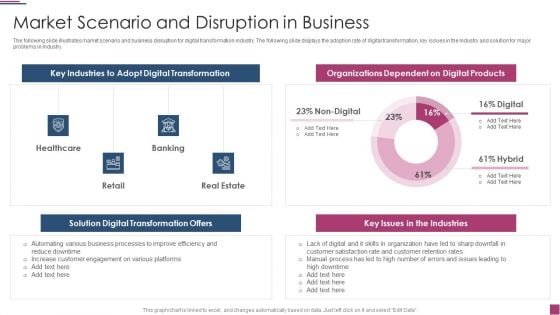
Innovation Procedure For Online Business Market Scenario And Disruption In Business Diagrams PDF
The following slide illustrates market scenario and business disruption for digital transformation industry. The following slide displays the adoption rate of digital transformation, key issues in the Industry and solution for major problems in Industry. Deliver and pitch your topic in the best possible manner with this Innovation Procedure For Online Business Market Scenario And Disruption In Business Diagrams PDF Use them to share invaluable insights on Key Industries, Solution Digital Transformation, Organizations Dependent and impress your audience. This template can be altered and modified as per your expectations. So, grab it now.
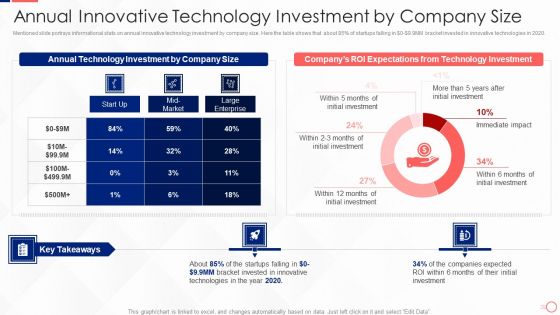
Investing In Tech Innovation Annual Innovative Technology Investment By Company Size Diagrams PDF
Mentioned slide portrays informational stats on annual innovative technology investment by company size. Here the table shows that about 85 percent of startups falling in Dollar 0- Dollar 9.9MM bracket invested in innovative technologies in 2020. Deliver an awe inspiring pitch with this creative Investing In Tech Innovation Annual Innovative Technology Investment By Company Size Diagrams PDF bundle. Topics like Annual Technology Investment, Company Size, ROI Expectations Technology, Initial Investment can be discussed with this completely editable template. It is available for immediate download depending on the needs and requirements of the user.
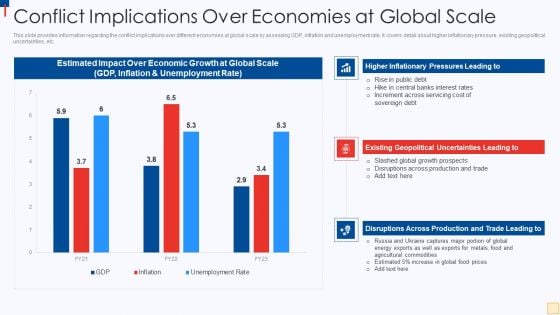
Ukraine Vs Russia Examining Conflict Implications Over Economies At Global Scale Diagrams PDF
This slide provides information regarding the conflict implications over different economies at global scale by assessing GDP, inflation and unemployment rate. It covers detail about higher inflationary pressure, existing geopolitical uncertainties, etc. Deliver and pitch your topic in the best possible manner with this Ukraine Vs Russia Examining Conflict Implications Over Economies At Global Scale Diagrams PDF. Use them to share invaluable insights on Estimated Impact Over, Economic Growth, Global Scale, GDP, Inflation And Unemployment Rate and impress your audience. This template can be altered and modified as per your expectations. So, grab it now.
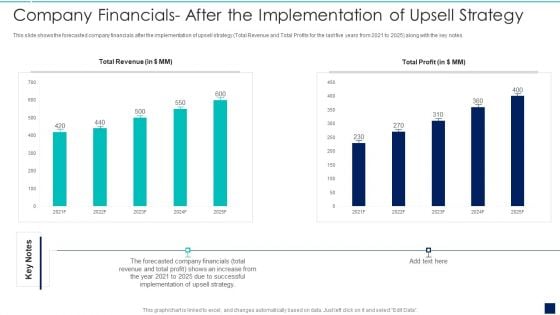
Influence Buyers To Purchase Additional High Company Financials After The Implementation Diagrams PDF
This slide shows the forecasted company financials after the implementation of upsell strategy total Revenue and Total Profits for the last five years from 2021 to 2025 along with the key notes.Deliver an awe inspiring pitch with this creative Influence Buyers To Purchase Additional High Company Financials After The Implementation Diagrams PDF bundle. Topics like Company Financials After The Implementation Of Upsell Strategy can be discussed with this completely editable template. It is available for immediate download depending on the needs and requirements of the user.
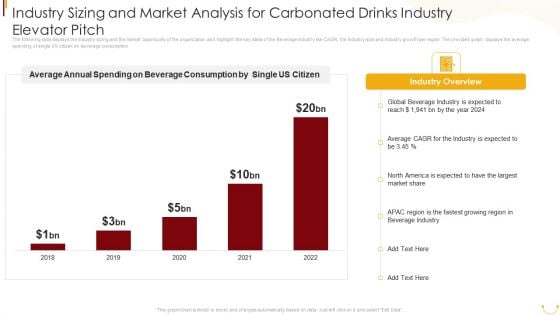
Industry Sizing And Market Analysis For Carbonated Drinks Industry Elevator Pitch Diagrams PDF
The following slide displays the Industry sizing and the market opportunity of the organization as it highlight the key stats of the Beverage industry like CAGR, the Industry size and Industry growth per region. The provided graph displays the average spending of single US citizen on beverage consumption. Deliver and pitch your topic in the best possible manner with this Industry Sizing And Market Analysis For Carbonated Drinks Industry Elevator Pitch Diagrams PDF. Use them to share invaluable insights on Average Annual Spending, Beverage Consumption, Single US Citizen, Global Beverage Industry, 2018 To 2022 and impress your audience. This template can be altered and modified as per your expectations. So, grab it now.

Insurance Company Business Plan Addressing Market Assessment For Insurance Business Diagrams PDF
This slide covers information regarding market assessment of insurance business with high competition existing. It covers details about key players and market share associated to top players. Deliver and pitch your topic in the best possible manner with this Insurance Company Business Plan Addressing Market Assessment For Insurance Business Diagrams PDF Use them to share invaluable insights on America Insurance, General Insurance, Local Competition Includes and impress your audience. This template can be altered and modified as per your expectations. So, grab it now.


 Continue with Email

 Home
Home


