Product Diagram
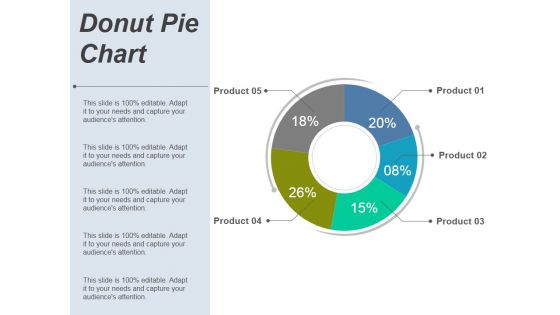
Donut Pie Chart Ppt PowerPoint Presentation Infographic Template Layout Ideas
This is a donut pie chart ppt powerpoint presentation infographic template layout ideas. This is a five stage process. The stages in this process are product, business, finance, marketing.
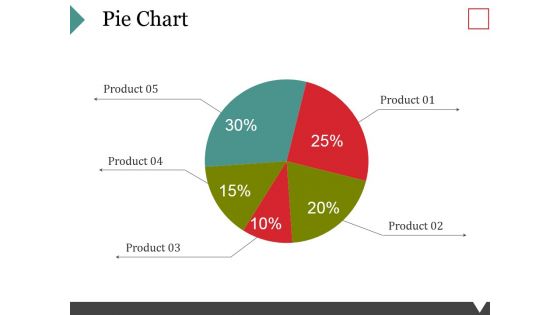
Pie Chart Ppt PowerPoint Presentation Summary Background Image
This is a pie chart ppt powerpoint presentation summary background image. This is a five stage process. The stages in this process are business, marketing, product, finance, strategy, planning.
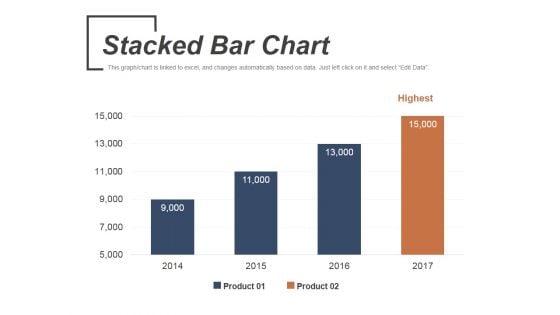
Stacked Bar Chart Ppt PowerPoint Presentation Inspiration Ideas
This is a stacked bar chart ppt powerpoint presentation inspiration ideas. This is a four stage process. The stages in this process are product, highest, business, marketing, bar graph.
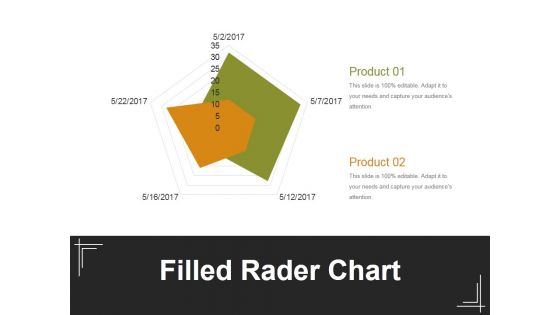
Filled Rader Chart Ppt PowerPoint Presentation Professional Background Image
This is a filled rader chart ppt powerpoint presentation professional background image. This is a five stage process. The stages in this process are product, business, marketing, process, management.
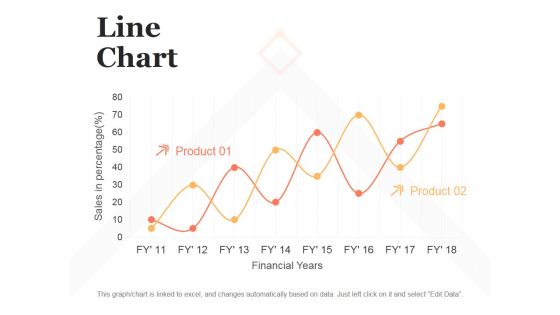
Line Chart Ppt PowerPoint Presentation Model Design Templates
This is a line chart ppt powerpoint presentation model design templates. This is a two stage process. The stages in this process are sales in percentage, financial years, product.
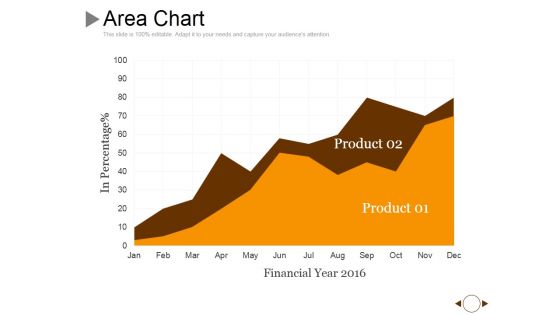
Area Chart Ppt PowerPoint Presentation Show Layout Ideas
This is a area chart ppt powerpoint presentation show layout ideas. This is a two stage process. The stages in this process are product, in percentage, financial year, growth.
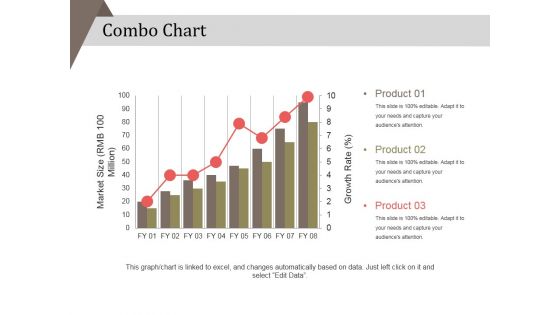
Combo Chart Ppt PowerPoint Presentation Infographic Template Brochure
This is a combo chart ppt powerpoint presentation infographic template brochure. This is a eight stage process. The stages in this process are product, market size, strategy, business, marketing.
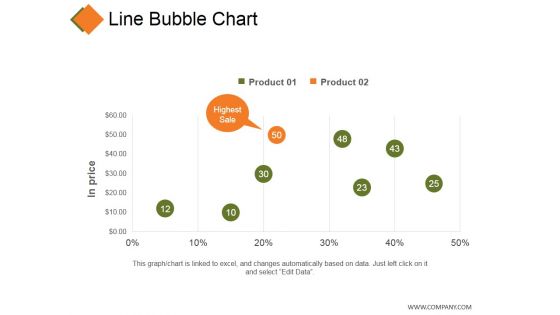
Line Bubble Chart Ppt PowerPoint Presentation Professional Infographic Template
This is a line bubble chart ppt powerpoint presentation professional infographic template. This is a five stage process. The stages in this process are product, in price, highest sale, business, finance.
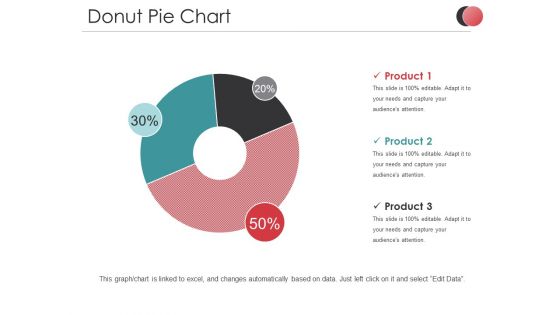
Donut Pie Chart Ppt PowerPoint Presentation Inspiration Background Image
This is a donut pie chart ppt powerpoint presentation inspiration background image. This is a three stage process. The stages in this process are product, percentage, business, marketing, process.

Scatter Bubble Chart Ppt PowerPoint Presentation Professional Graphics Pictures
This is a scatter bubble chart ppt powerpoint presentation professional graphics pictures. This is a one stage process. The stages in this process are profit in sales, financial year, highest profit, product.
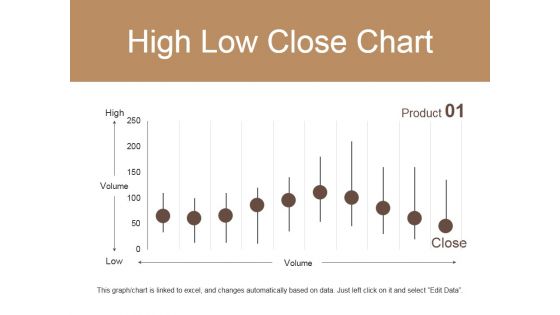
High Low Close Chart Ppt PowerPoint Presentation Infographic Template Vector
This is a high low close chart ppt powerpoint presentation infographic template vector. This is a ten stage process. The stages in this process are high, volume, low, product, close.
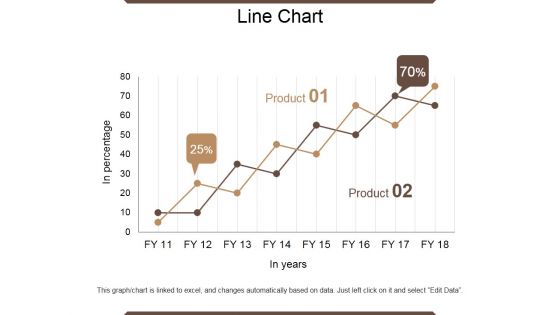
Line Chart Ppt PowerPoint Presentation Outline Infographic Template
This is a line chart ppt powerpoint presentation outline infographic template. This is a two stage process. The stages in this process are in percentage, product, in year, growth, success.
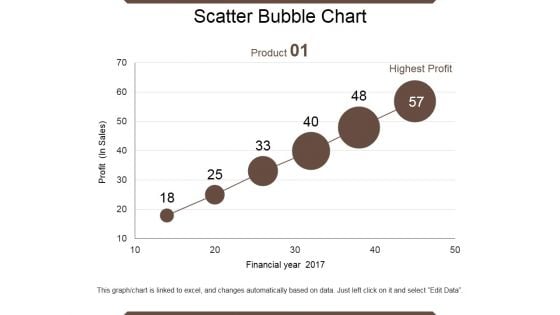
Scatter Bubble Chart Ppt PowerPoint Presentation Summary Files
This is a scatter bubble chart ppt powerpoint presentation summary files. This is a six stage process. The stages in this process are product, financial year, profit, highest profit.
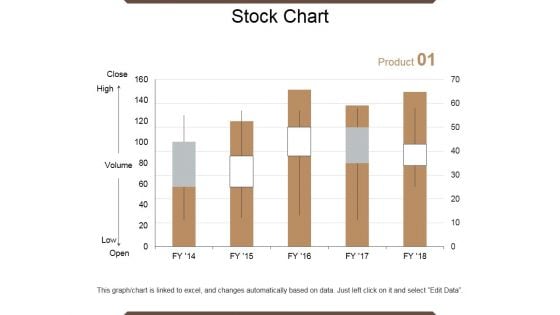
Stock Chart Ppt PowerPoint Presentation Outline Graphics Example
This is a stock chart ppt powerpoint presentation outline graphics example. This is a five stage process. The stages in this process are close, volume, low, high, open, product.
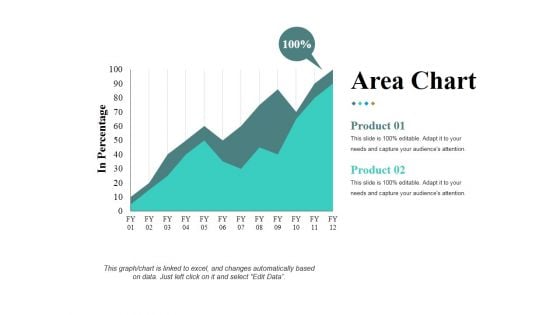
Area Chart Ppt PowerPoint Presentation Infographic Template Samples
This is a area chart ppt powerpoint presentation infographic template samples. This is a two stage process. The stages in this process are in percentage product, business, marketing, growth.
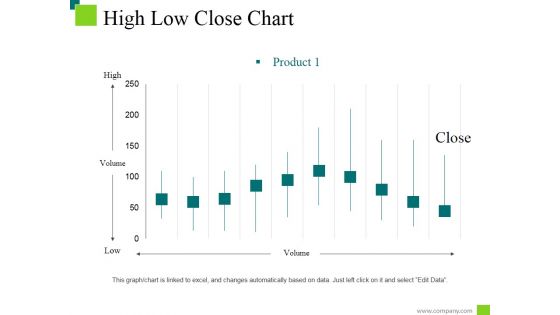
High Low Close Chart Ppt PowerPoint Presentation Styles Information
This is a high low close chart ppt powerpoint presentation styles information. This is a ten stage process. The stages in this process are low, high, product, volume, close.
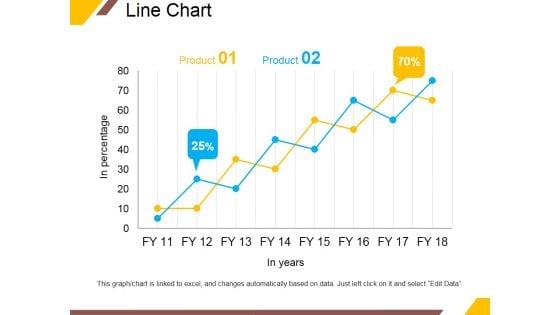
Line Chart Ppt PowerPoint Presentation Portfolio Infographic Template
This is a line chart ppt powerpoint presentation portfolio infographic template. This is a two stage process. The stages in this process are product, in years, business, percentage, growth.
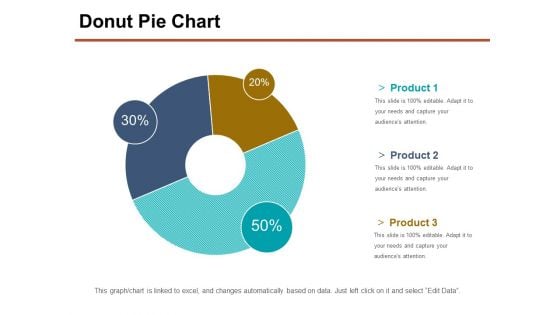
Donut Pie Chart Ppt PowerPoint Presentation Professional Slide Portrait
This is a donut pie chart ppt powerpoint presentation professional slide portrait. This is a three stage process. The stages in this process are product, percentage, business, management, process.
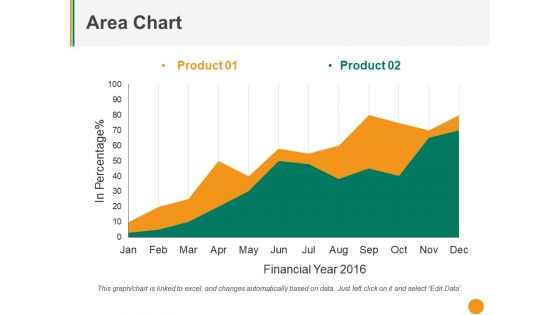
Area Chart Ppt PowerPoint Presentation File Graphic Tips
This is a area chart ppt powerpoint presentation file graphic tips. This is a two stage process. The stages in this process are product, in percentage, financial year, business, growth.
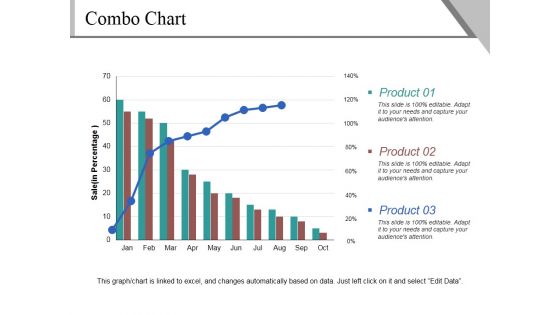
Combo Chart Ppt PowerPoint Presentation Ideas Visual Aids
This is a combo chart ppt powerpoint presentation ideas visual aids. This is a three stage process. The stages in this process are product, sales, bar graph, business, marketing.
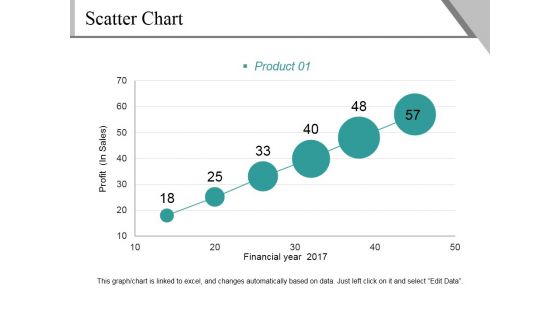
Scatter Chart Ppt PowerPoint Presentation File Background Image
This is a scatter chart ppt powerpoint presentation file background image. This is a six stage process. The stages in this process are profit, financial year, product, growth, success.
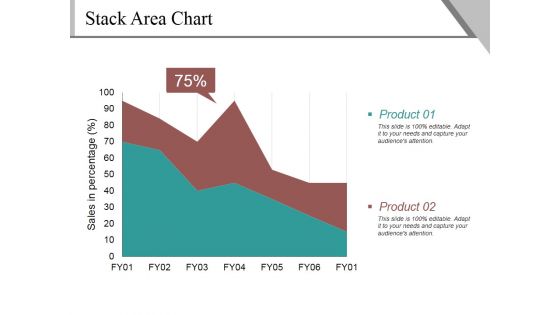
Stack Area Chart Ppt PowerPoint Presentation Gallery Guidelines
This is a stack area chart ppt powerpoint presentation gallery guidelines. This is a two stage process. The stages in this process are sales in percentage, product, percentage, business.
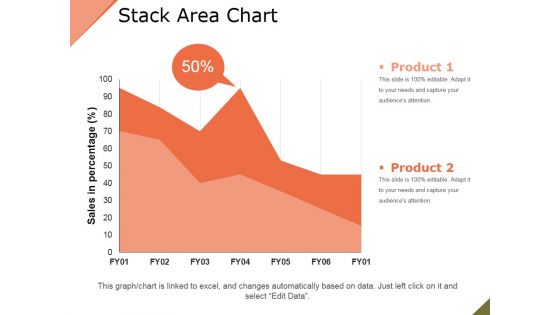
Stack Area Chart Ppt PowerPoint Presentation Example File
This is a stack area chart ppt powerpoint presentation example file. This is a two stage process. The stages in this process are product, sales in percentage, percentage, finance.
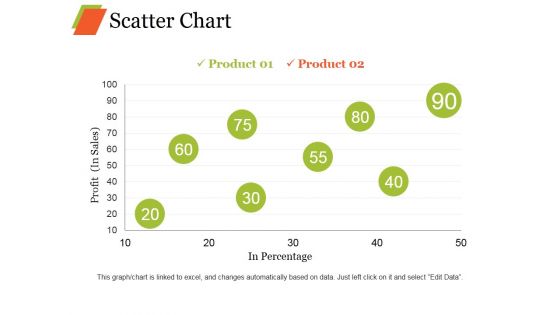
Scatter Chart Ppt PowerPoint Presentation Professional Graphic Images
This is a scatter chart ppt powerpoint presentation professional graphic images. This is a eight stage process. The stages in this process are product, profit, in percentage growth, business.
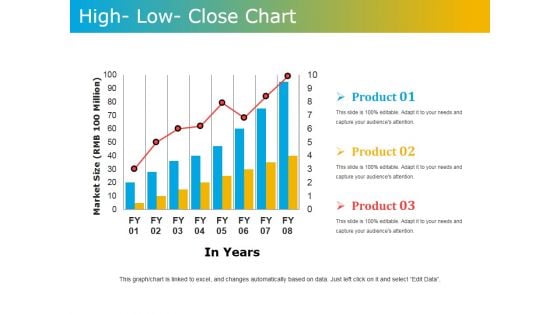
High Low Close Chart Ppt PowerPoint Presentation Model Graphics Tutorials
This is a high low close chart ppt powerpoint presentation model graphics tutorials. This is a three stage process. The stages in this process are market size, in years, product.
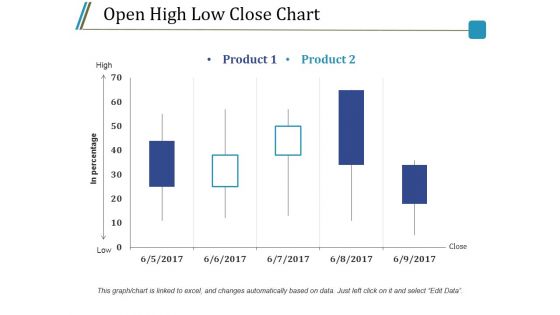
Open High Low Close Chart Ppt PowerPoint Presentation Styles Model
This is a open high low close chart ppt powerpoint presentation styles model. This is a five stage process. The stages in this process are product, high, low, in percentage, close.
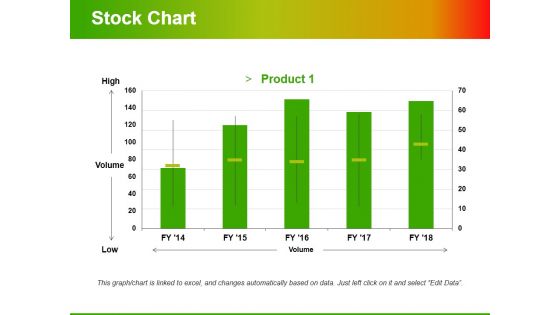
Stock Chart Template 2 Ppt PowerPoint Presentation Infographic Template Styles
This is a stock chart template 2 ppt powerpoint presentation infographic template styles. This is a one stage process. The stages in this process are high, volume, low, product, volume.
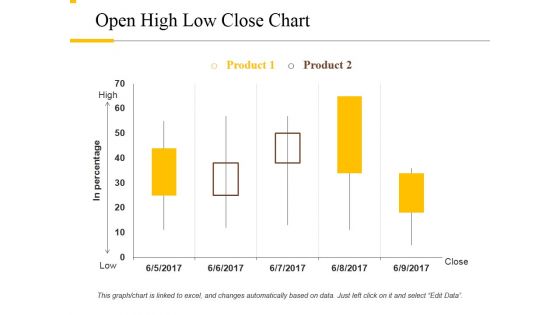
Open High Low Close Chart Ppt PowerPoint Presentation Outline Rules
This is a open high low close chart ppt powerpoint presentation outline rules. This is a two stage process. The stages in this process are product, high, low, close, in percentage.
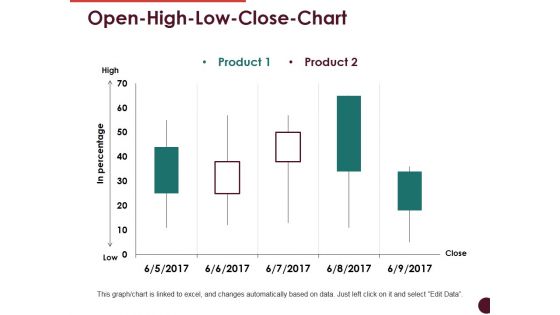
Open High Low Close Chart Ppt PowerPoint Presentation Professional Visuals
This is a open high low close chart ppt powerpoint presentation professional visuals. This is a two stage process. The stages in this process are high, low, in percentage, product, close.
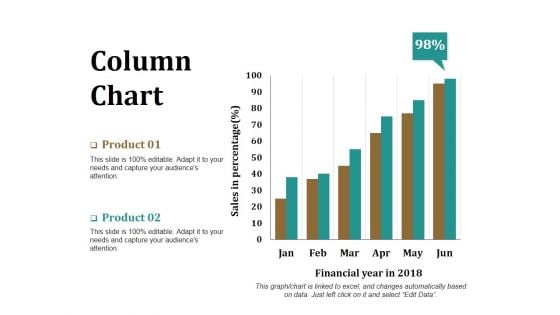
Column Chart Ppt PowerPoint Presentation Model Graphics Download
This is a column chart ppt powerpoint presentation model graphics download. This is a two stage process. The stages in this process are product, financial year, sales in percentage, bar graph, success.
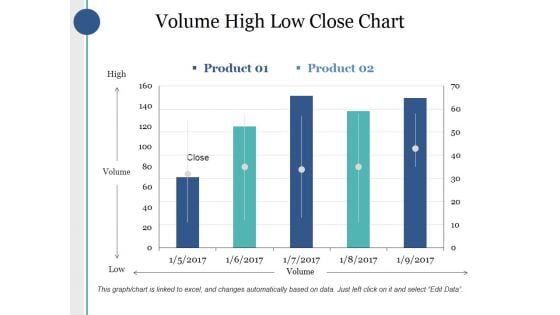
Volume High Low Close Chart Ppt PowerPoint Presentation Infographics Good
This is a volume high low close chart ppt powerpoint presentation infographics good. This is a two stage process. The stages in this process are high, volume, low, product, close.
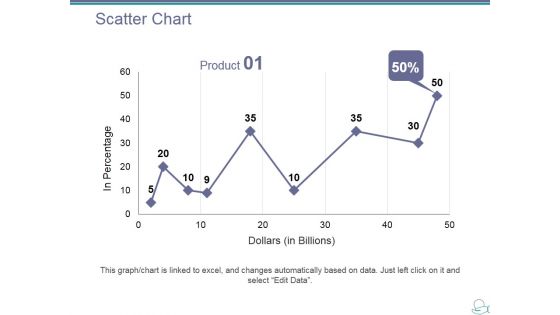
Scatter Chart Ppt PowerPoint Presentation Ideas Designs Download
This is a scatter chart ppt powerpoint presentation ideas designs download. This is a one stage process. The stages in this process are product, dollar, in percentage, growth, success.
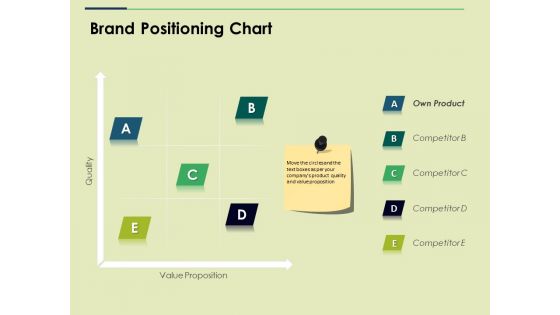
Brand Positioning Chart Ppt PowerPoint Presentation Show Example File
This is a brand positioning chart ppt powerpoint presentation show example file. This is a five stage process. The stages in this process are own product, business, marketing, strategy, analysis.
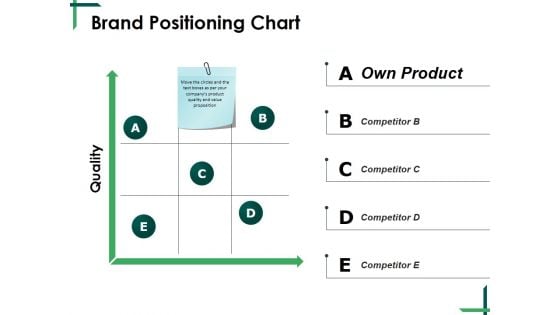
Brand Positioning Chart Ppt PowerPoint Presentation Outline Slide Download
This is a brand positioning chart ppt powerpoint presentation outline slide download. This is a five stage process. The stages in this process are quality, own product, business, management, matrix.
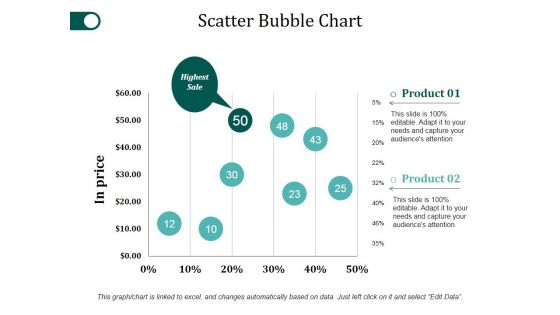
Scatter Bubble Chart Ppt PowerPoint Presentation Styles Objects
This is a scatter bubble chart ppt powerpoint presentation styles objects. This is a two stage process. The stages in this process are product, in price, highest sale, percentage, finance.
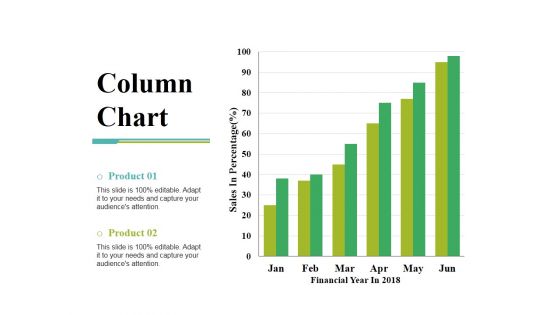
Column Chart Ppt PowerPoint Presentation Gallery Slide Portrait
This is a column chart ppt powerpoint presentation gallery slide portrait. This is a two stage process. The stages in this process are sales in percentage, financial year, product, bar graph, growth.
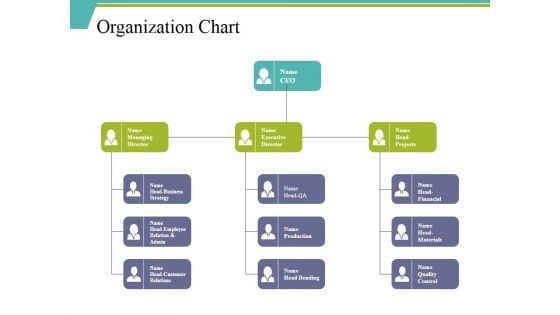
Organization Chart Ppt PowerPoint Presentation File Background Designs
This is a organization chart ppt powerpoint presentation file background designs. This is a three stage process. The stages in this process are ceo, executive director, head financial, production, head bending.
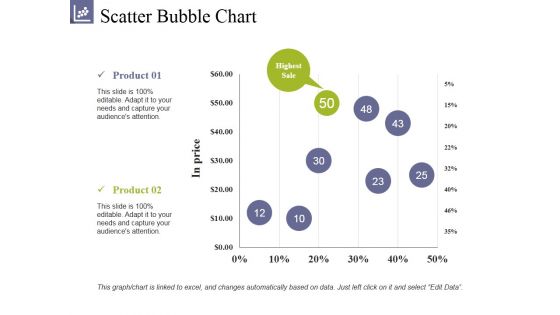
Scatter Bubble Chart Ppt PowerPoint Presentation Summary Clipart
This is a scatter bubble chart ppt powerpoint presentation summary clipart. This is a two stage process. The stages in this process are product, highest sale, in prices, growth, success.
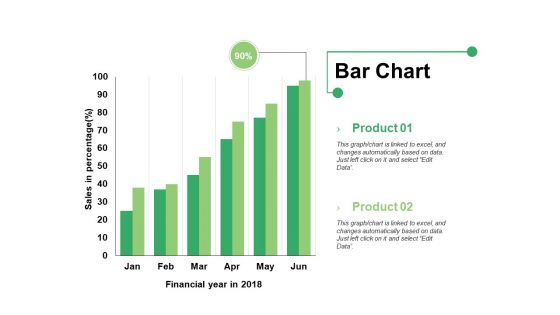
Bar Chart Ppt PowerPoint Presentation Infographics Format Ideas
This is a bar chart ppt powerpoint presentation infographics format ideas. This is a two stage process. The stages in this process are bar graph, product, financial year, sales in percentage.
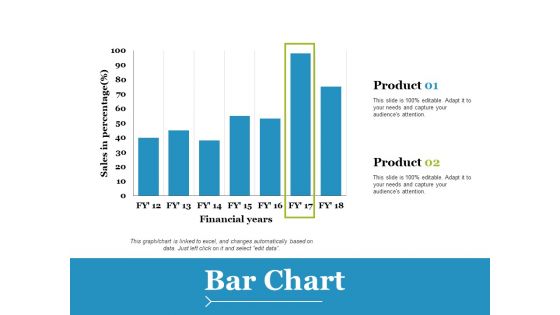
Bar Chart Ppt PowerPoint Presentation Slides Example File
This is a bar chart ppt powerpoint presentation slides example file. This is a two stage process. The stages in this process are product, financial years, sales in percentage.
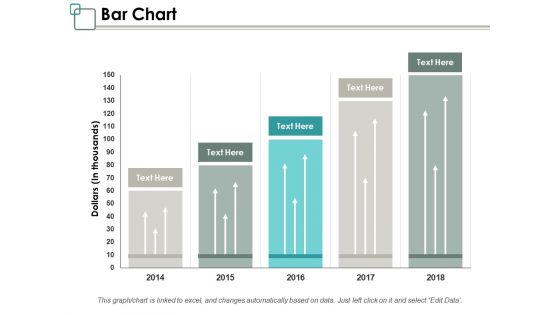
Bar Chart Ppt PowerPoint Presentation Infographic Template Graphics Design
This is a bar chart ppt powerpoint presentation infographic template graphics design. This is a five stage process. The stages in this process are management, marketing, business, percentage, product.
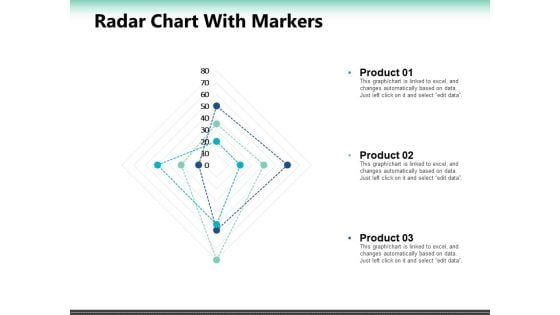
Radar Chart With Markers Ppt PowerPoint Presentation Summary Slide Portrait
This is a radar chart with markers ppt powerpoint presentation summary slide portrait. This is a seven stage process. The stages in this process are percentage, product, business, marketing.
Business Advancement Internal Growth Analyzing Present Scenario Of Firm Icons PDF
This slide provides information regarding the present situation firm financial with cash reserves and employee productivity. Deliver an awe-inspiring pitch with this creative business advancement internal growth analyzing present scenario of firm icons pdf bundle. Topics like employee productivity, growth, cash reserves can be discussed with this completely editable template. It is available for immediate download depending on the needs and requirements of the user.
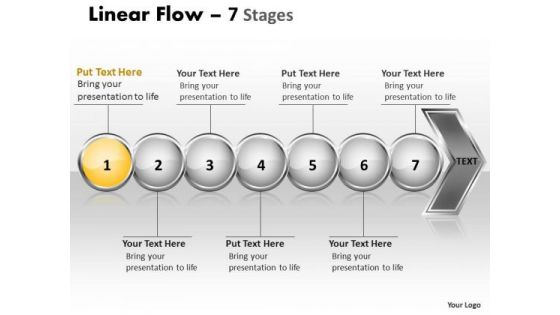
Strategy Ppt Theme Linear Demonstration Of 7 Concepts PowerPoint Backgrounds 2 Graphic
We present our strategy PPT Theme linear Demonstration of 7 concepts powerpoint backgrounds 2 Graphic.Use our Business PowerPoint Templates because; the alphabetical order is a time honored concept. Use our Process and flows PowerPoint Templates because, an occasion for gifting and giving. Use our Arrows PowerPoint Templates because, Expound on why you have discarded some plans as you went along to the apex and came out with the final selection which you know will make you and your team shine. Use our Marketing PowerPoint Templates because, your ideas are fundamentally stable with a broad base of workable possibilities. Use our Success PowerPoint Templates because, Original thinking is the need of the hour. Use these PowerPoint slides for presentations relating to Arrow, arrow chart, block diagram, business, chart, design, development, diagram, direction, element, flow, flow chart, flow diagram, flowchart, graph, linear, linear diagram, management, organization, process, process arrows, process chart, process diagram, process flow, program, section, sign, solution, symbol. The prominent colors used in the PowerPoint template are Yellow, Gray, and White Our Strategy Ppt Theme Linear Demonstration Of 7 Concepts PowerPoint Backgrounds 2 Graphic deliver on convenience and comfort. They offer you a choice of amenities.
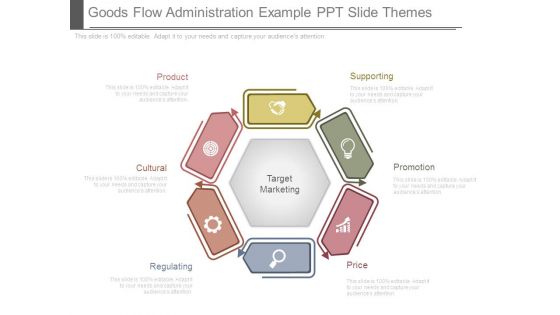
Goods Flow Administration Example Ppt Slide Themes
This is a goods flow administration example ppt slide themes. This is a six stage process. The stages in this process are supporting, promotion, price, regulating, cultural, product, target marketing.

Market Trends Selling Template Powerpoint Themes
This is a market trends selling template powerpoint themes. This is a five stage process. The stages in this process are customer acquisition, customer win back, customer development, fix it improve it make changes, sell the improved product.
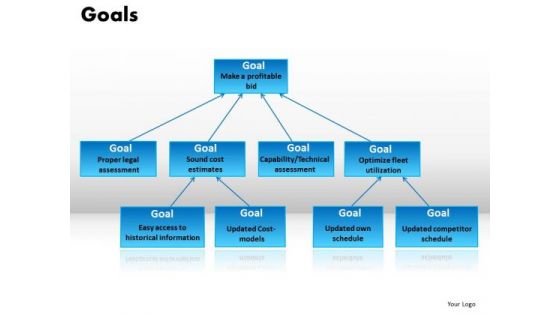
Smaller Goals Leading To Big Goal PowerPoint Templates Ppt
Smaller_Goals_Leading_to_Big_Goal_PowerPoint_templates_PPT-These high quality powerpoint pre-designed slides and powerpoint templates have been carefully created by our professional team to help you impress your audience. All slides have been created and are 100% editable in powerpoint. Each and every property of any graphic - color, size, orientation, shading, outline etc. can be modified to help you build an effective powerpoint presentation. Any text can be entered at any point in the powerpoint template or slide. Simply DOWNLOAD, TYPE and PRESENT! These PowerPoint presentation slides can be used to represent themes relating to --Arrow, alphabet, ball, blue, business, chart, concept, creative, crystal, circle, diagram, shape, round, shadow, reflection, glossy, glowing, shiny, icon, process, flow, link, connect, connection, style, relation, text, textbox-Smaller_Goals_Leading_to_Big_Goal_PowerPoint_templates_PPT Our Smaller Goals Leading To Big Goal PowerPoint Templates Ppt are never equivocal. They help you make a clear point.
Icons Slide Schedule Management Techniques For Project Goals PPT Sample
Help your business to create an attention-grabbing presentation using our Icons Slide Schedule Management Techniques For Project Goals PPT Sample set of slides. The slide contains innovative icons that can be flexibly edited. Choose this Icons Slide Schedule Management Techniques For Project Goals PPT Sample template to create a satisfactory experience for your customers. Go ahead and click the download button. Our Icons Slide Schedule Management Techniques For Project Goals PPT Sample are topically designed to provide an attractive backdrop to any subject. Use them to look like a presentation pro.
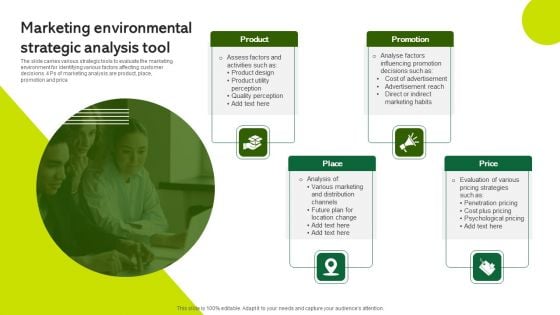
Marketing Environmental Strategic Analysis Tool Themes PDF
The slide carries various strategic tools to evaluate the marketing environment for identifying various factors affecting customer decisions. 4 Ps of marketing analysis are product, place, promotion and price Presenting Marketing Environmental Strategic Analysis Tool Themes PDF to dispense important information. This template comprises four stages. It also presents valuable insights into the topics including Product, Promotion, Place. This is a completely customizable PowerPoint theme that can be put to use immediately. So, download it and address the topic impactfully.
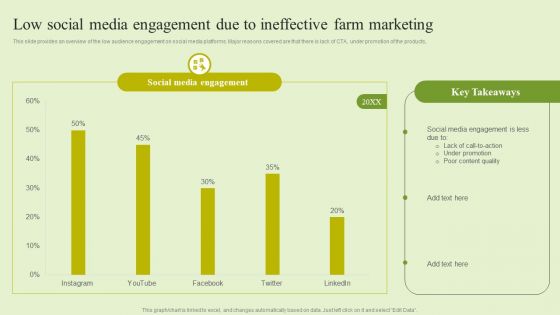
Agriculture Marketing Strategy To Improve Revenue Performance Low Social Media Engagement Due Ineffective Themes PDF
This slide provides an overview of the low audience engagement on social media platforms. Major reasons covered are that there is lack of CTA, under promotion of the products, Are you searching for a Agriculture Marketing Strategy To Improve Revenue Performance Low Social Media Engagement Due Ineffective Themes PDF that is uncluttered, straightforward, and original Its easy to edit, and you can change the colors to suit your personal or business branding. For a presentation that expresses how much effort you have put in, this template is ideal. With all of its features, including tables, diagrams, statistics, and lists, its perfect for a business plan presentation. Make your ideas more appealing with these professional slides. Download Agriculture Marketing Strategy To Improve Revenue Performance Low Social Media Engagement Due Ineffective Themes PDF from Slidegeeks today.
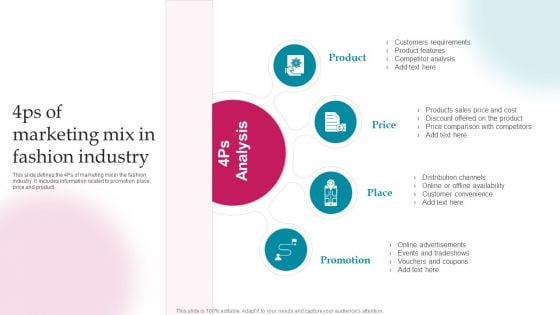
4Ps Of Marketing Mix In Fashion Industry Ppt PowerPoint Presentation File Backgrounds PDF
This slide defines the 4Ps of marketing mix in the fashion industry. It includes information related to promotion, place, price and product. Presenting 4Ps Of Marketing Mix In Fashion Industry Ppt PowerPoint Presentation File Backgrounds PDF to dispense important information. This template comprises four stages. It also presents valuable insights into the topics including Product, Price, Place, Promotion. This is a completely customizable PowerPoint theme that can be put to use immediately. So, download it and address the topic impactfully.
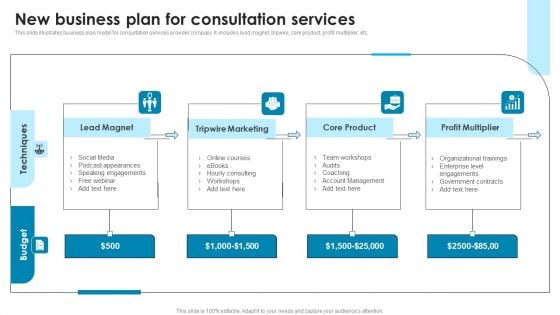
New Business Plan For Consultation Services Graphics PDF
This slide illustrates business plan model for consultation services provider company. It includes lead magnet, tripwire, core product, profit multiplier, etc. Presenting New Business Plan For Consultation Services Graphics PDF to dispense important information. This template comprises four stages. It also presents valuable insights into the topics including Lead Magnet, Tripwire Marketing, Core Product, Profit Multiplier. This is a completely customizable PowerPoint theme that can be put to use immediately. So, download it and address the topic impactfully.
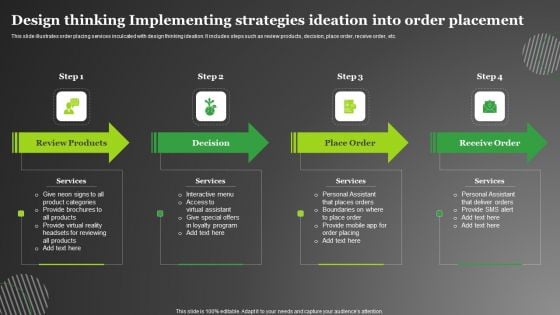
Design Thinking Implementing Strategies Ideation Into Order Placement Download PDF
This slide illustrates order placing services inculcated with design thinking ideation. It includes steps such as review products, decision, place order, receive order, etc. Presenting Design Thinking Implementing Strategies Ideation Into Order Placement Download PDF to dispense important information. This template comprises four stages. It also presents valuable insights into the topics including Review Products, Decision, Place Order, Receive Order. This is a completely customizable PowerPoint theme that can be put to use immediately. So, download it and address the topic impactfully.
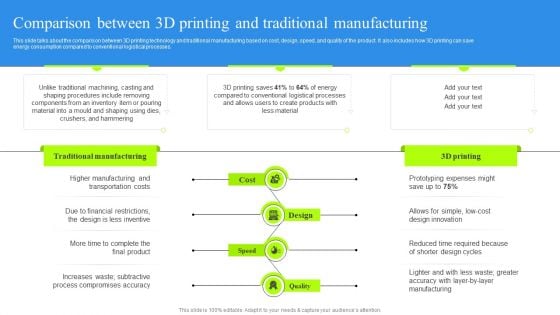
Comparison Between 3D Printing And Traditional Manufacturing Structure PDF
This slide talks about the comparison between 3D printing technology and traditional manufacturing based on cost, design, speed, and quality of the product. It also includes how 3D printing can save energy consumption compared to conventional logistical processes. Are you searching for a Comparison Between 3D Printing And Traditional Manufacturing Structure PDF that is uncluttered, straightforward, and original Its easy to edit, and you can change the colors to suit your personal or business branding. For a presentation that expresses how much effort you have put in, this template is ideal With all of its features, including tables, diagrams, statistics, and lists, its perfect for a business plan presentation. Make your ideas more appealing with these professional slides. Download Comparison Between 3D Printing And Traditional Manufacturing Structure PDF from Slidegeeks today.

Business Marketing Goal PowerPoint Templates And PowerPoint Themes 1012
Business Marketing Goal PowerPoint Templates And PowerPoint Themes 1012-This PowerPoint Template shows four Arrows pointing to the inwards signifying the Teamwork. It portrays the concept of Goal, Idea, plan and team. Use this Powerful Template for Business and Marketing Presentations. This Template will also fit for intellectual Presentations.-Business Marketing Goal PowerPoint Templates And PowerPoint Themes 1012-This PowerPoint template can be used for presentations relating to-Business marketing diagrams, arrows, signs, business, marketing, finance Engage the audience with your thoughts. Our Business Marketing Goal PowerPoint Templates And PowerPoint Themes 1012 will keep them engrossed.
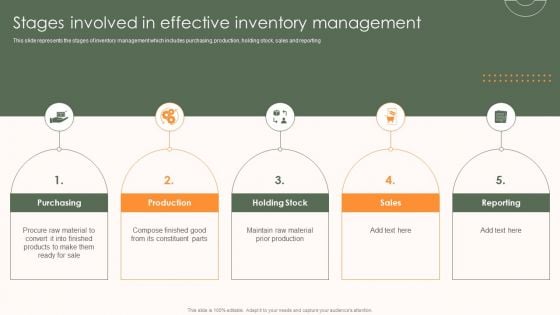
Storage And Supply Chain Stages Involved In Effective Inventory Management Mockup PDF
This slide represents the stages of inventory management which includes purchasing, production, holding stock, sales and reporting. Are you searching for a Storage And Supply Chain Stages Involved In Effective Inventory Management Mockup PDF that is uncluttered, straightforward, and original Its easy to edit, and you can change the colors to suit your personal or business branding. For a presentation that expresses how much effort youve put in, this template is ideal With all of its features, including tables, diagrams, statistics, and lists, its perfect for a business plan presentation. Make your ideas more appealing with these professional slides. Download Storage And Supply Chain Stages Involved In Effective Inventory Management Mockup PDF from Slidegeeks today.
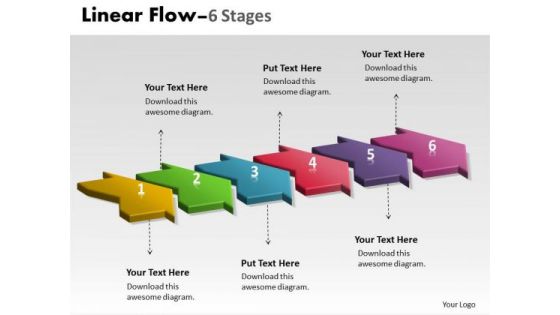
Ppt Work Flow In Past Continuous Six Phase Trade Strategy PowerPoint 1 Design
We present our PPT work flow in past continuous six phase trade strategy power point 1 design. Use our Arrows PowerPoint Templates because; illustrate your plans on using the many social media modes available to inform society at large of the benefits of your product. Use our Shapes PowerPoint Templates because, they enhance the essence of your viable ideas. Use our Business PowerPoint Templates because, the goal also clearly etched in your mind. Use our Signs PowerPoint Templates because; Show them how to persistently hit bulls eye. Use our Process and Flows PowerPoint Templates because, Brilliant ideas popping up all over the place. Use these PowerPoint slides for presentations relating to abstract, algorithm, arrow, business, chart, connection, design, development, diagram, direction, element, flow, graph, linear, linear diagram, management, organization, plan, process, section, segment, set, sign, solution, strategy, symbol, vector. The prominent colors used in the PowerPoint template are Yellow, Green, and Blue Rise above familiar processes. Explore anew with our Ppt Work Flow In Past Continuous Six Phase Trade Strategy PowerPoint 1 Design.
Clustered Column Ppt PowerPoint Presentation Icon Design Inspiration
This is a clustered column ppt powerpoint presentation icon design inspiration. This is a two stage process. The stages in this process are product, financial year, sales in percentage, clustered column.
Open High Low Close Ppt PowerPoint Presentation Icon Model
This is a open high low close ppt powerpoint presentation icon model. This is a five stage process. The stages in this process are high, low, product, business, finance.
Stacked Line Ppt PowerPoint Presentation Icon Format Ideas
This is a stacked line ppt powerpoint presentation icon format ideas. This is a three stage process. The stages in this process are product, in percentage, stacked line, finance.


 Continue with Email

 Home
Home


