Product Diagram
Venn Diagram Data Driven Promotional Guide To Increase Return On Investment Brochure PDF
Whether you have daily or monthly meetings, a brilliant presentation is necessary. Venn Diagram Data Driven Promotional Guide To Increase Return On Investment Brochure PDF can be your best option for delivering a presentation. Represent everything in detail using Venn Diagram Data Driven Promotional Guide To Increase Return On Investment Brochure PDF and make yourself stand out in meetings. The template is versatile and follows a structure that will cater to your requirements. All the templates prepared by Slidegeeks are easy to download and edit. Our research experts have taken care of the corporate themes as well. So, give it a try and see the results.
Building Strong Brand Equity For Business Growth Ppt PowerPoint Presentation Diagram PDF
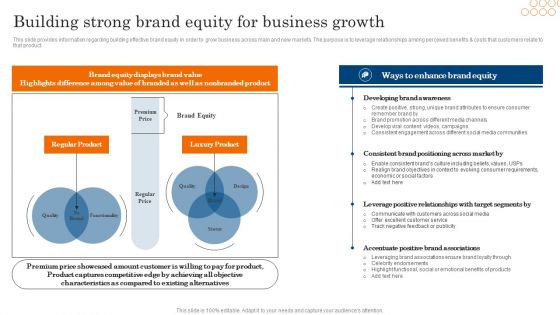
This slide provides information regarding building effective brand equity in order to grow business across main and new markets. The purpose is to leverage relationships among perceived benefits and costs that customers relate to that product. Want to ace your presentation in front of a live audience. Our Building Strong Brand Equity For Business Growth Ppt PowerPoint Presentation Diagram PDF can help you do that by engaging all the users towards you. Slidegeeks experts have put their efforts and expertise into creating these impeccable powerpoint presentations so that you can communicate your ideas clearly. Moreover, all the templates are customizable, and easy to edit and downloadable. Use these for both personal and commercial use.

Venn Diagram Implementing Experimental Marketing Strategies To Improve Conversion Rate Topics PDF
Here you can discover an assortment of the finest PowerPoint and Google Slides templates. With these templates, you can create presentations for a variety of purposes while simultaneously providing your audience with an eye-catching visual experience. Download Venn Diagram Implementing Experimental Marketing Strategies To Improve Conversion Rate Topics PDF to deliver an impeccable presentation. These templates will make your job of preparing presentations much quicker, yet still, maintain a high level of quality. Slidegeeks has experienced researchers who prepare these templates and write high-quality content for you. Later on, you can personalize the content by editing the Venn Diagram Implementing Experimental Marketing Strategies To Improve Conversion Rate Topics PDF.
Deploying Iot Solutions In The Retail Market Venn Diagram Topics PDF
Find highly impressive Deploying Iot Solutions In The Retail Market Venn Diagram Topics PDF on Slidegeeks to deliver a meaningful presentation. You can save an ample amount of time using these presentation templates. No need to worry to prepare everything from scratch because Slidegeeks experts have already done a huge research and work for you. You need to download Deploying Iot Solutions In The Retail Market Venn Diagram Topics PDF for your upcoming presentation. All the presentation templates are 100 percent editable and you can change the color and personalize the content accordingly. Download now
Strategies Employing PPC Advertising To Generate High Quality Leads Venn Diagram Graphics PDF
Find highly impressive Strategies Employing PPC Advertising To Generate High Quality Leads Venn Diagram Graphics PDF on Slidegeeks to deliver a meaningful presentation. You can save an ample amount of time using these presentation templates. No need to worry to prepare everything from scratch because Slidegeeks experts have already done a huge research and work for you. You need to download Strategies Employing PPC Advertising To Generate High Quality Leads Venn Diagram Graphics PDF for your upcoming presentation. All the presentation templates are 100 percent editable and you can change the color and personalize the content accordingly. Download now.
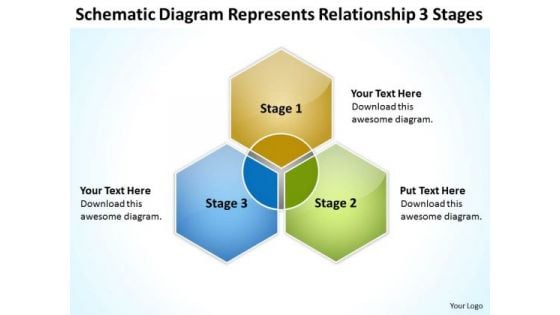
Diagram Represents Relationship 3 Stages How To Develop Business Plan PowerPoint Slides
We present our diagram represents relationship 3 stages how to develop business plan PowerPoint Slides.Present our Competition PowerPoint Templates because You are working at that stage with an air of royalty. Let our PowerPoint Templates and Slides be the jewels in your crown. Present our Business PowerPoint Templates because Our PowerPoint Templates and Slides will let Your superior ideas hit the target always and everytime. Present our Venn Diagrams PowerPoint Templates because Our PowerPoint Templates and Slides help you meet the demand of the Market. Just browse and pick the slides that appeal to your intuitive senses. Download and present our Hexagon PowerPoint Templates because It will Strengthen your hand with your thoughts. They have all the aces you need to win the day. Use our Circle Charts PowerPoint Templates because Our PowerPoint Templates and Slides will let you Hit the target. Go the full distance with ease and elan.Use these PowerPoint slides for presentations relating to venn, diagram, overlapping, graph, overlap, overlapped, business, concept, trio, customer, model, succeed, circles, intersection, culture, success, service, goal, theory, regions, idea, support, three, chart, area, round, words, intersect, employee, company, organization, 3, intersecting, successful, conceptual, ideal. The prominent colors used in the PowerPoint template are Blue, Yellow, Green. Impress the rank and file with our Diagram Represents Relationship 3 Stages How To Develop Business Plan PowerPoint Slides. Everyone will be awed by their ability.
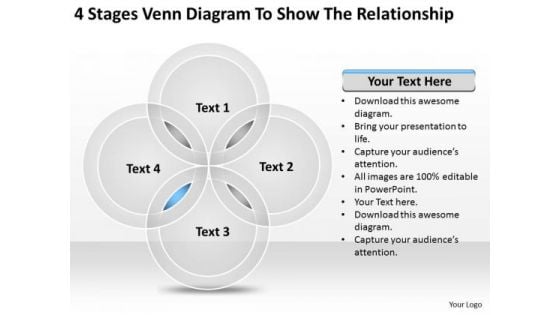
4 Stages Venn Diagram To Show The Relationship Sample Business Plans PowerPoint Slides
We present our 4 stages venn diagram to show the relationship sample business plans PowerPoint Slides.Present our Technology PowerPoint Templates because They will bring a lot to the table. Their alluring flavours will make your audience salivate. Download and present our Marketing PowerPoint Templates because You should Bet on your luck with our PowerPoint Templates and Slides. Be assured that you will hit the jackpot. Download our Business PowerPoint Templates because It will get your audience in sync. Download our Venn Diagrams PowerPoint Templates because You canTake a leap off the starting blocks with our PowerPoint Templates and Slides. They will put you ahead of the competition in quick time. Download our Org Charts PowerPoint Templates because It will Raise the bar of your Thoughts. They are programmed to take you to the next level.Use these PowerPoint slides for presentations relating to Venn, diagram, marketing, plans, mindmap, action, vision, concept, process, mission, tactics, innovation, corporate, business, hierarchy, success, representation, technology, possible, management, manage, illustration, chart, strategy, project, viable, design, organization, desirable, commerce, conceptual, resource, theoretical, goals, performance. The prominent colors used in the PowerPoint template are Blue, Gray, White. You will find our 4 Stages Venn Diagram To Show The Relationship Sample Business Plans PowerPoint Slides are cut out for it. Designed to draw in audience appreciation.
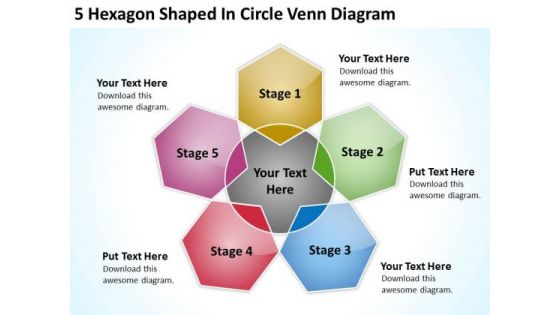
Hexagon Shaped In Circle Venn Diagram Business Plan Software PowerPoint Templates
We present our hexagon shaped in circle venn diagram business plan software PowerPoint templates.Present our Competition PowerPoint Templates because You aspire to touch the sky with glory. Let our PowerPoint Templates and Slides provide the fuel for your ascent. Use our Business PowerPoint Templates because Our PowerPoint Templates and Slides provide you with a vast range of viable options. Select the appropriate ones and just fill in your text. Use our Venn Diagrams PowerPoint Templates because our PowerPoint Templates and Slides are the string of your bow. Fire of your ideas and conquer the podium. Download our Hexagon PowerPoint Templates because Our PowerPoint Templates and Slides are aesthetically designed to attract attention. We gaurantee that they will grab all the eyeballs you need. Use our Circle Charts PowerPoint Templates because Our PowerPoint Templates and Slides ensures Effective communication. They help you put across your views with precision and clarity.Use these PowerPoint slides for presentations relating to venn, diagram, overlapping, graph, overlap, overlapped, business, concept, trio, customer, model, succeed, circles, intersection, culture, success, service, goal, theory, regions, idea, support, three, chart, area, round, words, intersect, employee, company, organization, 3, intersecting, successful, conceptual, ideal. The prominent colors used in the PowerPoint template are Yellow, Green, Blue. Stay calm and collected with our Hexagon Shaped In Circle Venn Diagram Business Plan Software PowerPoint Templates. The audience will admire your cool.
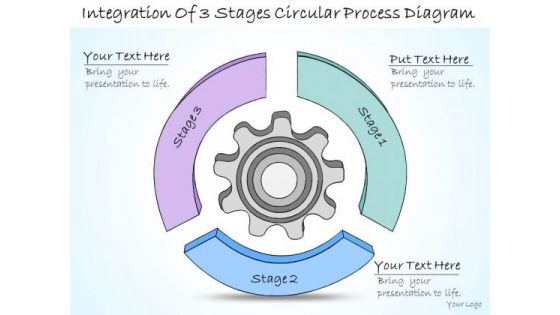
Ppt Slide Integration Of 3 Stages Circular Process Diagram Consulting Firms
Our PPT Slide integration of 3 stages circular process diagram consulting firms Powerpoint Templates Allow You To Do It With Ease. Just Like Picking The Low Hanging Fruit. Boil The Ocean With Your Thoughts. Our Business Plan Powerpoint Templates Will Help Create Waves.
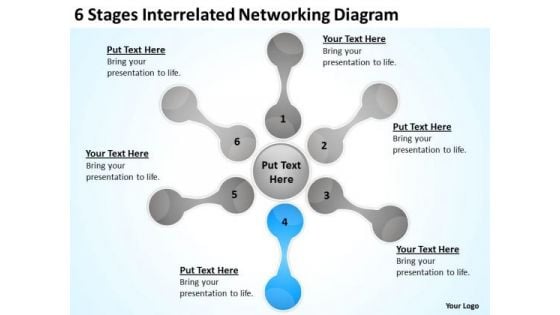
6 Stages Interrelated Networking Diagram Ppt How Business Plan PowerPoint Slides
We present our 6 stages interrelated networking diagram ppt how business plan PowerPoint Slides.Download and present our Network Diagrams PowerPoint Templates because Our PowerPoint Templates and Slides will definately Enhance the stature of your presentation. Adorn the beauty of your thoughts with their colourful backgrounds. Present our Technology PowerPoint Templates because Our PowerPoint Templates and Slides will help you be quick off the draw. Just enter your specific text and see your points hit home. Download our Shapes PowerPoint Templates because Your success is our commitment. Our PowerPoint Templates and Slides will ensure you reach your goal. Download our Circle Charts PowerPoint Templates because Our PowerPoint Templates and Slides are effectively colour coded to prioritise your plans They automatically highlight the sequence of events you desire. Download and present our Process and Flows PowerPoint Templates because Our PowerPoint Templates and Slides will let your team Walk through your plans. See their energy levels rise as you show them the way.Use these PowerPoint slides for presentations relating to abstract, ball, black, blue, business, communication, community, concept, connection, connectivity, contact, corporate, correlation, genealogical, group, hierarchy, human, illustration, interrelation, isolated, link, net, network, people, relation, relationship, social, society, sphere, structure, system, together, topology, transfer, transparent, tree, union, unity. The prominent colors used in the PowerPoint template are Blue, Gray, Black. Our 6 Stages Interrelated Networking Diagram Ppt How Business Plan PowerPoint Slides are not a figment of imagination. They actually help in day to day aspects.
Connection 3d Cubes Process 3 PowerPoint Slides And Ppt Diagram Templates
Connection 3D Cubes Process 3 PowerPoint Slides And PPT Diagram Templates-These high quality, editable pre-designed powerpoint slides have been carefully created by our professional team to help you impress your audience. Each graphic in every slide is vector based and is 100% editable in powerpoint. Each and every property of any slide - color, size, shading etc can be modified to build an effective powerpoint presentation. Use these slides to convey complex business concepts in a simplified manner. Any text can be entered at any point in the powerpoint slide. Simply DOWNLOAD, TYPE and PRESENT! Get a firm grip on the dialogue with our Connection 3d Cubes Process 3 PowerPoint Slides And Ppt Diagram Templates. Try us out and see what a difference our templates make.
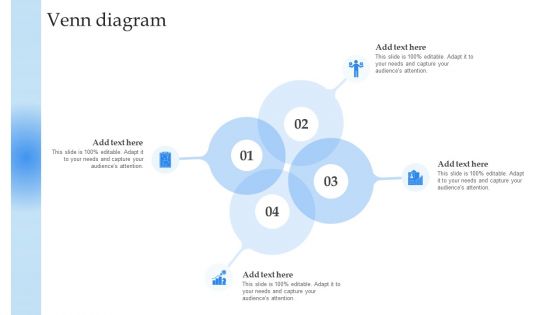
Mobile Promotion Strategic Guide For Micro Businesses Venn Diagram Themes PDF
The best PPT templates are a great way to save time, energy, and resources. Slidegeeks have 100 percent editable powerpoint slides making them incredibly versatile. With these quality presentation templates, you can create a captivating and memorable presentation by combining visually appealing slides and effectively communicating your message. Download Mobile Promotion Strategic Guide For Micro Businesses Venn Diagram Themes PDF from Slidegeeks and deliver a wonderful presentation.
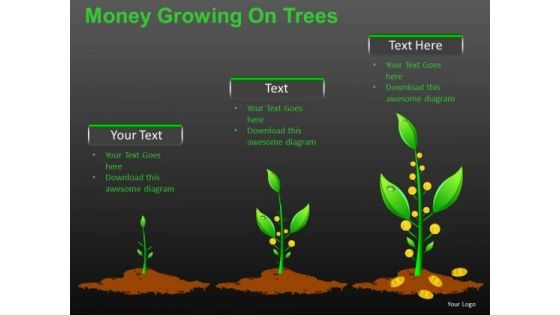
Wealthy Money Growing On Trees PowerPoint Slides And Ppt Diagram Templates
Wealthy Money Growing On Trees PowerPoint Slides And PPT Diagram Templates-These high quality powerpoint pre-designed slides and powerpoint templates have been carefully created by our professional team to help you impress your audience. All slides have been created and are 100% editable in powerpoint. Each and every property of any graphic - color, size, orientation, shading, outline etc. can be modified to help you build an effective powerpoint presentation. Any text can be entered at any point in the powerpoint template or slide. Simply DOWNLOAD, TYPE and PRESENT! Stop your audience's blank gaze. Get them interestedwith our Wealthy Money Growing On Trees PowerPoint Slides And Ppt Diagram Templates. You'll deliver your best presentation yet.
Customised Advertising Strategies Venn Diagram Ppt PowerPoint Presentation Gallery Icon PDF
From laying roadmaps to briefing everything in detail, our templates are perfect for you. You can set the stage with your presentation slides. All you have to do is download these easy-to-edit and customizable templates. Customised Advertising Strategies Venn Diagram Ppt PowerPoint Presentation Gallery Icon PDF will help you deliver an outstanding performance that everyone would remember and praise you for. Do download this presentation today.
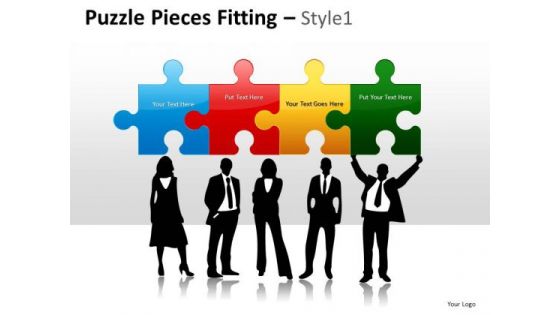
Connection Puzzle Pieces Fitting 1 PowerPoint Slides And Ppt Diagram Templates
Connection Puzzle Pieces Fitting 1 PowerPoint Slides And PPT Diagram Templates-These high quality, editable pre-designed powerpoint slides have been carefully created by our professional team to help you impress your audience. Each graphic in every slide is vector based and is 100% editable in powerpoint. Each and every property of any slide - color, size, shading etc can be modified to build an effective powerpoint presentation. Use these slides to convey complex business concepts in a simplified manner. Any text can be entered at any point in the powerpoint slide. Simply DOWNLOAD, TYPE and PRESENT! Demand it all from our Connection Puzzle Pieces Fitting 1 PowerPoint Slides And Ppt Diagram Templates. They will deliver without fail.
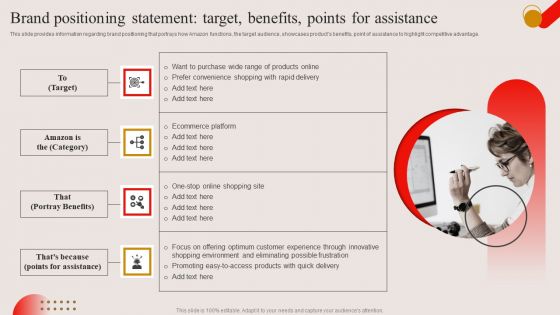
Brand Positioning Statement Target Benefits Points For Assistance Ppt PowerPoint Presentation Diagram Graph Charts PDF
This slide provides information regarding brand positioning that portrays how Amazon functions, the target audience, showcases products benefits, point of assistance to highlight competitive advantage. Get a simple yet stunning designed Brand Positioning Statement Target Benefits Points For Assistance Ppt PowerPoint Presentation Diagram Graph Charts PDF. It is the best one to establish the tone in your meetings. It is an excellent way to make your presentations highly effective. So, download this PPT today from Slidegeeks and see the positive impacts. Our easy to edit Brand Positioning Statement Target Benefits Points For Assistance Ppt PowerPoint Presentation Diagram Graph Charts PDF can be your go to option for all upcoming conferences and meetings. So, what are you waiting for Grab this template today.
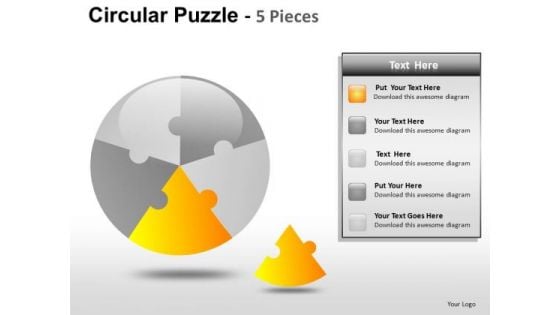
Identify Pieces 5 Stage Circle PowerPoint Slides And Ppt Diagram Templates
Identify pieces 5 stage circle PowerPoint Slides And PPT Diagram TemplatesThese high quality, editable pre-designed powerpoint slides have been carefully created by our professional team to help you impress your audience. Each graphic in every slide is vector based and is 100% editable in powerpoint. Each and every property of any slide - color, size, shading etc can be modified to build an effective powerpoint presentation. Use these slides to convey complex business concepts in a simplified manner. Any text can be entered at any point in the powerpoint slide. Simply DOWNLOAD, TYPE and PRESENT! Launch products with our Identify Pieces 5 Stage Circle PowerPoint Slides And Ppt Diagram Templates. Download without worries with our money back guaranteee.
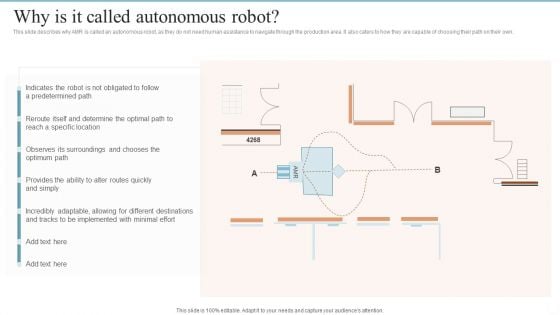
AMR Robot Why Is IT Called Autonomous Robot Ppt PowerPoint Presentation Diagram Images PDF
This slide describes why AMR is called an autonomous robot, as they do not need human assistance to navigate through the production area. It also caters to how they are capable of choosing their path on their own. If you are looking for a format to display your unique thoughts, then the professionally designed AMR Robot Why Is IT Called Autonomous Robot Ppt PowerPoint Presentation Diagram Images PDF is the one for you. You can use it as a Google Slides template or a PowerPoint template. Incorporate impressive visuals, symbols, images, and other charts. Modify or reorganize the text boxes as you desire. Experiment with shade schemes and font pairings. Alter, share or cooperate with other people on your work. Download AMR Robot Why Is IT Called Autonomous Robot Ppt PowerPoint Presentation Diagram Images PDF and find out how to give a successful presentation. Present a perfect display to your team and make your presentation unforgettable.
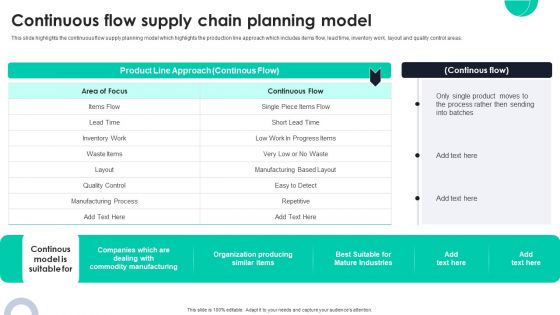
Continuous Flow Supply Chain Planning Model Ppt PowerPoint Presentation Diagram Lists PDF
This slide highlights the continuous flow supply planning model which highlights the production line approach which includes items flow, lead time, inventory work, layout and quality control areas. Get a simple yet stunning designed Continuous Flow Supply Chain Planning Model Ppt PowerPoint Presentation Diagram Lists PDF. It is the best one to establish the tone in your meetings. It is an excellent way to make your presentations highly effective. So, download this PPT today from Slidegeeks and see the positive impacts. Our easy to edit Continuous Flow Supply Chain Planning Model Ppt PowerPoint Presentation Diagram Lists PDF can be your go to option for all upcoming conferences and meetings. So, what are you waiting for Grab this template today.
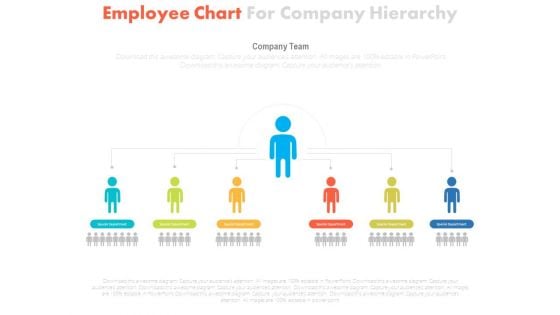
Chart For Knowledge Worker Productivity Powerpoint Template
Our above PowerPoint template has been designed with employees chart. This slide is suitable to present workers productivity and knowledge. Use this business diagram to present your work in a more smart and precise manner.
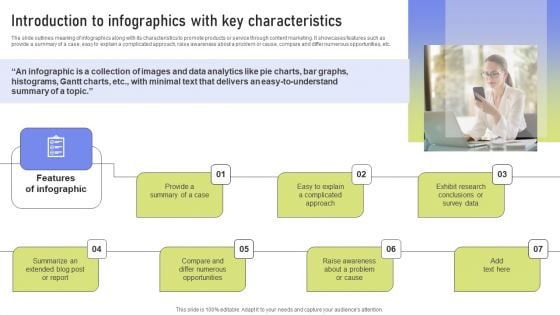
Introduction To Infographics With Key Characteristics Ppt PowerPoint Presentation Diagram PDF
The slide outlines meaning of infographics along with its characteristics to promote products or service through content marketing. It showcases features such as provide a summary of a case, easy to explain a complicated approach, raise awareness about a problem or cause, compare and differ numerous opportunities, etc. If your project calls for a presentation, then Slidegeeks is your go to partner because we have professionally designed, easy to edit templates that are perfect for any presentation. After downloading, you can easily edit Introduction To Infographics With Key Characteristics Ppt PowerPoint Presentation Diagram PDF and make the changes accordingly. You can rearrange slides or fill them with different images. Check out all the handy templates
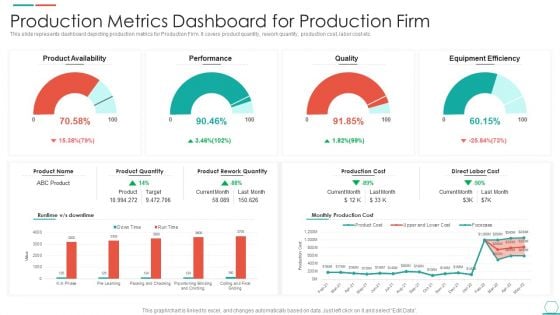
Production Metrics Dashboard For Production Firm Rules PDF
This slide represents dashboard depicting production metrics for Production Firm. It covers product quantity, rework quantity, production cost, labor cost etc. Showcasing this set of slides titled Production Metrics Dashboard For Production Firm Rules PDF. The topics addressed in these templates are Equipment Efficiency, Product Availability, Production Cost. All the content presented in this PPT design is completely editable. Download it and make adjustments in color, background, font etc. as per your unique business setting.
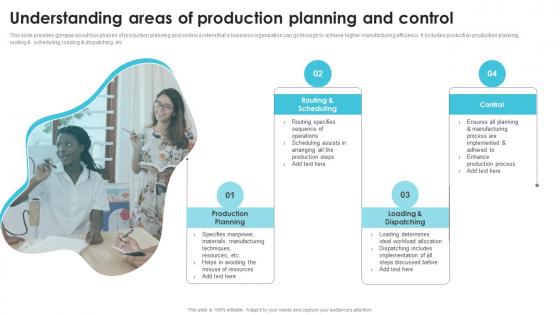
Understanding Areas Of Production Planning Streamlining Production Operational Microsoft PDF
This slide provides glimpse about four phases of production planning and control system that a business organization can go through to achieve higher manufacturing efficiency. It includes production production planning, routing and scheduling, loading and dispatching, etc. The Understanding Areas Of Production Planning Streamlining Production Operational Microsoft PDF is a compilation of the most recent design trends as a series of slides. It is suitable for any subject or industry presentation, containing attractive visuals and photo spots for businesses to clearly express their messages. This template contains a variety of slides for the user to input data, such as structures to contrast two elements, bullet points, and slides for written information. Slidegeeks is prepared to create an impression. This slide provides glimpse about four phases of production planning and control system that a business organization can go through to achieve higher manufacturing efficiency. It includes production production planning, routing and scheduling, loading and dispatching, etc.
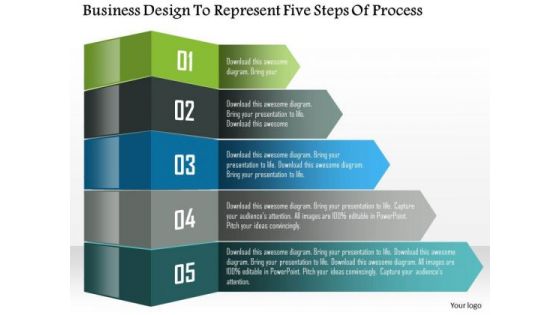
Business Diagram Business Design To Represent Five Steps Of Process Presentation Template
Our above diagram displays five text boxes. This diagram helps to demonstrate major five steps of a process or business unit. Download this diagram to make professional presentations.
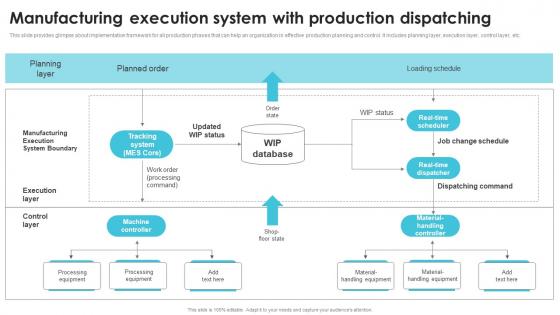
Manufacturing Execution System With Production Streamlining Production Operational Graphics PDF
This slide provides glimpse about implementation framework for all production phases that can help an organization in effective production planning and control. It includes planning layer, execution layer, control layer, etc. If your project calls for a presentation, then Slidegeeks is your go-to partner because we have professionally designed, easy-to-edit templates that are perfect for any presentation. After downloading, you can easily edit Manufacturing Execution System With Production Streamlining Production Operational Graphics PDF and make the changes accordingly. You can rearrange slides or fill them with different images. Check out all the handy templates This slide provides glimpse about implementation framework for all production phases that can help an organization in effective production planning and control. It includes planning layer, execution layer, control layer, etc.
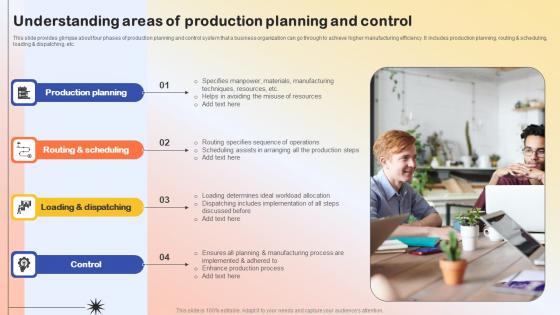
Understanding Areas Of Production Planning Production Quality Administration Slides Pdf
This slide provides glimpse about four phases of production planning and control system that a business organization can go through to achieve higher manufacturing efficiency. It includes production planning, routing and scheduling, loading and dispatching, etc.The Understanding Areas Of Production Planning Production Quality Administration Slides Pdf is a compilation of the most recent design trends as a series of slides. It is suitable for any subject or industry presentation, containing attractive visuals and photo spots for businesses to clearly express their messages. This template contains a variety of slides for the user to input data, such as structures to contrast two elements, bullet points, and slides for written information. Slidegeeks is prepared to create an impression. This slide provides glimpse about four phases of production planning and control system that a business organization can go through to achieve higher manufacturing efficiency. It includes production planning, routing and scheduling, loading and dispatching, etc.
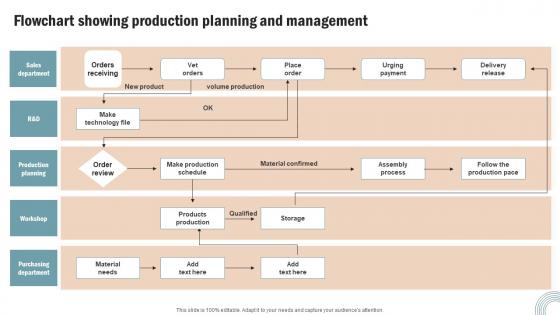
Flowchart Showing Production Operations Strategy Improve Business Productivity Clipart Pdf
If you are looking for a format to display your unique thoughts, then the professionally designed Flowchart Showing Production Operations Strategy Improve Business Productivity Clipart Pdf is the one for you. You can use it as a Google Slides template or a PowerPoint template. Incorporate impressive visuals, symbols, images, and other charts. Modify or reorganize the text boxes as you desire. Experiment with shade schemes and font pairings. Alter, share or cooperate with other people on your work. Download Flowchart Showing Production Operations Strategy Improve Business Productivity Clipart Pdf and find out how to give a successful presentation. Present a perfect display to your team and make your presentation unforgettable. Our Flowchart Showing Production Operations Strategy Improve Business Productivity Clipart Pdf are topically designed to provide an attractive backdrop to any subject. Use them to look like a presentation pro.
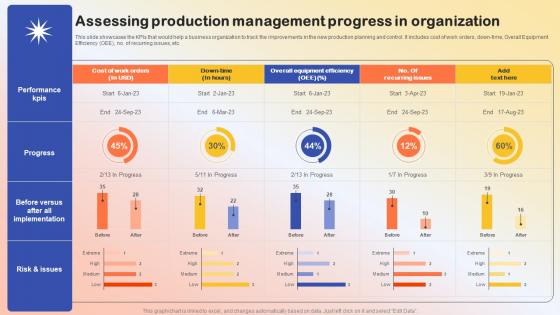
Assessing Production Management Progress In Production Quality Administration Introduction Pdf
This slide showcases the KPIs that would help a business organization to track the improvements in the new production planning and control. It includes cost of work orders, down-time, Overall Equipment Efficiency OEE, no. of recurring issues, etc.Create an editable Assessing Production Management Progress In Production Quality Administration Introduction Pdf that communicates your idea and engages your audience. Whether you are presenting a business or an educational presentation, pre-designed presentation templates help save time. Assessing Production Management Progress In Production Quality Administration Introduction Pdf is highly customizable and very easy to edit, covering many different styles from creative to business presentations. Slidegeeks has creative team members who have crafted amazing templates. So, go and get them without any delay. This slide showcases the KPIs that would help a business organization to track the improvements in the new production planning and control. It includes cost of work orders, down time, Overall Equipment Efficiency OEE no. of recurring issues, etc.

Assessing Production Management Progress Streamlining Production Operational Background PDF
This slide showcases the KPIs that would help a business organization to track the improvements in the new production planning and control. It includes cost of work orders, down-time, Overall Equipment Efficiency OEE, no. of recurring issues, etc. Create an editable Assessing Production Management Progress Streamlining Production Operational Background PDF that communicates your idea and engages your audience. Whether you are presenting a business or an educational presentation, pre-designed presentation templates help save time. Assessing Production Management Progress Streamlining Production Operational Background PDF is highly customizable and very easy to edit, covering many different styles from creative to business presentations. Slidegeeks has creative team members who have crafted amazing templates. So, go and get them without any delay. This slide showcases the KPIs that would help a business organization to track the improvements in the new production planning and control. It includes cost of work orders, down-time, Overall Equipment Efficiency OEE, no. of recurring issues, etc.
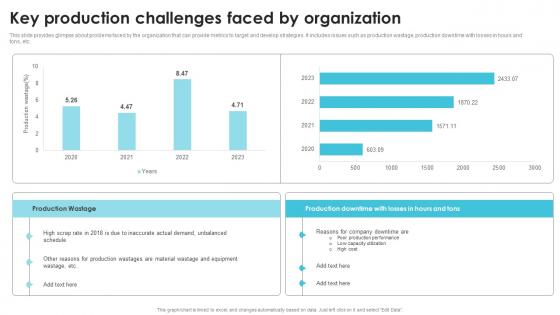
Key Production Challenges Faced Streamlining Production Operational Professional PDF
This slide provides glimpse about problems faced by the organization that can provide metrics to target and develop strategies. It includes issues such as production wastage, production downtime with losses in hours and tons, etc. Whether you have daily or monthly meetings, a brilliant presentation is necessary. Key Production Challenges Faced Streamlining Production Operational Professional PDF can be your best option for delivering a presentation. Represent everything in detail using Key Production Challenges Faced Streamlining Production Operational Professional PDF and make yourself stand out in meetings. The template is versatile and follows a structure that will cater to your requirements. All the templates prepared by Slidegeeks are easy to download and edit. Our research experts have taken care of the corporate themes as well. So, give it a try and see the results. This slide provides glimpse about problems faced by the organization that can provide metrics to target and develop strategies. It includes issues such as production wastage, production downtime with losses in hours and tons, etc.
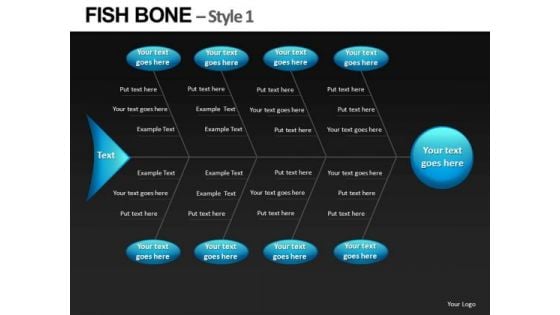
Ppt Templates Fishbone Diagrams
PPT templates FishBone Diagrams-These high quality powerpoint pre-designed slides and powerpoint templates have been carefully created by our professional team to help you impress your audience. All slides have been created and are 100% editable in powerpoint. Each and every property of any graphic - color, size, orientation, shading, outline etc. can be modified to help you build an effective powerpoint presentation. Any text can be entered at any point in the powerpoint template or slide. Simply DOWNLOAD, TYPE and PRESENT!These PowerPoint Presentation slides can be used for themes relating to--Arrow, cause, defect, deficiency, diagram, document, effect, envelope, environment, fishbone, flow, industry, kahashiwara, machine, manufacture, material, paper, pencil, safety, sketch Get your audience familiar with your thoughts. Acclimatise them with our Ppt Templates Fishbone Diagrams.
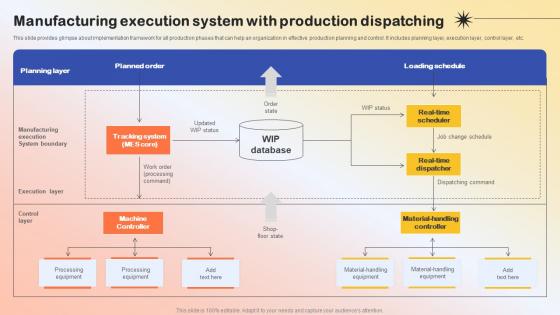
Manufacturing Execution System With Production Production Quality Administration Microsoft Pdf
This slide provides glimpse about implementation framework for all production phases that can help an organization in effective production planning and control. It includes planning layer, execution layer, control layer, etc.If your project calls for a presentation, then Slidegeeks is your go-to partner because we have professionally designed, easy-to-edit templates that are perfect for any presentation. After downloading, you can easily edit Manufacturing Execution System With Production Production Quality Administration Microsoft Pdf and make the changes accordingly. You can rearrange slides or fill them with different images. Check out all the handy templates This slide provides glimpse about implementation framework for all production phases that can help an organization in effective production planning and control. It includes planning layer, execution layer, control layer, etc.
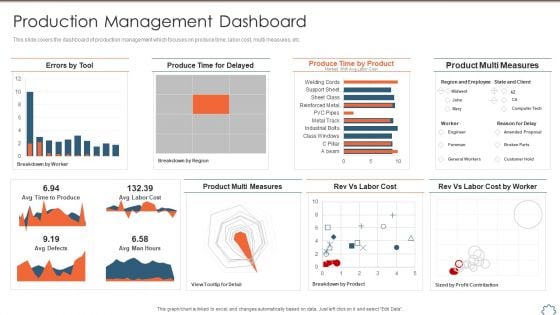
Total Productive Management At Workplace Production Management Dashboard Formats PDF
This slide covers the dashboard of production management which focuses on produce time, labor cost, multi measures, etc. Deliver and pitch your topic in the best possible manner with this total productive management at workplace production management dashboard formats pdf. Use them to share invaluable insights on product multi measures, produce time by product, product multi measures, produce time for delayed, rev vs labor cost and impress your audience. This template can be altered and modified as per your expectations. So, grab it now.
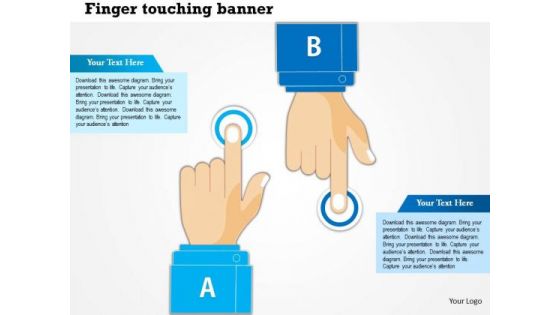
Business Diagram Finger Touch With Human Hands For Technology Presentation Template
Concept of touch technology has been displayed in this business diagram. This business diagram contains the graphic of finger and human hand. This diagram can be used for technology related presentations.
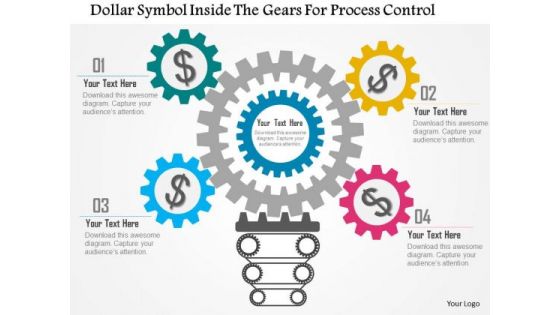
Business Diagram Dollar Symbol Inside The Gears For Process Control Presentation Template
This business diagram has been designed with graphic of dollar symbol and gears. Download this diagram to analyze the key points. This diagram offers a way for your audience to visually conceptualize the process.
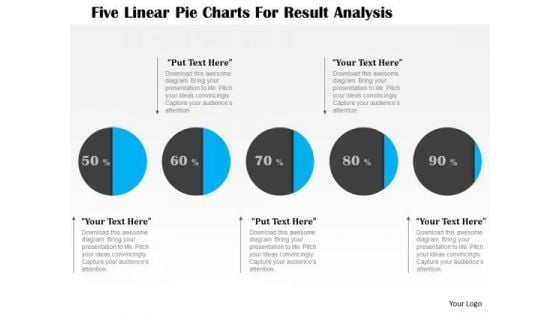
Business Diagram Five Linear Pie Charts For Result Analysis Presentation Template
This business diagram displays graphic of five staged process flow diagram. This PPT slide contains the concept of business data representation. Use this diagram to build professional presentation for your viewers.

Business Diagram 3d Lock With Pie Graph For Result Representation PowerPoint Slide
This Power Point diagram has been crafted with pie chart in shape of lock. It contains diagram of lock pie chart to compare and present data in an effective manner. Use this diagram to build professional presentations for your viewers.
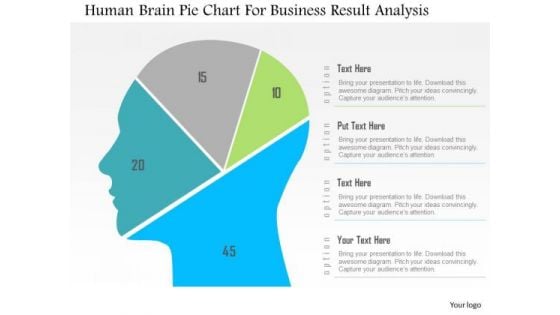
Business Diagram Human Brain Pie Chart For Business Result Analysis PowerPoint Slide
This diagram displays human face graphic divided into sections. This section can be used for data display. Use this diagram to build professional presentations for your viewers.
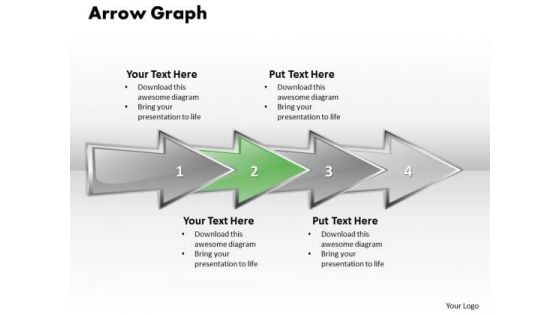
Ppt Linear Abstraction Arrow Cause And Effect Diagram PowerPoint Template Templates
PPT linear abstraction arrow cause and effect diagram powerpoint template Templates-Use this linear diagram to emphasize the process of your business and corporate growth. Highlight your ideas broad based on strong fundamentals and illustrate how they step by step achieve the set growth factor.-PPT linear abstraction arrow cause and effect diagram powerpoint template Templates-analysis, arrow, background, business, chart, communication, concept, construction, delivery, design, development, engineering, fabrication, feasibiliti, generated, growth, idea, industry, making, production, products, science, sequence, shape Analyse your inputs with our Ppt Linear Abstraction Arrow Cause And Effect Diagram PowerPoint Template Templates. Discover ways to increase your output.

Business Diagram Templates 3d Men Group Of Colorful People Under Umbrella PowerPoint Slides
We present our business diagram templates 3d men group of colorful people under umbrella PowerPoint Slides.Download our Finance PowerPoint Templates because Our PowerPoint Templates and Slides will embellish your thoughts. See them provide the desired motivation to your team. Present our Business PowerPoint Templates because our PowerPoint Templates and Slides are the string of your bow. Fire of your ideas and conquer the podium. Download and present our Umbrellas PowerPoint Templates because You can Channelise the thoughts of your team with our PowerPoint Templates and Slides. Urge them to focus on the goals you have set. Present our People PowerPoint Templates because Our PowerPoint Templates and Slides are Clear and concise. Use them and dispel any doubts your team may have. Present our Shapes PowerPoint Templates because Our PowerPoint Templates and Slides are the chords of your song. String them along and provide the lilt to your views.Use these PowerPoint slides for presentations relating to 3d, Agent, Blue, Change, Character, Co-Operation, Concept, Cooperation, Covered, Danger, Family, Figure, Finances, Green, Group, Guy, Healthcare, Healthy, Icon, Idea, Illustration, Life, Lifestyle, Men, Objects, Partnership, People, Person, Puppet, Purple, Rain, Red, Safety, Security, Shelter, System, Team, Teamwork, Themes, Togetherness, Umbrella, White, Yellow. The prominent colors used in the PowerPoint template are Red, Yellow, Green. PowerPoint presentation experts tell us our business diagram templates 3d men group of colorful people under umbrella PowerPoint Slides will make the presenter look like a pro even if they are not computer savvy. Use our Cooperation PowerPoint templates and PPT Slides have awesome images to get your point across. You can be sure our business diagram templates 3d men group of colorful people under umbrella PowerPoint Slides are second to none. Presenters tell us our Character PowerPoint templates and PPT Slides will make you look like a winner. You can be sure our business diagram templates 3d men group of colorful people under umbrella PowerPoint Slides are designed by a team of presentation professionals. Professionals tell us our Character PowerPoint templates and PPT Slides will impress their bosses and teams. Our Business Diagram Templates 3d Men Group Of Colorful People Under Umbrella PowerPoint Slides are products of detailed craftsmanship. They are exact in every aspect.
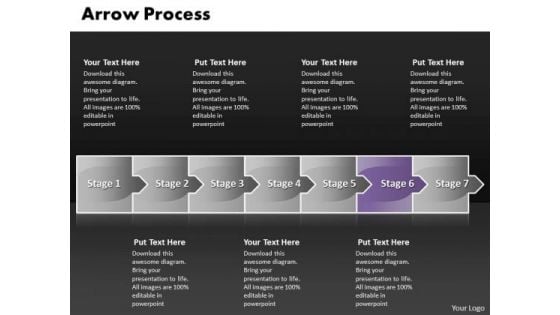
Process Ppt Theme Arrow 7 States Diagram Time Management PowerPoint Graphic
process PPT Theme arrow 7 states diagram time management powerpoint Graphic-This amazing diagram provides trainers a tool to teach the procedure in a highly visual, engaging way. The perfect look and feel of our PowerPoint diagram lets you seamlessly build out your training capabilities as your need demand it.-process PPT Theme arrow 7 states diagram time management powerpoint Graphic-Advertising, Arrow, Concept, Corporate, Creative, Design, Direction, Flow, Illustration, Info, Graphic, Instruction, Label, Layout, Manual, Modern, Number, Offer, Order, Pointer, Product, Progress, Promotion, Sequence, Special, Step, Symbol Melt their hearts with our Process Ppt Theme Arrow 7 States Diagram Time Management PowerPoint Graphic. You will be at the top of your game.
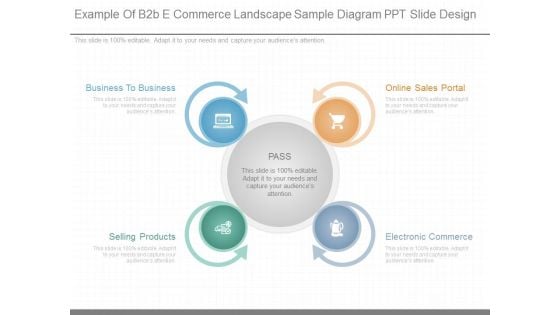
Example Of B2b E Commerce Landscape Sample Diagram Ppt Slide Design
This is a example of b2b e commerce landscape sample diagram ppt slide design. This is a four stage process. The stages in this process are pass, online sales portal, electronic?commerce, selling products, business to business.
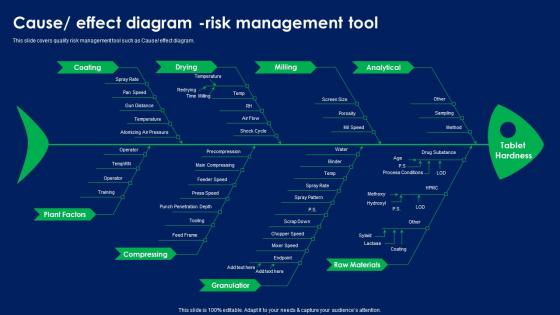
Cause Effect Diagram Risk Management Tool Quality Risk Assessment Summary PDF
This slide covers quality risk management tool such as Cause effect diagram. Boost your pitch with our creative Cause Effect Diagram Risk Management Tool Quality Risk Assessment Summary PDF Deliver an awe-inspiring pitch that will mesmerize everyone. Using these presentation templates you will surely catch everyones attention. You can browse the ppts collection on our website. We have researchers who are experts at creating the right content for the templates. So you do not have to invest time in any additional work. Just grab the template now and use them. This slide covers quality risk management tool such as Cause effect diagram.
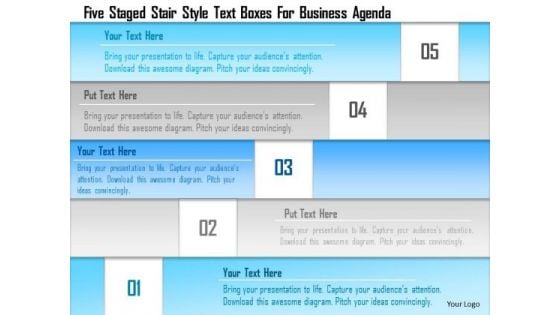
Business Diagram Five Staged Stair Style Text Boxes For Business Agenda Presentation Template
This business diagram displays five staged linear text boxes. This diagram is suitable to depict flow of business activities or steps. Download this professional slide to present information in an attractive manner.
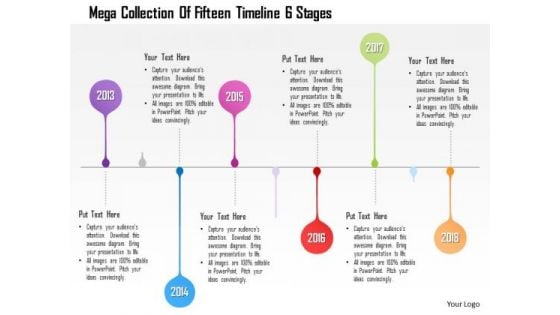
Business Diagram Mega Collection Of Fifteen Timeline 6 Stages Presentation Template
This business diagram has been designed with graphic of linear business timeline. This slide can be used for business planning and management. Use this diagram for your business and success milestones related presentations.
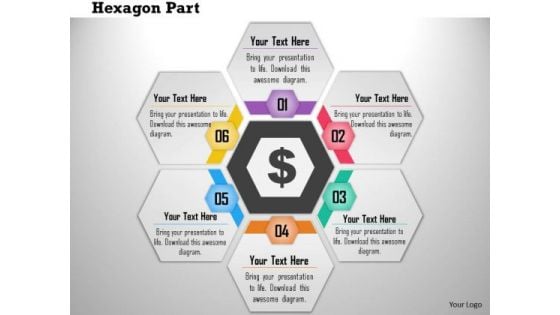
Business Diagram Six Hexagon Text Boxes In Cyclic Order Presentation Template
This PowerPoint template has been designed with graphic of six hexagon text boxes in cyclic order. This diagram can be used to depict data flow. Use this diagram to build exclusive presentation for your viewers.
Business Diagram 3d Human Hand Picking Gear From Multiple Gears Presentation Template
This business diagram has been designed with graphic of 3d human hand picking up gear from multiple gears. This diagram is 100 percent editable just insert the contents and your views are best expressed.

Business Diagram Four Pie Chart For Data Driven Result Analysis Of Business PowerPoint Slide
This business diagram displays graphic of pie charts in shape of flasks. This business slide is suitable to present and compare business data. Use this diagram to build professional presentations for your viewers.
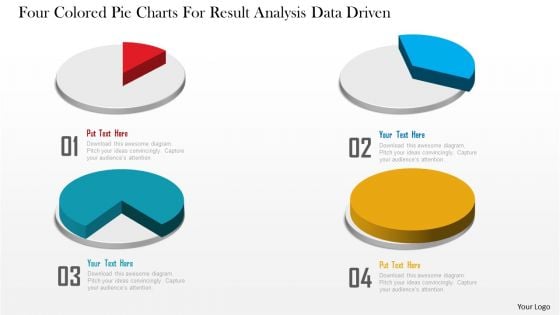
Business Diagram Four Colored Pie Charts For Result Analysis Data Driven PowerPoint Slide
This business diagram displays graphic of pie charts. This business slide is suitable to present and compare business data. Use this diagram to build professional presentations for your viewers.
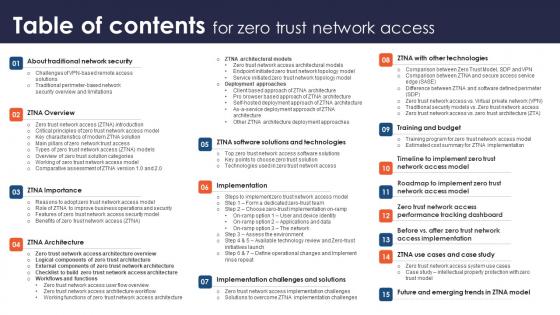
Table Of Contents For Zero Trust Network Access Ppt Diagram Lists
Whether you have daily or monthly meetings, a brilliant presentation is necessary. Table Of Contents For Zero Trust Network Access Ppt Diagram Lists can be your best option for delivering a presentation. Represent everything in detail using Table Of Contents For Zero Trust Network Access Ppt Diagram Lists and make yourself stand out in meetings. The template is versatile and follows a structure that will cater to your requirements. All the templates prepared by Slidegeeks are easy to download and edit. Our research experts have taken care of the corporate themes as well. So, give it a try and see the results. Our Table Of Contents For Zero Trust Network Access Ppt Diagram Lists are topically designed to provide an attractive backdrop to any subject. Use them to look like a presentation pro.
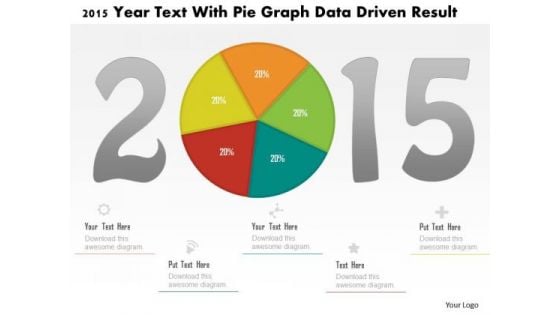
Business Diagram 2015 Year Text With Pie Graph Data Driven Result PowerPoint Slide
This business diagram displays 2015 year numbers with pie chart. This diagram is suitable to display business strategy for year 2015. Download this professional slide to present information in an attractive manner
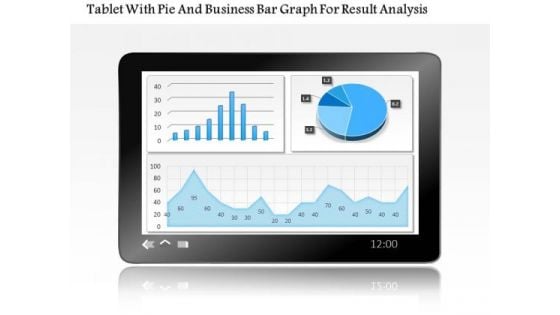
Business Diagram Tablet With Pie And Business Bar Graph For Result Analysis PowerPoint Slide
This PowerPoint template displays technology gadgets with various business charts. Use this diagram slide, in your presentations to make business reports for statistical analysis. You may use this diagram to impart professional appearance to your presentations.
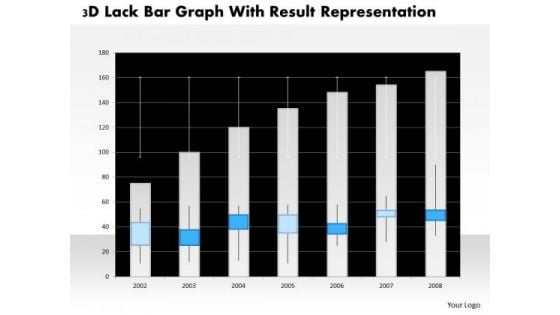
Business Diagram 3d Lack Bar Graph With Result Representation PowerPoint Slide
This business diagram has graphic of 3d lack bar graph. This diagram is a data visualization tool that gives you a simple way to present statistical information. This slide helps your audience examine and interpret the data you present.
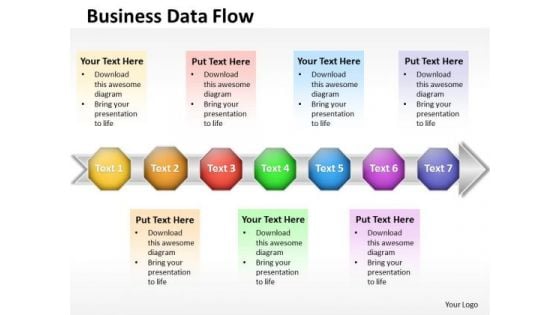
Ppt 7 Stages Self Concept PowerPoint Presentation Download Data Flow Diagram Templates
PPT 7 stages self concept powerpoint presentation download data flow diagram Templates-Use this 3D PowerPoint Diagram to describe seven stages of Linear Process through text boxes on Arrow. PowerPoint text boxes diagram templates are designed to help you place your text in a professional layout.-PPT 7 stages self concept powerpoint presentation download data flow diagram Templates-Achievement, Actualization, Basic, Belonging, Blue, Chart, Confidence, Diagram, Elements, Essential, Fundamental, Glossy, Goals, Gradient, Health, Hierarchical, Hierarchy, Human, Illustration, Isolated, Layer, Level, Love, Morality, Motivation, Needs, Person, Psychological, Psychology, Pyramid Inform teams with our Ppt 7 Stages Self Concept PowerPoint Presentation Download Data Flow Diagram Templates. Download without worries with our money back guaranteee.
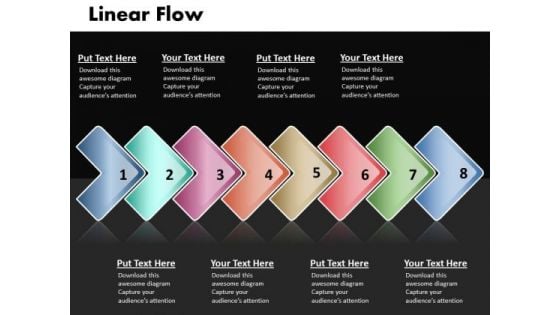
Ppt Linear Demo Create Flow Chart PowerPoint 8 State Diagram Templates
PPT linear demo create flow chart powerpoint 8 state diagram Templates-Display the direction of the specific activities involved and how to put these in a proper manner for achieving the desired goal.-PPT linear demo create flow chart powerpoint 8 state diagram Templates-Abstract, Arrow, Arrow Chart, Business, Design, Development, Diagram, Direction, Element, Flow, Flow Chart, Flow Diagram, Flowchart, Graph, Linear, Management, Model, Motion, Organization, Plan, Process, Process Arrows, Process Chart, Process Diagram, Process Flow, Program, Section, Segment, Set, Sign, Solution, Strategy, Symbol, Technology Get them to applaud you with our Ppt Linear Demo Create Flow Chart PowerPoint 8 State Diagram Templates. You will come out on top.
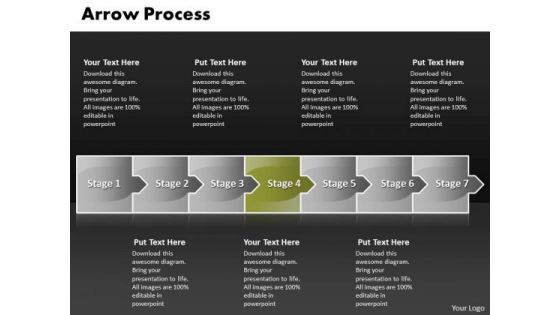
Flow PowerPoint Template Arrow Process 7 States Diagram Ppt Time Management 5 Design
flow PowerPoint template arrow process 7 states diagram ppt time management 5 design-Visually support your ideas and define your message with our above template. This attractive image makes your presentations professional and interactive. Deliver amazing presentations to mesmerize your audience.-flow PowerPoint template arrow process 7 states diagram ppt time management 5 design-Advertising, Arrow, Concept, Corporate, Creative, Design, Direction, Flow, Illustration, Info, Graphic, Instruction, Label, Layout, Manual, Modern, Number, Offer, Order, Pointer, Product, Progress, Promotion, Sequence, Special, Step, Symbol Get fascinated by our Flow PowerPoint Template Arrow Process 7 States Diagram Ppt Time Management 5 Design. They will keep attracting your attention.
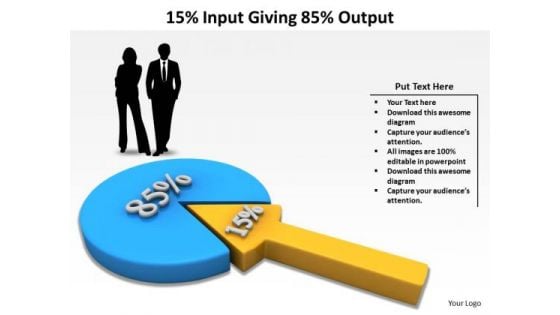
Mba Models And Frameworks 15 Input Giving 85 Output Marketing Diagram
Document Your Views On Our MBA models and frameworks 15 Input Giving 85 Output Marketing diagram Powerpoint Templates. They Will Create A Strong Impression.
Team Productivity Management Icon For Productivity Enhancement Topics PDF
Presenting Team Productivity Management Icon For Productivity Enhancement Topics PDF to dispense important information. This template comprises Three stages. It also presents valuable insights into the topics including Team Productivity Management, Icon For Productivity. This is a completely customizable PowerPoint theme that can be put to use immediately. So, download it and address the topic impactfully.
Aims And Objectives Business Goals Diagram With Icons Ppt PowerPoint Presentation Gallery Designs PDF
Presenting aims and objectives business goals diagram with icons ppt powerpoint presentation gallery designs pdf to dispense important information. This template comprises six stages. It also presents valuable insights into the topics including aims and objectives business goals diagram with icons. This is a completely customizable PowerPoint theme that can be put to use immediately. So, download it and address the topic impactfully.
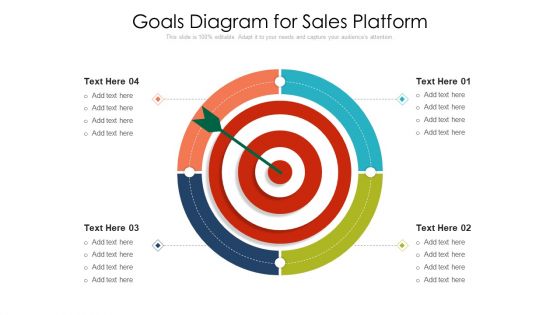
Goals Diagram For Sales Platform Ppt PowerPoint Presentation Infographic Template Portrait PDF
Presenting goals diagram for sales platform ppt powerpoint presentation infographic template portrait pdf to dispense important information. This template comprises four stages. It also presents valuable insights into the topics including goals diagram for sales platform. This is a completely customizable PowerPoint theme that can be put to use immediately. So, download it and address the topic impactfully.


 Continue with Email

 Home
Home


